Cities with the Most Immigrants from Liberia in Pennsylvania
RELATED REPORTS & OPTIONS
Liberia
Pennsylvania
Compare Cities
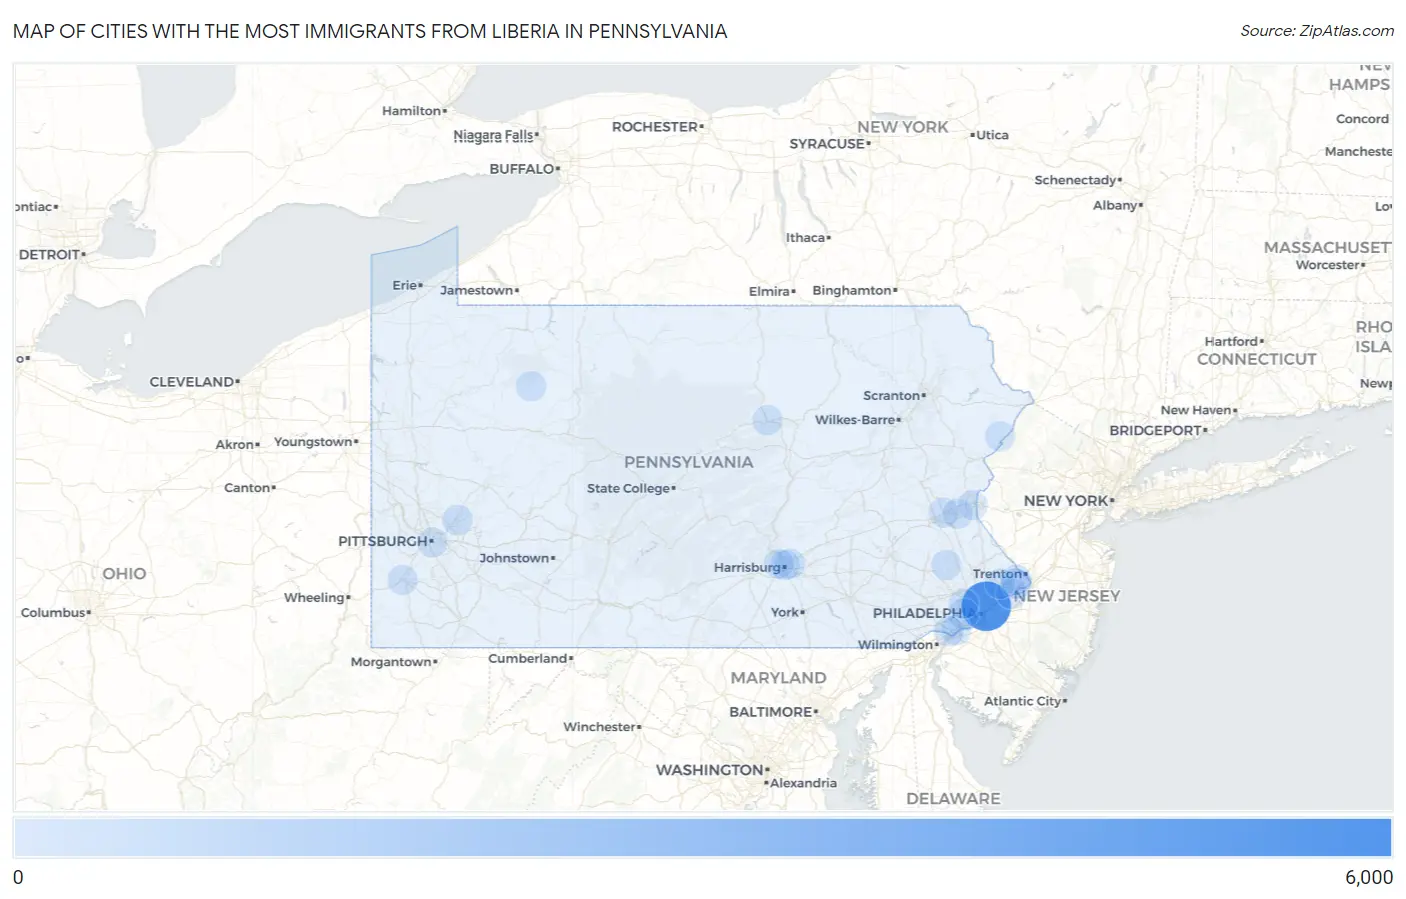
Map of Cities with the Most Immigrants from Liberia in Pennsylvania
0
6,000
Cities with the Most Immigrants from Liberia in Pennsylvania
| City | Liberia | vs State | vs National | |
| 1. | Philadelphia | 5,607 | 12,910(43.43%)#1 | 98,441(5.70%)#1 |
| 2. | Darby Borough | 862 | 12,910(6.68%)#2 | 98,441(0.88%)#15 |
| 3. | Lansdowne Borough | 453 | 12,910(3.51%)#3 | 98,441(0.46%)#33 |
| 4. | Colwyn Borough | 437 | 12,910(3.38%)#4 | 98,441(0.44%)#35 |
| 5. | Yeadon Borough | 321 | 12,910(2.49%)#5 | 98,441(0.33%)#46 |
| 6. | Sharon Hill Borough | 199 | 12,910(1.54%)#6 | 98,441(0.20%)#79 |
| 7. | Collingdale Borough | 137 | 12,910(1.06%)#7 | 98,441(0.14%)#117 |
| 8. | Drexel Hill | 120 | 12,910(0.93%)#8 | 98,441(0.12%)#135 |
| 9. | Clifton Heights Borough | 116 | 12,910(0.90%)#9 | 98,441(0.12%)#141 |
| 10. | Croydon | 96 | 12,910(0.74%)#10 | 98,441(0.10%)#167 |
| 11. | Levittown | 94 | 12,910(0.73%)#11 | 98,441(0.10%)#171 |
| 12. | Fairless Hills | 92 | 12,910(0.71%)#12 | 98,441(0.09%)#177 |
| 13. | Bristol Borough | 78 | 12,910(0.60%)#13 | 98,441(0.08%)#203 |
| 14. | South Coatesville Borough | 75 | 12,910(0.58%)#14 | 98,441(0.08%)#207 |
| 15. | Arnold | 67 | 12,910(0.52%)#15 | 98,441(0.07%)#232 |
| 16. | Prospect Park Borough | 64 | 12,910(0.50%)#16 | 98,441(0.07%)#240 |
| 17. | Chester | 60 | 12,910(0.46%)#17 | 98,441(0.06%)#252 |
| 18. | Millbourne Borough | 55 | 12,910(0.43%)#18 | 98,441(0.06%)#264 |
| 19. | Freemansburg Borough | 45 | 12,910(0.35%)#19 | 98,441(0.05%)#307 |
| 20. | Progress | 43 | 12,910(0.33%)#20 | 98,441(0.04%)#315 |
| 21. | Morton Borough | 43 | 12,910(0.33%)#21 | 98,441(0.04%)#316 |
| 22. | Trainer Borough | 40 | 12,910(0.31%)#22 | 98,441(0.04%)#336 |
| 23. | Charleroi Borough | 37 | 12,910(0.29%)#23 | 98,441(0.04%)#355 |
| 24. | Glenolden Borough | 35 | 12,910(0.27%)#24 | 98,441(0.04%)#366 |
| 25. | Boothwyn | 32 | 12,910(0.25%)#25 | 98,441(0.03%)#379 |
| 26. | Feasterville | 31 | 12,910(0.24%)#26 | 98,441(0.03%)#389 |
| 27. | Pottstown Borough | 30 | 12,910(0.23%)#27 | 98,441(0.03%)#396 |
| 28. | Baldwin Borough | 30 | 12,910(0.23%)#28 | 98,441(0.03%)#397 |
| 29. | Penndel Borough | 30 | 12,910(0.23%)#29 | 98,441(0.03%)#401 |
| 30. | Williamsport | 28 | 12,910(0.22%)#30 | 98,441(0.03%)#414 |
| 31. | Chestnut Hill | 27 | 12,910(0.21%)#31 | 98,441(0.03%)#425 |
| 32. | Akron Borough | 25 | 12,910(0.19%)#32 | 98,441(0.03%)#440 |
| 33. | Pine Ridge | 23 | 12,910(0.18%)#33 | 98,441(0.02%)#455 |
| 34. | California Borough | 21 | 12,910(0.16%)#34 | 98,441(0.02%)#474 |
| 35. | Trappe Borough | 18 | 12,910(0.14%)#35 | 98,441(0.02%)#511 |
| 36. | East Lansdowne Borough | 18 | 12,910(0.14%)#36 | 98,441(0.02%)#512 |
| 37. | Fullerton | 17 | 12,910(0.13%)#37 | 98,441(0.02%)#521 |
| 38. | Bethlehem | 16 | 12,910(0.12%)#38 | 98,441(0.02%)#530 |
| 39. | Harrisburg | 16 | 12,910(0.12%)#39 | 98,441(0.02%)#533 |
| 40. | Rochester Borough | 16 | 12,910(0.12%)#40 | 98,441(0.02%)#540 |
| 41. | Aldan Borough | 15 | 12,910(0.12%)#41 | 98,441(0.02%)#551 |
| 42. | Marienville | 15 | 12,910(0.12%)#42 | 98,441(0.02%)#553 |
| 43. | Catasauqua Borough | 14 | 12,910(0.11%)#43 | 98,441(0.01%)#568 |
| 44. | Carlisle Borough | 12 | 12,910(0.09%)#44 | 98,441(0.01%)#590 |
| 45. | Pittsburgh | 9 | 12,910(0.07%)#45 | 98,441(0.01%)#628 |
| 46. | Spring Mount | 9 | 12,910(0.07%)#46 | 98,441(0.01%)#640 |
| 47. | Washington | 8 | 12,910(0.06%)#47 | 98,441(0.01%)#650 |
| 48. | Bryn Mawr | 8 | 12,910(0.06%)#48 | 98,441(0.01%)#654 |
| 49. | Eddystone Borough | 8 | 12,910(0.06%)#49 | 98,441(0.01%)#657 |
| 50. | Braddock Hills Borough | 8 | 12,910(0.06%)#50 | 98,441(0.01%)#658 |
| 51. | Mansfield Borough | 7 | 12,910(0.05%)#51 | 98,441(0.01%)#679 |
| 52. | Matamoras Borough | 7 | 12,910(0.05%)#52 | 98,441(0.01%)#680 |
| 53. | Bradford Woods Borough | 6 | 12,910(0.05%)#53 | 98,441(0.01%)#696 |
| 54. | Enola | 5 | 12,910(0.04%)#54 | 98,441(0.01%)#706 |
| 55. | Easton | 4 | 12,910(0.03%)#55 | 98,441(0.00%)#718 |
| 56. | Swarthmore Borough | 3 | 12,910(0.02%)#56 | 98,441(0.00%)#732 |
| 57. | East Washington Borough | 2 | 12,910(0.02%)#57 | 98,441(0.00%)#750 |
Common Questions
What are the Top 10 Cities with the Most Immigrants from Liberia in Pennsylvania?
Top 10 Cities with the Most Immigrants from Liberia in Pennsylvania are:
#1
5,607
#2
120
#3
96
#4
94
#5
92
#6
67
#7
60
#8
43
#9
32
#10
31
What city has the Most Immigrants from Liberia in Pennsylvania?
Philadelphia has the Most Immigrants from Liberia in Pennsylvania with 5,607.
What is the Total Immigrants from Liberia in the State of Pennsylvania?
Total Immigrants from Liberia in Pennsylvania is 12,910.
What is the Total Immigrants from Liberia in the United States?
Total Immigrants from Liberia in the United States is 98,441.