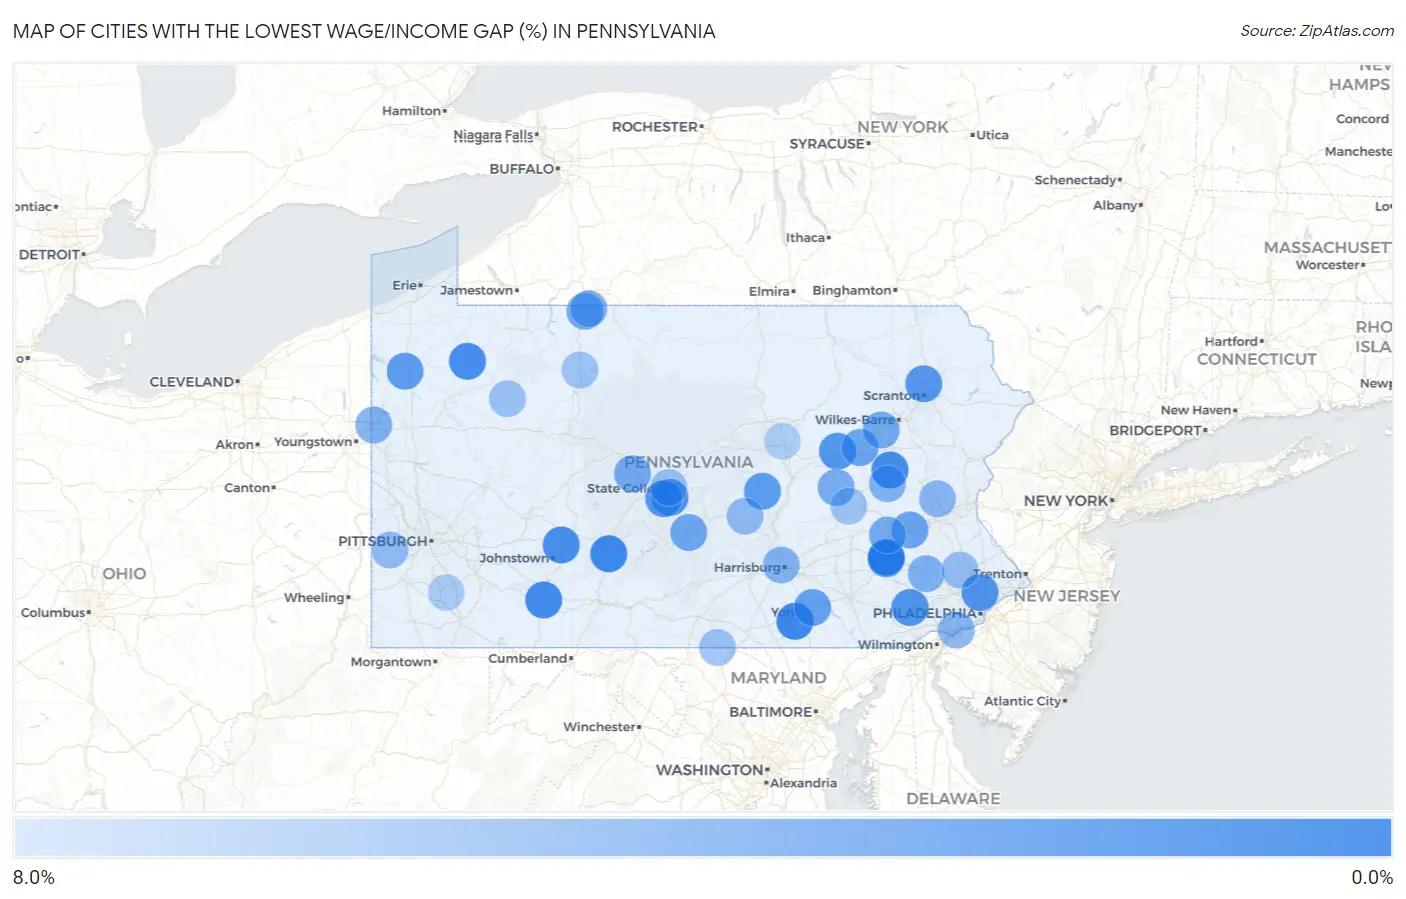
Cities with the Lowest Wage/Income Gap (%) in Pennsylvania
RELATED REPORTS & OPTIONS
Lowest Wage/Income Gap (%)
Pennsylvania
Compare Cities
Map of Cities with the Lowest Wage/Income Gap (%) in Pennsylvania
8.0%
0.0%
Cities with the Lowest Wage/Income Gap (%) in Pennsylvania
| City | Wage/Income Gap (%) | vs State | vs National | |
| 1. | Forest Hills Borough | 0.10% | 30.8%(-0.307)#1 | 28.0%(-0.279)#21 |
| 2. | Valley View Cdp York County | 0.24% | 30.8%(-0.306)#2 | 28.0%(-0.277)#47 |
| 3. | Saegertown Borough | 0.25% | 30.8%(-0.306)#3 | 28.0%(-0.277)#51 |
| 4. | New Salem | 0.29% | 30.8%(-0.305)#4 | 28.0%(-0.277)#59 |
| 5. | East Freedom | 0.48% | 30.8%(-0.303)#5 | 28.0%(-0.275)#103 |
| 6. | West Wyomissing | 0.62% | 30.8%(-0.302)#6 | 28.0%(-0.274)#147 |
| 7. | Bowmanstown Borough | 0.64% | 30.8%(-0.302)#7 | 28.0%(-0.273)#153 |
| 8. | Friedens | 0.66% | 30.8%(-0.302)#8 | 28.0%(-0.273)#161 |
| 9. | Millheim Borough | 0.71% | 30.8%(-0.301)#9 | 28.0%(-0.273)#173 |
| 10. | Tresckow | 0.72% | 30.8%(-0.301)#10 | 28.0%(-0.273)#175 |
| 11. | Waynesboro Borough | 0.77% | 30.8%(-0.300)#11 | 28.0%(-0.272)#184 |
| 12. | Braddock Borough | 0.84% | 30.8%(-0.300)#12 | 28.0%(-0.271)#207 |
| 13. | Vinco | 0.85% | 30.8%(-0.300)#13 | 28.0%(-0.271)#208 |
| 14. | Titusville | 0.94% | 30.8%(-0.299)#14 | 28.0%(-0.270)#237 |
| 15. | New Lebanon Borough | 0.96% | 30.8%(-0.299)#15 | 28.0%(-0.270)#241 |
| 16. | West Lawn | 1.1% | 30.8%(-0.297)#16 | 28.0%(-0.269)#270 |
| 17. | Pine Grove Mills | 1.2% | 30.8%(-0.296)#17 | 28.0%(-0.267)#321 |
| 18. | Ashley Borough | 1.3% | 30.8%(-0.296)#18 | 28.0%(-0.267)#324 |
| 19. | Caln | 1.3% | 30.8%(-0.295)#19 | 28.0%(-0.267)#338 |
| 20. | Arcadia University | 1.3% | 30.8%(-0.295)#20 | 28.0%(-0.266)#350 |
| 21. | Ramblewood | 1.6% | 30.8%(-0.292)#21 | 28.0%(-0.264)#398 |
| 22. | Lightstreet | 1.6% | 30.8%(-0.292)#22 | 28.0%(-0.264)#404 |
| 23. | Northern Cambria Borough | 1.6% | 30.8%(-0.292)#23 | 28.0%(-0.264)#411 |
| 24. | Chinchilla | 1.7% | 30.8%(-0.291)#24 | 28.0%(-0.263)#422 |
| 25. | Rockledge Borough | 2.0% | 30.8%(-0.288)#25 | 28.0%(-0.260)#500 |
| 26. | Youngstown Borough | 2.0% | 30.8%(-0.288)#26 | 28.0%(-0.260)#503 |
| 27. | Geneva | 2.0% | 30.8%(-0.288)#27 | 28.0%(-0.260)#504 |
| 28. | Paxtonville | 2.0% | 30.8%(-0.288)#28 | 28.0%(-0.259)#510 |
| 29. | Port Clinton Borough | 2.1% | 30.8%(-0.288)#29 | 28.0%(-0.259)#512 |
| 30. | Chicora Borough | 2.1% | 30.8%(-0.287)#30 | 28.0%(-0.259)#515 |
| 31. | Pitcairn Borough | 2.1% | 30.8%(-0.287)#31 | 28.0%(-0.259)#529 |
| 32. | Port Vue Borough | 2.2% | 30.8%(-0.286)#32 | 28.0%(-0.258)#560 |
| 33. | Marcus Hook Borough | 2.3% | 30.8%(-0.285)#33 | 28.0%(-0.257)#571 |
| 34. | South Heights Borough | 2.3% | 30.8%(-0.285)#34 | 28.0%(-0.257)#577 |
| 35. | Yorklyn | 2.4% | 30.8%(-0.284)#35 | 28.0%(-0.255)#611 |
| 36. | Skelp | 2.6% | 30.8%(-0.282)#36 | 28.0%(-0.254)#661 |
| 37. | Kutztown University | 2.6% | 30.8%(-0.282)#37 | 28.0%(-0.253)#666 |
| 38. | East Berwick | 2.8% | 30.8%(-0.280)#38 | 28.0%(-0.252)#692 |
| 39. | Mckinley | 2.8% | 30.8%(-0.280)#39 | 28.0%(-0.251)#714 |
| 40. | Mattawana | 3.0% | 30.8%(-0.278)#40 | 28.0%(-0.250)#751 |
| 41. | Dublin Borough | 3.0% | 30.8%(-0.278)#41 | 28.0%(-0.250)#759 |
| 42. | Bradford | 3.1% | 30.8%(-0.277)#42 | 28.0%(-0.249)#780 |
| 43. | Wanamie | 3.3% | 30.8%(-0.275)#43 | 28.0%(-0.247)#818 |
| 44. | South Philipsburg | 3.3% | 30.8%(-0.275)#44 | 28.0%(-0.247)#825 |
| 45. | Mohrsville | 3.3% | 30.8%(-0.275)#45 | 28.0%(-0.246)#841 |
| 46. | Hookstown Borough | 3.4% | 30.8%(-0.274)#46 | 28.0%(-0.246)#858 |
| 47. | Atlas | 3.5% | 30.8%(-0.273)#47 | 28.0%(-0.245)#869 |
| 48. | Foster Brook | 3.7% | 30.8%(-0.271)#48 | 28.0%(-0.243)#926 |
| 49. | Versailles Borough | 3.7% | 30.8%(-0.271)#49 | 28.0%(-0.243)#927 |
| 50. | Farrell | 3.8% | 30.8%(-0.270)#50 | 28.0%(-0.242)#953 |
| 51. | Kenilworth | 3.9% | 30.8%(-0.269)#51 | 28.0%(-0.240)#985 |
| 52. | Conshohocken Borough | 3.9% | 30.8%(-0.269)#52 | 28.0%(-0.240)#986 |
| 53. | North Belle Vernon Borough | 3.9% | 30.8%(-0.269)#53 | 28.0%(-0.240)#989 |
| 54. | West Kittanning Borough | 4.0% | 30.8%(-0.269)#54 | 28.0%(-0.240)#990 |
| 55. | Hometown | 4.0% | 30.8%(-0.268)#55 | 28.0%(-0.240)#994 |
| 56. | Morton Borough | 4.1% | 30.8%(-0.267)#56 | 28.0%(-0.239)#1,037 |
| 57. | West Fairview | 4.1% | 30.8%(-0.267)#57 | 28.0%(-0.239)#1,038 |
| 58. | Pennsbury Village Borough | 4.4% | 30.8%(-0.264)#58 | 28.0%(-0.236)#1,101 |
| 59. | Laurys Station | 4.4% | 30.8%(-0.264)#59 | 28.0%(-0.236)#1,104 |
| 60. | Chester | 4.4% | 30.8%(-0.264)#60 | 28.0%(-0.236)#1,106 |
| 61. | Philipsburg Borough | 4.4% | 30.8%(-0.264)#61 | 28.0%(-0.236)#1,112 |
| 62. | Norristown Borough | 4.5% | 30.8%(-0.263)#62 | 28.0%(-0.235)#1,129 |
| 63. | Cassandra Borough | 4.8% | 30.8%(-0.260)#63 | 28.0%(-0.232)#1,202 |
| 64. | Lanesboro Borough | 4.8% | 30.8%(-0.260)#64 | 28.0%(-0.232)#1,204 |
| 65. | Joffre | 4.8% | 30.8%(-0.260)#65 | 28.0%(-0.231)#1,211 |
| 66. | East Salem | 4.9% | 30.8%(-0.259)#66 | 28.0%(-0.231)#1,221 |
| 67. | Schwenksville Borough | 5.0% | 30.8%(-0.259)#67 | 28.0%(-0.230)#1,244 |
| 68. | Tatamy Borough | 5.0% | 30.8%(-0.258)#68 | 28.0%(-0.230)#1,268 |
| 69. | Pringle Borough | 5.1% | 30.8%(-0.258)#69 | 28.0%(-0.229)#1,278 |
| 70. | Kulpsville | 5.1% | 30.8%(-0.257)#70 | 28.0%(-0.229)#1,282 |
| 71. | Little Meadows Borough | 5.1% | 30.8%(-0.257)#71 | 28.0%(-0.229)#1,290 |
| 72. | Mount Joy Borough | 5.2% | 30.8%(-0.256)#72 | 28.0%(-0.228)#1,304 |
| 73. | Briar Creek Borough | 5.2% | 30.8%(-0.256)#73 | 28.0%(-0.228)#1,314 |
| 74. | Darby Borough | 5.2% | 30.8%(-0.256)#74 | 28.0%(-0.228)#1,321 |
| 75. | Zelienople Borough | 5.2% | 30.8%(-0.256)#75 | 28.0%(-0.228)#1,326 |
| 76. | Park Forest Village | 5.3% | 30.8%(-0.256)#76 | 28.0%(-0.227)#1,335 |
| 77. | Linesville Borough | 5.3% | 30.8%(-0.256)#77 | 28.0%(-0.227)#1,338 |
| 78. | Blue Ridge Summit | 5.3% | 30.8%(-0.256)#78 | 28.0%(-0.227)#1,339 |
| 79. | Whitaker Borough | 5.3% | 30.8%(-0.255)#79 | 28.0%(-0.227)#1,352 |
| 80. | Punxsutawney Borough | 5.3% | 30.8%(-0.255)#80 | 28.0%(-0.227)#1,357 |
| 81. | Carrolltown Borough | 5.4% | 30.8%(-0.254)#81 | 28.0%(-0.226)#1,372 |
| 82. | Tylersburg | 5.4% | 30.8%(-0.254)#82 | 28.0%(-0.226)#1,391 |
| 83. | Branchdale | 5.4% | 30.8%(-0.254)#83 | 28.0%(-0.225)#1,395 |
| 84. | Wilcox | 5.6% | 30.8%(-0.253)#84 | 28.0%(-0.224)#1,430 |
| 85. | Lyons Borough | 5.6% | 30.8%(-0.252)#85 | 28.0%(-0.224)#1,434 |
| 86. | California Borough | 5.6% | 30.8%(-0.252)#86 | 28.0%(-0.224)#1,447 |
| 87. | Upland Borough | 5.7% | 30.8%(-0.251)#87 | 28.0%(-0.223)#1,467 |
| 88. | Holters Crossing | 5.7% | 30.8%(-0.251)#88 | 28.0%(-0.222)#1,470 |
| 89. | Ebensburg Borough | 6.1% | 30.8%(-0.247)#89 | 28.0%(-0.219)#1,555 |
| 90. | North Catasauqua Borough | 6.1% | 30.8%(-0.247)#90 | 28.0%(-0.219)#1,561 |
| 91. | Robesonia Borough | 6.1% | 30.8%(-0.247)#91 | 28.0%(-0.218)#1,565 |
| 92. | Tionesta Borough | 6.2% | 30.8%(-0.246)#92 | 28.0%(-0.217)#1,597 |
| 93. | Swissvale Borough | 6.3% | 30.8%(-0.246)#93 | 28.0%(-0.217)#1,600 |
| 94. | Portland Borough | 6.3% | 30.8%(-0.245)#94 | 28.0%(-0.217)#1,603 |
| 95. | Allenport | 6.3% | 30.8%(-0.245)#95 | 28.0%(-0.217)#1,616 |
| 96. | Allenwood | 6.4% | 30.8%(-0.244)#96 | 28.0%(-0.216)#1,633 |
| 97. | Aldan Borough | 6.4% | 30.8%(-0.244)#97 | 28.0%(-0.216)#1,635 |
| 98. | Villanova | 6.5% | 30.8%(-0.244)#98 | 28.0%(-0.215)#1,646 |
| 99. | Freeburg Borough | 6.6% | 30.8%(-0.243)#99 | 28.0%(-0.214)#1,669 |
| 100. | Bear Creek Village Borough | 6.8% | 30.8%(-0.240)#100 | 28.0%(-0.211)#1,745 |
Common Questions
What are the Top 10 Cities with the Lowest Wage/Income Gap (%) in Pennsylvania?
Top 10 Cities with the Lowest Wage/Income Gap (%) in Pennsylvania are:
#1
0.29%
#2
0.48%
#3
0.62%
#4
0.66%
#5
0.72%
#6
0.85%
#7
0.94%
#8
1.1%
#9
1.2%
#10
1.3%
What city has the Lowest Wage/Income Gap (%) in Pennsylvania?
New Salem has the Lowest Wage/Income Gap (%) in Pennsylvania with 0.29%.
What is the Wage / Income Gap in Percentage Terms in the State of Pennsylvania?
Wage / Income Gap in Percentage Terms in Pennsylvania is 30.8%.
What is the Wage / Income Gap in Percentage Terms in the United States?
Wage / Income Gap in Percentage Terms in the United States is 28.0%.