Zip Codes with the Highest Percentage of Population Employed in Food Preparation & Serving in Hazleton, PA
RELATED REPORTS & OPTIONS
Food Preparation & Serving
Hazleton
Compare Zip Codes
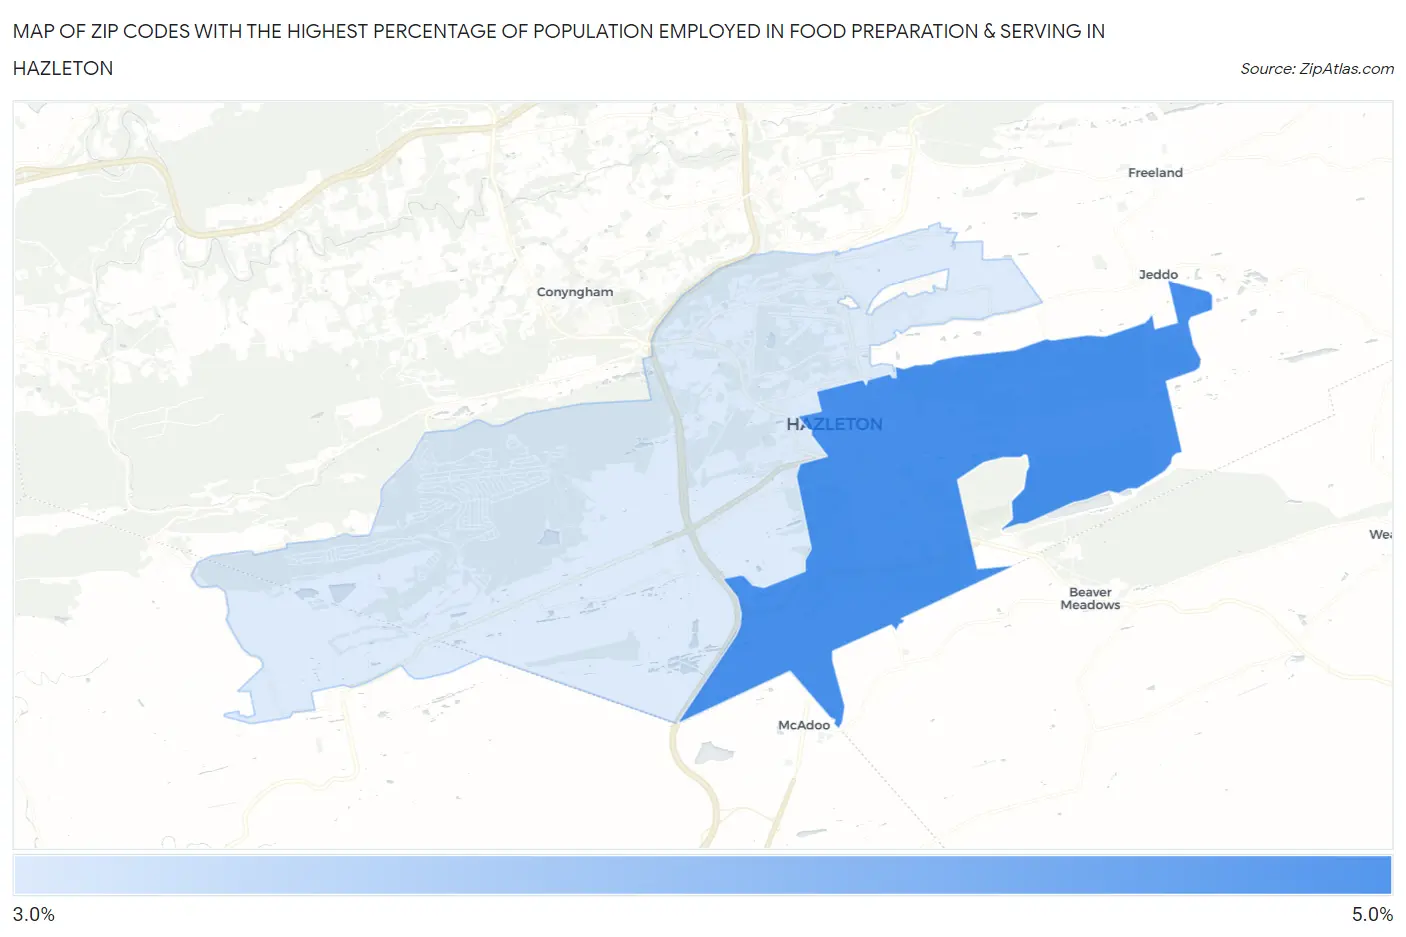
Map of Zip Codes with the Highest Percentage of Population Employed in Food Preparation & Serving in Hazleton
3.2%
4.3%
Zip Codes with the Highest Percentage of Population Employed in Food Preparation & Serving in Hazleton, PA
| Zip Code | % Employed | vs State | vs National | |
| 1. | 18201 | 4.3% | 5.0%(-0.749)#934 | 5.3%(-0.991)#15,908 |
| 2. | 18202 | 3.2% | 5.0%(-1.88)#1,186 | 5.3%(-2.13)#20,621 |
1
Common Questions
What are the Top Zip Codes with the Highest Percentage of Population Employed in Food Preparation & Serving in Hazleton, PA?
Top Zip Codes with the Highest Percentage of Population Employed in Food Preparation & Serving in Hazleton, PA are:
What zip code has the Highest Percentage of Population Employed in Food Preparation & Serving in Hazleton, PA?
18201 has the Highest Percentage of Population Employed in Food Preparation & Serving in Hazleton, PA with 4.3%.
What is the Percentage of Population Employed in Food Preparation & Serving in Hazleton, PA?
Percentage of Population Employed in Food Preparation & Serving in Hazleton is 4.4%.
What is the Percentage of Population Employed in Food Preparation & Serving in Pennsylvania?
Percentage of Population Employed in Food Preparation & Serving in Pennsylvania is 5.0%.
What is the Percentage of Population Employed in Food Preparation & Serving in the United States?
Percentage of Population Employed in Food Preparation & Serving in the United States is 5.3%.