Cities with the Highest Percentage of Immigrants from Mexico in Pennsylvania
RELATED REPORTS & OPTIONS
Mexico
Pennsylvania
Compare Cities
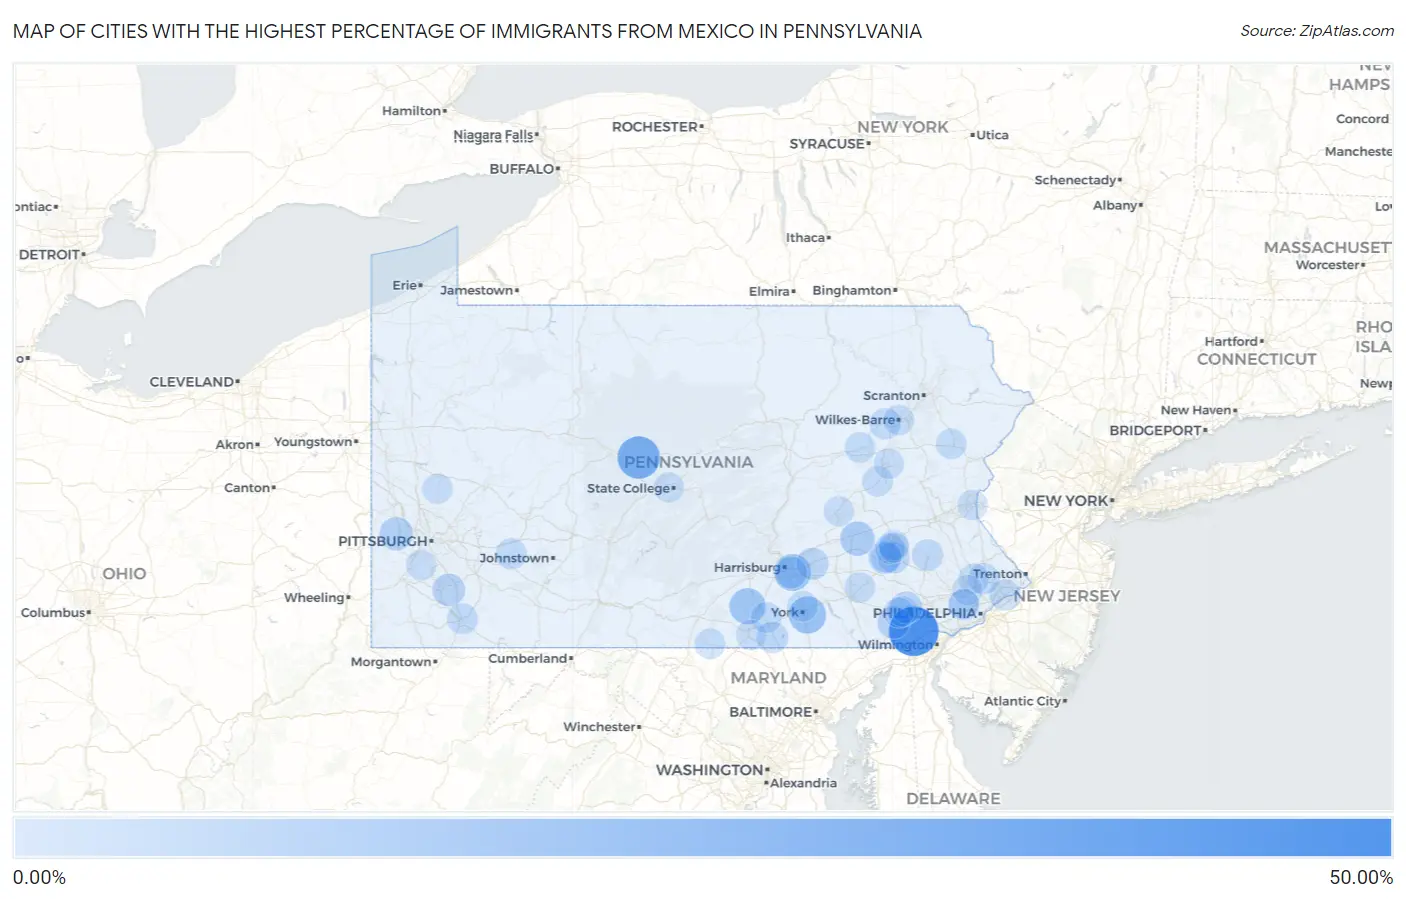
Map of Cities with the Highest Percentage of Immigrants from Mexico in Pennsylvania
0.00%
50.00%
Cities with the Highest Percentage of Immigrants from Mexico in Pennsylvania
| City | Mexico | vs State | vs National | |
| 1. | Toughkenamon | 46.11% | 0.42%(+45.7)#-1 | 3.25%(+42.9)#0 |
| 2. | Kylertown | 29.15% | 0.42%(+28.7)#0 | 3.25%(+25.9)#1 |
| 3. | Avondale Borough | 27.14% | 0.42%(+26.7)#1 | 3.25%(+23.9)#2 |
| 4. | York Springs Borough | 24.08% | 0.42%(+23.7)#2 | 3.25%(+20.8)#3 |
| 5. | Kennett Square Borough | 20.29% | 0.42%(+19.9)#3 | 3.25%(+17.0)#4 |
| 6. | Gratz Borough | 18.59% | 0.42%(+18.2)#4 | 3.25%(+15.3)#5 |
| 7. | Queens Gate | 16.84% | 0.42%(+16.4)#5 | 3.25%(+13.6)#6 |
| 8. | Bressler | 16.13% | 0.42%(+15.7)#6 | 3.25%(+12.9)#7 |
| 9. | Gardners | 14.43% | 0.42%(+14.0)#7 | 3.25%(+11.2)#8 |
| 10. | Nottingham | 12.95% | 0.42%(+12.5)#8 | 3.25%(+9.69)#9 |
| 11. | Bendersville Borough | 12.52% | 0.42%(+12.1)#9 | 3.25%(+9.27)#10 |
| 12. | Oxford Borough | 12.40% | 0.42%(+12.0)#10 | 3.25%(+9.15)#11 |
| 13. | Rehrersburg | 10.40% | 0.42%(+9.99)#11 | 3.25%(+7.15)#12 |
| 14. | West Grove Borough | 9.81% | 0.42%(+9.39)#12 | 3.25%(+6.55)#13 |
| 15. | Troy Borough | 8.67% | 0.42%(+8.25)#13 | 3.25%(+5.41)#14 |
| 16. | Clinton | 8.33% | 0.42%(+7.92)#14 | 3.25%(+5.08)#15 |
| 17. | New Oxford Borough | 7.67% | 0.42%(+7.26)#15 | 3.25%(+4.42)#16 |
| 18. | Springmont | 7.23% | 0.42%(+6.82)#16 | 3.25%(+3.98)#17 |
| 19. | Fairhope | 6.66% | 0.42%(+6.24)#17 | 3.25%(+3.40)#18 |
| 20. | Norristown Borough | 6.19% | 0.42%(+5.77)#18 | 3.25%(+2.94)#19 |
| 21. | Cochranville | 5.94% | 0.42%(+5.53)#19 | 3.25%(+2.69)#20 |
| 22. | Coatesville | 5.81% | 0.42%(+5.39)#20 | 3.25%(+2.55)#21 |
| 23. | Hershey | 5.45% | 0.42%(+5.03)#21 | 3.25%(+2.20)#22 |
| 24. | Mont Clare | 5.38% | 0.42%(+4.96)#22 | 3.25%(+2.13)#23 |
| 25. | Enhaut | 5.11% | 0.42%(+4.69)#23 | 3.25%(+1.86)#24 |
| 26. | Reading | 4.49% | 0.42%(+4.07)#24 | 3.25%(+1.23)#25 |
| 27. | Pennville | 4.12% | 0.42%(+3.70)#25 | 3.25%(+0.867)#26 |
| 28. | Quakertown Borough | 4.08% | 0.42%(+3.66)#26 | 3.25%(+0.830)#27 |
| 29. | West Homestead Borough | 4.06% | 0.42%(+3.65)#27 | 3.25%(+0.812)#28 |
| 30. | Biglerville Borough | 4.04% | 0.42%(+3.62)#28 | 3.25%(+0.788)#29 |
| 31. | Parkesburg Borough | 3.91% | 0.42%(+3.49)#29 | 3.25%(+0.657)#30 |
| 32. | New Berlinville | 3.90% | 0.42%(+3.48)#30 | 3.25%(+0.643)#31 |
| 33. | Valley View Cdp York County | 3.85% | 0.42%(+3.44)#31 | 3.25%(+0.603)#32 |
| 34. | Cornwells Heights | 3.66% | 0.42%(+3.24)#32 | 3.25%(+0.408)#33 |
| 35. | West Nanticoke | 3.41% | 0.42%(+2.99)#33 | 3.25%(+0.157)#34 |
| 36. | Delta Borough | 3.40% | 0.42%(+2.98)#34 | 3.25%(+0.148)#35 |
| 37. | Millwood | 3.36% | 0.42%(+2.94)#35 | 3.25%(+0.107)#36 |
| 38. | Hawley Borough | 3.33% | 0.42%(+2.92)#36 | 3.25%(+0.081)#37 |
| 39. | Horsham | 3.20% | 0.42%(+2.78)#37 | 3.25%(-0.051)#38 |
| 40. | Coal Center Borough | 3.12% | 0.42%(+2.71)#38 | 3.25%(-0.127)#39 |
| 41. | Oliver | 3.11% | 0.42%(+2.69)#39 | 3.25%(-0.142)#40 |
| 42. | Hampton | 2.94% | 0.42%(+2.52)#40 | 3.25%(-0.312)#41 |
| 43. | Briar Creek Borough | 2.88% | 0.42%(+2.46)#41 | 3.25%(-0.373)#42 |
| 44. | Bloomfield Borough | 2.87% | 0.42%(+2.46)#42 | 3.25%(-0.378)#43 |
| 45. | Haverford College | 2.87% | 0.42%(+2.45)#43 | 3.25%(-0.381)#44 |
| 46. | Collingdale Borough | 2.87% | 0.42%(+2.45)#44 | 3.25%(-0.387)#45 |
| 47. | Milford Borough | 2.83% | 0.42%(+2.41)#45 | 3.25%(-0.422)#46 |
| 48. | Bentleyville Borough | 2.74% | 0.42%(+2.32)#46 | 3.25%(-0.512)#47 |
| 49. | Emigsville | 2.63% | 0.42%(+2.21)#47 | 3.25%(-0.626)#48 |
| 50. | Wayne | 2.57% | 0.42%(+2.15)#48 | 3.25%(-0.684)#49 |
| 51. | Hanover Borough | 2.49% | 0.42%(+2.07)#49 | 3.25%(-0.766)#50 |
| 52. | East Berwick | 2.46% | 0.42%(+2.04)#50 | 3.25%(-0.794)#51 |
| 53. | Tamaqua Borough | 2.42% | 0.42%(+2.00)#51 | 3.25%(-0.836)#52 |
| 54. | Emerald Lakes | 2.39% | 0.42%(+1.97)#52 | 3.25%(-0.867)#53 |
| 55. | Delano | 2.34% | 0.42%(+1.92)#53 | 3.25%(-0.915)#54 |
| 56. | New Paris Borough | 2.30% | 0.42%(+1.89)#54 | 3.25%(-0.948)#55 |
| 57. | Gettysburg Borough | 2.27% | 0.42%(+1.85)#55 | 3.25%(-0.982)#56 |
| 58. | Manchester Borough | 2.25% | 0.42%(+1.83)#56 | 3.25%(-1.00)#57 |
| 59. | Bridgeport Borough | 2.24% | 0.42%(+1.82)#57 | 3.25%(-1.01)#58 |
| 60. | Arendtsville Borough | 2.24% | 0.42%(+1.82)#58 | 3.25%(-1.02)#59 |
| 61. | Brownstown | 2.21% | 0.42%(+1.79)#59 | 3.25%(-1.05)#60 |
| 62. | Eagleville Cdp Montgomery County | 2.17% | 0.42%(+1.75)#60 | 3.25%(-1.08)#61 |
| 63. | Wayne Heights | 2.10% | 0.42%(+1.68)#61 | 3.25%(-1.15)#62 |
| 64. | Wilkes Barre | 2.01% | 0.42%(+1.60)#62 | 3.25%(-1.24)#86 |
| 65. | Delaware Water Gap Borough | 1.99% | 0.42%(+1.58)#63 | 3.25%(-1.26)#87 |
| 66. | Lehighton Borough | 1.97% | 0.42%(+1.55)#64 | 3.25%(-1.28)#88 |
| 67. | Westwood | 1.92% | 0.42%(+1.51)#65 | 3.25%(-1.33)#89 |
| 68. | East Berlin Borough | 1.91% | 0.42%(+1.49)#66 | 3.25%(-1.34)#90 |
| 69. | Girardville Borough | 1.90% | 0.42%(+1.49)#67 | 3.25%(-1.35)#91 |
| 70. | Spring House | 1.88% | 0.42%(+1.46)#68 | 3.25%(-1.37)#92 |
| 71. | Hayti | 1.87% | 0.42%(+1.45)#69 | 3.25%(-1.39)#93 |
| 72. | Pomeroy | 1.78% | 0.42%(+1.37)#70 | 3.25%(-1.47)#94 |
| 73. | Hazleton | 1.78% | 0.42%(+1.37)#71 | 3.25%(-1.47)#95 |
| 74. | Laureldale Borough | 1.75% | 0.42%(+1.33)#72 | 3.25%(-1.51)#96 |
| 75. | Lake Heritage | 1.72% | 0.42%(+1.30)#73 | 3.25%(-1.53)#97 |
| 76. | Mcmurray | 1.71% | 0.42%(+1.29)#74 | 3.25%(-1.54)#98 |
| 77. | Atglen Borough | 1.70% | 0.42%(+1.29)#75 | 3.25%(-1.55)#99 |
| 78. | Newville Borough | 1.69% | 0.42%(+1.28)#76 | 3.25%(-1.56)#100 |
| 79. | Nixon | 1.69% | 0.42%(+1.27)#77 | 3.25%(-1.57)#101 |
| 80. | Chicora Borough | 1.65% | 0.42%(+1.24)#78 | 3.25%(-1.60)#102 |
| 81. | Chambersburg Borough | 1.60% | 0.42%(+1.18)#79 | 3.25%(-1.65)#103 |
| 82. | Mount Holly Springs Borough | 1.59% | 0.42%(+1.17)#80 | 3.25%(-1.66)#104 |
| 83. | Shenandoah Borough | 1.59% | 0.42%(+1.17)#81 | 3.25%(-1.67)#105 |
| 84. | Park Forest Village | 1.58% | 0.42%(+1.17)#82 | 3.25%(-1.67)#106 |
| 85. | Girard Borough | 1.57% | 0.42%(+1.15)#83 | 3.25%(-1.68)#107 |
| 86. | Gilberton Borough | 1.57% | 0.42%(+1.15)#84 | 3.25%(-1.69)#108 |
| 87. | Mohnton Borough | 1.54% | 0.42%(+1.12)#85 | 3.25%(-1.71)#109 |
| 88. | South Renovo Borough | 1.50% | 0.42%(+1.08)#86 | 3.25%(-1.75)#110 |
| 89. | Bowmanstown Borough | 1.49% | 0.42%(+1.07)#87 | 3.25%(-1.76)#111 |
| 90. | Donaldson | 1.42% | 0.42%(+1.00)#88 | 3.25%(-1.83)#112 |
| 91. | West Hazleton Borough | 1.38% | 0.42%(+0.967)#89 | 3.25%(-1.87)#113 |
| 92. | Temple | 1.38% | 0.42%(+0.960)#90 | 3.25%(-1.87)#114 |
| 93. | West Lawn | 1.35% | 0.42%(+0.933)#91 | 3.25%(-1.90)#115 |
| 94. | Plymouth Meeting | 1.33% | 0.42%(+0.915)#92 | 3.25%(-1.92)#116 |
| 95. | Easton | 1.33% | 0.42%(+0.909)#93 | 3.25%(-1.93)#117 |
| 96. | Pottstown Borough | 1.32% | 0.42%(+0.906)#94 | 3.25%(-1.93)#118 |
| 97. | Riverview Park | 1.31% | 0.42%(+0.889)#95 | 3.25%(-1.95)#119 |
| 98. | Bryn Mawr | 1.29% | 0.42%(+0.872)#96 | 3.25%(-1.96)#120 |
| 99. | South Temple | 1.28% | 0.42%(+0.863)#97 | 3.25%(-1.97)#121 |
| 100. | Dublin Borough | 1.27% | 0.42%(+0.852)#98 | 3.25%(-1.98)#122 |
Common Questions
What are the Top 10 Cities with the Highest Percentage of Immigrants from Mexico in Pennsylvania?
Top 10 Cities with the Highest Percentage of Immigrants from Mexico in Pennsylvania are:
#1
46.11%
#2
29.15%
#3
16.84%
#4
16.13%
#5
14.43%
#6
10.40%
#7
8.33%
#8
7.23%
#9
6.66%
#10
5.94%
What city has the Highest Percentage of Immigrants from Mexico in Pennsylvania?
Toughkenamon has the Highest Percentage of Immigrants from Mexico in Pennsylvania with 46.11%.
What is the Percentage of Immigrants from Mexico in the State of Pennsylvania?
Percentage of Immigrants from Mexico in Pennsylvania is 0.42%.
What is the Percentage of Immigrants from Mexico in the United States?
Percentage of Immigrants from Mexico in the United States is 3.25%.