Zip Codes with the Highest Percentage of Population Employed in Food Preparation & Serving in Pottstown, PA
RELATED REPORTS & OPTIONS
Food Preparation & Serving
Pottstown
Compare Zip Codes
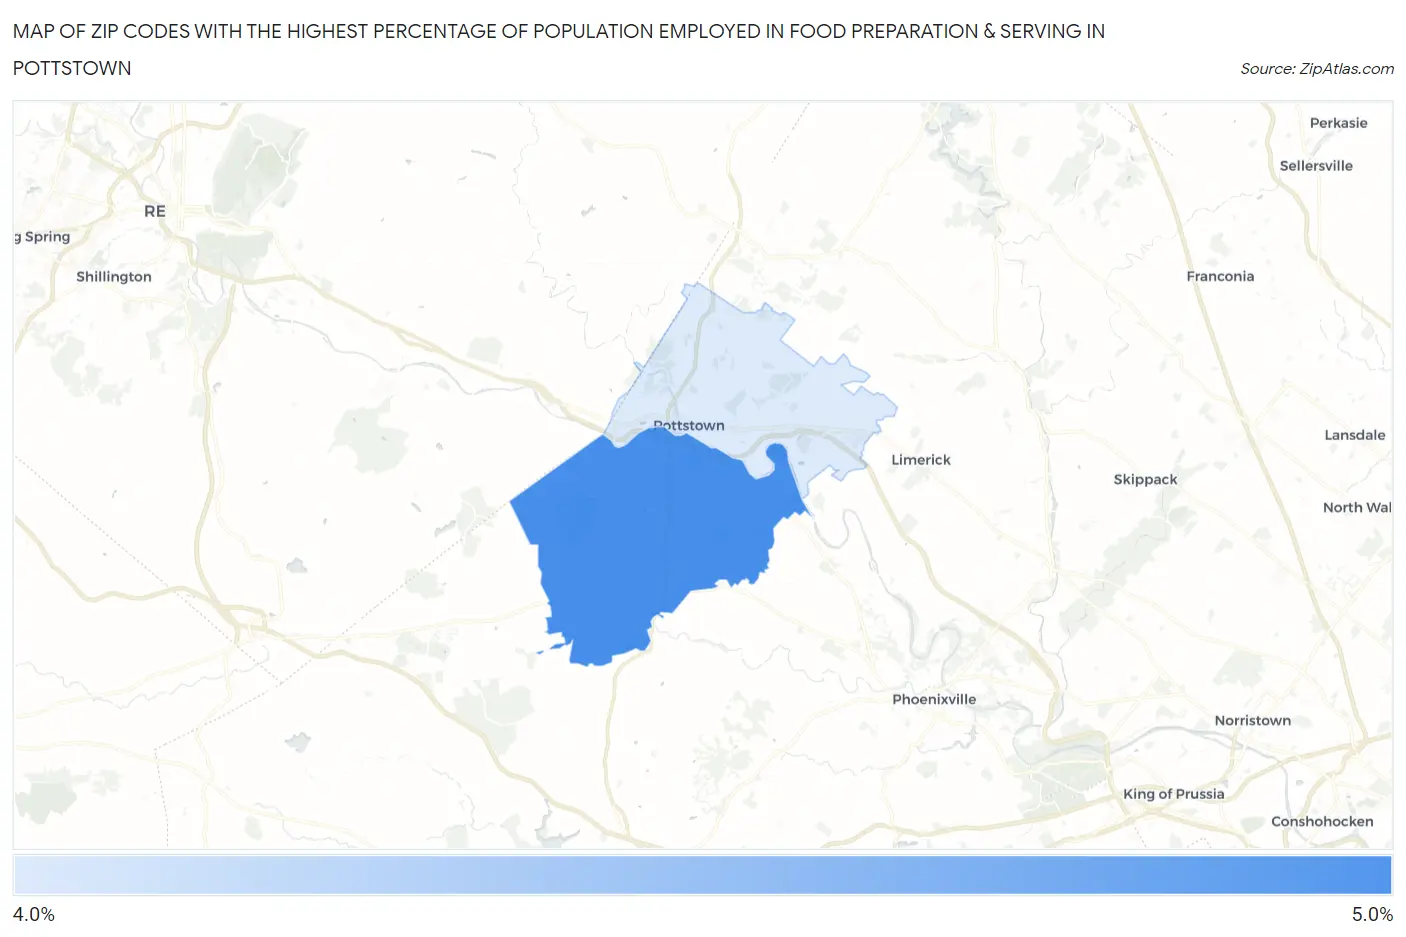
Map of Zip Codes with the Highest Percentage of Population Employed in Food Preparation & Serving in Pottstown
4.4%
4.6%
Zip Codes with the Highest Percentage of Population Employed in Food Preparation & Serving in Pottstown, PA
| Zip Code | % Employed | vs State | vs National | |
| 1. | 19465 | 4.6% | 5.0%(-0.471)#860 | 5.3%(-0.714)#14,735 |
| 2. | 19464 | 4.4% | 5.0%(-0.684)#918 | 5.3%(-0.927)#15,603 |
1
Common Questions
What are the Top Zip Codes with the Highest Percentage of Population Employed in Food Preparation & Serving in Pottstown, PA?
Top Zip Codes with the Highest Percentage of Population Employed in Food Preparation & Serving in Pottstown, PA are:
What zip code has the Highest Percentage of Population Employed in Food Preparation & Serving in Pottstown, PA?
19465 has the Highest Percentage of Population Employed in Food Preparation & Serving in Pottstown, PA with 4.6%.
What is the Percentage of Population Employed in Food Preparation & Serving in Pennsylvania?
Percentage of Population Employed in Food Preparation & Serving in Pennsylvania is 5.0%.
What is the Percentage of Population Employed in Food Preparation & Serving in the United States?
Percentage of Population Employed in Food Preparation & Serving in the United States is 5.3%.