Millwood, PA Map & Demographics
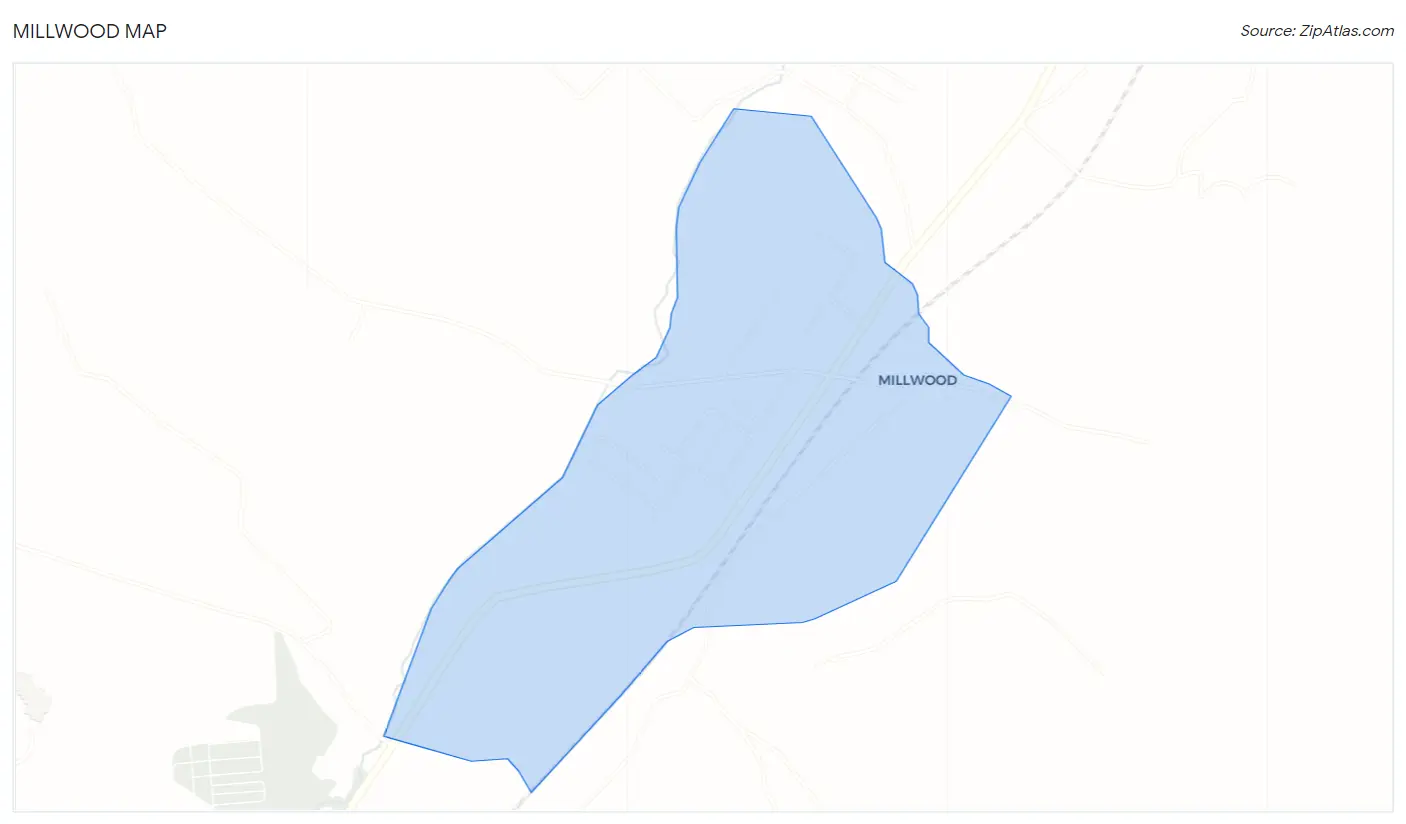
Millwood Map
Millwood Overview
$31,432
PER CAPITA INCOME
$43,750
AVG FAMILY INCOME
$57,656
AVG HOUSEHOLD INCOME
40.8%
WAGE / INCOME GAP [ % ]
59.2¢/ $1
WAGE / INCOME GAP [ $ ]
0.42
INEQUALITY / GINI INDEX
387
TOTAL POPULATION
190
MALE POPULATION
197
FEMALE POPULATION
96.45
MALES / 100 FEMALES
103.68
FEMALES / 100 MALES
48.4
MEDIAN AGE
2.5
AVG FAMILY SIZE
2.4
AVG HOUSEHOLD SIZE
186
LABOR FORCE [ PEOPLE ]
56.9%
PERCENT IN LABOR FORCE
12.4%
UNEMPLOYMENT RATE
Income in Millwood
Income Overview in Millwood
Per Capita Income in Millwood is $31,432, while median incomes of families and households are $43,750 and $57,656 respectively.
| Characteristic | Number | Measure |
| Per Capita Income | 387 | $31,432 |
| Median Family Income | 128 | $43,750 |
| Mean Family Income | 128 | $73,902 |
| Median Household Income | 163 | $57,656 |
| Mean Household Income | 163 | $72,751 |
| Income Deficit | 128 | $0 |
| Wage / Income Gap (%) | 387 | 40.83% |
| Wage / Income Gap ($) | 387 | 59.17¢ per $1 |
| Gini / Inequality Index | 387 | 0.42 |
Earnings by Sex in Millwood
Average Earnings in Millwood are $36,354, $51,302 for men and $30,357 for women, a difference of 40.8%.
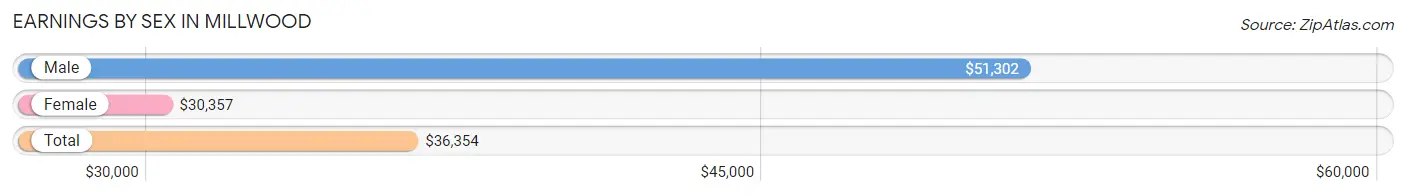
| Sex | Number | Average Earnings |
| Male | 79 (48.5%) | $51,302 |
| Female | 84 (51.5%) | $30,357 |
| Total | 163 (100.0%) | $36,354 |
Earnings by Sex by Income Bracket in Millwood
The most common earnings brackets in Millwood are $50,000 to $54,999 for men (24 | 30.4%) and $5,000 to $7,499 for women (18 | 21.4%).
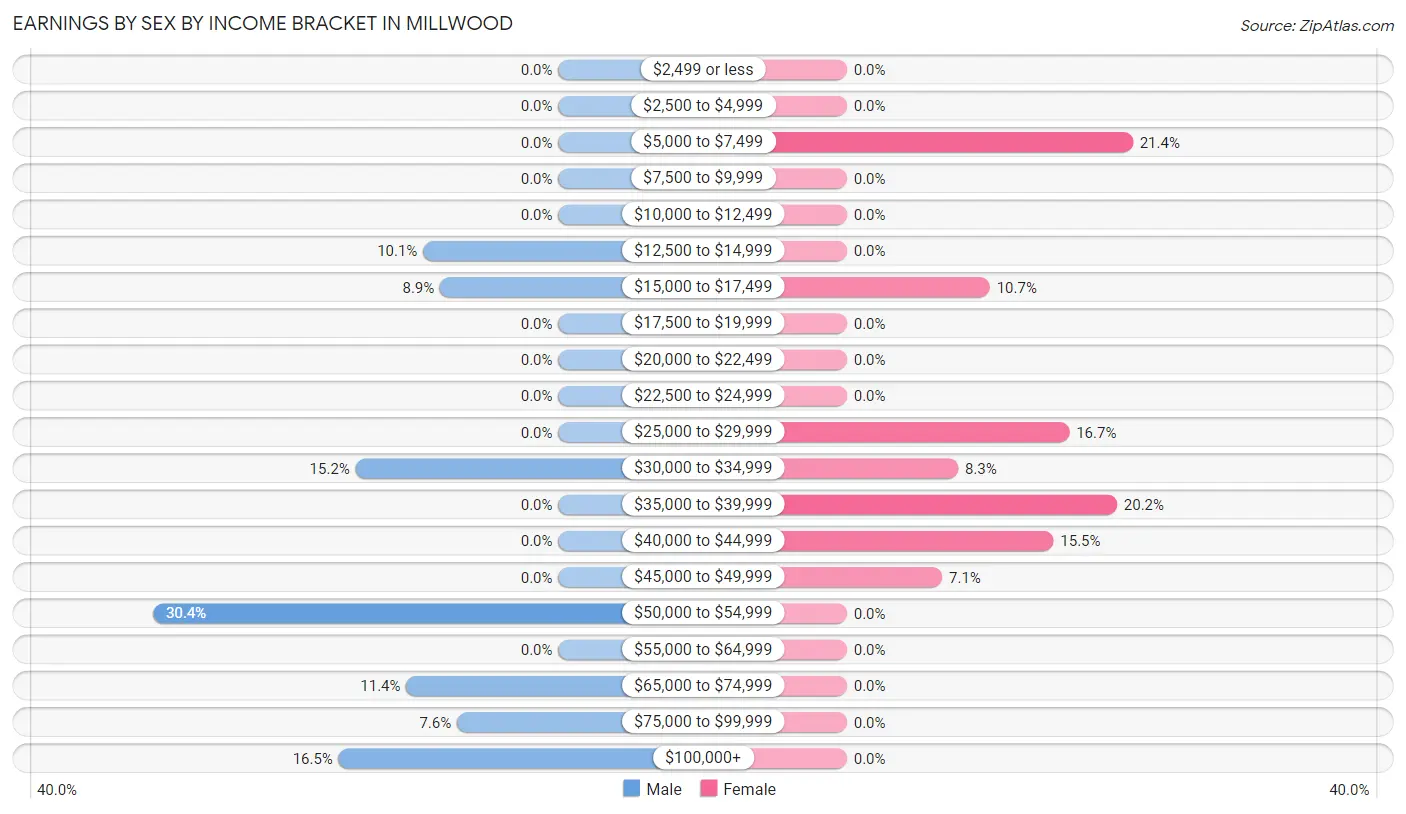
| Income | Male | Female |
| $2,499 or less | 0 (0.0%) | 0 (0.0%) |
| $2,500 to $4,999 | 0 (0.0%) | 0 (0.0%) |
| $5,000 to $7,499 | 0 (0.0%) | 18 (21.4%) |
| $7,500 to $9,999 | 0 (0.0%) | 0 (0.0%) |
| $10,000 to $12,499 | 0 (0.0%) | 0 (0.0%) |
| $12,500 to $14,999 | 8 (10.1%) | 0 (0.0%) |
| $15,000 to $17,499 | 7 (8.9%) | 9 (10.7%) |
| $17,500 to $19,999 | 0 (0.0%) | 0 (0.0%) |
| $20,000 to $22,499 | 0 (0.0%) | 0 (0.0%) |
| $22,500 to $24,999 | 0 (0.0%) | 0 (0.0%) |
| $25,000 to $29,999 | 0 (0.0%) | 14 (16.7%) |
| $30,000 to $34,999 | 12 (15.2%) | 7 (8.3%) |
| $35,000 to $39,999 | 0 (0.0%) | 17 (20.2%) |
| $40,000 to $44,999 | 0 (0.0%) | 13 (15.5%) |
| $45,000 to $49,999 | 0 (0.0%) | 6 (7.1%) |
| $50,000 to $54,999 | 24 (30.4%) | 0 (0.0%) |
| $55,000 to $64,999 | 0 (0.0%) | 0 (0.0%) |
| $65,000 to $74,999 | 9 (11.4%) | 0 (0.0%) |
| $75,000 to $99,999 | 6 (7.6%) | 0 (0.0%) |
| $100,000+ | 13 (16.5%) | 0 (0.0%) |
| Total | 79 (100.0%) | 84 (100.0%) |
Earnings by Sex by Educational Attainment in Millwood
Average earnings in Millwood are $51,302 for men and $31,607 for women, a difference of 38.4%. Men with an educational attainment of high school diploma enjoy the highest average annual earnings of $50,563, while those with high school diploma education earn the least with $50,563. Women with an educational attainment of high school diploma earn the most with the average annual earnings of $25,714, while those with high school diploma education have the smallest earnings of $25,714.
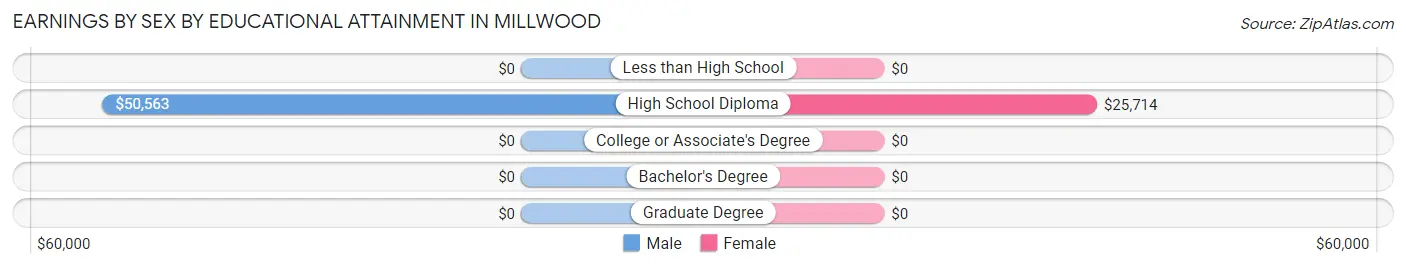
| Educational Attainment | Male Income | Female Income |
| Less than High School | - | - |
| High School Diploma | $50,563 | $25,714 |
| College or Associate's Degree | - | - |
| Bachelor's Degree | - | - |
| Graduate Degree | - | - |
| Total | $51,302 | $31,607 |
Family Income in Millwood
Family Income Brackets in Millwood
According to the Millwood family income data, there are 45 families falling into the $35,000 to $49,999 income range, which is the most common income bracket and makes up 35.2% of all families.
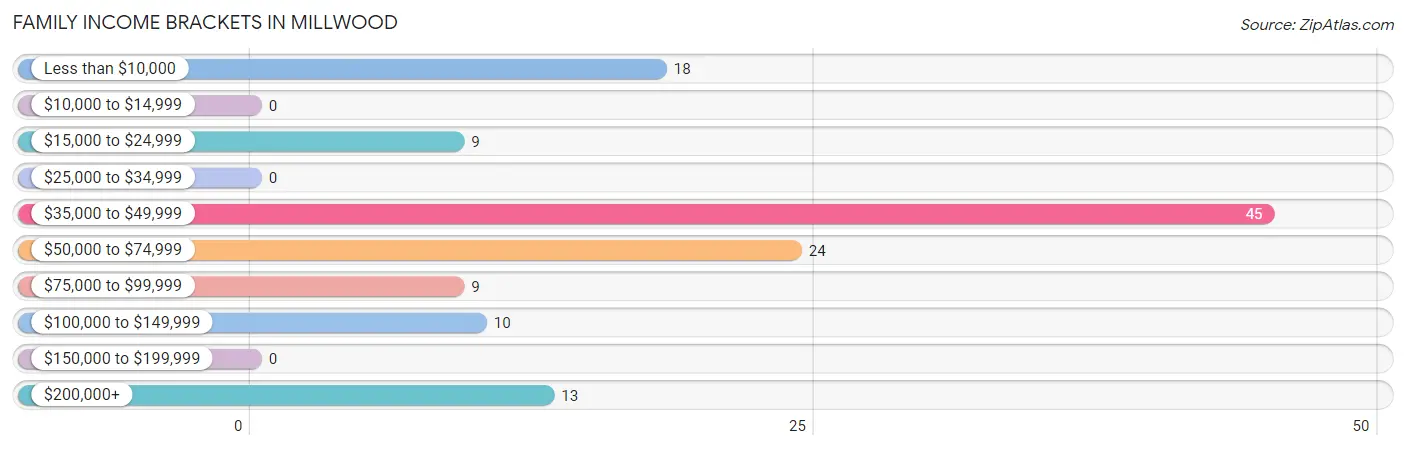
| Income Bracket | # Families | % Families |
| Less than $10,000 | 18 | 14.1% |
| $10,000 to $14,999 | 0 | 0.0% |
| $15,000 to $24,999 | 9 | 7.0% |
| $25,000 to $34,999 | 0 | 0.0% |
| $35,000 to $49,999 | 45 | 35.2% |
| $50,000 to $74,999 | 24 | 18.8% |
| $75,000 to $99,999 | 9 | 7.0% |
| $100,000 to $149,999 | 10 | 7.8% |
| $150,000 to $199,999 | 0 | 0.0% |
| $200,000+ | 13 | 10.2% |
Family Income by Famaliy Size in Millwood
2-person families (91 | 71.1%) account for the highest median family income in Millwood with $36,850 per family, while 2-person families (91 | 71.1%) have the highest median income of $18,425 per family member.
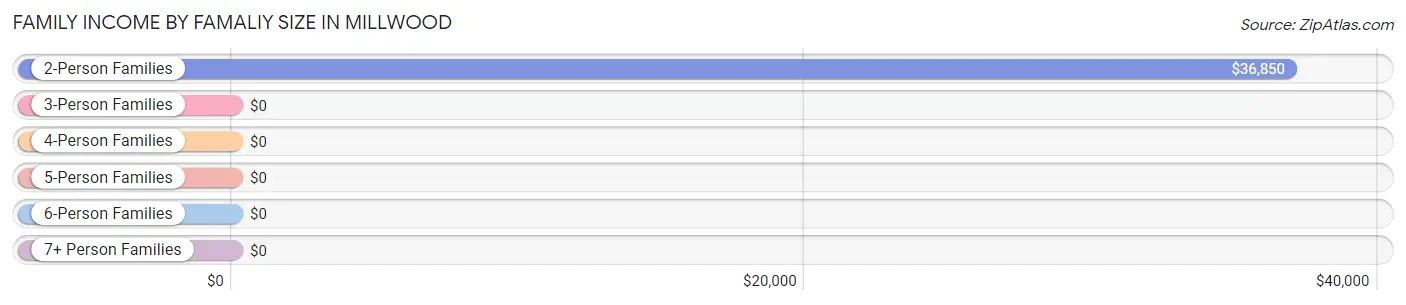
| Income Bracket | # Families | Median Income |
| 2-Person Families | 91 (71.1%) | $36,850 |
| 3-Person Families | 25 (19.5%) | $0 |
| 4-Person Families | 12 (9.4%) | $0 |
| 5-Person Families | 0 (0.0%) | $0 |
| 6-Person Families | 0 (0.0%) | $0 |
| 7+ Person Families | 0 (0.0%) | $0 |
| Total | 128 (100.0%) | $43,750 |
Family Income by Number of Earners in Millwood
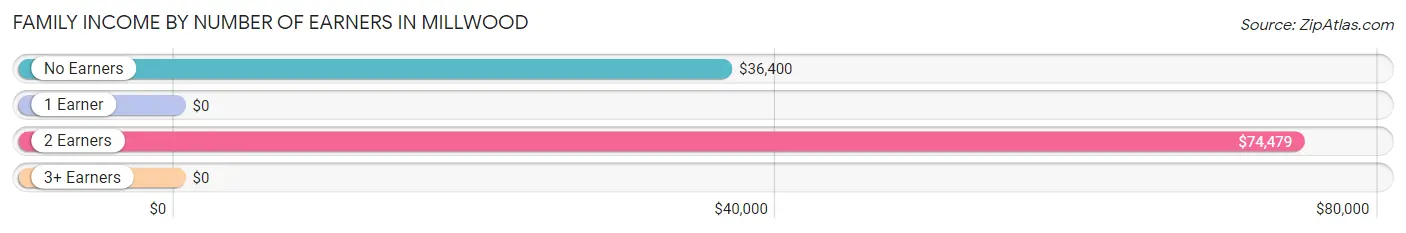
| Number of Earners | # Families | Median Income |
| No Earners | 46 (35.9%) | $36,400 |
| 1 Earner | 43 (33.6%) | $0 |
| 2 Earners | 35 (27.3%) | $74,479 |
| 3+ Earners | 4 (3.1%) | $0 |
| Total | 128 (100.0%) | $43,750 |
Household Income in Millwood
Household Income Brackets in Millwood
With 50 households falling in the category, the $50,000 to $74,999 income range is the most frequent in Millwood, accounting for 30.7% of all households.
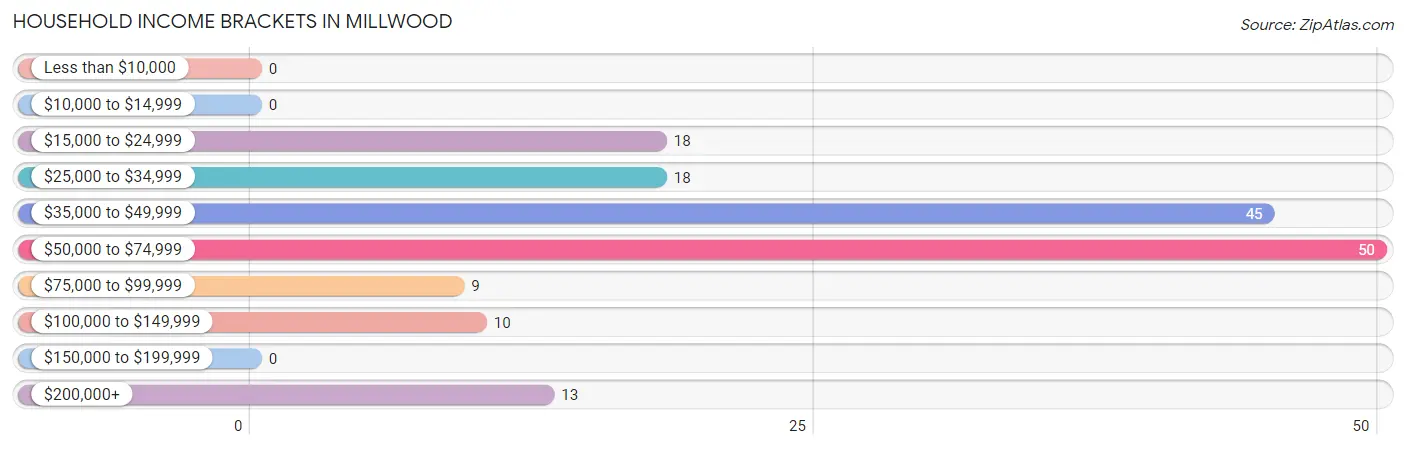
| Income Bracket | # Households | % Households |
| Less than $10,000 | 0 | 0.0% |
| $10,000 to $14,999 | 0 | 0.0% |
| $15,000 to $24,999 | 18 | 11.0% |
| $25,000 to $34,999 | 18 | 11.0% |
| $35,000 to $49,999 | 45 | 27.6% |
| $50,000 to $74,999 | 50 | 30.7% |
| $75,000 to $99,999 | 9 | 5.5% |
| $100,000 to $149,999 | 10 | 6.1% |
| $150,000 to $199,999 | 0 | 0.0% |
| $200,000+ | 13 | 8.0% |
Household Income by Householder Age in Millwood
The median household income in Millwood is $57,656, with the highest median household income of $69,792 found in the 25 to 44 years age bracket for the primary householder. A total of 33 households (20.3%) fall into this category.
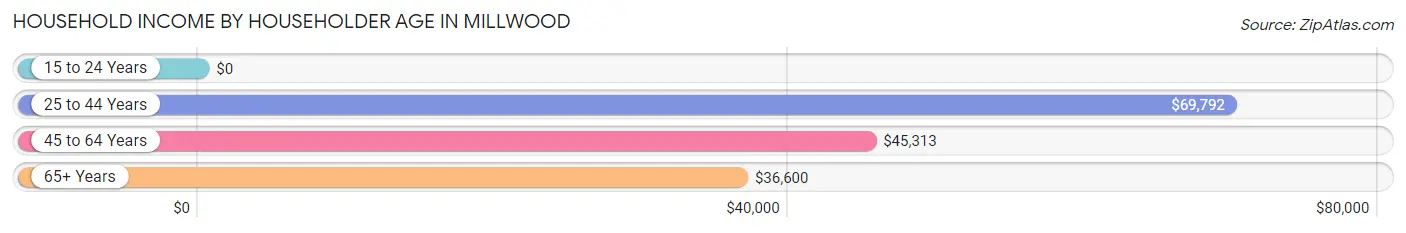
| Income Bracket | # Households | Median Income |
| 15 to 24 Years | 0 (0.0%) | $0 |
| 25 to 44 Years | 33 (20.3%) | $69,792 |
| 45 to 64 Years | 62 (38.0%) | $45,313 |
| 65+ Years | 68 (41.7%) | $36,600 |
| Total | 163 (100.0%) | $57,656 |
Poverty in Millwood
Income Below Poverty by Sex and Age in Millwood
With 13.7% poverty level for males and 19.8% for females among the residents of Millwood, 5 year old males and 25 to 34 year old females are the most vulnerable to poverty, with 18 males (100.0%) and 18 females (66.7%) in their respective age groups living below the poverty level.
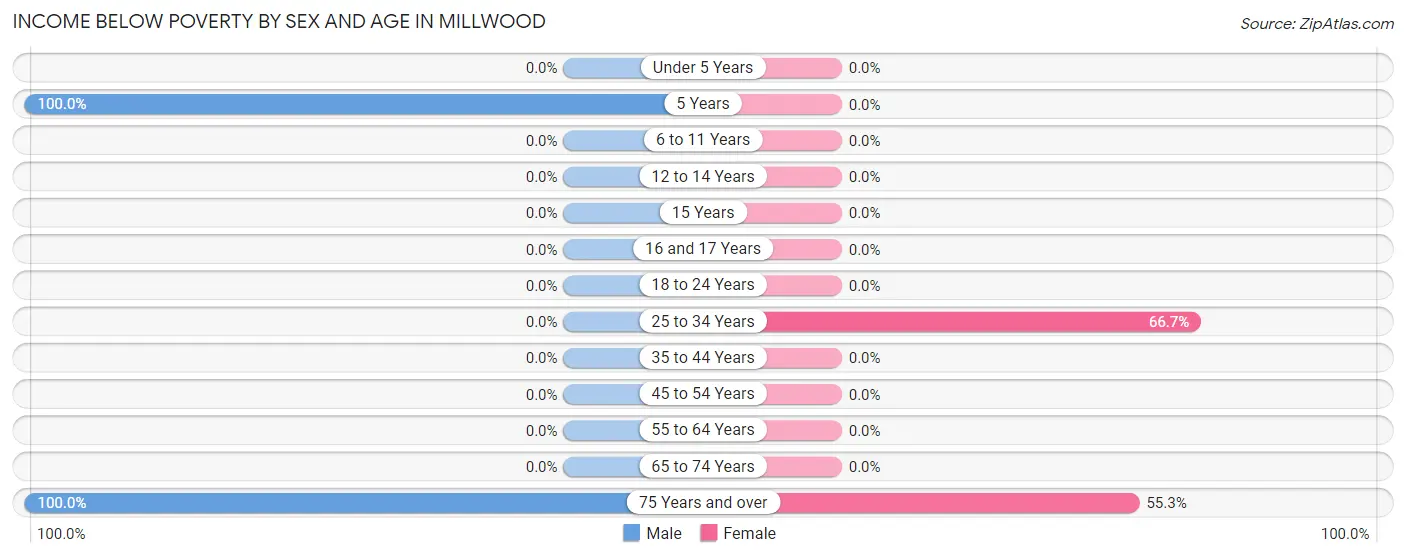
| Age Bracket | Male | Female |
| Under 5 Years | 0 (0.0%) | 0 (0.0%) |
| 5 Years | 18 (100.0%) | 0 (0.0%) |
| 6 to 11 Years | 0 (0.0%) | 0 (0.0%) |
| 12 to 14 Years | 0 (0.0%) | 0 (0.0%) |
| 15 Years | 0 (0.0%) | 0 (0.0%) |
| 16 and 17 Years | 0 (0.0%) | 0 (0.0%) |
| 18 to 24 Years | 0 (0.0%) | 0 (0.0%) |
| 25 to 34 Years | 0 (0.0%) | 18 (66.7%) |
| 35 to 44 Years | 0 (0.0%) | 0 (0.0%) |
| 45 to 54 Years | 0 (0.0%) | 0 (0.0%) |
| 55 to 64 Years | 0 (0.0%) | 0 (0.0%) |
| 65 to 74 Years | 0 (0.0%) | 0 (0.0%) |
| 75 Years and over | 8 (100.0%) | 21 (55.3%) |
| Total | 26 (13.7%) | 39 (19.8%) |
Income Above Poverty by Sex and Age in Millwood
According to the poverty statistics in Millwood, males aged under 5 years and females aged 12 to 14 years are the age groups that are most secure financially, with 100.0% of males and 100.0% of females in these age groups living above the poverty line.
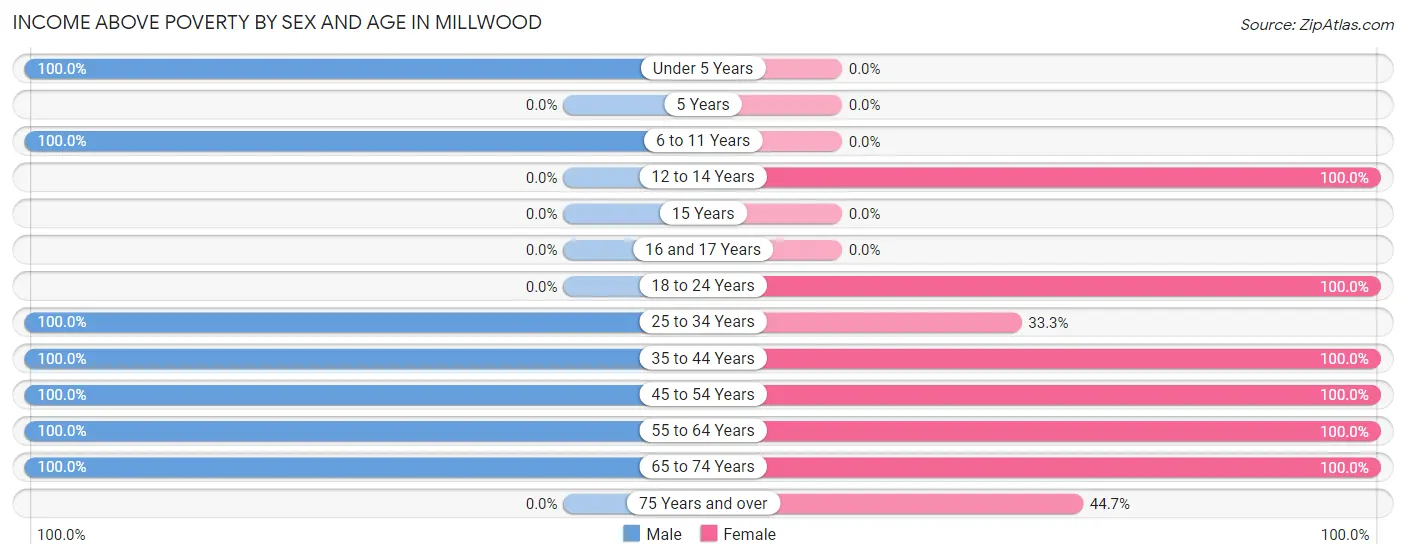
| Age Bracket | Male | Female |
| Under 5 Years | 8 (100.0%) | 0 (0.0%) |
| 5 Years | 0 (0.0%) | 0 (0.0%) |
| 6 to 11 Years | 8 (100.0%) | 0 (0.0%) |
| 12 to 14 Years | 0 (0.0%) | 26 (100.0%) |
| 15 Years | 0 (0.0%) | 0 (0.0%) |
| 16 and 17 Years | 0 (0.0%) | 0 (0.0%) |
| 18 to 24 Years | 0 (0.0%) | 7 (100.0%) |
| 25 to 34 Years | 59 (100.0%) | 9 (33.3%) |
| 35 to 44 Years | 6 (100.0%) | 19 (100.0%) |
| 45 to 54 Years | 20 (100.0%) | 26 (100.0%) |
| 55 to 64 Years | 35 (100.0%) | 16 (100.0%) |
| 65 to 74 Years | 28 (100.0%) | 38 (100.0%) |
| 75 Years and over | 0 (0.0%) | 17 (44.7%) |
| Total | 164 (86.3%) | 158 (80.2%) |
Income Below Poverty Among Married-Couple Families in Millwood
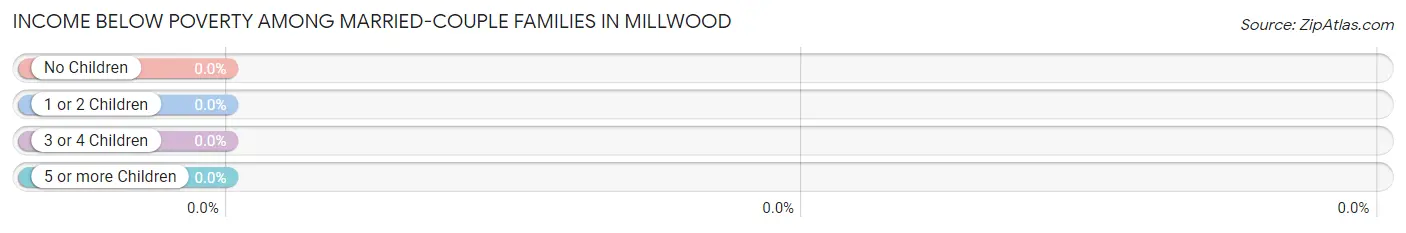
| Children | Above Poverty | Below Poverty |
| No Children | 54 (100.0%) | 0 (0.0%) |
| 1 or 2 Children | 33 (100.0%) | 0 (0.0%) |
| 3 or 4 Children | 0 (0.0%) | 0 (0.0%) |
| 5 or more Children | 0 (0.0%) | 0 (0.0%) |
| Total | 87 (100.0%) | 0 (0.0%) |
Income Below Poverty Among Single-Parent Households in Millwood
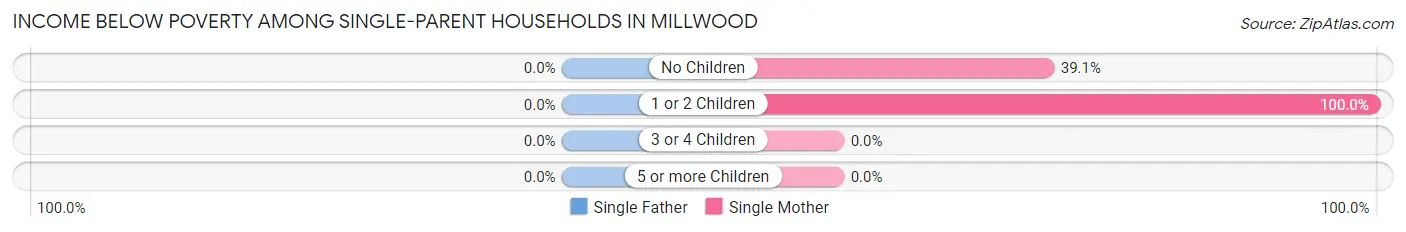
| Children | Single Father | Single Mother |
| No Children | 0 (0.0%) | 9 (39.1%) |
| 1 or 2 Children | 0 (0.0%) | 18 (100.0%) |
| 3 or 4 Children | 0 (0.0%) | 0 (0.0%) |
| 5 or more Children | 0 (0.0%) | 0 (0.0%) |
| Total | 0 (0.0%) | 27 (65.8%) |
Income Below Poverty Among Married-Couple vs Single-Parent Households in Millwood
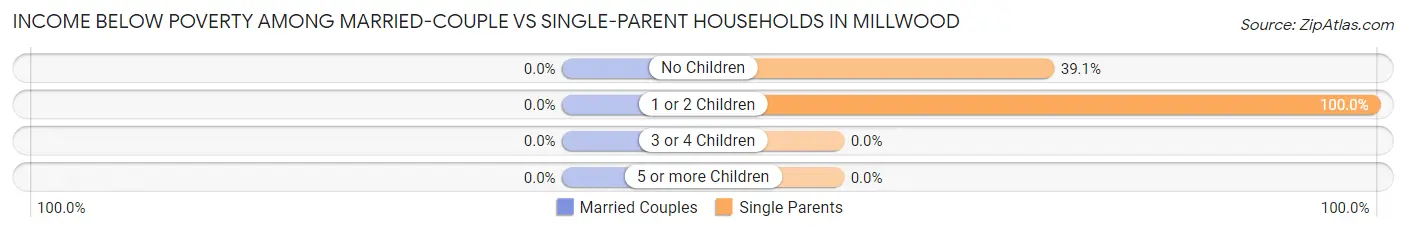
| Children | Married-Couple Families | Single-Parent Households |
| No Children | 0 (0.0%) | 9 (39.1%) |
| 1 or 2 Children | 0 (0.0%) | 18 (100.0%) |
| 3 or 4 Children | 0 (0.0%) | 0 (0.0%) |
| 5 or more Children | 0 (0.0%) | 0 (0.0%) |
| Total | 0 (0.0%) | 27 (65.8%) |
Race in Millwood
The most populous races in Millwood are White / Caucasian (354 | 91.5%), Hispanic or Latino (53 | 13.7%), and Two or more Races (13 | 3.4%).
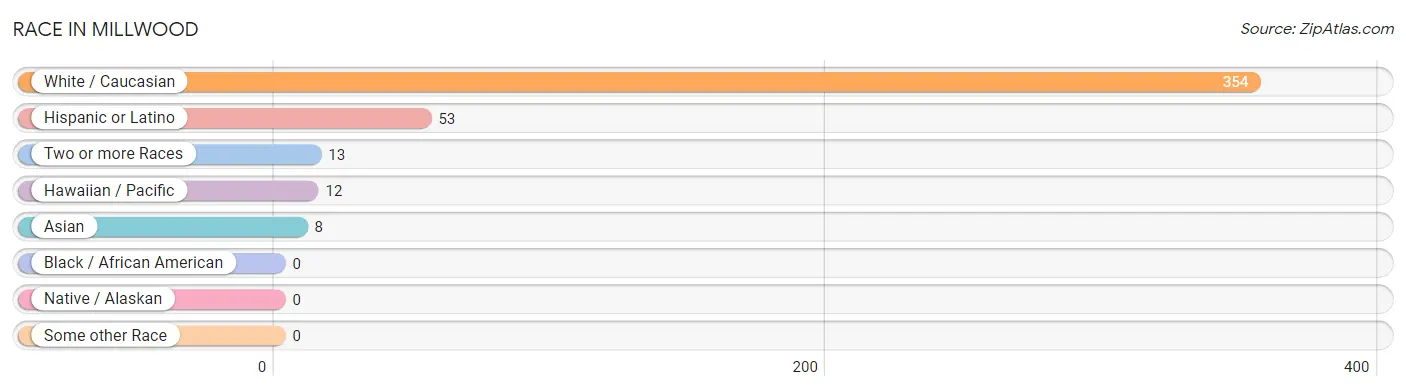
| Race | # Population | % Population |
| Asian | 8 | 2.1% |
| Black / African American | 0 | 0.0% |
| Hawaiian / Pacific | 12 | 3.1% |
| Hispanic or Latino | 53 | 13.7% |
| Native / Alaskan | 0 | 0.0% |
| White / Caucasian | 354 | 91.5% |
| Two or more Races | 13 | 3.4% |
| Some other Race | 0 | 0.0% |
| Total | 387 | 100.0% |
Ancestry in Millwood
The most populous ancestries reported in Millwood are Irish (99 | 25.6%), Polish (80 | 20.7%), Italian (59 | 15.2%), German (55 | 14.2%), and Dutch (37 | 9.6%), together accounting for 85.3% of all Millwood residents.
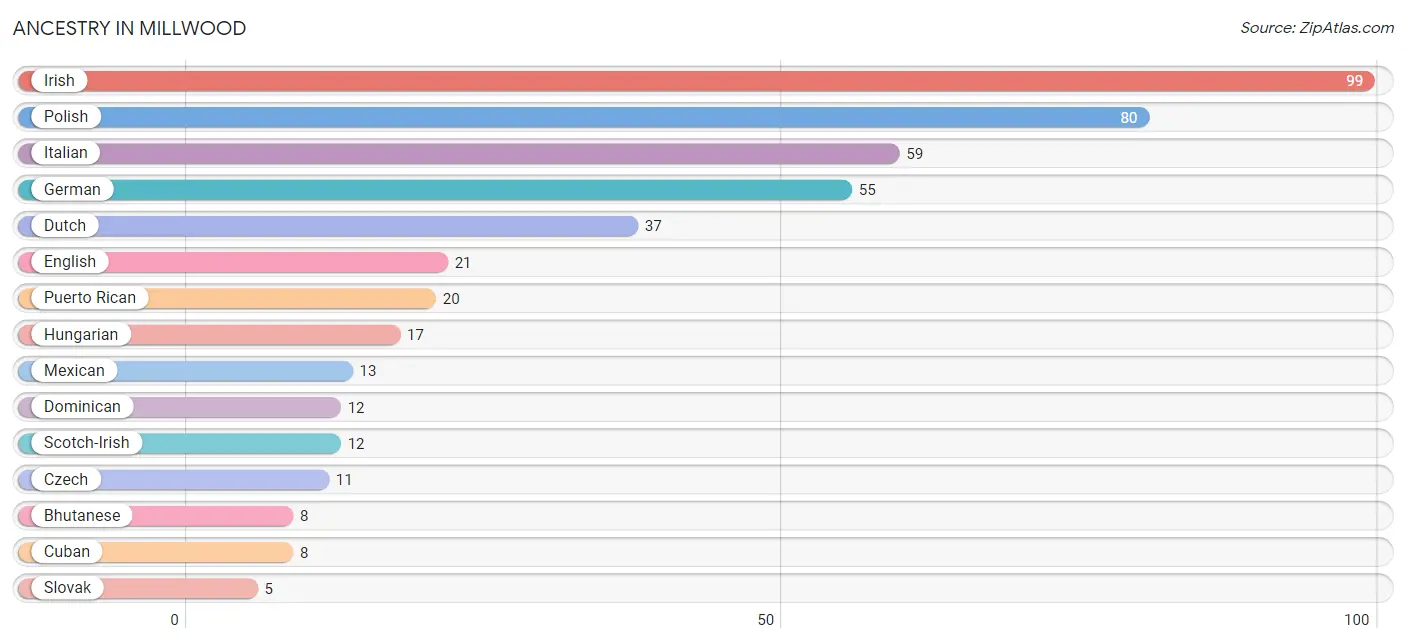
| Ancestry | # Population | % Population |
| Bhutanese | 8 | 2.1% |
| Cuban | 8 | 2.1% |
| Czech | 11 | 2.8% |
| Dominican | 12 | 3.1% |
| Dutch | 37 | 9.6% |
| English | 21 | 5.4% |
| German | 55 | 14.2% |
| Hungarian | 17 | 4.4% |
| Irish | 99 | 25.6% |
| Italian | 59 | 15.2% |
| Mexican | 13 | 3.4% |
| Polish | 80 | 20.7% |
| Puerto Rican | 20 | 5.2% |
| Scotch-Irish | 12 | 3.1% |
| Slovak | 5 | 1.3% | View All 15 Rows |
Immigrants in Millwood
The most numerous immigrant groups reported in Millwood came from Central America (13 | 3.4%), Latin America (13 | 3.4%), and Mexico (13 | 3.4%), together accounting for 10.1% of all Millwood residents.
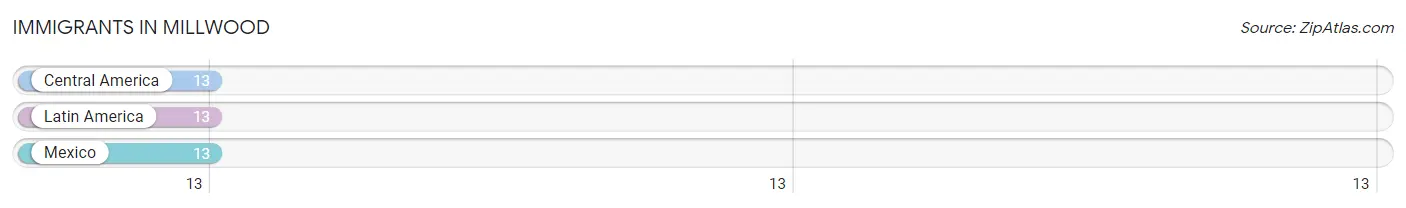
| Immigration Origin | # Population | % Population |
| Central America | 13 | 3.4% |
| Latin America | 13 | 3.4% |
| Mexico | 13 | 3.4% | View All 3 Rows |
Sex and Age in Millwood
Sex and Age in Millwood
The most populous age groups in Millwood are 30 to 34 Years (32 | 16.8%) for men and 10 to 14 Years (26 | 13.2%) for women.
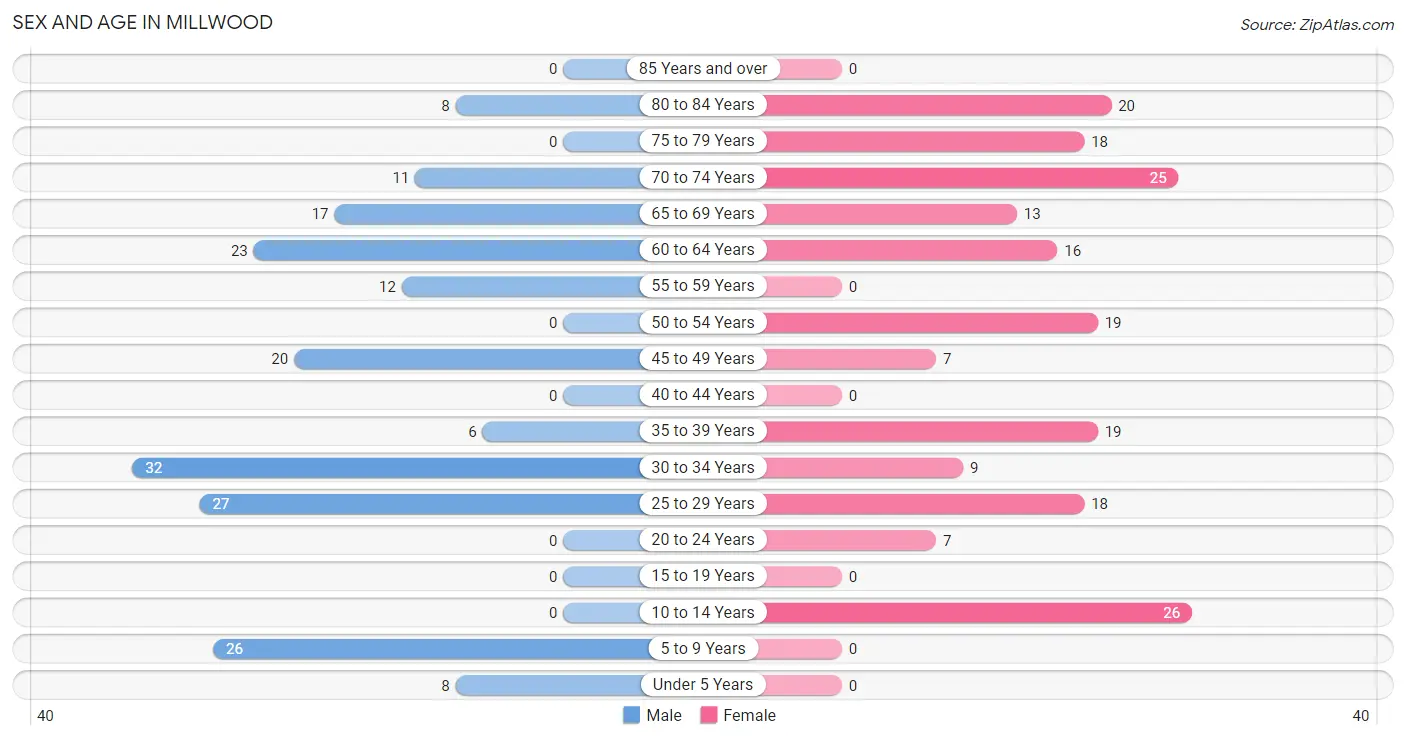
| Age Bracket | Male | Female |
| Under 5 Years | 8 (4.2%) | 0 (0.0%) |
| 5 to 9 Years | 26 (13.7%) | 0 (0.0%) |
| 10 to 14 Years | 0 (0.0%) | 26 (13.2%) |
| 15 to 19 Years | 0 (0.0%) | 0 (0.0%) |
| 20 to 24 Years | 0 (0.0%) | 7 (3.5%) |
| 25 to 29 Years | 27 (14.2%) | 18 (9.1%) |
| 30 to 34 Years | 32 (16.8%) | 9 (4.6%) |
| 35 to 39 Years | 6 (3.2%) | 19 (9.6%) |
| 40 to 44 Years | 0 (0.0%) | 0 (0.0%) |
| 45 to 49 Years | 20 (10.5%) | 7 (3.5%) |
| 50 to 54 Years | 0 (0.0%) | 19 (9.6%) |
| 55 to 59 Years | 12 (6.3%) | 0 (0.0%) |
| 60 to 64 Years | 23 (12.1%) | 16 (8.1%) |
| 65 to 69 Years | 17 (8.9%) | 13 (6.6%) |
| 70 to 74 Years | 11 (5.8%) | 25 (12.7%) |
| 75 to 79 Years | 0 (0.0%) | 18 (9.1%) |
| 80 to 84 Years | 8 (4.2%) | 20 (10.2%) |
| 85 Years and over | 0 (0.0%) | 0 (0.0%) |
| Total | 190 (100.0%) | 197 (100.0%) |
Families and Households in Millwood
Median Family Size in Millwood
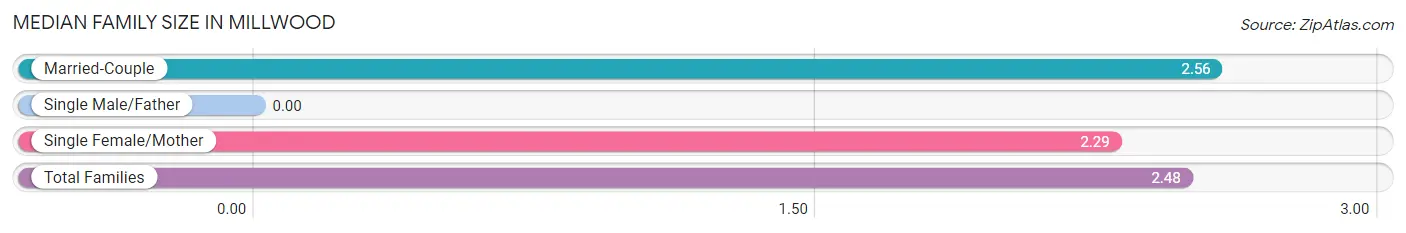
| Family Type | # Families | Family Size |
| Married-Couple | 87 (68.0%) | 2.56 |
| Single Male/Father | 0 (0.0%) | - |
| Single Female/Mother | 41 (32.0%) | 2.29 |
| Total Families | 128 (100.0%) | 2.48 |
Median Household Size in Millwood
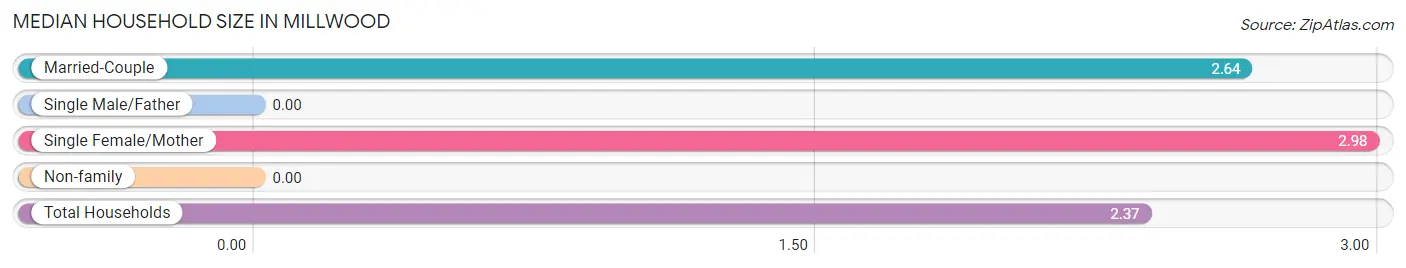
| Household Type | # Households | Household Size |
| Married-Couple | 87 (53.4%) | 2.64 |
| Single Male/Father | 0 (0.0%) | - |
| Single Female/Mother | 41 (25.2%) | 2.98 |
| Non-family | 35 (21.5%) | - |
| Total Households | 163 (100.0%) | 2.37 |
Household Size by Marriage Status in Millwood
Out of a total of 163 households in Millwood, 128 (78.5%) are family households, while 35 (21.5%) are nonfamily households. The most numerous type of family households are 2-person households, comprising 64, and the most common type of nonfamily households are 1-person households, comprising 35.
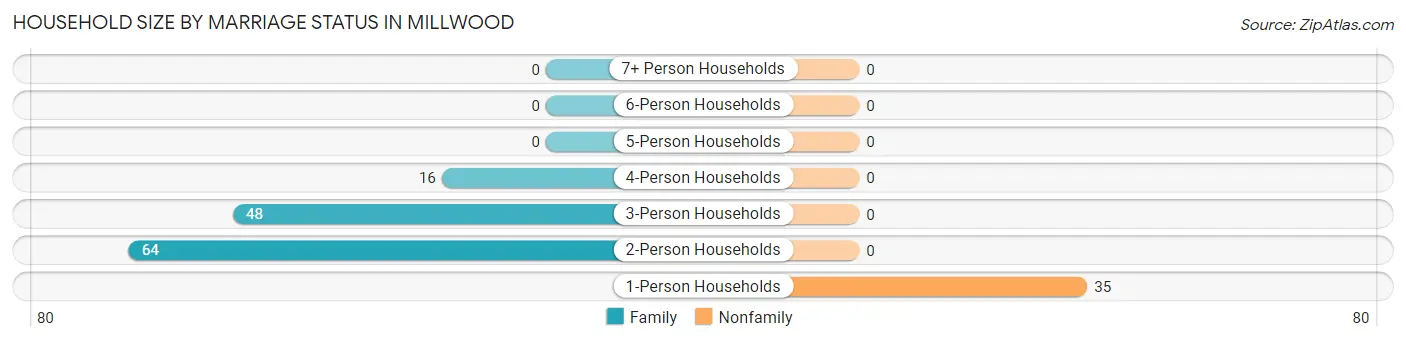
| Household Size | Family Households | Nonfamily Households |
| 1-Person Households | - | 35 (21.5%) |
| 2-Person Households | 64 (39.3%) | 0 (0.0%) |
| 3-Person Households | 48 (29.4%) | 0 (0.0%) |
| 4-Person Households | 16 (9.8%) | 0 (0.0%) |
| 5-Person Households | 0 (0.0%) | 0 (0.0%) |
| 6-Person Households | 0 (0.0%) | 0 (0.0%) |
| 7+ Person Households | 0 (0.0%) | 0 (0.0%) |
| Total | 128 (78.5%) | 35 (21.5%) |
Female Fertility in Millwood
Fertility by Age in Millwood
| Age Bracket | Women with Births | Births / 1,000 Women |
| 15 to 19 years | 0 (0.0%) | 0.0 |
| 20 to 34 years | 0 (0.0%) | 0.0 |
| 35 to 50 years | 0 (0.0%) | 0.0 |
| Total | 0 (0.0%) | 0.0 |
Fertility by Age by Marriage Status in Millwood
| Age Bracket | Married | Unmarried |
| 15 to 19 years | 0 (0.0%) | 0 (0.0%) |
| 20 to 34 years | 0 (0.0%) | 0 (0.0%) |
| 35 to 50 years | 0 (0.0%) | 0 (0.0%) |
| Total | 0 (0.0%) | 0 (0.0%) |
Fertility by Education in Millwood
| Educational Attainment | Women with Births | Births / 1,000 Women |
| Less than High School | 0 (0.0%) | 0.0 |
| High School Diploma | 0 (0.0%) | 0.0 |
| College or Associate's Degree | 0 (0.0%) | 0.0 |
| Bachelor's Degree | 0 (0.0%) | 0.0 |
| Graduate Degree | 0 (0.0%) | 0.0 |
| Total | 0 (0.0%) | 0.0 |
Fertility by Education by Marriage Status in Millwood
| Educational Attainment | Married | Unmarried |
| Less than High School | 0 (0.0%) | 0 (0.0%) |
| High School Diploma | 0 (0.0%) | 0 (0.0%) |
| College or Associate's Degree | 0 (0.0%) | 0 (0.0%) |
| Bachelor's Degree | 0 (0.0%) | 0 (0.0%) |
| Graduate Degree | 0 (0.0%) | 0 (0.0%) |
| Total | 0 (0.0%) | 0 (0.0%) |
Employment Characteristics in Millwood
Employment by Class of Employer in Millwood
Among the 163 employed individuals in Millwood, private company employees (132 | 81.0%), self-employed (incorporated) (13 | 8.0%), and not-for-profit organizations (13 | 8.0%) make up the most common classes of employment.
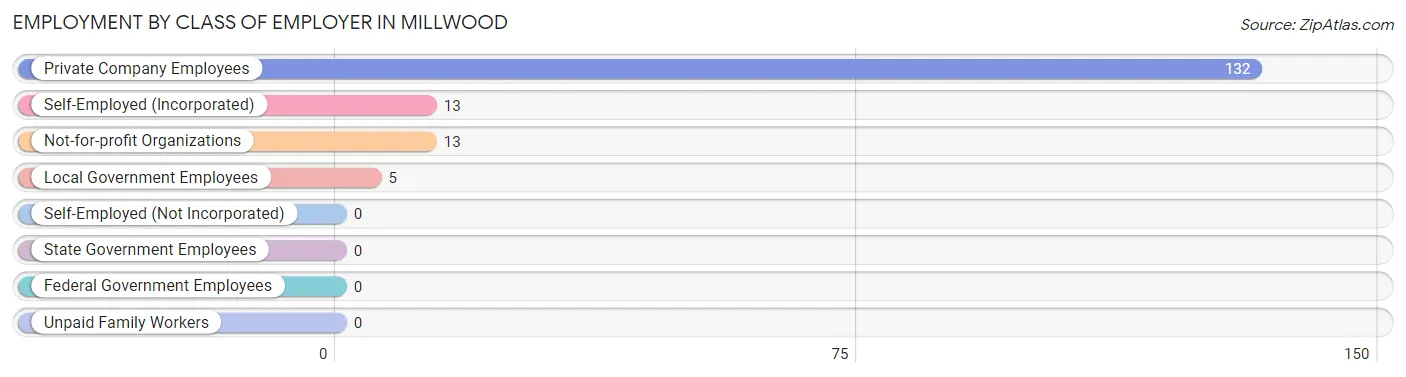
| Employer Class | # Employees | % Employees |
| Private Company Employees | 132 | 81.0% |
| Self-Employed (Incorporated) | 13 | 8.0% |
| Self-Employed (Not Incorporated) | 0 | 0.0% |
| Not-for-profit Organizations | 13 | 8.0% |
| Local Government Employees | 5 | 3.1% |
| State Government Employees | 0 | 0.0% |
| Federal Government Employees | 0 | 0.0% |
| Unpaid Family Workers | 0 | 0.0% |
| Total | 163 | 100.0% |
Employment Status by Age in Millwood
According to the labor force statistics for Millwood, out of the total population over 16 years of age (327), 56.9% or 186 individuals are in the labor force, with 12.4% or 23 of them unemployed. The age group with the highest labor force participation rate is 20 to 24 years, with 100.0% or 7 individuals in the labor force. Within the labor force, the 30 to 34 years age range has the highest percentage of unemployed individuals, with 56.1% or 23 of them being unemployed.
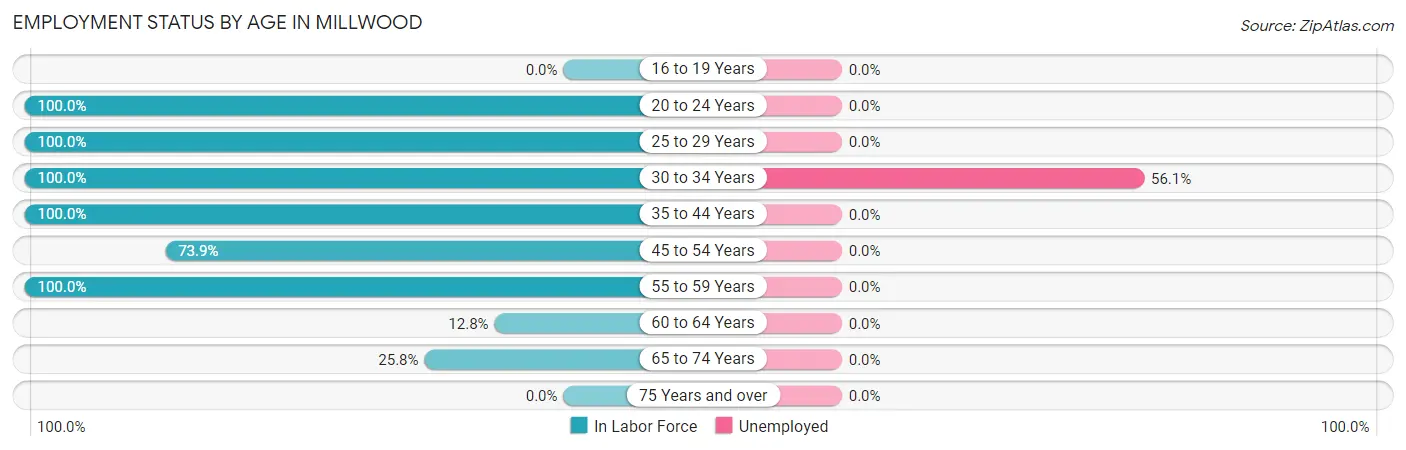
| Age Bracket | In Labor Force | Unemployed |
| 16 to 19 Years | 0 (0.0%) | 0 (0.0%) |
| 20 to 24 Years | 7 (100.0%) | 0 (0.0%) |
| 25 to 29 Years | 45 (100.0%) | 0 (0.0%) |
| 30 to 34 Years | 41 (100.0%) | 23 (56.1%) |
| 35 to 44 Years | 25 (100.0%) | 0 (0.0%) |
| 45 to 54 Years | 34 (73.9%) | 0 (0.0%) |
| 55 to 59 Years | 12 (100.0%) | 0 (0.0%) |
| 60 to 64 Years | 5 (12.8%) | 0 (0.0%) |
| 65 to 74 Years | 17 (25.8%) | 0 (0.0%) |
| 75 Years and over | 0 (0.0%) | 0 (0.0%) |
| Total | 186 (56.9%) | 23 (12.4%) |
Employment Status by Educational Attainment in Millwood
According to labor force statistics for Millwood, 77.9% of individuals (162) out of the total population between 25 and 64 years of age (208) are in the labor force, with 14.2% or 23 of them being unemployed. The group with the highest labor force participation rate are those with the educational attainment of bachelor's degree or higher, with 100.0% or 25 individuals in the labor force. Within the labor force, individuals with college / associate degree education have the highest percentage of unemployment, with 76.7% or 23 of them being unemployed.
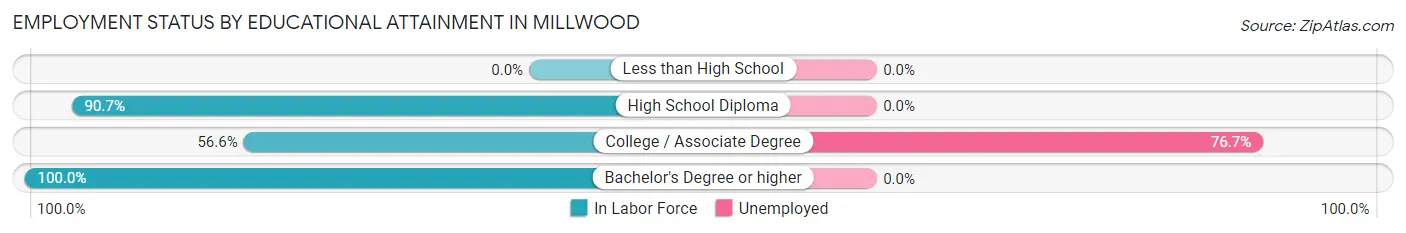
| Educational Attainment | In Labor Force | Unemployed |
| Less than High School | 0 (0.0%) | 0 (0.0%) |
| High School Diploma | 107 (90.7%) | 0 (0.0%) |
| College / Associate Degree | 30 (56.6%) | 41 (76.7%) |
| Bachelor's Degree or higher | 25 (100.0%) | 0 (0.0%) |
| Total | 162 (77.9%) | 30 (14.2%) |
Employment Occupations by Sex in Millwood
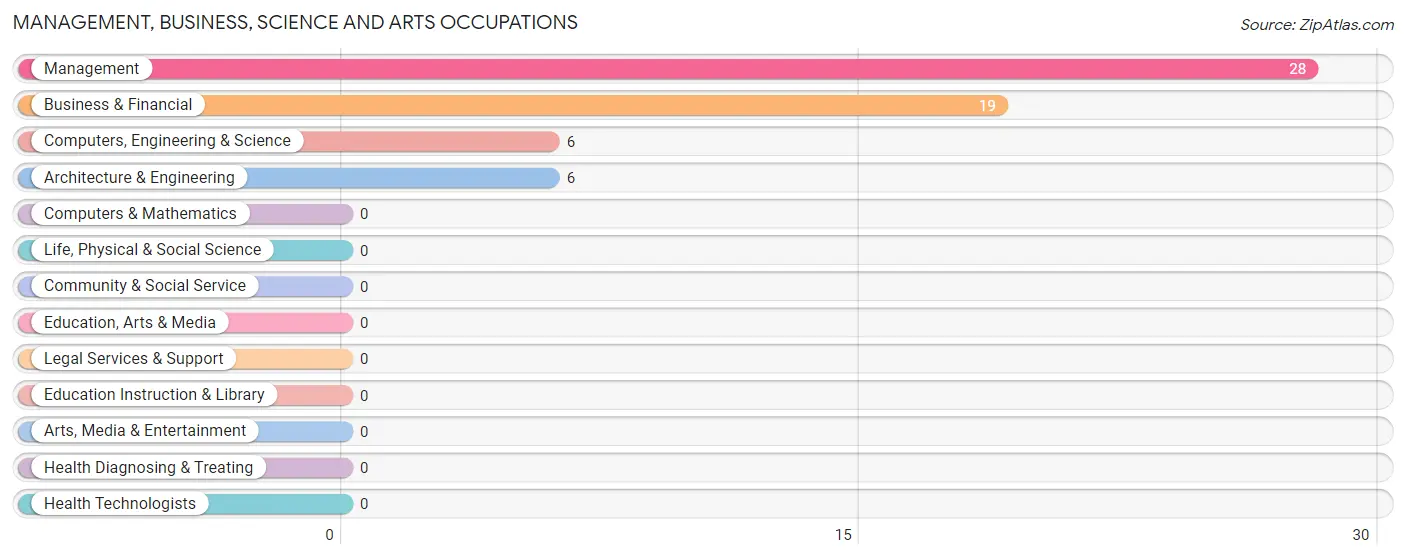
Management, Business, Science and Arts Occupations
The most common Management, Business, Science and Arts occupations in Millwood are Management (28 | 17.2%), Business & Financial (19 | 11.7%), Computers, Engineering & Science (6 | 3.7%), and Architecture & Engineering (6 | 3.7%).
Management, Business, Science and Arts Occupations by Sex
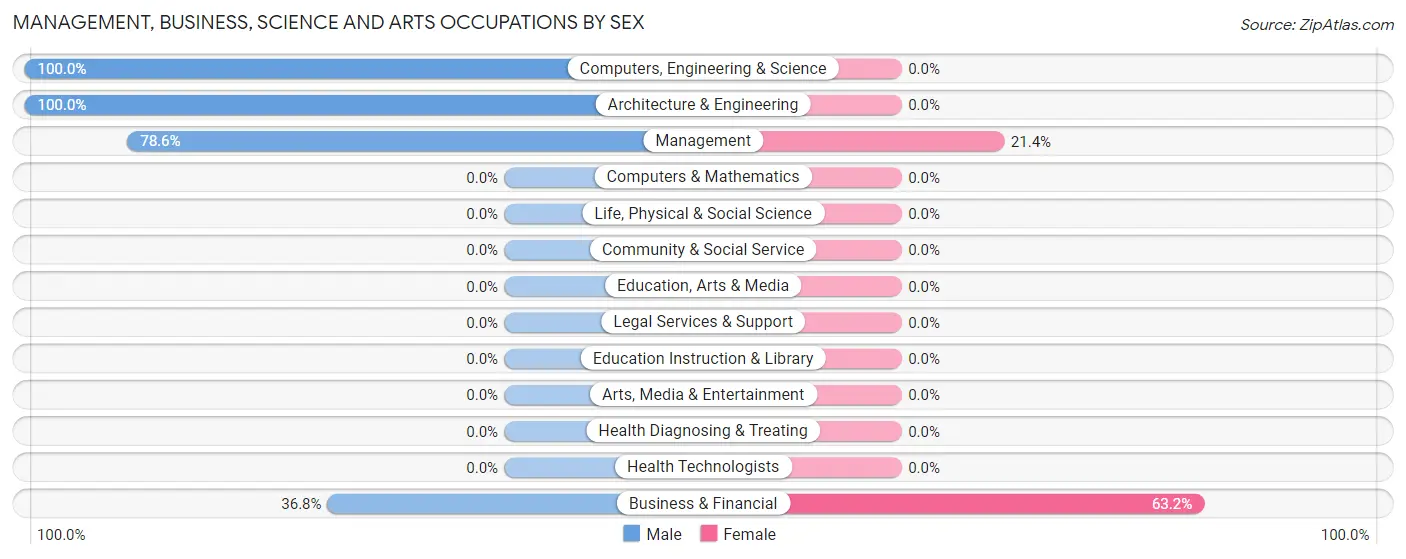
Within the Management, Business, Science and Arts occupations in Millwood, the most male-oriented occupations are Computers, Engineering & Science (100.0%), Architecture & Engineering (100.0%), and Management (78.6%), while the most female-oriented occupations are Business & Financial (63.2%), and Management (21.4%).
| Occupation | Male | Female |
| Management | 22 (78.6%) | 6 (21.4%) |
| Business & Financial | 7 (36.8%) | 12 (63.2%) |
| Computers, Engineering & Science | 6 (100.0%) | 0 (0.0%) |
| Computers & Mathematics | 0 (0.0%) | 0 (0.0%) |
| Architecture & Engineering | 6 (100.0%) | 0 (0.0%) |
| Life, Physical & Social Science | 0 (0.0%) | 0 (0.0%) |
| Community & Social Service | 0 (0.0%) | 0 (0.0%) |
| Education, Arts & Media | 0 (0.0%) | 0 (0.0%) |
| Legal Services & Support | 0 (0.0%) | 0 (0.0%) |
| Education Instruction & Library | 0 (0.0%) | 0 (0.0%) |
| Arts, Media & Entertainment | 0 (0.0%) | 0 (0.0%) |
| Health Diagnosing & Treating | 0 (0.0%) | 0 (0.0%) |
| Health Technologists | 0 (0.0%) | 0 (0.0%) |
| Total (Category) | 35 (66.0%) | 18 (34.0%) |
| Total (Overall) | 79 (48.5%) | 84 (51.5%) |
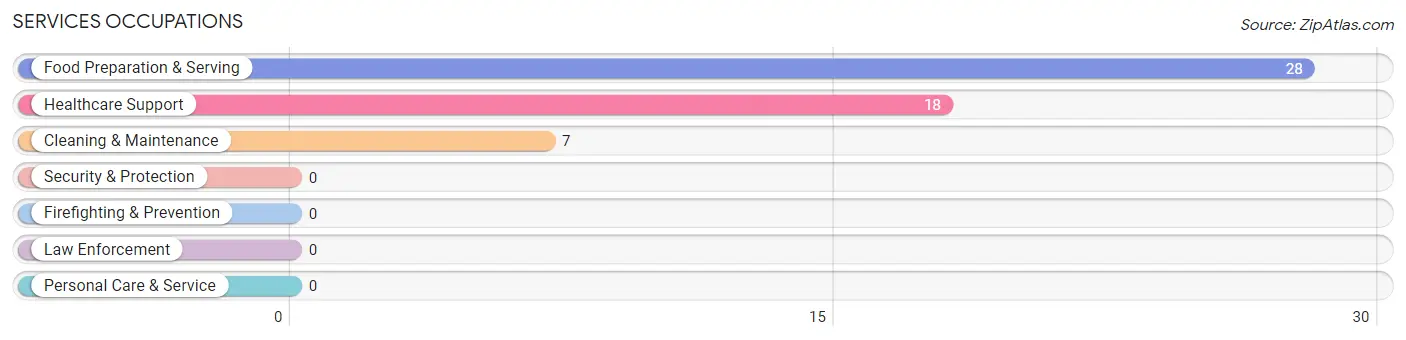
Services Occupations
The most common Services occupations in Millwood are Food Preparation & Serving (28 | 17.2%), Healthcare Support (18 | 11.0%), and Cleaning & Maintenance (7 | 4.3%).
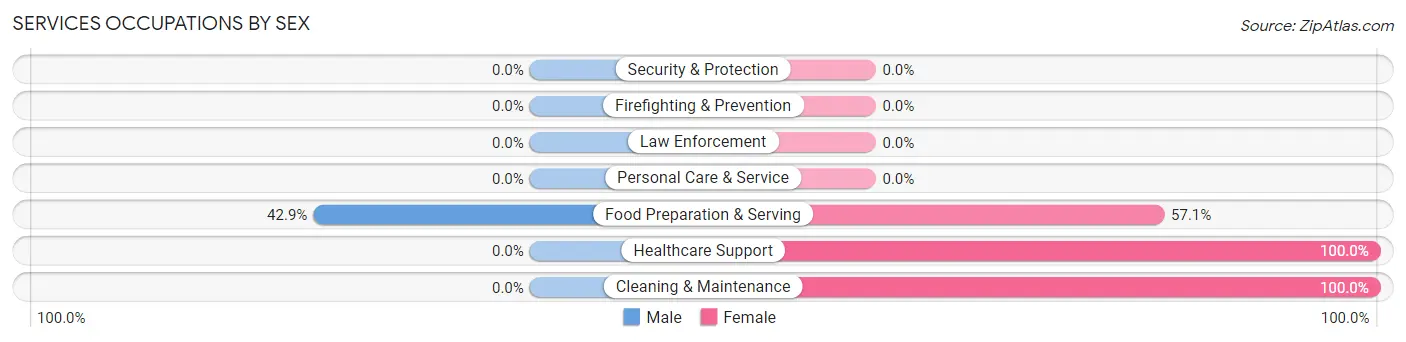
Services Occupations by Sex
| Occupation | Male | Female |
| Healthcare Support | 0 (0.0%) | 18 (100.0%) |
| Security & Protection | 0 (0.0%) | 0 (0.0%) |
| Firefighting & Prevention | 0 (0.0%) | 0 (0.0%) |
| Law Enforcement | 0 (0.0%) | 0 (0.0%) |
| Food Preparation & Serving | 12 (42.9%) | 16 (57.1%) |
| Cleaning & Maintenance | 0 (0.0%) | 7 (100.0%) |
| Personal Care & Service | 0 (0.0%) | 0 (0.0%) |
| Total (Category) | 12 (22.6%) | 41 (77.4%) |
| Total (Overall) | 79 (48.5%) | 84 (51.5%) |
Sales and Office Occupations
The most common Sales and Office occupations in Millwood are , and Office & Administration (18 | 11.0%).
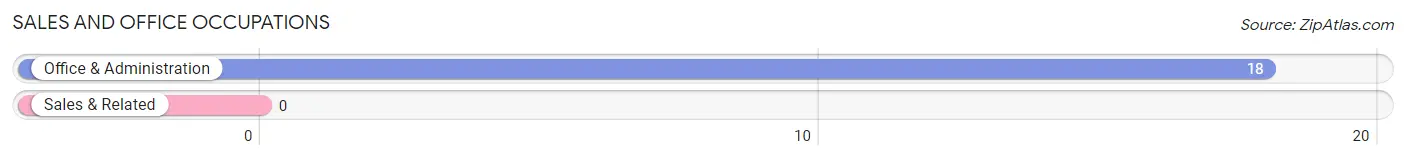
Sales and Office Occupations by Sex
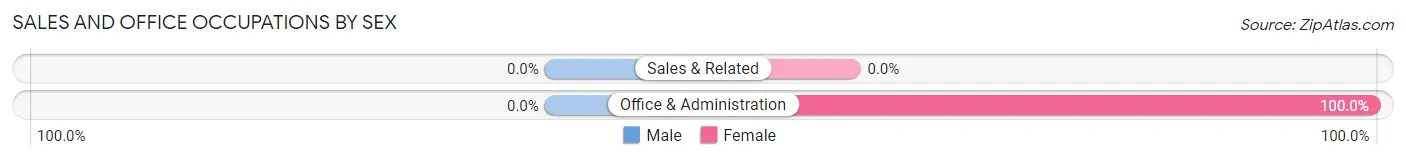
| Occupation | Male | Female |
| Sales & Related | 0 (0.0%) | 0 (0.0%) |
| Office & Administration | 0 (0.0%) | 18 (100.0%) |
| Total (Category) | 0 (0.0%) | 18 (100.0%) |
| Total (Overall) | 79 (48.5%) | 84 (51.5%) |
Natural Resources, Construction and Maintenance Occupations
The most common Natural Resources, Construction and Maintenance occupations in Millwood are , and Construction & Extraction (20 | 12.3%).
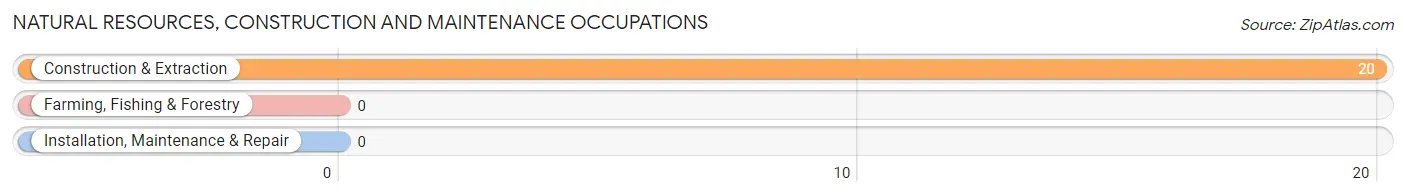
Natural Resources, Construction and Maintenance Occupations by Sex
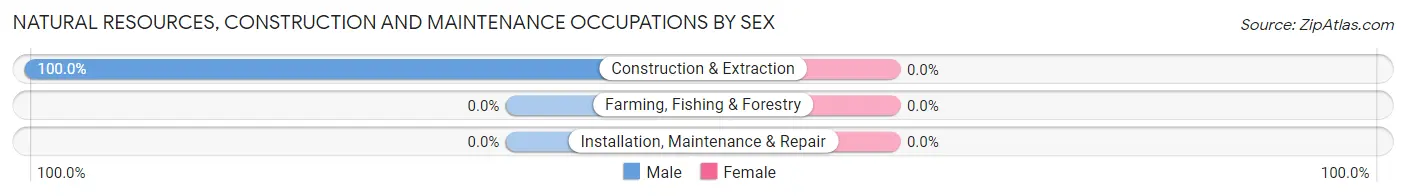
| Occupation | Male | Female |
| Farming, Fishing & Forestry | 0 (0.0%) | 0 (0.0%) |
| Construction & Extraction | 20 (100.0%) | 0 (0.0%) |
| Installation, Maintenance & Repair | 0 (0.0%) | 0 (0.0%) |
| Total (Category) | 20 (100.0%) | 0 (0.0%) |
| Total (Overall) | 79 (48.5%) | 84 (51.5%) |
Production, Transportation and Moving Occupations
The most common Production, Transportation and Moving occupations in Millwood are Material Moving (8 | 4.9%), Production (7 | 4.3%), and Transportation (4 | 2.5%).
Production, Transportation and Moving Occupations by Sex
| Occupation | Male | Female |
| Production | 0 (0.0%) | 7 (100.0%) |
| Transportation | 4 (100.0%) | 0 (0.0%) |
| Material Moving | 8 (100.0%) | 0 (0.0%) |
| Total (Category) | 12 (63.2%) | 7 (36.8%) |
| Total (Overall) | 79 (48.5%) | 84 (51.5%) |
Employment Industries by Sex in Millwood
Employment Industries in Millwood
The major employment industries in Millwood include Health Care & Social Assistance (31 | 19.0%), Accommodation & Food Services (28 | 17.2%), Mining, Quarrying, & Extraction (20 | 12.3%), Manufacturing (20 | 12.3%), and Educational Services (18 | 11.0%).
Employment Industries by Sex in Millwood
The Millwood industries that see more men than women are Mining, Quarrying, & Extraction (100.0%), Wholesale Trade (100.0%), and Transportation & Warehousing (100.0%), whereas the industries that tend to have a higher number of women are Educational Services (100.0%), Health Care & Social Assistance (100.0%), and Accommodation & Food Services (57.1%).
| Industry | Male | Female |
| Agriculture, Fishing & Hunting | 0 (0.0%) | 0 (0.0%) |
| Mining, Quarrying, & Extraction | 20 (100.0%) | 0 (0.0%) |
| Construction | 0 (0.0%) | 0 (0.0%) |
| Manufacturing | 13 (65.0%) | 7 (35.0%) |
| Wholesale Trade | 15 (100.0%) | 0 (0.0%) |
| Retail Trade | 0 (0.0%) | 0 (0.0%) |
| Transportation & Warehousing | 4 (100.0%) | 0 (0.0%) |
| Utilities | 0 (0.0%) | 0 (0.0%) |
| Information | 0 (0.0%) | 0 (0.0%) |
| Finance & Insurance | 0 (0.0%) | 0 (0.0%) |
| Real Estate, Rental & Leasing | 0 (0.0%) | 0 (0.0%) |
| Professional & Scientific | 15 (100.0%) | 0 (0.0%) |
| Enterprise Management | 0 (0.0%) | 0 (0.0%) |
| Administrative & Support | 0 (0.0%) | 0 (0.0%) |
| Educational Services | 0 (0.0%) | 18 (100.0%) |
| Health Care & Social Assistance | 0 (0.0%) | 31 (100.0%) |
| Arts, Entertainment & Recreation | 0 (0.0%) | 0 (0.0%) |
| Accommodation & Food Services | 12 (42.9%) | 16 (57.1%) |
| Public Administration | 0 (0.0%) | 0 (0.0%) |
| Total | 79 (48.5%) | 84 (51.5%) |
Education in Millwood
School Enrollment in Millwood
The most common levels of schooling among the 49 students in Millwood are middle school (26 | 53.1%), nursery / preschool (8 | 16.3%), and elementary school (8 | 16.3%).
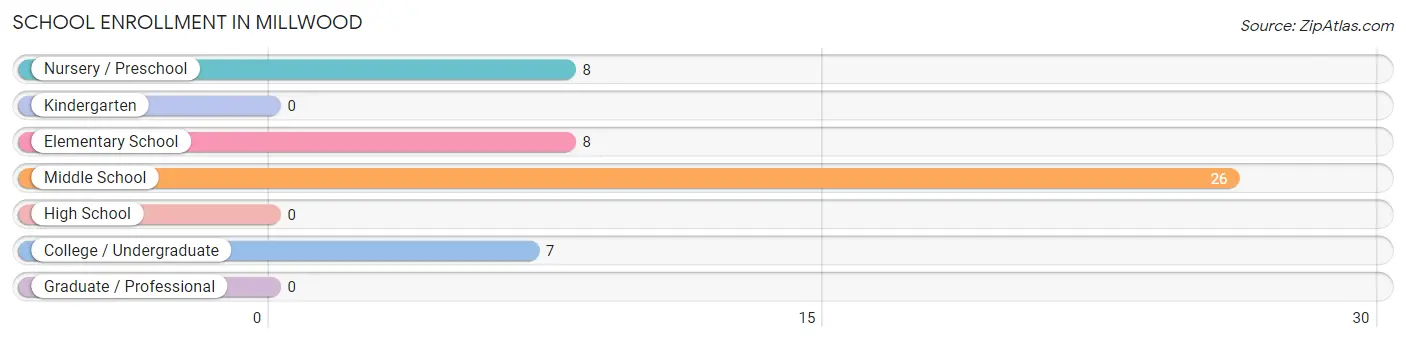
| School Level | # Students | % Students |
| Nursery / Preschool | 8 | 16.3% |
| Kindergarten | 0 | 0.0% |
| Elementary School | 8 | 16.3% |
| Middle School | 26 | 53.1% |
| High School | 0 | 0.0% |
| College / Undergraduate | 7 | 14.3% |
| Graduate / Professional | 0 | 0.0% |
| Total | 49 | 100.0% |
School Enrollment by Age by Funding Source in Millwood
Out of a total of 49 students who are enrolled in schools in Millwood, 13 (26.5%) attend a private institution, while the remaining 36 (73.5%) are enrolled in public schools. The age group of 10 to 14 year olds has the highest likelihood of being enrolled in private schools, with 13 (50.0% in the age bracket) enrolled. Conversely, the age group of 3 to 4 year olds has the lowest likelihood of being enrolled in a private school, with 8 (100.0% in the age bracket) attending a public institution.
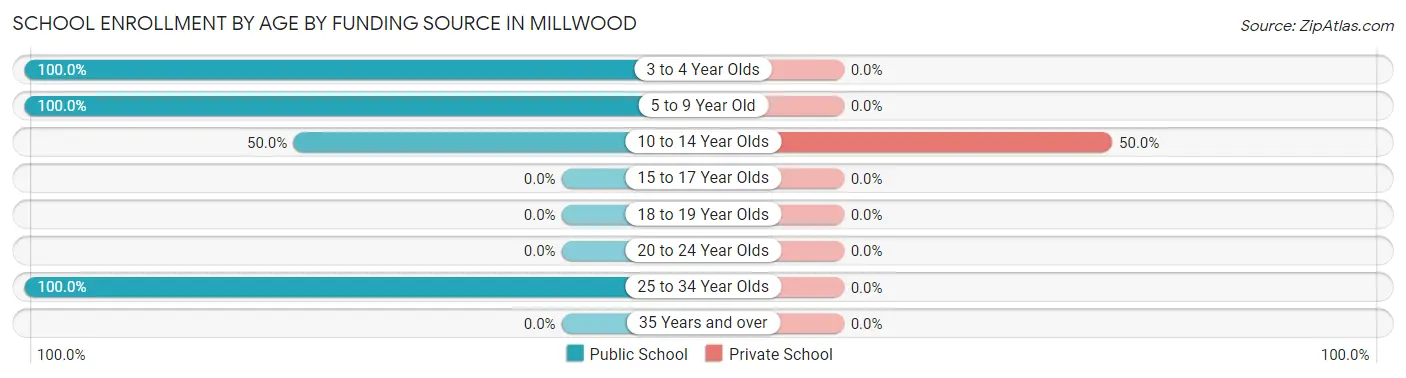
| Age Bracket | Public School | Private School |
| 3 to 4 Year Olds | 8 (100.0%) | 0 (0.0%) |
| 5 to 9 Year Old | 8 (100.0%) | 0 (0.0%) |
| 10 to 14 Year Olds | 13 (50.0%) | 13 (50.0%) |
| 15 to 17 Year Olds | 0 (0.0%) | 0 (0.0%) |
| 18 to 19 Year Olds | 0 (0.0%) | 0 (0.0%) |
| 20 to 24 Year Olds | 0 (0.0%) | 0 (0.0%) |
| 25 to 34 Year Olds | 7 (100.0%) | 0 (0.0%) |
| 35 Years and over | 0 (0.0%) | 0 (0.0%) |
| Total | 36 (73.5%) | 13 (26.5%) |
Educational Attainment by Field of Study in Millwood
Business (13 | 39.4%), bio, nature & agricultural (8 | 24.2%), engineering (6 | 18.2%), and literature & languages (6 | 18.2%) are the most common fields of study among 33 individuals in Millwood who have obtained a bachelor's degree or higher.
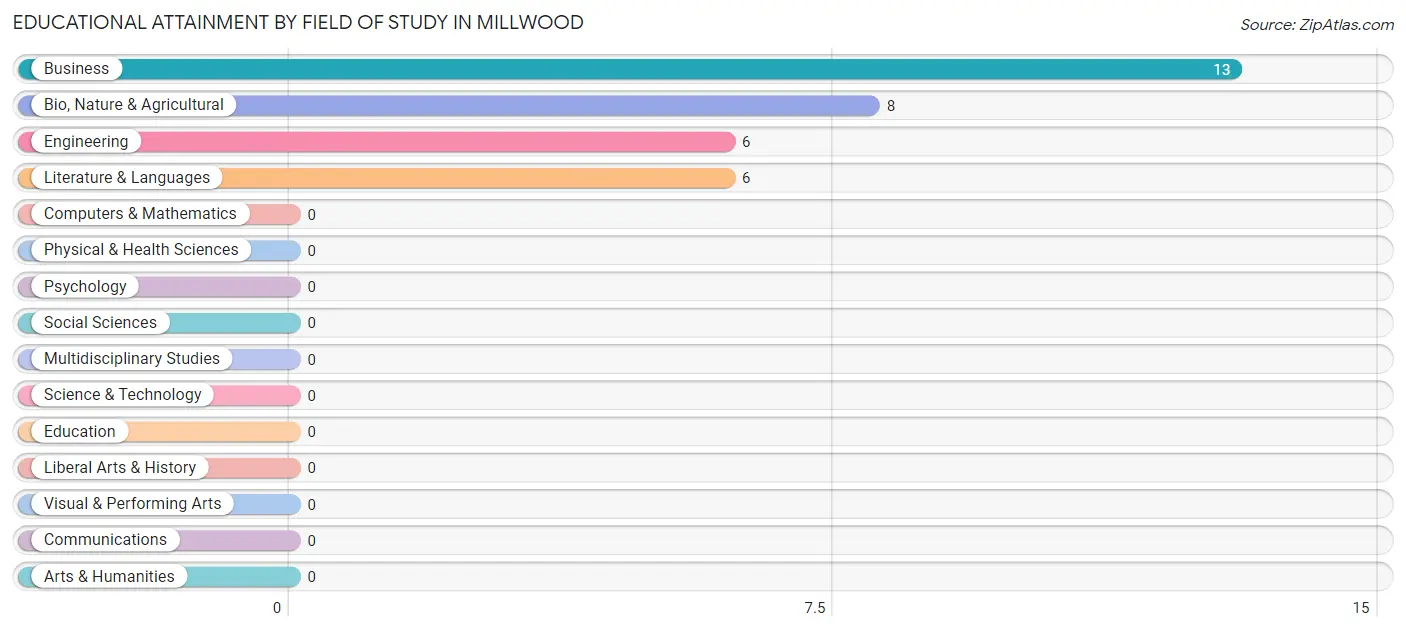
| Field of Study | # Graduates | % Graduates |
| Computers & Mathematics | 0 | 0.0% |
| Bio, Nature & Agricultural | 8 | 24.2% |
| Physical & Health Sciences | 0 | 0.0% |
| Psychology | 0 | 0.0% |
| Social Sciences | 0 | 0.0% |
| Engineering | 6 | 18.2% |
| Multidisciplinary Studies | 0 | 0.0% |
| Science & Technology | 0 | 0.0% |
| Business | 13 | 39.4% |
| Education | 0 | 0.0% |
| Literature & Languages | 6 | 18.2% |
| Liberal Arts & History | 0 | 0.0% |
| Visual & Performing Arts | 0 | 0.0% |
| Communications | 0 | 0.0% |
| Arts & Humanities | 0 | 0.0% |
| Total | 33 | 100.0% |
Transportation & Commute in Millwood
Vehicle Availability by Sex in Millwood
The most prevalent vehicle ownership categories in Millwood are males with 2 vehicles (37, accounting for 46.8%) and females with 2 vehicles (54, making up 44.1%).
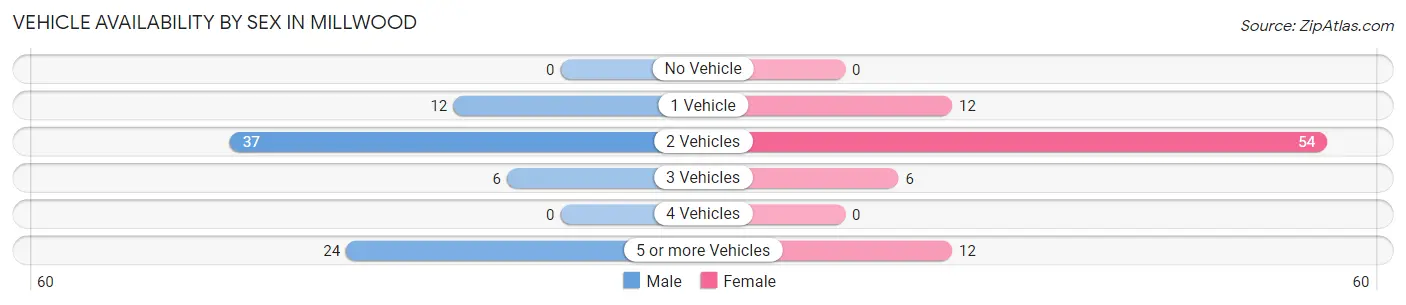
| Vehicles Available | Male | Female |
| No Vehicle | 0 (0.0%) | 0 (0.0%) |
| 1 Vehicle | 12 (15.2%) | 12 (14.3%) |
| 2 Vehicles | 37 (46.8%) | 54 (64.3%) |
| 3 Vehicles | 6 (7.6%) | 6 (7.1%) |
| 4 Vehicles | 0 (0.0%) | 0 (0.0%) |
| 5 or more Vehicles | 24 (30.4%) | 12 (14.3%) |
| Total | 79 (100.0%) | 84 (100.0%) |
Commute Time in Millwood
The most frequently occuring commute durations in Millwood are 35 to 39 minutes (36 commuters, 24.8%), 30 to 34 minutes (24 commuters, 16.6%), and 20 to 24 minutes (23 commuters, 15.9%).
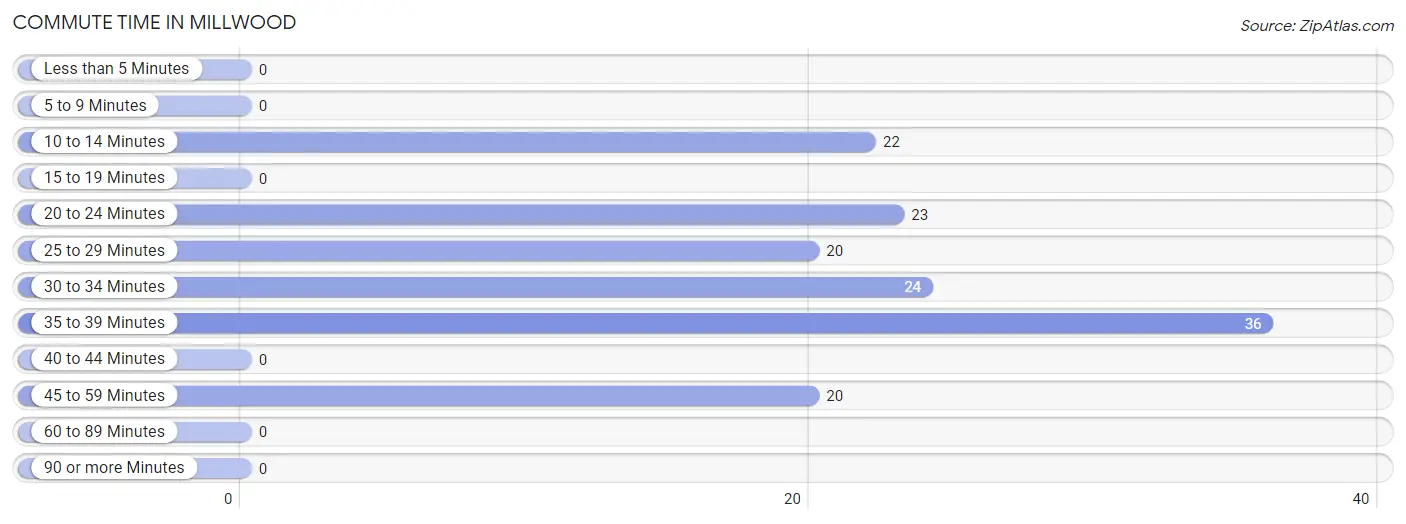
| Commute Time | # Commuters | % Commuters |
| Less than 5 Minutes | 0 | 0.0% |
| 5 to 9 Minutes | 0 | 0.0% |
| 10 to 14 Minutes | 22 | 15.2% |
| 15 to 19 Minutes | 0 | 0.0% |
| 20 to 24 Minutes | 23 | 15.9% |
| 25 to 29 Minutes | 20 | 13.8% |
| 30 to 34 Minutes | 24 | 16.6% |
| 35 to 39 Minutes | 36 | 24.8% |
| 40 to 44 Minutes | 0 | 0.0% |
| 45 to 59 Minutes | 20 | 13.8% |
| 60 to 89 Minutes | 0 | 0.0% |
| 90 or more Minutes | 0 | 0.0% |
Commute Time by Sex in Millwood
The most common commute times in Millwood are 45 to 59 minutes (20 commuters, 27.4%) for males and 35 to 39 minutes (24 commuters, 33.3%) for females.
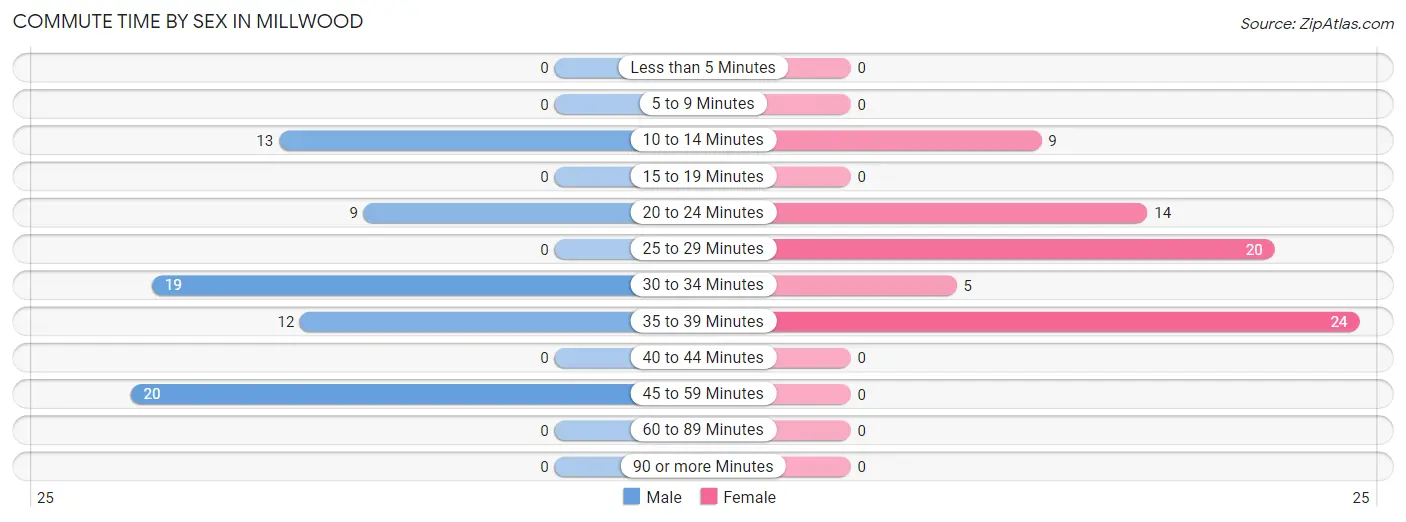
| Commute Time | Male | Female |
| Less than 5 Minutes | 0 (0.0%) | 0 (0.0%) |
| 5 to 9 Minutes | 0 (0.0%) | 0 (0.0%) |
| 10 to 14 Minutes | 13 (17.8%) | 9 (12.5%) |
| 15 to 19 Minutes | 0 (0.0%) | 0 (0.0%) |
| 20 to 24 Minutes | 9 (12.3%) | 14 (19.4%) |
| 25 to 29 Minutes | 0 (0.0%) | 20 (27.8%) |
| 30 to 34 Minutes | 19 (26.0%) | 5 (6.9%) |
| 35 to 39 Minutes | 12 (16.4%) | 24 (33.3%) |
| 40 to 44 Minutes | 0 (0.0%) | 0 (0.0%) |
| 45 to 59 Minutes | 20 (27.4%) | 0 (0.0%) |
| 60 to 89 Minutes | 0 (0.0%) | 0 (0.0%) |
| 90 or more Minutes | 0 (0.0%) | 0 (0.0%) |
Time of Departure to Work by Sex in Millwood
The most frequent times of departure to work in Millwood are 7:00 AM to 7:29 AM (21, 28.8%) for males and 12:00 PM to 3:59 PM (23, 31.9%) for females.
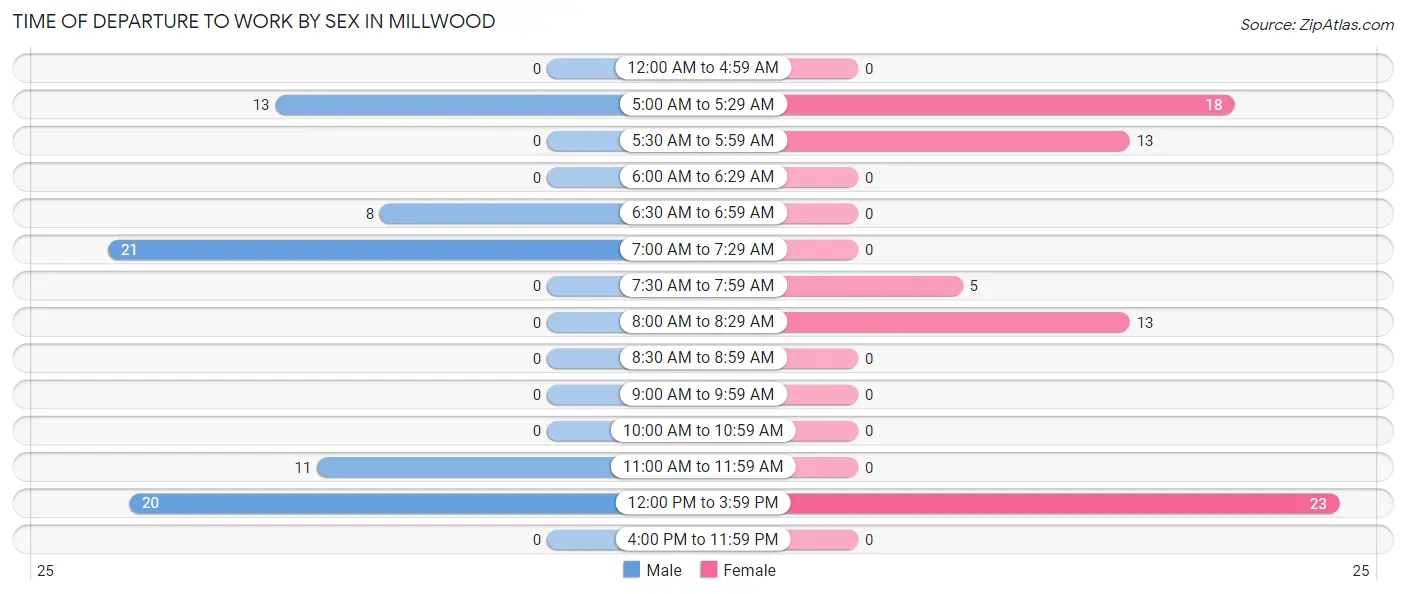
| Time of Departure | Male | Female |
| 12:00 AM to 4:59 AM | 0 (0.0%) | 0 (0.0%) |
| 5:00 AM to 5:29 AM | 13 (17.8%) | 18 (25.0%) |
| 5:30 AM to 5:59 AM | 0 (0.0%) | 13 (18.1%) |
| 6:00 AM to 6:29 AM | 0 (0.0%) | 0 (0.0%) |
| 6:30 AM to 6:59 AM | 8 (11.0%) | 0 (0.0%) |
| 7:00 AM to 7:29 AM | 21 (28.8%) | 0 (0.0%) |
| 7:30 AM to 7:59 AM | 0 (0.0%) | 5 (6.9%) |
| 8:00 AM to 8:29 AM | 0 (0.0%) | 13 (18.1%) |
| 8:30 AM to 8:59 AM | 0 (0.0%) | 0 (0.0%) |
| 9:00 AM to 9:59 AM | 0 (0.0%) | 0 (0.0%) |
| 10:00 AM to 10:59 AM | 0 (0.0%) | 0 (0.0%) |
| 11:00 AM to 11:59 AM | 11 (15.1%) | 0 (0.0%) |
| 12:00 PM to 3:59 PM | 20 (27.4%) | 23 (31.9%) |
| 4:00 PM to 11:59 PM | 0 (0.0%) | 0 (0.0%) |
| Total | 73 (100.0%) | 72 (100.0%) |
Housing Occupancy in Millwood
Occupancy by Ownership in Millwood
Of the total 163 dwellings in Millwood, owner-occupied units account for 163 (100.0%), while renter-occupied units make up 0 (0.0%).
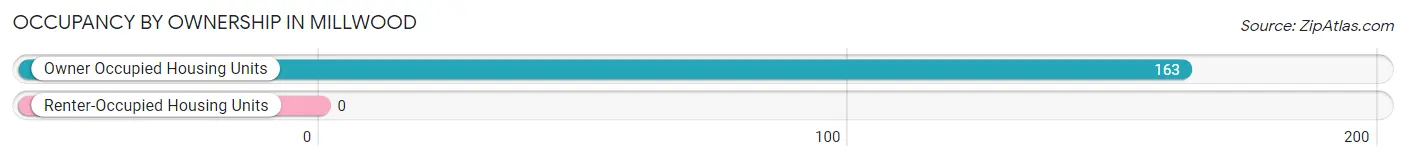
| Occupancy | # Housing Units | % Housing Units |
| Owner Occupied Housing Units | 163 | 100.0% |
| Renter-Occupied Housing Units | 0 | 0.0% |
| Total Occupied Housing Units | 163 | 100.0% |
Occupancy by Household Size in Millwood
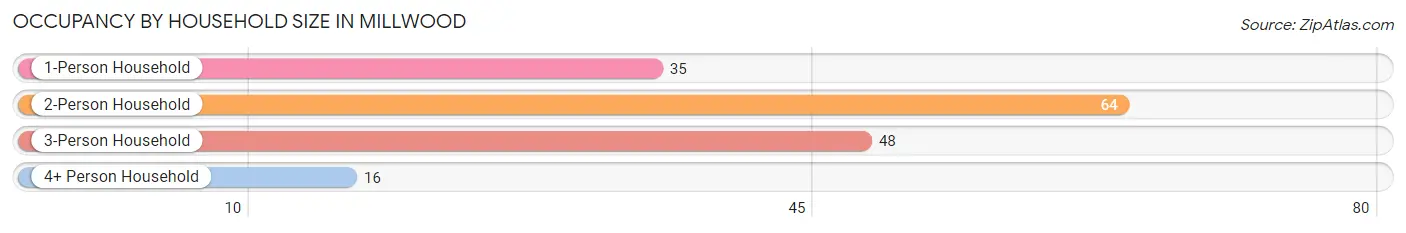
| Household Size | # Housing Units | % Housing Units |
| 1-Person Household | 35 | 21.5% |
| 2-Person Household | 64 | 39.3% |
| 3-Person Household | 48 | 29.4% |
| 4+ Person Household | 16 | 9.8% |
| Total Housing Units | 163 | 100.0% |
Occupancy by Ownership by Household Size in Millwood
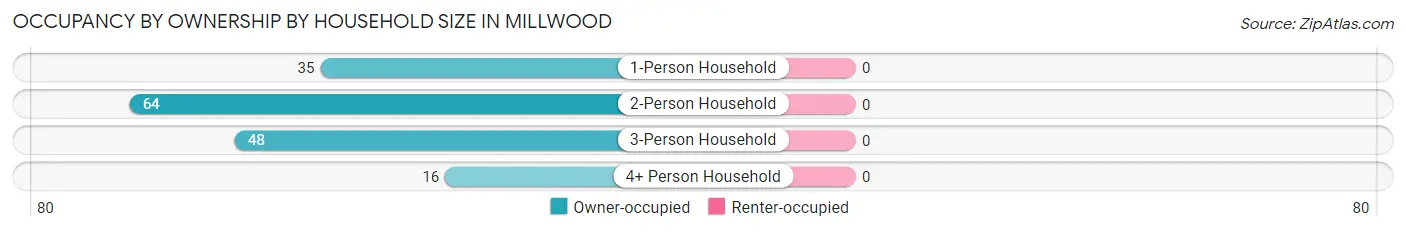
| Household Size | Owner-occupied | Renter-occupied |
| 1-Person Household | 35 (100.0%) | 0 (0.0%) |
| 2-Person Household | 64 (100.0%) | 0 (0.0%) |
| 3-Person Household | 48 (100.0%) | 0 (0.0%) |
| 4+ Person Household | 16 (100.0%) | 0 (0.0%) |
| Total Housing Units | 163 (100.0%) | 0 (0.0%) |
Occupancy by Educational Attainment in Millwood
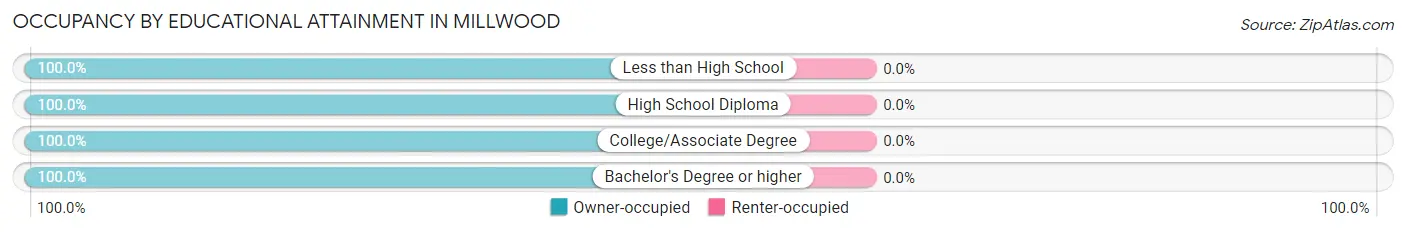
| Household Size | Owner-occupied | Renter-occupied |
| Less than High School | 16 (100.0%) | 0 (0.0%) |
| High School Diploma | 102 (100.0%) | 0 (0.0%) |
| College/Associate Degree | 39 (100.0%) | 0 (0.0%) |
| Bachelor's Degree or higher | 6 (100.0%) | 0 (0.0%) |
Occupancy by Age of Householder in Millwood
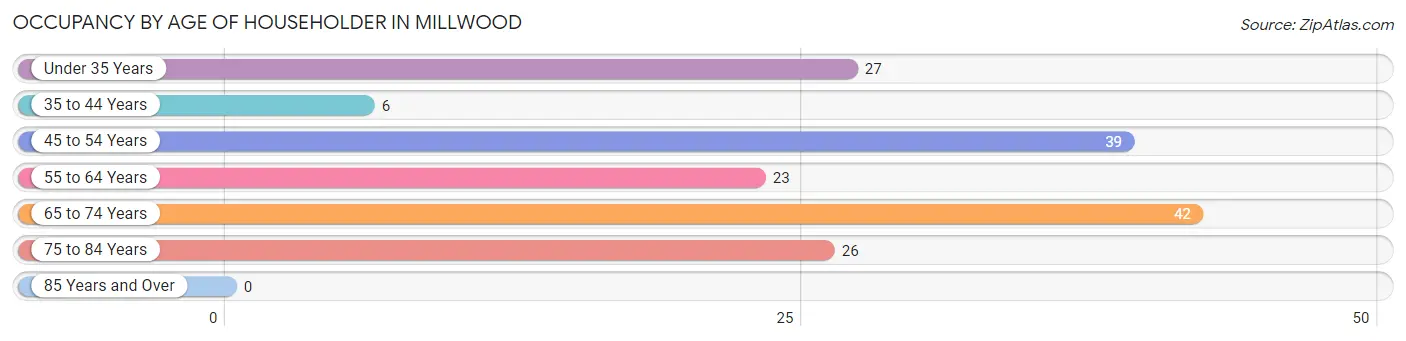
| Age Bracket | # Households | % Households |
| Under 35 Years | 27 | 16.6% |
| 35 to 44 Years | 6 | 3.7% |
| 45 to 54 Years | 39 | 23.9% |
| 55 to 64 Years | 23 | 14.1% |
| 65 to 74 Years | 42 | 25.8% |
| 75 to 84 Years | 26 | 16.0% |
| 85 Years and Over | 0 | 0.0% |
| Total | 163 | 100.0% |
Housing Finances in Millwood
Median Income by Occupancy in Millwood
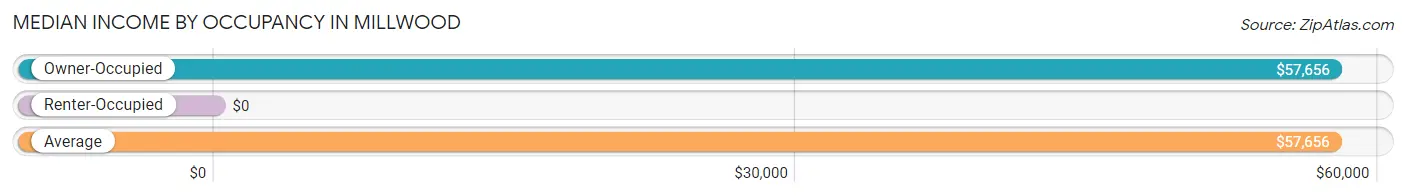
| Occupancy Type | # Households | Median Income |
| Owner-Occupied | 163 (100.0%) | $57,656 |
| Renter-Occupied | 0 (0.0%) | $0 |
| Average | 163 (100.0%) | $57,656 |
Occupancy by Householder Income Bracket in Millwood
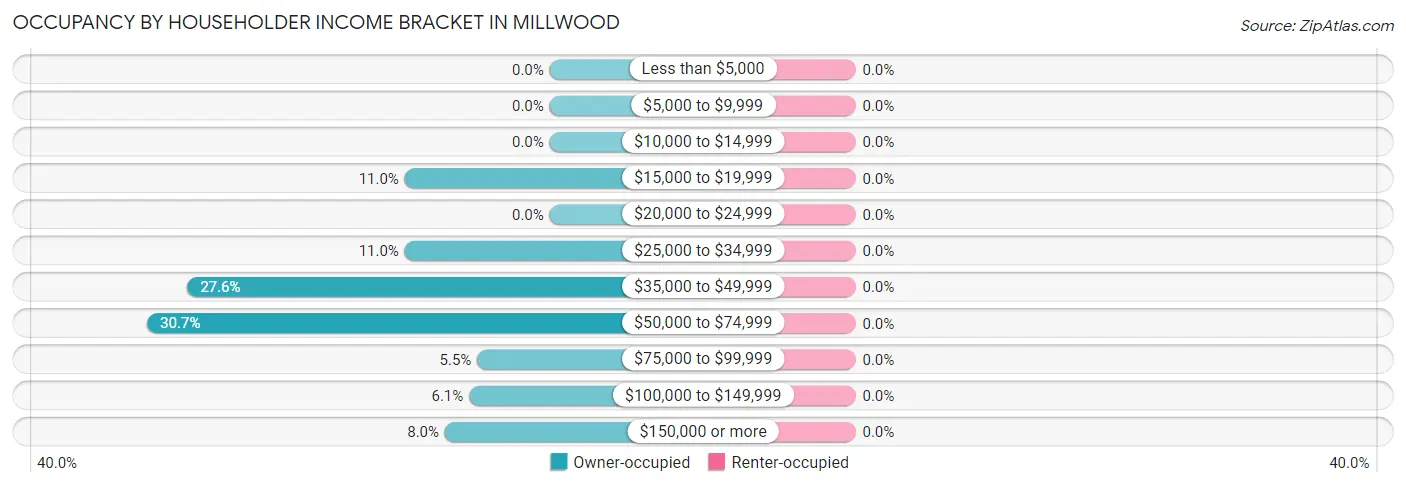
| Income Bracket | Owner-occupied | Renter-occupied |
| Less than $5,000 | 0 (0.0%) | 0 (0.0%) |
| $5,000 to $9,999 | 0 (0.0%) | 0 (0.0%) |
| $10,000 to $14,999 | 0 (0.0%) | 0 (0.0%) |
| $15,000 to $19,999 | 18 (11.0%) | 0 (0.0%) |
| $20,000 to $24,999 | 0 (0.0%) | 0 (0.0%) |
| $25,000 to $34,999 | 18 (11.0%) | 0 (0.0%) |
| $35,000 to $49,999 | 45 (27.6%) | 0 (0.0%) |
| $50,000 to $74,999 | 50 (30.7%) | 0 (0.0%) |
| $75,000 to $99,999 | 9 (5.5%) | 0 (0.0%) |
| $100,000 to $149,999 | 10 (6.1%) | 0 (0.0%) |
| $150,000 or more | 13 (8.0%) | 0 (0.0%) |
| Total | 163 (100.0%) | 0 (0.0%) |
Monthly Housing Cost Tiers in Millwood
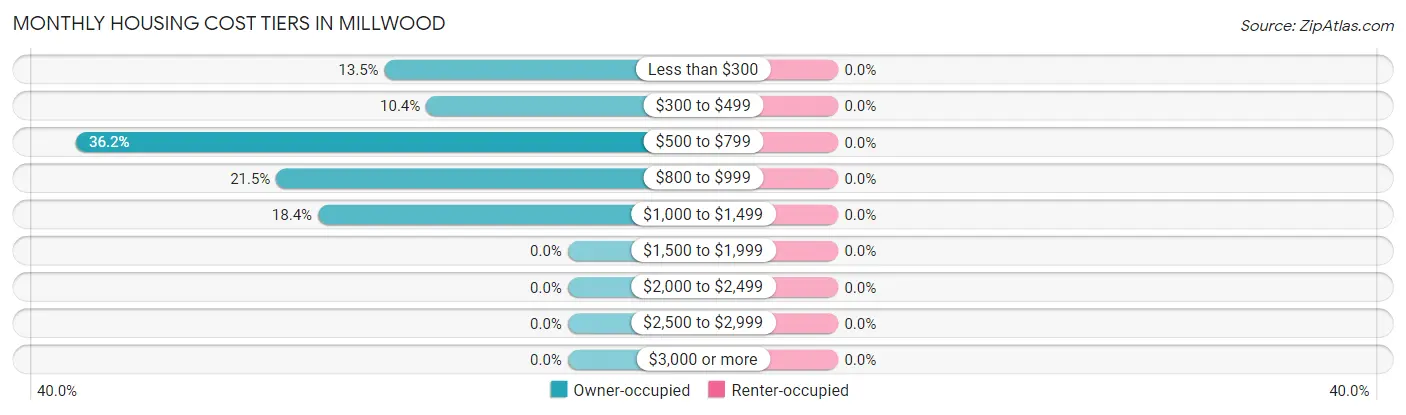
| Monthly Cost | Owner-occupied | Renter-occupied |
| Less than $300 | 22 (13.5%) | 0 (0.0%) |
| $300 to $499 | 17 (10.4%) | 0 (0.0%) |
| $500 to $799 | 59 (36.2%) | 0 (0.0%) |
| $800 to $999 | 35 (21.5%) | 0 (0.0%) |
| $1,000 to $1,499 | 30 (18.4%) | 0 (0.0%) |
| $1,500 to $1,999 | 0 (0.0%) | 0 (0.0%) |
| $2,000 to $2,499 | 0 (0.0%) | 0 (0.0%) |
| $2,500 to $2,999 | 0 (0.0%) | 0 (0.0%) |
| $3,000 or more | 0 (0.0%) | 0 (0.0%) |
| Total | 163 (100.0%) | 0 (0.0%) |
Physical Housing Characteristics in Millwood
Housing Structures in Millwood
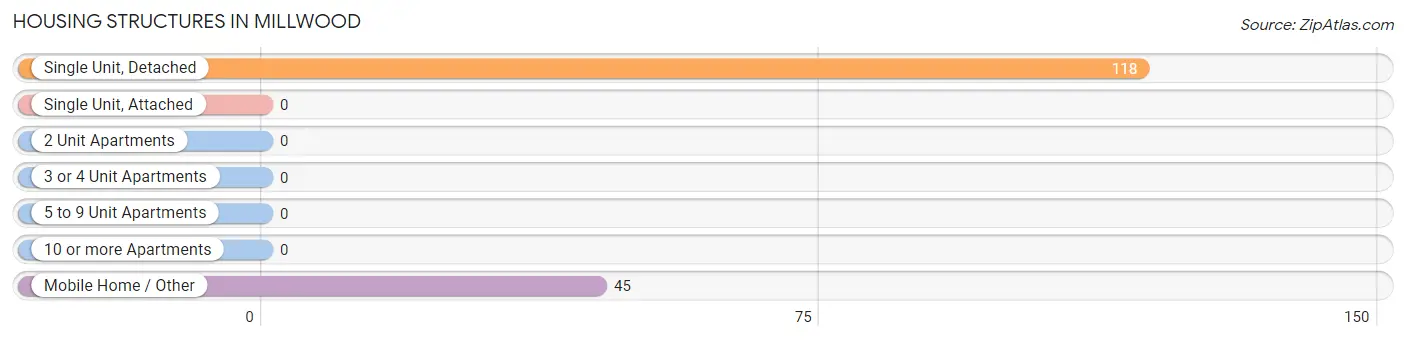
| Structure Type | # Housing Units | % Housing Units |
| Single Unit, Detached | 118 | 72.4% |
| Single Unit, Attached | 0 | 0.0% |
| 2 Unit Apartments | 0 | 0.0% |
| 3 or 4 Unit Apartments | 0 | 0.0% |
| 5 to 9 Unit Apartments | 0 | 0.0% |
| 10 or more Apartments | 0 | 0.0% |
| Mobile Home / Other | 45 | 27.6% |
| Total | 163 | 100.0% |
Housing Structures by Occupancy in Millwood
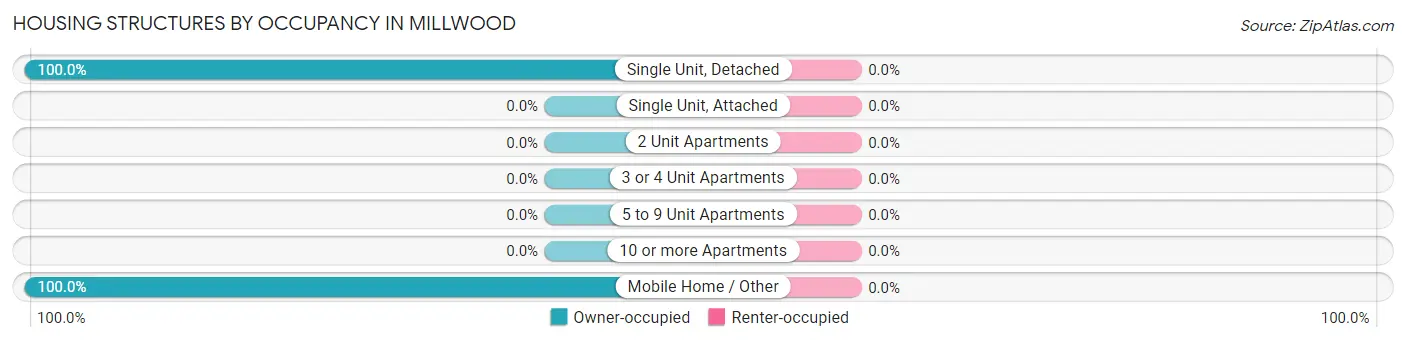
| Structure Type | Owner-occupied | Renter-occupied |
| Single Unit, Detached | 118 (100.0%) | 0 (0.0%) |
| Single Unit, Attached | 0 (0.0%) | 0 (0.0%) |
| 2 Unit Apartments | 0 (0.0%) | 0 (0.0%) |
| 3 or 4 Unit Apartments | 0 (0.0%) | 0 (0.0%) |
| 5 to 9 Unit Apartments | 0 (0.0%) | 0 (0.0%) |
| 10 or more Apartments | 0 (0.0%) | 0 (0.0%) |
| Mobile Home / Other | 45 (100.0%) | 0 (0.0%) |
| Total | 163 (100.0%) | 0 (0.0%) |
Housing Structures by Number of Rooms in Millwood
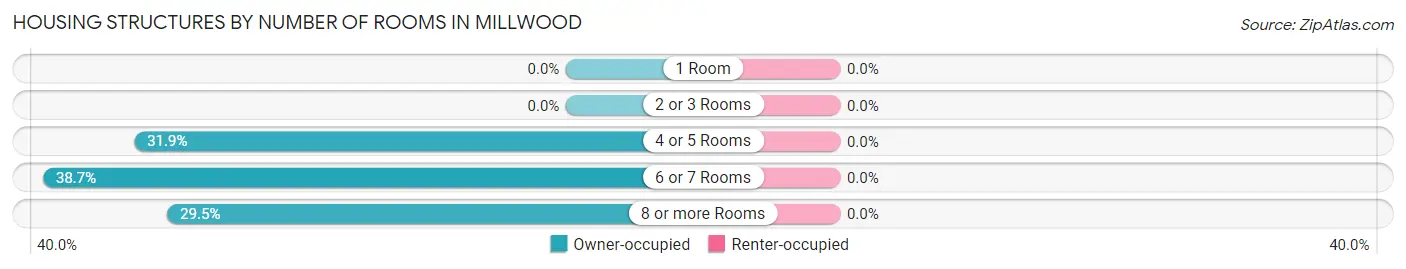
| Number of Rooms | Owner-occupied | Renter-occupied |
| 1 Room | 0 (0.0%) | 0 (0.0%) |
| 2 or 3 Rooms | 0 (0.0%) | 0 (0.0%) |
| 4 or 5 Rooms | 52 (31.9%) | 0 (0.0%) |
| 6 or 7 Rooms | 63 (38.7%) | 0 (0.0%) |
| 8 or more Rooms | 48 (29.4%) | 0 (0.0%) |
| Total | 163 (100.0%) | 0 (0.0%) |
Housing Structure by Heating Type in Millwood
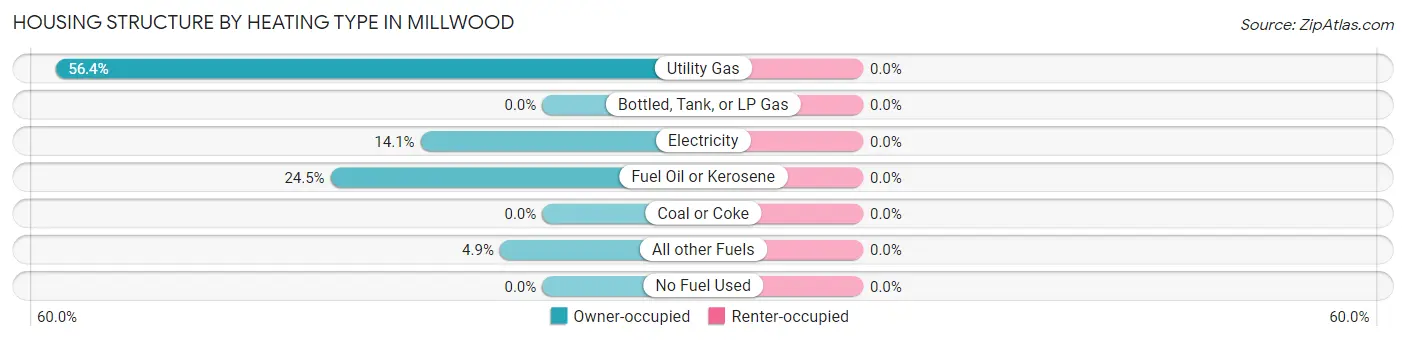
| Heating Type | Owner-occupied | Renter-occupied |
| Utility Gas | 92 (56.4%) | 0 (0.0%) |
| Bottled, Tank, or LP Gas | 0 (0.0%) | 0 (0.0%) |
| Electricity | 23 (14.1%) | 0 (0.0%) |
| Fuel Oil or Kerosene | 40 (24.5%) | 0 (0.0%) |
| Coal or Coke | 0 (0.0%) | 0 (0.0%) |
| All other Fuels | 8 (4.9%) | 0 (0.0%) |
| No Fuel Used | 0 (0.0%) | 0 (0.0%) |
| Total | 163 (100.0%) | 0 (0.0%) |
Household Vehicle Usage in Millwood
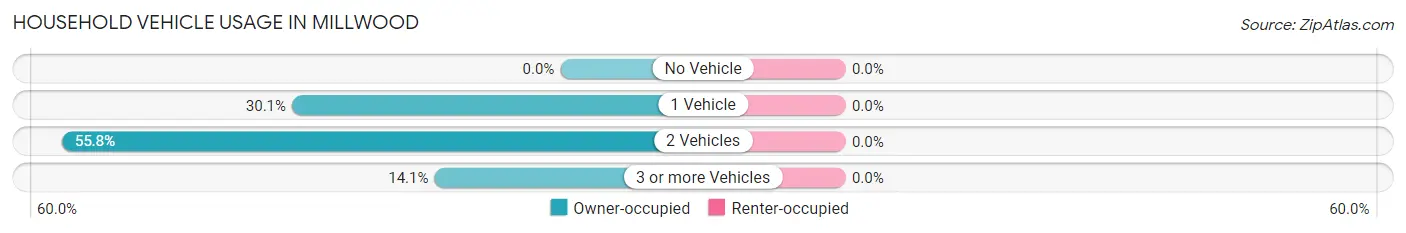
| Vehicles per Household | Owner-occupied | Renter-occupied |
| No Vehicle | 0 (0.0%) | 0 (0.0%) |
| 1 Vehicle | 49 (30.1%) | 0 (0.0%) |
| 2 Vehicles | 91 (55.8%) | 0 (0.0%) |
| 3 or more Vehicles | 23 (14.1%) | 0 (0.0%) |
| Total | 163 (100.0%) | 0 (0.0%) |
Real Estate & Mortgages in Millwood
Real Estate and Mortgage Overview in Millwood
| Characteristic | Without Mortgage | With Mortgage |
| Housing Units | 103 | 60 |
| Median Property Value | $155,600 | $127,800 |
| Median Household Income | $36,550 | $0 |
| Monthly Housing Costs | $625 | $0 |
| Real Estate Taxes | $1,920 | $0 |
Property Value by Mortgage Status in Millwood
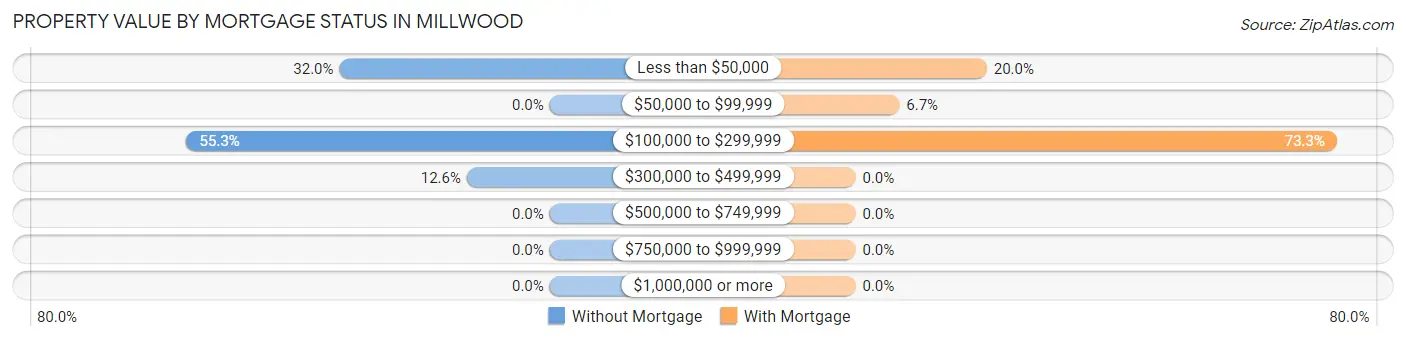
| Property Value | Without Mortgage | With Mortgage |
| Less than $50,000 | 33 (32.0%) | 12 (20.0%) |
| $50,000 to $99,999 | 0 (0.0%) | 4 (6.7%) |
| $100,000 to $299,999 | 57 (55.3%) | 44 (73.3%) |
| $300,000 to $499,999 | 13 (12.6%) | 0 (0.0%) |
| $500,000 to $749,999 | 0 (0.0%) | 0 (0.0%) |
| $750,000 to $999,999 | 0 (0.0%) | 0 (0.0%) |
| $1,000,000 or more | 0 (0.0%) | 0 (0.0%) |
| Total | 103 (100.0%) | 60 (100.0%) |
Household Income by Mortgage Status in Millwood
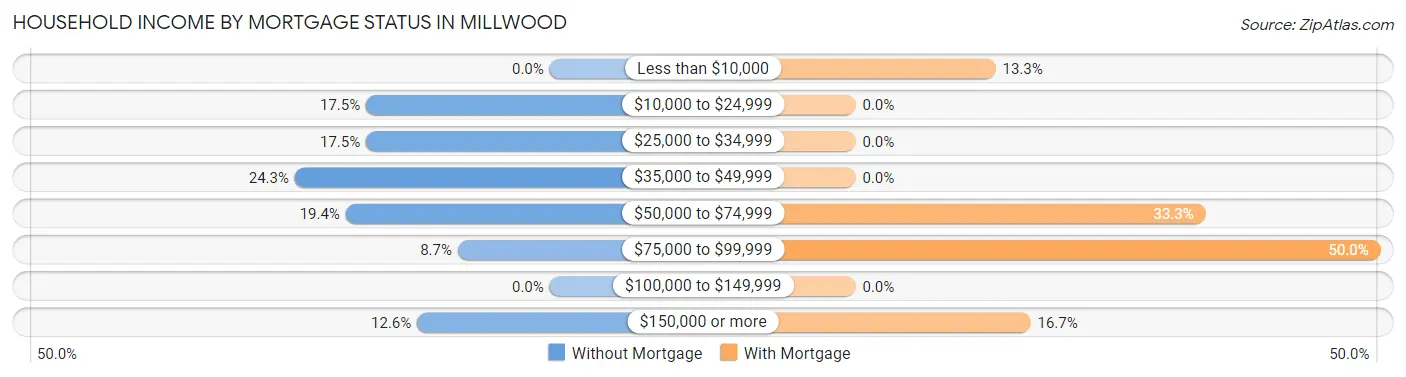
| Household Income | Without Mortgage | With Mortgage |
| Less than $10,000 | 0 (0.0%) | 8 (13.3%) |
| $10,000 to $24,999 | 18 (17.5%) | 0 (0.0%) |
| $25,000 to $34,999 | 18 (17.5%) | 0 (0.0%) |
| $35,000 to $49,999 | 25 (24.3%) | 0 (0.0%) |
| $50,000 to $74,999 | 20 (19.4%) | 20 (33.3%) |
| $75,000 to $99,999 | 9 (8.7%) | 30 (50.0%) |
| $100,000 to $149,999 | 0 (0.0%) | 0 (0.0%) |
| $150,000 or more | 13 (12.6%) | 10 (16.7%) |
| Total | 103 (100.0%) | 60 (100.0%) |
Property Value to Household Income Ratio in Millwood
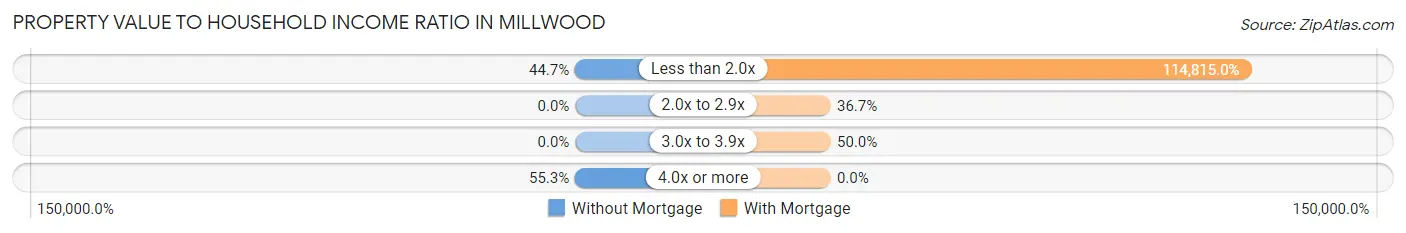
| Value-to-Income Ratio | Without Mortgage | With Mortgage |
| Less than 2.0x | 46 (44.7%) | 68,889 (114,815.0%) |
| 2.0x to 2.9x | 0 (0.0%) | 22 (36.7%) |
| 3.0x to 3.9x | 0 (0.0%) | 30 (50.0%) |
| 4.0x or more | 57 (55.3%) | 0 (0.0%) |
| Total | 103 (100.0%) | 60 (100.0%) |
Real Estate Taxes by Mortgage Status in Millwood
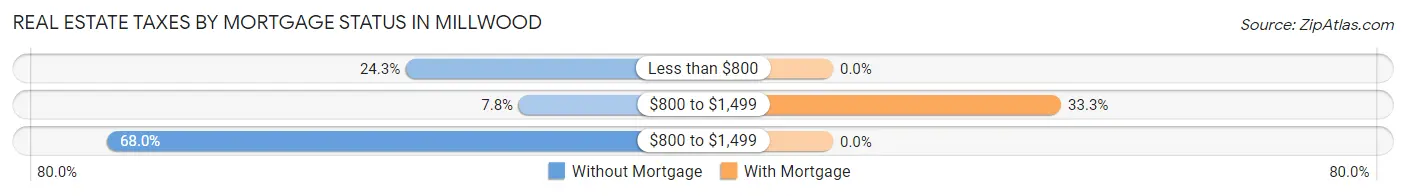
| Property Taxes | Without Mortgage | With Mortgage |
| Less than $800 | 25 (24.3%) | 0 (0.0%) |
| $800 to $1,499 | 8 (7.8%) | 20 (33.3%) |
| $800 to $1,499 | 70 (68.0%) | 0 (0.0%) |
| Total | 103 (100.0%) | 60 (100.0%) |
Health & Disability in Millwood
Health Insurance Coverage by Age in Millwood
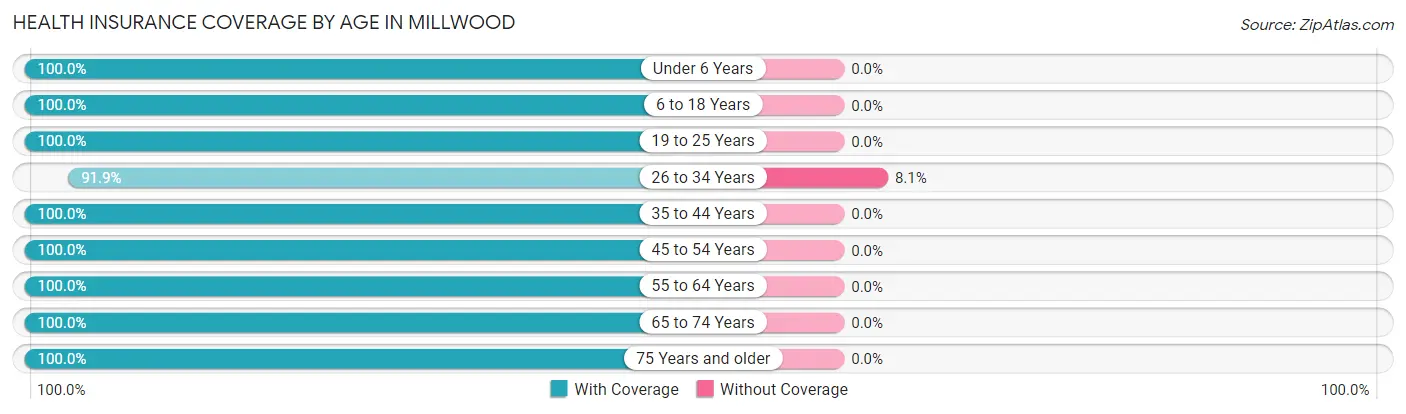
| Age Bracket | With Coverage | Without Coverage |
| Under 6 Years | 26 (100.0%) | 0 (0.0%) |
| 6 to 18 Years | 34 (100.0%) | 0 (0.0%) |
| 19 to 25 Years | 7 (100.0%) | 0 (0.0%) |
| 26 to 34 Years | 79 (91.9%) | 7 (8.1%) |
| 35 to 44 Years | 25 (100.0%) | 0 (0.0%) |
| 45 to 54 Years | 46 (100.0%) | 0 (0.0%) |
| 55 to 64 Years | 51 (100.0%) | 0 (0.0%) |
| 65 to 74 Years | 66 (100.0%) | 0 (0.0%) |
| 75 Years and older | 46 (100.0%) | 0 (0.0%) |
| Total | 380 (98.2%) | 7 (1.8%) |
Health Insurance Coverage by Citizenship Status in Millwood
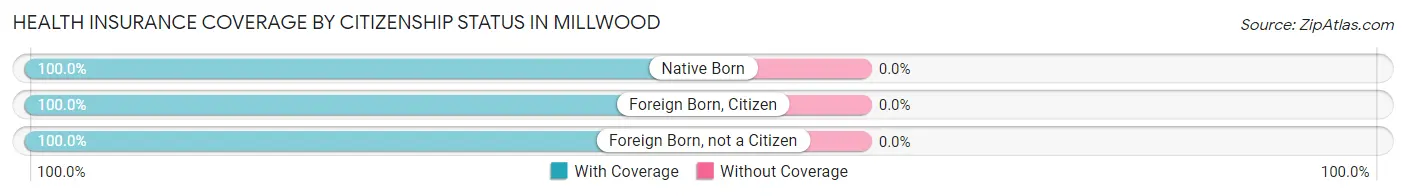
| Citizenship Status | With Coverage | Without Coverage |
| Native Born | 26 (100.0%) | 0 (0.0%) |
| Foreign Born, Citizen | 34 (100.0%) | 0 (0.0%) |
| Foreign Born, not a Citizen | 7 (100.0%) | 0 (0.0%) |
Health Insurance Coverage by Household Income in Millwood
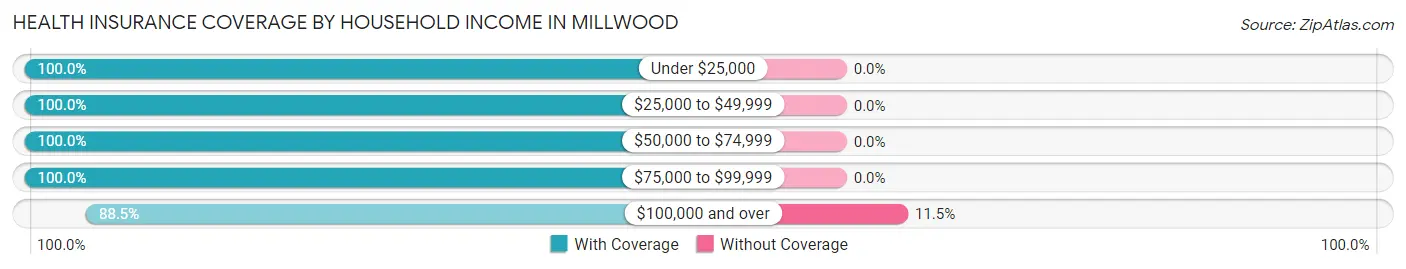
| Household Income | With Coverage | Without Coverage |
| Under $25,000 | 38 (100.0%) | 0 (0.0%) |
| $25,000 to $49,999 | 125 (100.0%) | 0 (0.0%) |
| $50,000 to $74,999 | 137 (100.0%) | 0 (0.0%) |
| $75,000 to $99,999 | 26 (100.0%) | 0 (0.0%) |
| $100,000 and over | 54 (88.5%) | 7 (11.5%) |
Public vs Private Health Insurance Coverage by Age in Millwood
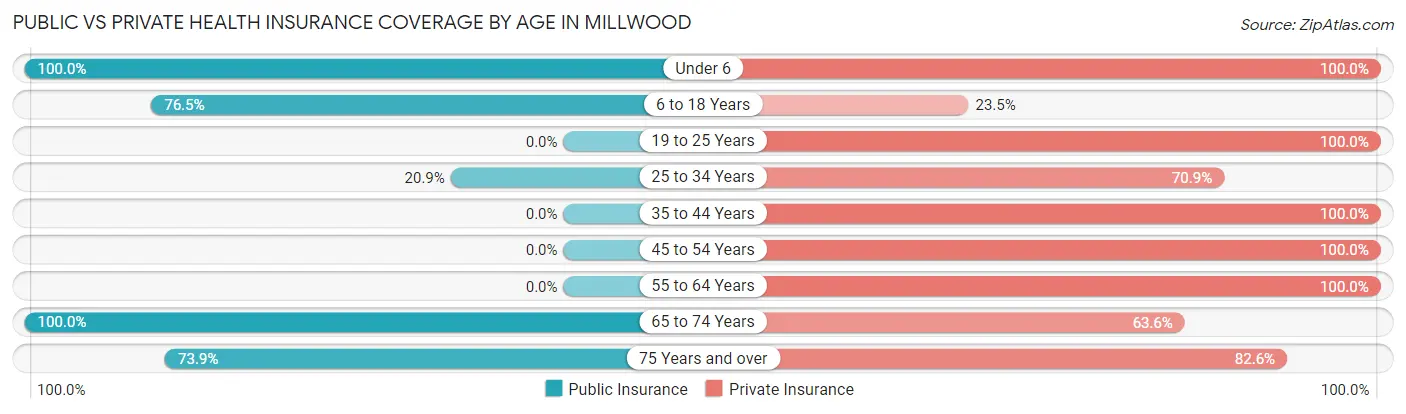
| Age Bracket | Public Insurance | Private Insurance |
| Under 6 | 26 (100.0%) | 26 (100.0%) |
| 6 to 18 Years | 26 (76.5%) | 8 (23.5%) |
| 19 to 25 Years | 0 (0.0%) | 7 (100.0%) |
| 25 to 34 Years | 18 (20.9%) | 61 (70.9%) |
| 35 to 44 Years | 0 (0.0%) | 25 (100.0%) |
| 45 to 54 Years | 0 (0.0%) | 46 (100.0%) |
| 55 to 64 Years | 0 (0.0%) | 51 (100.0%) |
| 65 to 74 Years | 66 (100.0%) | 42 (63.6%) |
| 75 Years and over | 34 (73.9%) | 38 (82.6%) |
| Total | 170 (43.9%) | 304 (78.5%) |
Disability Status by Sex by Age in Millwood
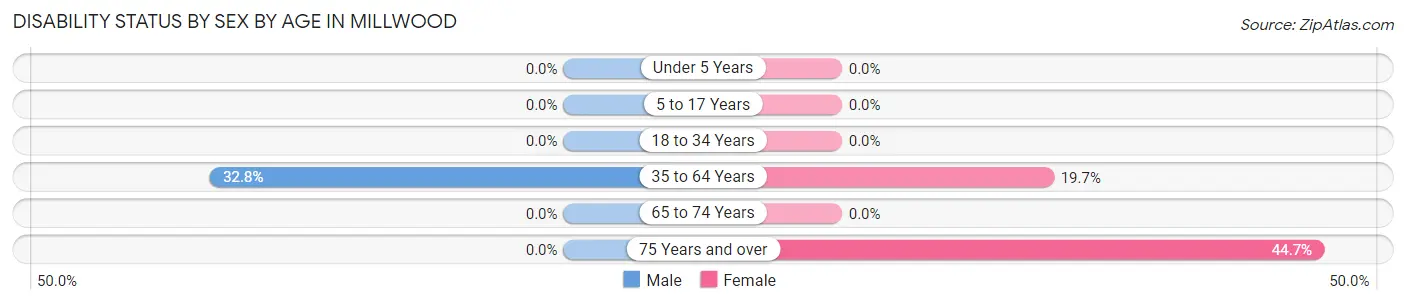
| Age Bracket | Male | Female |
| Under 5 Years | 0 (0.0%) | 0 (0.0%) |
| 5 to 17 Years | 0 (0.0%) | 0 (0.0%) |
| 18 to 34 Years | 0 (0.0%) | 0 (0.0%) |
| 35 to 64 Years | 20 (32.8%) | 12 (19.7%) |
| 65 to 74 Years | 0 (0.0%) | 0 (0.0%) |
| 75 Years and over | 0 (0.0%) | 17 (44.7%) |
Disability Class by Sex by Age in Millwood
Disability Class: Hearing Difficulty
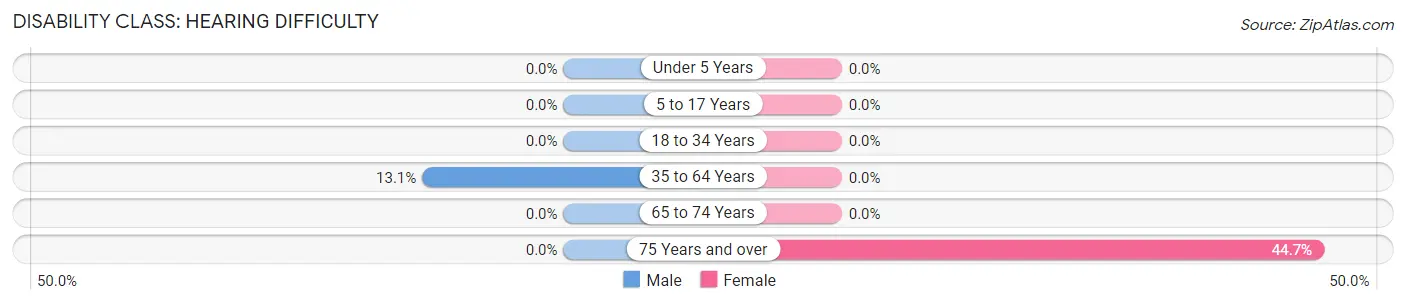
| Age Bracket | Male | Female |
| Under 5 Years | 0 (0.0%) | 0 (0.0%) |
| 5 to 17 Years | 0 (0.0%) | 0 (0.0%) |
| 18 to 34 Years | 0 (0.0%) | 0 (0.0%) |
| 35 to 64 Years | 8 (13.1%) | 0 (0.0%) |
| 65 to 74 Years | 0 (0.0%) | 0 (0.0%) |
| 75 Years and over | 0 (0.0%) | 17 (44.7%) |
Disability Class: Vision Difficulty
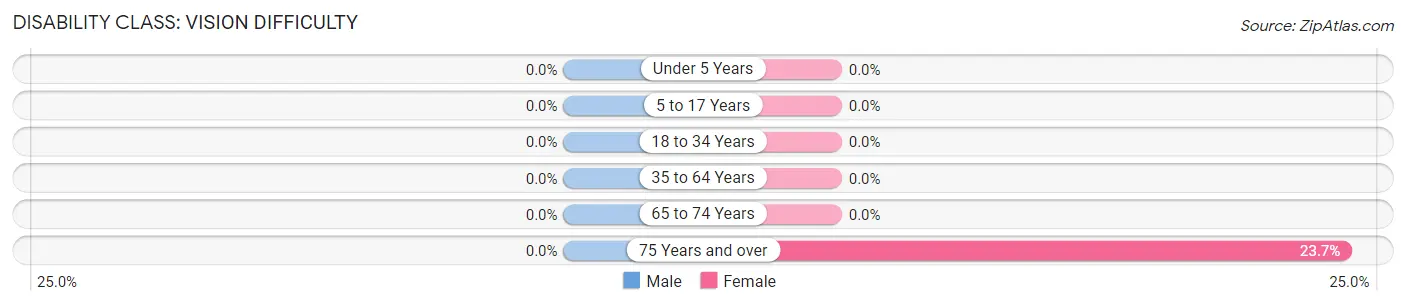
| Age Bracket | Male | Female |
| Under 5 Years | 0 (0.0%) | 0 (0.0%) |
| 5 to 17 Years | 0 (0.0%) | 0 (0.0%) |
| 18 to 34 Years | 0 (0.0%) | 0 (0.0%) |
| 35 to 64 Years | 0 (0.0%) | 0 (0.0%) |
| 65 to 74 Years | 0 (0.0%) | 0 (0.0%) |
| 75 Years and over | 0 (0.0%) | 9 (23.7%) |
Disability Class: Cognitive Difficulty
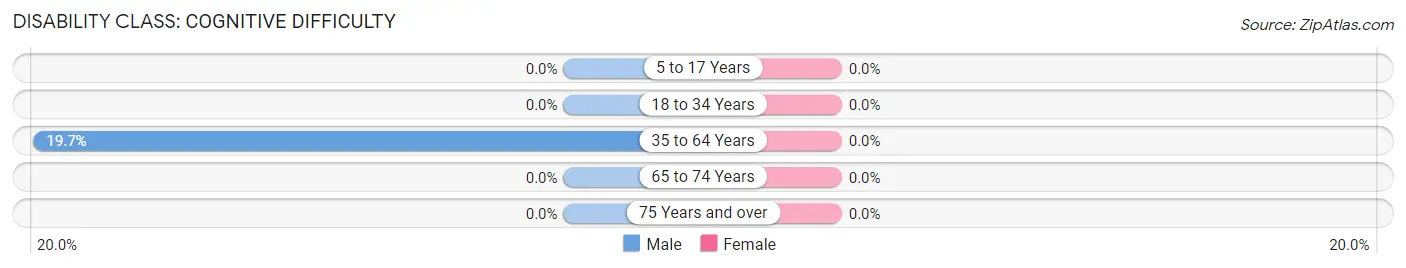
| Age Bracket | Male | Female |
| 5 to 17 Years | 0 (0.0%) | 0 (0.0%) |
| 18 to 34 Years | 0 (0.0%) | 0 (0.0%) |
| 35 to 64 Years | 12 (19.7%) | 0 (0.0%) |
| 65 to 74 Years | 0 (0.0%) | 0 (0.0%) |
| 75 Years and over | 0 (0.0%) | 0 (0.0%) |
Disability Class: Ambulatory Difficulty
| Age Bracket | Male | Female |
| 5 to 17 Years | 0 (0.0%) | 0 (0.0%) |
| 18 to 34 Years | 0 (0.0%) | 0 (0.0%) |
| 35 to 64 Years | 0 (0.0%) | 12 (19.7%) |
| 65 to 74 Years | 0 (0.0%) | 0 (0.0%) |
| 75 Years and over | 0 (0.0%) | 8 (21.0%) |
Disability Class: Self-Care Difficulty
| Age Bracket | Male | Female |
| 5 to 17 Years | 0 (0.0%) | 0 (0.0%) |
| 18 to 34 Years | 0 (0.0%) | 0 (0.0%) |
| 35 to 64 Years | 0 (0.0%) | 0 (0.0%) |
| 65 to 74 Years | 0 (0.0%) | 0 (0.0%) |
| 75 Years and over | 0 (0.0%) | 0 (0.0%) |
Technology Access in Millwood
Computing Device Access in Millwood
| Device Type | # Households | % Households |
| Desktop or Laptop | 100 | 61.4% |
| Smartphone | 117 | 71.8% |
| Tablet | 107 | 65.6% |
| No Computing Device | 37 | 22.7% |
| Total | 163 | 100.0% |
Internet Access in Millwood
| Internet Type | # Households | % Households |
| Dial-Up Internet | 0 | 0.0% |
| Broadband Home | 75 | 46.0% |
| Cellular Data Only | 21 | 12.9% |
| Satellite Internet | 0 | 0.0% |
| No Internet | 67 | 41.1% |
| Total | 163 | 100.0% |
Millwood Summary
Millwood, Pennsylvania is a small borough located in the southeastern corner of Lancaster County. It is situated along the banks of the Conestoga River, and is bordered by the townships of East Lampeter, West Lampeter, and East Earl. The population of Millwood was 1,845 as of the 2010 census.
History
Millwood was first settled in 1730 by a group of Mennonites from Germany. The town was originally known as “Millersville”, after the Miller family who owned the land. In 1845, the name was changed to Millwood. The town was officially incorporated in 1867.
Millwood was an important stop on the Underground Railroad, and was home to several prominent abolitionists. The town was also the site of a major Civil War battle in 1863, when Confederate troops attempted to cross the Conestoga River. The Union forces were able to repel the attack, and the town was spared from destruction.
Geography
Millwood is located at 40°7'17"N 76°14'45"W (40.1214, -76.2458). It has a total area of 0.7 square miles, all of which is land. The town is situated along the banks of the Conestoga River, and is bordered by the townships of East Lampeter, West Lampeter, and East Earl.
The climate in Millwood is characterized by hot, humid summers and cold, wet winters. The average annual temperature is 54°F, and the average annual precipitation is 43 inches.
Economy
The economy of Millwood is largely based on agriculture. The town is home to several farms, which produce a variety of crops, including corn, soybeans, wheat, and hay. The town is also home to several small businesses, including a hardware store, a grocery store, and a restaurant.
Demographics
As of the 2010 census, the population of Millwood was 1,845. The racial makeup of the town was 95.3% White, 1.2% African American, 0.2% Native American, 0.7% Asian, 0.1% Pacific Islander, 0.7% from other races, and 1.9% from two or more races. Hispanic or Latino of any race were 2.2% of the population.
The median income for a household in Millwood was $50,938, and the median income for a family was $60,000. The per capita income for the town was $22,845. About 4.3% of families and 5.7% of the population were below the poverty line, including 6.3% of those under age 18 and 4.2% of those age 65 or over.
Common Questions
What is Per Capita Income in Millwood?
Per Capita income in Millwood is $31,432.
What is the Median Family Income in Millwood?
Median Family Income in Millwood is $43,750.
What is the Median Household income in Millwood?
Median Household Income in Millwood is $57,656.
What is Income or Wage Gap in Millwood?
Income or Wage Gap in Millwood is 40.8%.
Women in Millwood earn 59.2 cents for every dollar earned by a man.
What is Inequality or Gini Index in Millwood?
Inequality or Gini Index in Millwood is 0.42.
What is the Total Population of Millwood?
Total Population of Millwood is 387.
What is the Total Male Population of Millwood?
Total Male Population of Millwood is 190.
What is the Total Female Population of Millwood?
Total Female Population of Millwood is 197.
What is the Ratio of Males per 100 Females in Millwood?
There are 96.45 Males per 100 Females in Millwood.
What is the Ratio of Females per 100 Males in Millwood?
There are 103.68 Females per 100 Males in Millwood.
What is the Median Population Age in Millwood?
Median Population Age in Millwood is 48.4 Years.
What is the Average Family Size in Millwood
Average Family Size in Millwood is 2.5 People.
What is the Average Household Size in Millwood
Average Household Size in Millwood is 2.4 People.
How Large is the Labor Force in Millwood?
There are 186 People in the Labor Forcein in Millwood.
What is the Percentage of People in the Labor Force in Millwood?
56.9% of People are in the Labor Force in Millwood.
What is the Unemployment Rate in Millwood?
Unemployment Rate in Millwood is 12.4%.