State College borough, PA Map & Demographics
State College borough Overview
$23,979
PER CAPITA INCOME
$124,456
AVG FAMILY INCOME
$43,459
AVG HOUSEHOLD INCOME
29.9%
WAGE / INCOME GAP [ % ]
70.1¢/ $1
WAGE / INCOME GAP [ $ ]
0.55
INEQUALITY / GINI INDEX
40,902
TOTAL POPULATION
22,203
MALE POPULATION
18,699
FEMALE POPULATION
118.74
MALES / 100 FEMALES
84.22
FEMALES / 100 MALES
21.4
MEDIAN AGE
2.9
AVG FAMILY SIZE
2.4
AVG HOUSEHOLD SIZE
16,998
LABOR FORCE [ PEOPLE ]
43.9%
PERCENT IN LABOR FORCE
3.9%
UNEMPLOYMENT RATE
Income in State College borough
Income Overview in State College borough
Per Capita Income in State College borough is $23,979, while median incomes of families and households are $124,456 and $43,459 respectively.
| Characteristic | Number | Measure |
| Per Capita Income | 40,902 | $23,979 |
| Median Family Income | 3,353 | $124,456 |
| Mean Family Income | 3,353 | $144,639 |
| Median Household Income | 11,357 | $43,459 |
| Mean Household Income | 11,357 | $73,256 |
| Income Deficit | 3,353 | $0 |
| Wage / Income Gap (%) | 40,902 | 29.88% |
| Wage / Income Gap ($) | 40,902 | 70.12¢ per $1 |
| Gini / Inequality Index | 40,902 | 0.55 |
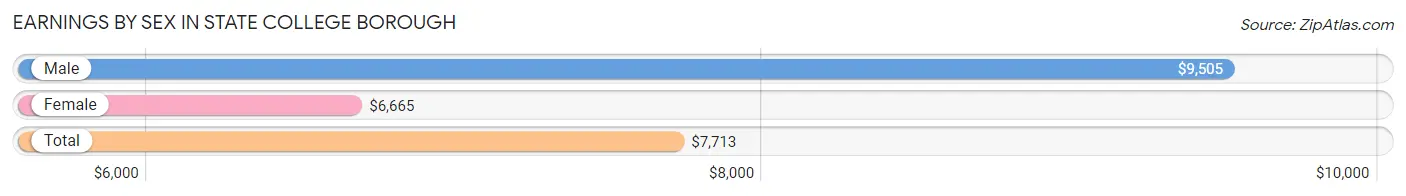
Earnings by Sex in State College borough
Average Earnings in State College borough are $7,713, $9,505 for men and $6,665 for women, a difference of 29.9%.
| Sex | Number | Average Earnings |
| Male | 14,937 (54.5%) | $9,505 |
| Female | 12,481 (45.5%) | $6,665 |
| Total | 27,418 (100.0%) | $7,713 |
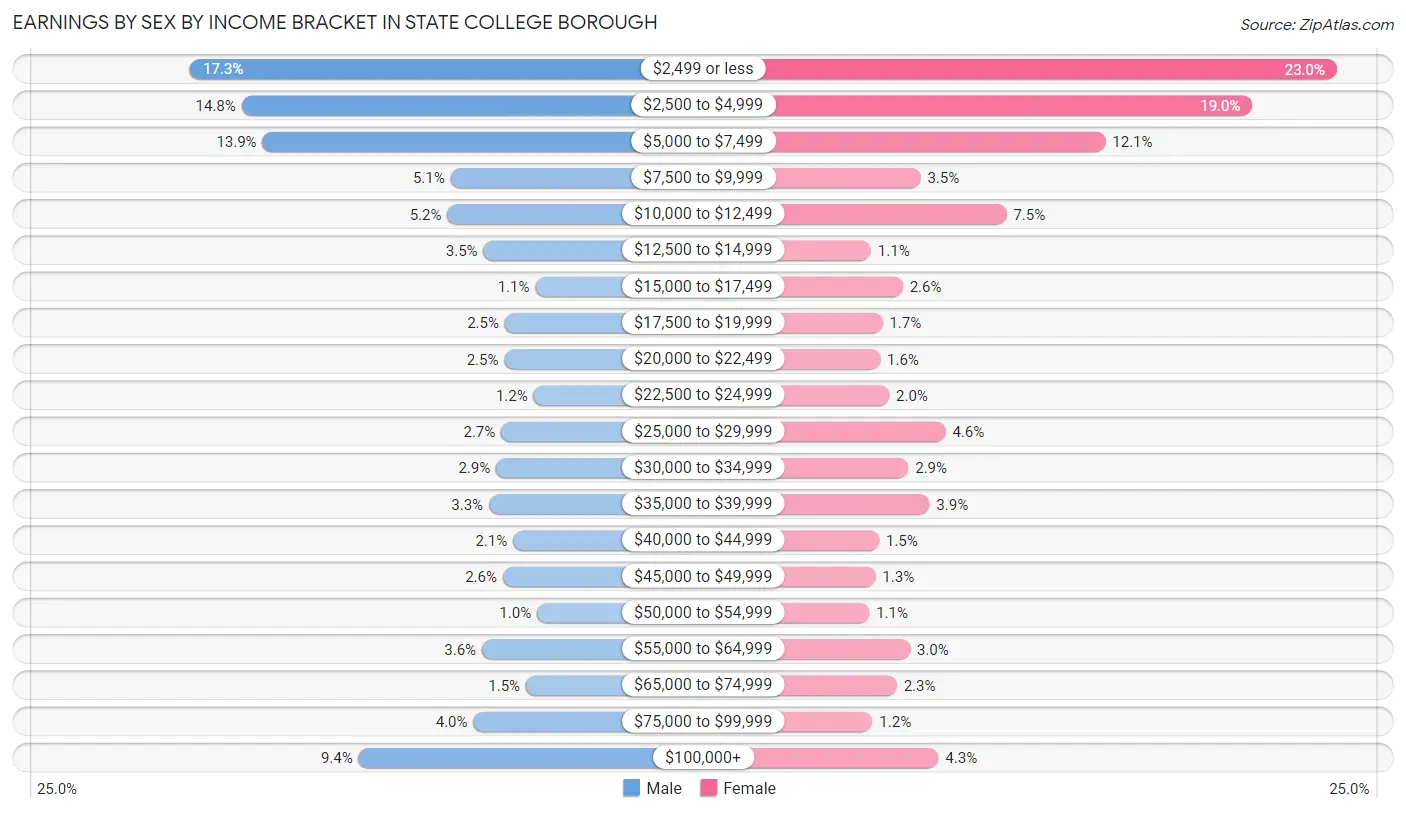
Earnings by Sex by Income Bracket in State College borough
The most common earnings brackets in State College borough are $2,499 or less for men (2,576 | 17.2%) and $2,499 or less for women (2,864 | 23.0%).
| Income | Male | Female |
| $2,499 or less | 2,576 (17.2%) | 2,864 (23.0%) |
| $2,500 to $4,999 | 2,217 (14.8%) | 2,370 (19.0%) |
| $5,000 to $7,499 | 2,070 (13.9%) | 1,511 (12.1%) |
| $7,500 to $9,999 | 755 (5.1%) | 431 (3.5%) |
| $10,000 to $12,499 | 777 (5.2%) | 934 (7.5%) |
| $12,500 to $14,999 | 525 (3.5%) | 141 (1.1%) |
| $15,000 to $17,499 | 161 (1.1%) | 327 (2.6%) |
| $17,500 to $19,999 | 375 (2.5%) | 208 (1.7%) |
| $20,000 to $22,499 | 378 (2.5%) | 195 (1.6%) |
| $22,500 to $24,999 | 173 (1.2%) | 247 (2.0%) |
| $25,000 to $29,999 | 401 (2.7%) | 577 (4.6%) |
| $30,000 to $34,999 | 436 (2.9%) | 359 (2.9%) |
| $35,000 to $39,999 | 486 (3.3%) | 483 (3.9%) |
| $40,000 to $44,999 | 316 (2.1%) | 189 (1.5%) |
| $45,000 to $49,999 | 388 (2.6%) | 167 (1.3%) |
| $50,000 to $54,999 | 150 (1.0%) | 131 (1.1%) |
| $55,000 to $64,999 | 534 (3.6%) | 369 (3.0%) |
| $65,000 to $74,999 | 227 (1.5%) | 292 (2.3%) |
| $75,000 to $99,999 | 594 (4.0%) | 150 (1.2%) |
| $100,000+ | 1,398 (9.4%) | 536 (4.3%) |
| Total | 14,937 (100.0%) | 12,481 (100.0%) |
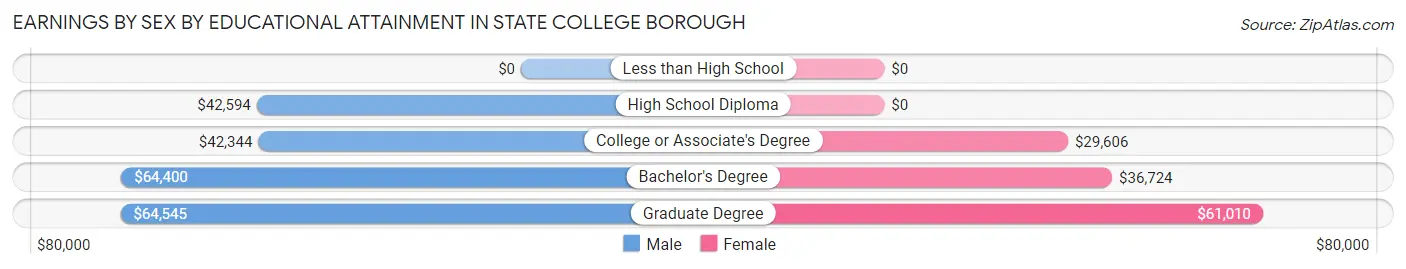
Earnings by Sex by Educational Attainment in State College borough
Average earnings in State College borough are $56,040 for men and $39,747 for women, a difference of 29.1%. Men with an educational attainment of graduate degree enjoy the highest average annual earnings of $64,545, while those with college or associate's degree education earn the least with $42,344. Women with an educational attainment of graduate degree earn the most with the average annual earnings of $61,010, while those with college or associate's degree education have the smallest earnings of $29,606.
| Educational Attainment | Male Income | Female Income |
| Less than High School | - | - |
| High School Diploma | $42,594 | $0 |
| College or Associate's Degree | $42,344 | $29,606 |
| Bachelor's Degree | $64,400 | $36,724 |
| Graduate Degree | $64,545 | $61,010 |
| Total | $56,040 | $39,747 |
Family Income in State College borough
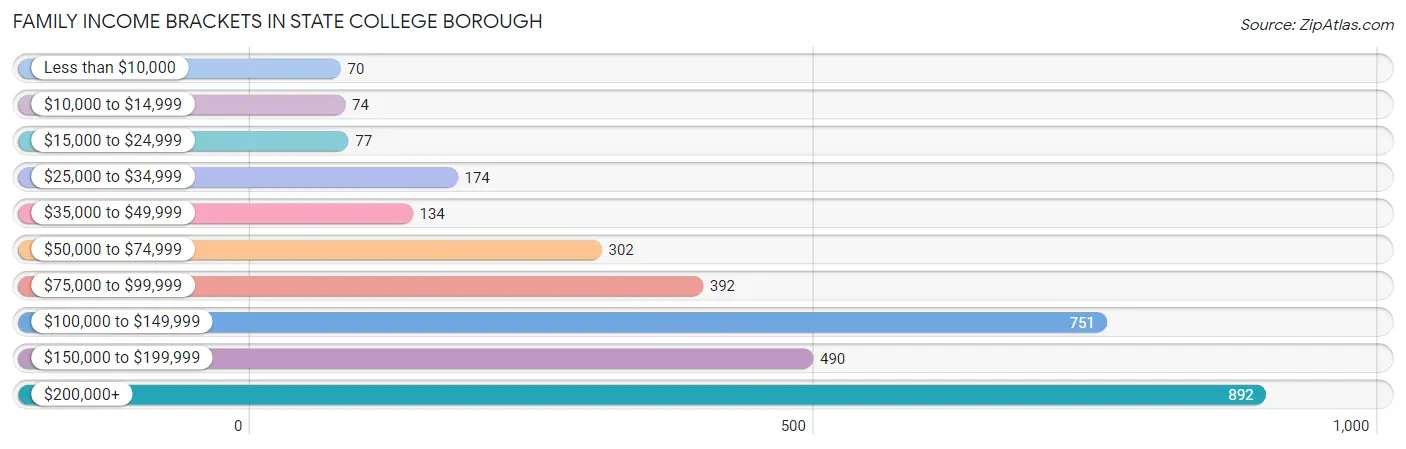
Family Income Brackets in State College borough
According to the State College borough family income data, there are 892 families falling into the $200,000+ income range, which is the most common income bracket and makes up 26.6% of all families. Conversely, the less than $10,000 income bracket is the least frequent group with only 70 families (2.1%) belonging to this category.
| Income Bracket | # Families | % Families |
| Less than $10,000 | 70 | 2.1% |
| $10,000 to $14,999 | 74 | 2.2% |
| $15,000 to $24,999 | 77 | 2.3% |
| $25,000 to $34,999 | 174 | 5.2% |
| $35,000 to $49,999 | 134 | 4.0% |
| $50,000 to $74,999 | 302 | 9.0% |
| $75,000 to $99,999 | 392 | 11.7% |
| $100,000 to $149,999 | 751 | 22.4% |
| $150,000 to $199,999 | 490 | 14.6% |
| $200,000+ | 892 | 26.6% |
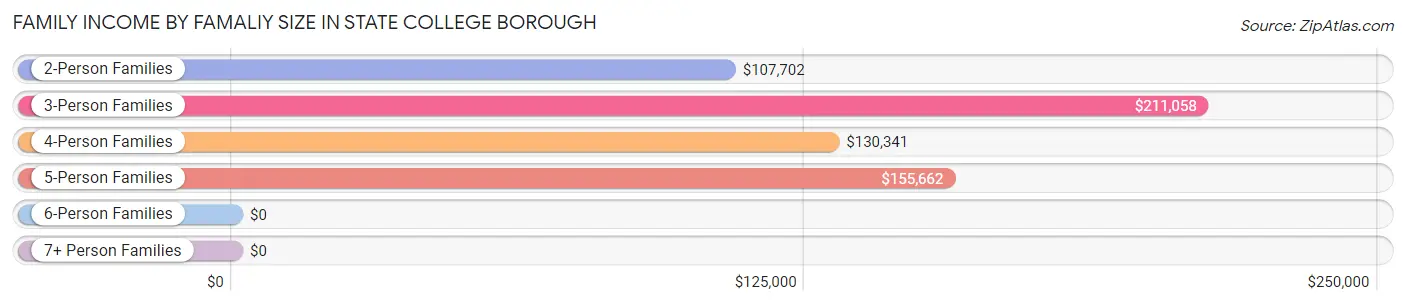
Family Income by Famaliy Size in State College borough
3-person families (661 | 19.7%) account for the highest median family income in State College borough with $211,058 per family, while 3-person families (661 | 19.7%) have the highest median income of $70,353 per family member.
| Income Bracket | # Families | Median Income |
| 2-Person Families | 1,769 (52.8%) | $107,702 |
| 3-Person Families | 661 (19.7%) | $211,058 |
| 4-Person Families | 729 (21.7%) | $130,341 |
| 5-Person Families | 135 (4.0%) | $155,662 |
| 6-Person Families | 11 (0.3%) | $0 |
| 7+ Person Families | 48 (1.4%) | $0 |
| Total | 3,353 (100.0%) | $124,456 |
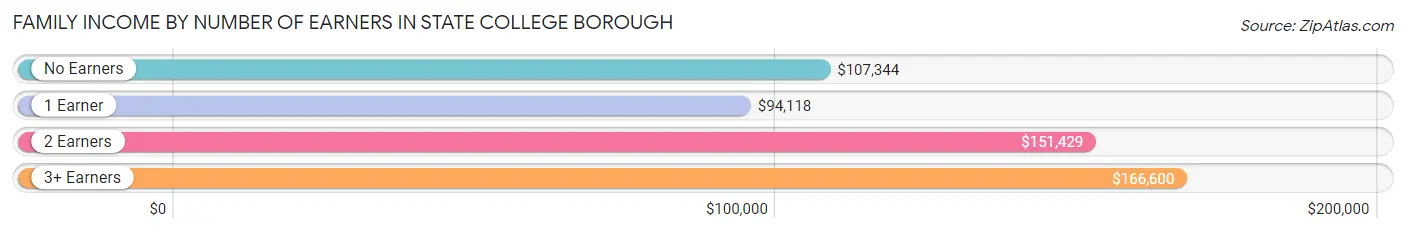
Family Income by Number of Earners in State College borough
The median family income in State College borough is $124,456, with families comprising 3+ earners (262) having the highest median family income of $166,600, while families with 1 earner (1,042) have the lowest median family income of $94,118, accounting for 7.8% and 31.1% of families, respectively.
| Number of Earners | # Families | Median Income |
| No Earners | 367 (11.0%) | $107,344 |
| 1 Earner | 1,042 (31.1%) | $94,118 |
| 2 Earners | 1,682 (50.2%) | $151,429 |
| 3+ Earners | 262 (7.8%) | $166,600 |
| Total | 3,353 (100.0%) | $124,456 |
Household Income in State College borough
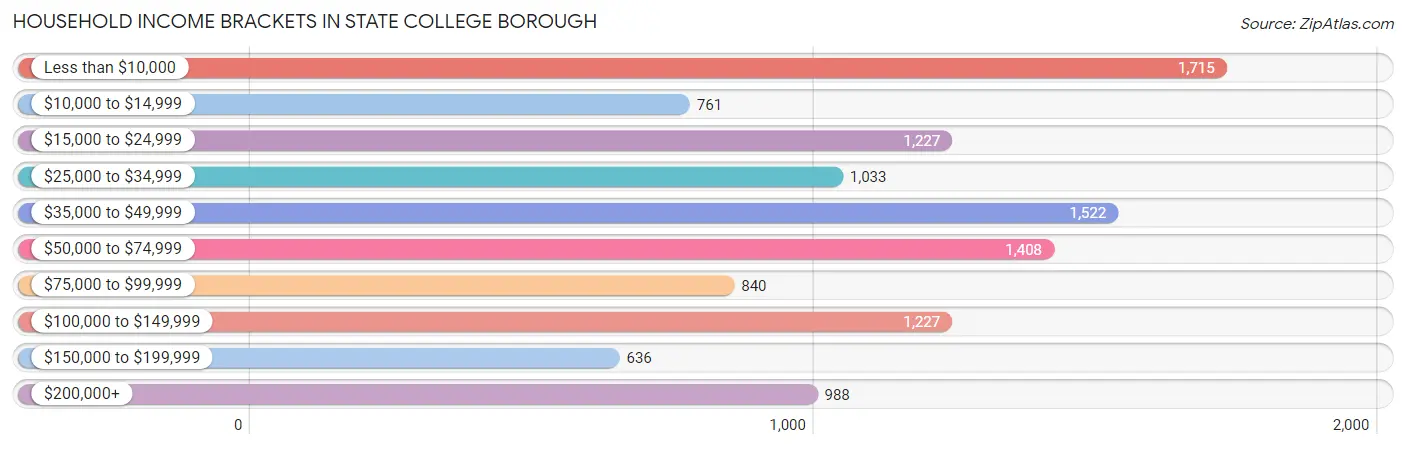
Household Income Brackets in State College borough
With 1,715 households falling in the category, the less than $10,000 income range is the most frequent in State College borough, accounting for 15.1% of all households. In contrast, only 636 households (5.6%) fall into the $150,000 to $199,999 income bracket, making it the least populous group.
| Income Bracket | # Households | % Households |
| Less than $10,000 | 1,715 | 15.1% |
| $10,000 to $14,999 | 761 | 6.7% |
| $15,000 to $24,999 | 1,227 | 10.8% |
| $25,000 to $34,999 | 1,033 | 9.1% |
| $35,000 to $49,999 | 1,522 | 13.4% |
| $50,000 to $74,999 | 1,408 | 12.4% |
| $75,000 to $99,999 | 840 | 7.4% |
| $100,000 to $149,999 | 1,227 | 10.8% |
| $150,000 to $199,999 | 636 | 5.6% |
| $200,000+ | 988 | 8.7% |
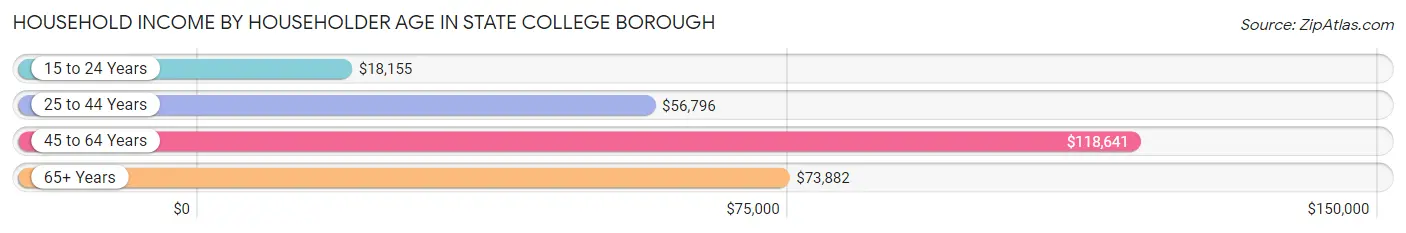
Household Income by Householder Age in State College borough
The median household income in State College borough is $43,459, with the highest median household income of $118,641 found in the 45 to 64 years age bracket for the primary householder. A total of 2,147 households (18.9%) fall into this category. Meanwhile, the 15 to 24 years age bracket for the primary householder has the lowest median household income of $18,155, with 4,114 households (36.2%) in this group.
| Income Bracket | # Households | Median Income |
| 15 to 24 Years | 4,114 (36.2%) | $18,155 |
| 25 to 44 Years | 3,555 (31.3%) | $56,796 |
| 45 to 64 Years | 2,147 (18.9%) | $118,641 |
| 65+ Years | 1,541 (13.6%) | $73,882 |
| Total | 11,357 (100.0%) | $43,459 |
Poverty in State College borough
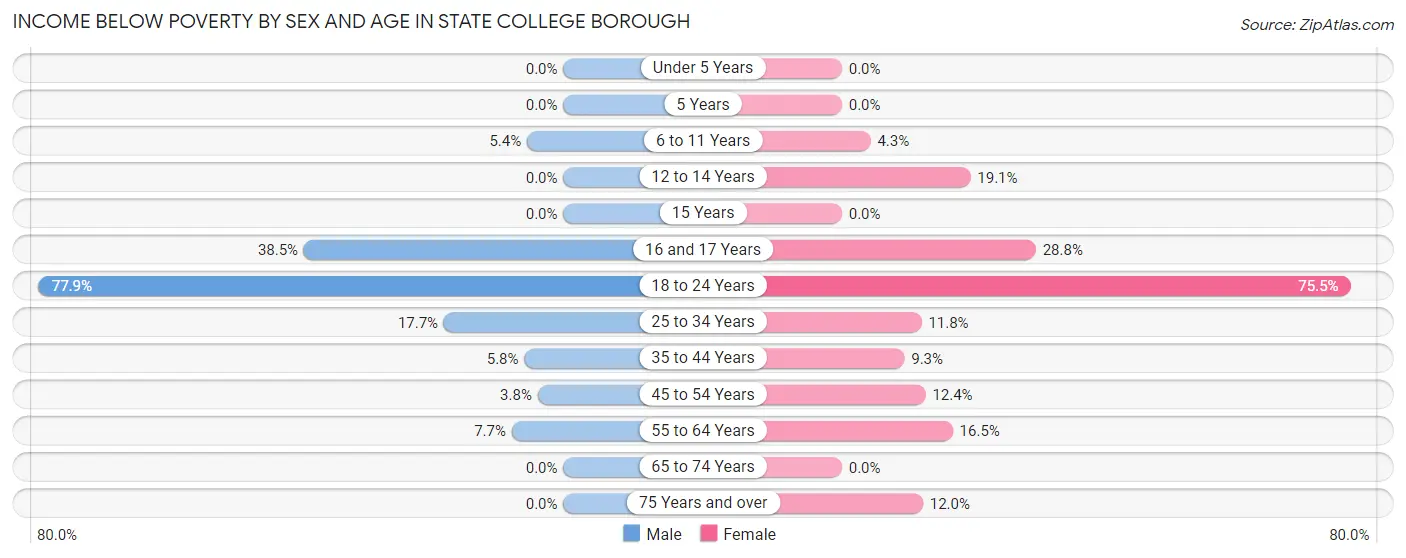
Income Below Poverty by Sex and Age in State College borough
With 42.2% poverty level for males and 42.0% for females among the residents of State College borough, 18 to 24 year old males and 18 to 24 year old females are the most vulnerable to poverty, with 5,700 males (77.9%) and 4,543 females (75.5%) in their respective age groups living below the poverty level.
| Age Bracket | Male | Female |
| Under 5 Years | 0 (0.0%) | 0 (0.0%) |
| 5 Years | 0 (0.0%) | 0 (0.0%) |
| 6 to 11 Years | 18 (5.4%) | 16 (4.3%) |
| 12 to 14 Years | 0 (0.0%) | 21 (19.1%) |
| 15 Years | 0 (0.0%) | 0 (0.0%) |
| 16 and 17 Years | 47 (38.5%) | 36 (28.8%) |
| 18 to 24 Years | 5,700 (77.9%) | 4,543 (75.5%) |
| 25 to 34 Years | 450 (17.7%) | 200 (11.8%) |
| 35 to 44 Years | 62 (5.8%) | 75 (9.3%) |
| 45 to 54 Years | 32 (3.8%) | 94 (12.4%) |
| 55 to 64 Years | 66 (7.6%) | 148 (16.5%) |
| 65 to 74 Years | 0 (0.0%) | 0 (0.0%) |
| 75 Years and over | 0 (0.0%) | 74 (12.0%) |
| Total | 6,375 (42.2%) | 5,207 (42.0%) |
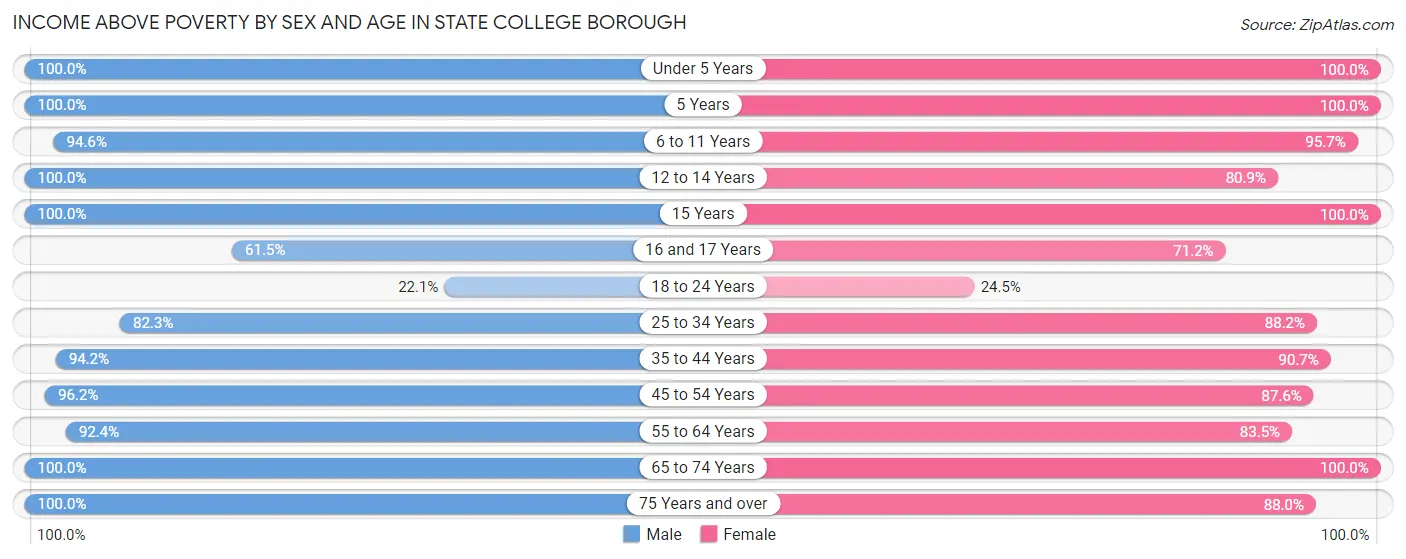
Income Above Poverty by Sex and Age in State College borough
According to the poverty statistics in State College borough, males aged under 5 years and females aged under 5 years are the age groups that are most secure financially, with 100.0% of males and 100.0% of females in these age groups living above the poverty line.
| Age Bracket | Male | Female |
| Under 5 Years | 444 (100.0%) | 218 (100.0%) |
| 5 Years | 37 (100.0%) | 91 (100.0%) |
| 6 to 11 Years | 316 (94.6%) | 360 (95.7%) |
| 12 to 14 Years | 287 (100.0%) | 89 (80.9%) |
| 15 Years | 202 (100.0%) | 72 (100.0%) |
| 16 and 17 Years | 75 (61.5%) | 89 (71.2%) |
| 18 to 24 Years | 1,619 (22.1%) | 1,473 (24.5%) |
| 25 to 34 Years | 2,088 (82.3%) | 1,491 (88.2%) |
| 35 to 44 Years | 1,008 (94.2%) | 733 (90.7%) |
| 45 to 54 Years | 810 (96.2%) | 663 (87.6%) |
| 55 to 64 Years | 797 (92.3%) | 751 (83.5%) |
| 65 to 74 Years | 590 (100.0%) | 626 (100.0%) |
| 75 Years and over | 443 (100.0%) | 541 (88.0%) |
| Total | 8,716 (57.8%) | 7,197 (58.0%) |
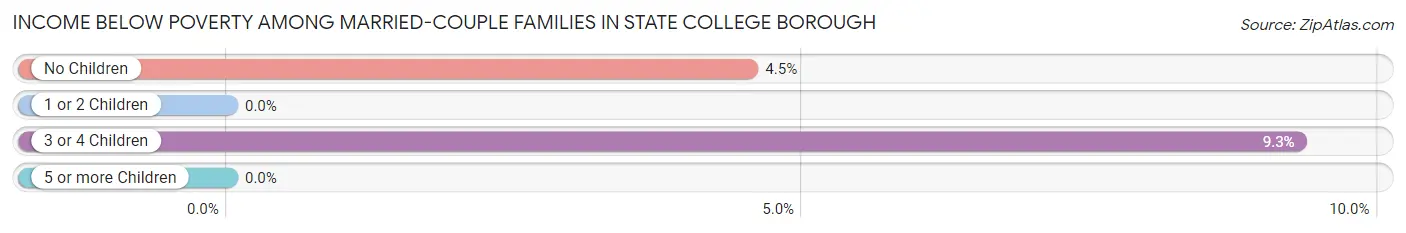
Income Below Poverty Among Married-Couple Families in State College borough
The poverty statistics for married-couple families in State College borough show that 3.2% or 87 of the total 2,718 families live below the poverty line. Families with 3 or 4 children have the highest poverty rate of 9.3%, comprising of 12 families. On the other hand, families with 1 or 2 children have the lowest poverty rate of 0.0%, which includes 0 families.
| Children | Above Poverty | Below Poverty |
| No Children | 1,581 (95.5%) | 75 (4.5%) |
| 1 or 2 Children | 898 (100.0%) | 0 (0.0%) |
| 3 or 4 Children | 117 (90.7%) | 12 (9.3%) |
| 5 or more Children | 35 (100.0%) | 0 (0.0%) |
| Total | 2,631 (96.8%) | 87 (3.2%) |
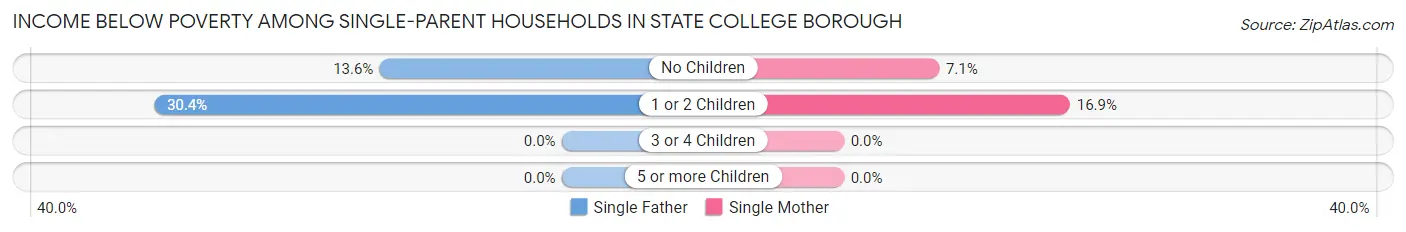
Income Below Poverty Among Single-Parent Households in State College borough
According to the poverty data in State College borough, 23.3% or 45 single-father households and 13.1% or 58 single-mother households are living below the poverty line. Among single-father households, those with 1 or 2 children have the highest poverty rate, with 34 households (30.4%) experiencing poverty. Likewise, among single-mother households, those with 1 or 2 children have the highest poverty rate, with 46 households (16.9%) falling below the poverty line.
| Children | Single Father | Single Mother |
| No Children | 11 (13.6%) | 12 (7.1%) |
| 1 or 2 Children | 34 (30.4%) | 46 (16.9%) |
| 3 or 4 Children | 0 (0.0%) | 0 (0.0%) |
| 5 or more Children | 0 (0.0%) | 0 (0.0%) |
| Total | 45 (23.3%) | 58 (13.1%) |
Income Below Poverty Among Married-Couple vs Single-Parent Households in State College borough
The poverty data for State College borough shows that 87 of the married-couple family households (3.2%) and 103 of the single-parent households (16.2%) are living below the poverty level. Within the married-couple family households, those with 3 or 4 children have the highest poverty rate, with 12 households (9.3%) falling below the poverty line. Among the single-parent households, those with 1 or 2 children have the highest poverty rate, with 80 household (20.8%) living below poverty.
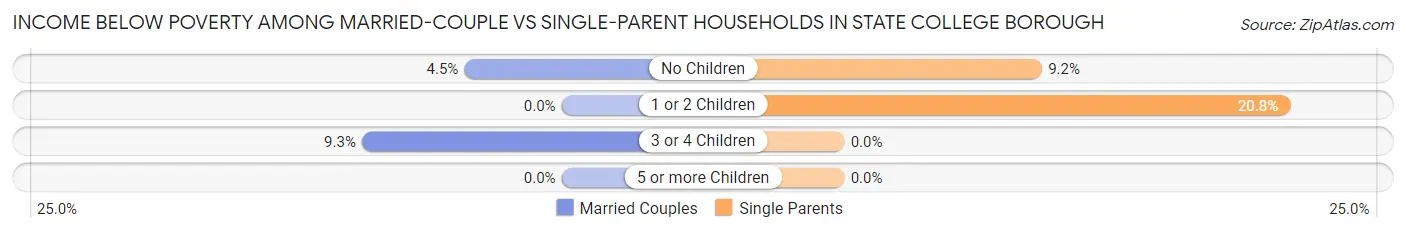
| Children | Married-Couple Families | Single-Parent Households |
| No Children | 75 (4.5%) | 23 (9.2%) |
| 1 or 2 Children | 0 (0.0%) | 80 (20.8%) |
| 3 or 4 Children | 12 (9.3%) | 0 (0.0%) |
| 5 or more Children | 0 (0.0%) | 0 (0.0%) |
| Total | 87 (3.2%) | 103 (16.2%) |
Race in State College borough
The most populous races in State College borough are White / Caucasian (34,046 | 83.2%), Asian (4,125 | 10.1%), and Hispanic or Latino (1,649 | 4.0%).
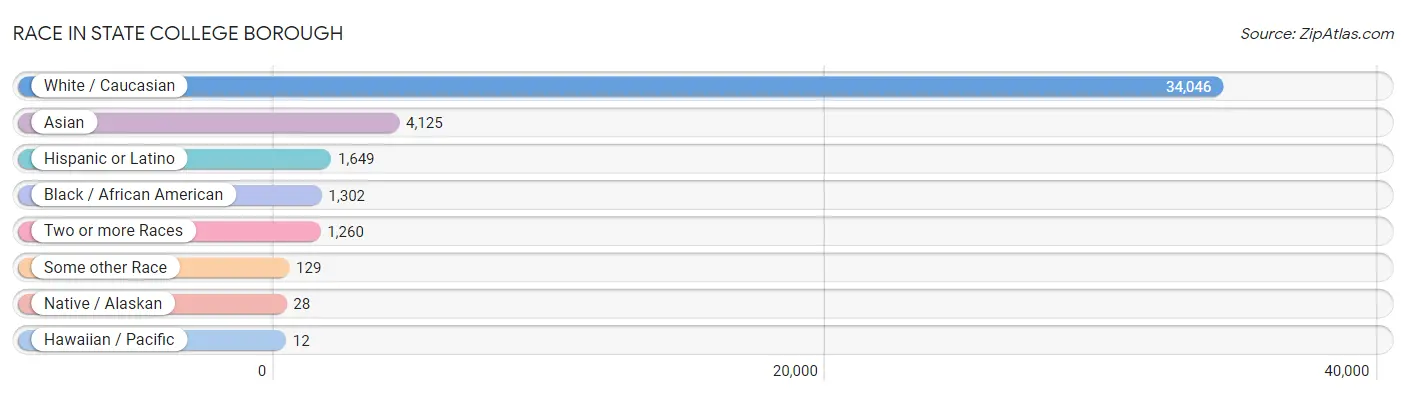
| Race | # Population | % Population |
| Asian | 4,125 | 10.1% |
| Black / African American | 1,302 | 3.2% |
| Hawaiian / Pacific | 12 | 0.0% |
| Hispanic or Latino | 1,649 | 4.0% |
| Native / Alaskan | 28 | 0.1% |
| White / Caucasian | 34,046 | 83.2% |
| Two or more Races | 1,260 | 3.1% |
| Some other Race | 129 | 0.3% |
| Total | 40,902 | 100.0% |
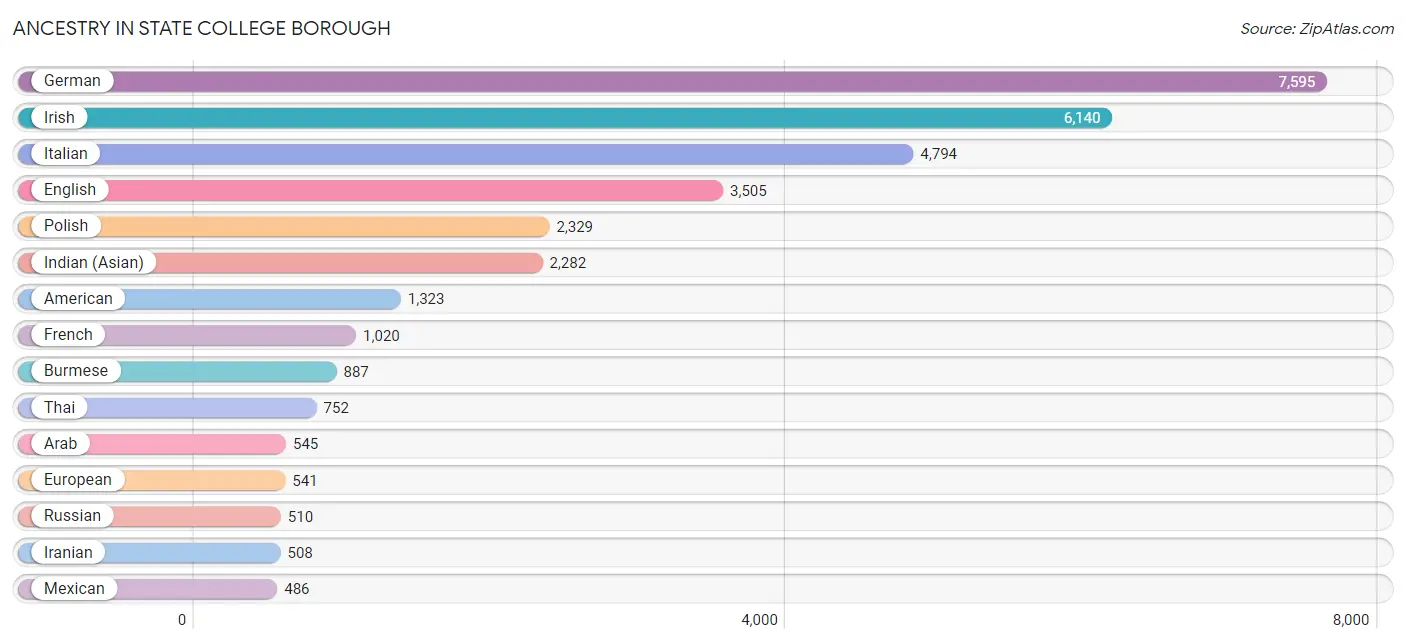
Ancestry in State College borough
The most populous ancestries reported in State College borough are German (7,595 | 18.6%), Irish (6,140 | 15.0%), Italian (4,794 | 11.7%), English (3,505 | 8.6%), and Polish (2,329 | 5.7%), together accounting for 59.6% of all State College borough residents.
| Ancestry | # Population | % Population |
| African | 20 | 0.1% |
| American | 1,323 | 3.2% |
| Arab | 545 | 1.3% |
| Argentinean | 47 | 0.1% |
| Armenian | 25 | 0.1% |
| Austrian | 204 | 0.5% |
| Bahamian | 69 | 0.2% |
| Belgian | 13 | 0.0% |
| Bhutanese | 56 | 0.1% |
| Blackfeet | 2 | 0.0% |
| Brazilian | 19 | 0.1% |
| British | 261 | 0.6% |
| Bulgarian | 13 | 0.0% |
| Burmese | 887 | 2.2% |
| Cambodian | 21 | 0.1% |
| Canadian | 77 | 0.2% |
| Carpatho Rusyn | 20 | 0.1% |
| Central American | 115 | 0.3% |
| Central American Indian | 12 | 0.0% |
| Cherokee | 49 | 0.1% |
| Chilean | 39 | 0.1% |
| Colombian | 31 | 0.1% |
| Croatian | 80 | 0.2% |
| Cuban | 63 | 0.2% |
| Czech | 126 | 0.3% |
| Czechoslovakian | 57 | 0.1% |
| Danish | 83 | 0.2% |
| Dominican | 131 | 0.3% |
| Dutch | 125 | 0.3% |
| Eastern European | 276 | 0.7% |
| Ecuadorian | 60 | 0.2% |
| Egyptian | 76 | 0.2% |
| English | 3,505 | 8.6% |
| Estonian | 183 | 0.4% |
| Ethiopian | 15 | 0.0% |
| European | 541 | 1.3% |
| Filipino | 21 | 0.1% |
| Finnish | 26 | 0.1% |
| French | 1,020 | 2.5% |
| French Canadian | 111 | 0.3% |
| German | 7,595 | 18.6% |
| Ghanaian | 59 | 0.1% |
| Greek | 229 | 0.6% |
| Guamanian / Chamorro | 12 | 0.0% |
| Guatemalan | 26 | 0.1% |
| Guyanese | 2 | 0.0% |
| Hungarian | 161 | 0.4% |
| Indian (Asian) | 2,282 | 5.6% |
| Indonesian | 37 | 0.1% |
| Iranian | 508 | 1.2% |
| Iraqi | 28 | 0.1% |
| Irish | 6,140 | 15.0% |
| Iroquois | 3 | 0.0% |
| Israeli | 86 | 0.2% |
| Italian | 4,794 | 11.7% |
| Jamaican | 219 | 0.5% |
| Japanese | 30 | 0.1% |
| Korean | 262 | 0.6% |
| Latvian | 3 | 0.0% |
| Lebanese | 177 | 0.4% |
| Lithuanian | 117 | 0.3% |
| Macedonian | 52 | 0.1% |
| Mexican | 486 | 1.2% |
| Mexican American Indian | 15 | 0.0% |
| Navajo | 3 | 0.0% |
| Nigerian | 172 | 0.4% |
| Northern European | 37 | 0.1% |
| Norwegian | 368 | 0.9% |
| Okinawan | 4 | 0.0% |
| Palestinian | 13 | 0.0% |
| Panamanian | 37 | 0.1% |
| Pennsylvania German | 116 | 0.3% |
| Peruvian | 41 | 0.1% |
| Polish | 2,329 | 5.7% |
| Portuguese | 125 | 0.3% |
| Puerto Rican | 439 | 1.1% |
| Romanian | 48 | 0.1% |
| Russian | 510 | 1.3% |
| Salvadoran | 52 | 0.1% |
| Samoan | 30 | 0.1% |
| Scandinavian | 4 | 0.0% |
| Scotch-Irish | 197 | 0.5% |
| Scottish | 425 | 1.0% |
| Slavic | 22 | 0.1% |
| Slovak | 376 | 0.9% |
| Slovene | 224 | 0.5% |
| South American | 218 | 0.5% |
| Spaniard | 79 | 0.2% |
| Spanish | 68 | 0.2% |
| Sri Lankan | 201 | 0.5% |
| Subsaharan African | 381 | 0.9% |
| Swedish | 455 | 1.1% |
| Swiss | 166 | 0.4% |
| Syrian | 27 | 0.1% |
| Thai | 752 | 1.8% |
| Tongan | 30 | 0.1% |
| Turkish | 146 | 0.4% |
| Ugandan | 106 | 0.3% |
| Ukrainian | 326 | 0.8% |
| Ute | 19 | 0.1% |
| Vietnamese | 26 | 0.1% |
| Welsh | 330 | 0.8% | View All 102 Rows |
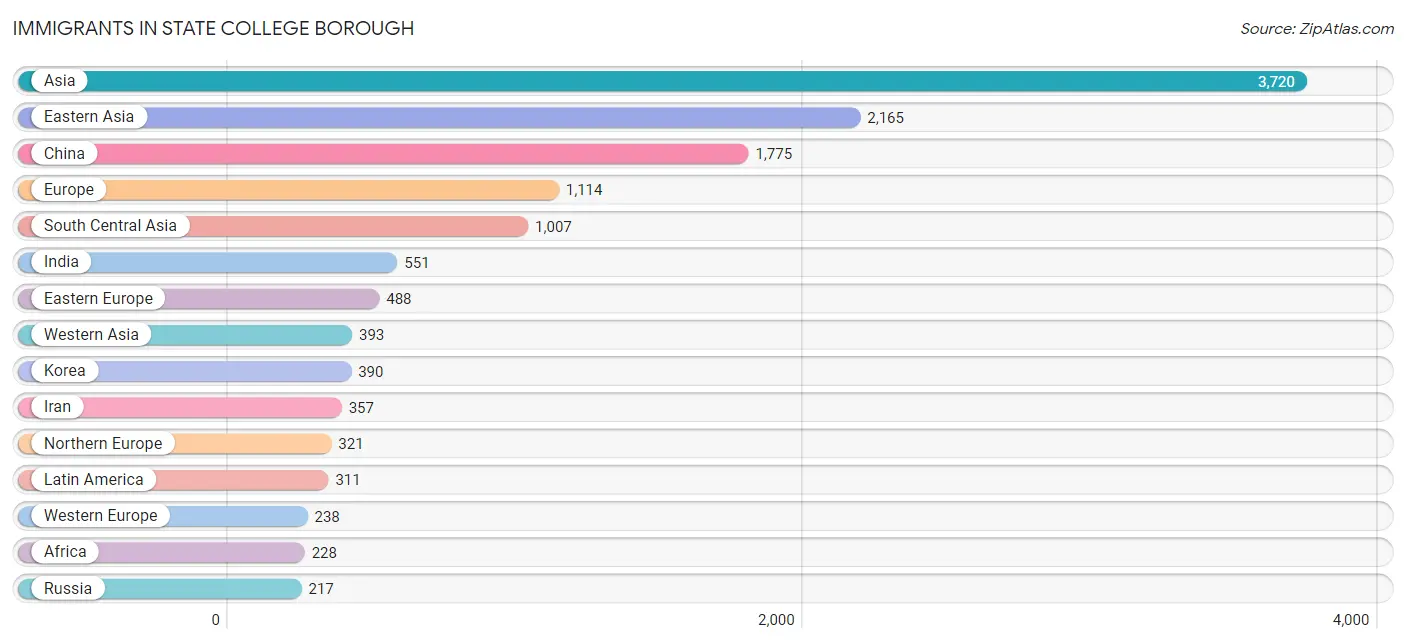
Immigrants in State College borough
The most numerous immigrant groups reported in State College borough came from Asia (3,720 | 9.1%), Eastern Asia (2,165 | 5.3%), China (1,775 | 4.3%), Europe (1,114 | 2.7%), and South Central Asia (1,007 | 2.5%), together accounting for 23.9% of all State College borough residents.
| Immigration Origin | # Population | % Population |
| Africa | 228 | 0.6% |
| Argentina | 22 | 0.1% |
| Asia | 3,720 | 9.1% |
| Australia | 5 | 0.0% |
| Austria | 7 | 0.0% |
| Bahamas | 19 | 0.1% |
| Bangladesh | 26 | 0.1% |
| Cambodia | 25 | 0.1% |
| Canada | 80 | 0.2% |
| Caribbean | 137 | 0.3% |
| Central America | 84 | 0.2% |
| Chile | 34 | 0.1% |
| China | 1,775 | 4.3% |
| Colombia | 21 | 0.1% |
| Czechoslovakia | 5 | 0.0% |
| Dominican Republic | 12 | 0.0% |
| Eastern Africa | 18 | 0.0% |
| Eastern Asia | 2,165 | 5.3% |
| Eastern Europe | 488 | 1.2% |
| Egypt | 35 | 0.1% |
| England | 46 | 0.1% |
| Ethiopia | 9 | 0.0% |
| Europe | 1,114 | 2.7% |
| France | 113 | 0.3% |
| Germany | 118 | 0.3% |
| Ghana | 59 | 0.1% |
| Guatemala | 26 | 0.1% |
| Hong Kong | 29 | 0.1% |
| India | 551 | 1.3% |
| Iran | 357 | 0.9% |
| Iraq | 13 | 0.0% |
| Italy | 28 | 0.1% |
| Jamaica | 106 | 0.3% |
| Kazakhstan | 40 | 0.1% |
| Korea | 390 | 0.9% |
| Kuwait | 2 | 0.0% |
| Latin America | 311 | 0.8% |
| Latvia | 3 | 0.0% |
| Mexico | 41 | 0.1% |
| Nigeria | 99 | 0.2% |
| Northern Africa | 35 | 0.1% |
| Northern Europe | 321 | 0.8% |
| Norway | 37 | 0.1% |
| Oceania | 5 | 0.0% |
| Pakistan | 5 | 0.0% |
| Panama | 17 | 0.0% |
| Philippines | 46 | 0.1% |
| Poland | 104 | 0.3% |
| Romania | 47 | 0.1% |
| Russia | 217 | 0.5% |
| Saudi Arabia | 151 | 0.4% |
| Singapore | 4 | 0.0% |
| South America | 90 | 0.2% |
| South Central Asia | 1,007 | 2.5% |
| South Eastern Asia | 155 | 0.4% |
| Southern Europe | 67 | 0.2% |
| Spain | 39 | 0.1% |
| Sweden | 125 | 0.3% |
| Taiwan | 86 | 0.2% |
| Turkey | 210 | 0.5% |
| Ukraine | 49 | 0.1% |
| Uzbekistan | 14 | 0.0% |
| Venezuela | 13 | 0.0% |
| Vietnam | 43 | 0.1% |
| Western Africa | 158 | 0.4% |
| Western Asia | 393 | 1.0% |
| Western Europe | 238 | 0.6% | View All 67 Rows |
Sex and Age in State College borough
Sex and Age in State College borough
The most populous age groups in State College borough are 20 to 24 Years (9,348 | 42.1%) for men and 20 to 24 Years (7,262 | 38.8%) for women.
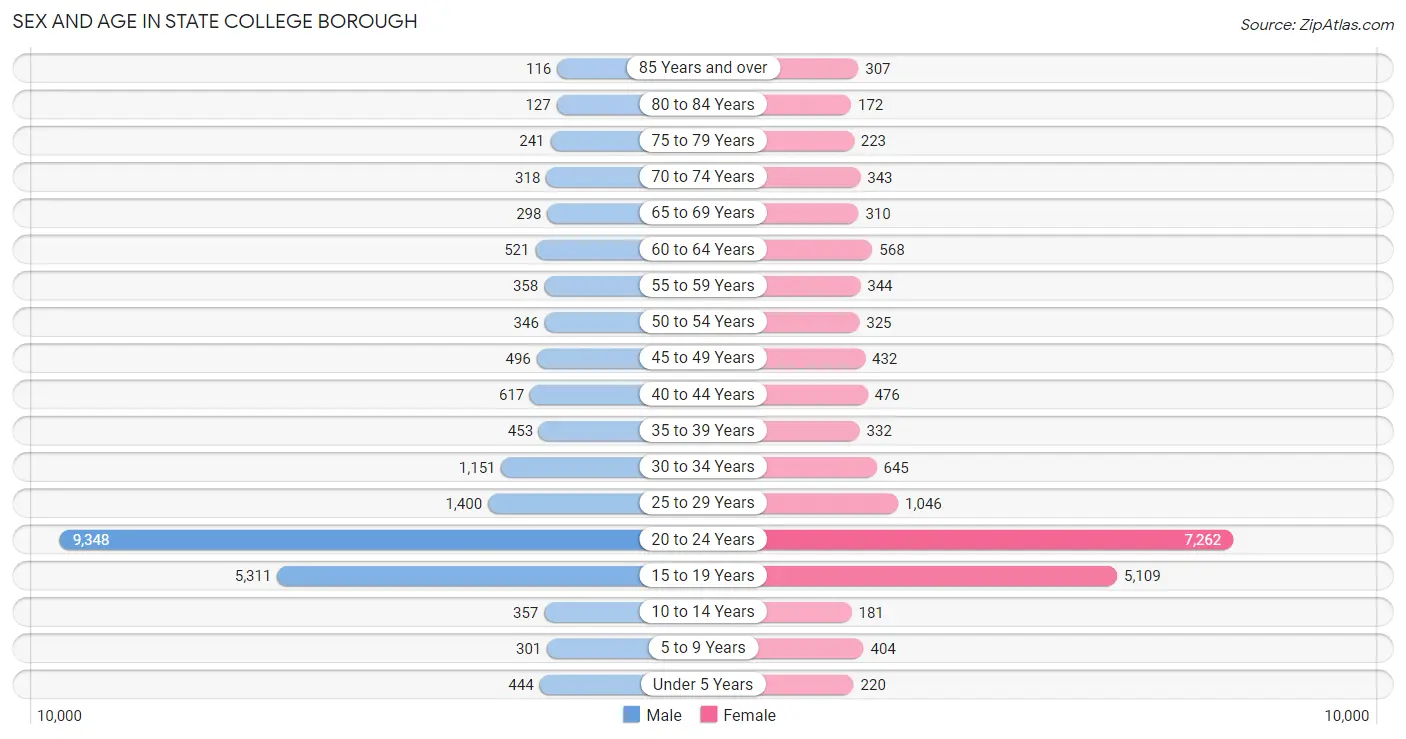
| Age Bracket | Male | Female |
| Under 5 Years | 444 (2.0%) | 220 (1.2%) |
| 5 to 9 Years | 301 (1.4%) | 404 (2.2%) |
| 10 to 14 Years | 357 (1.6%) | 181 (1.0%) |
| 15 to 19 Years | 5,311 (23.9%) | 5,109 (27.3%) |
| 20 to 24 Years | 9,348 (42.1%) | 7,262 (38.8%) |
| 25 to 29 Years | 1,400 (6.3%) | 1,046 (5.6%) |
| 30 to 34 Years | 1,151 (5.2%) | 645 (3.5%) |
| 35 to 39 Years | 453 (2.0%) | 332 (1.8%) |
| 40 to 44 Years | 617 (2.8%) | 476 (2.5%) |
| 45 to 49 Years | 496 (2.2%) | 432 (2.3%) |
| 50 to 54 Years | 346 (1.6%) | 325 (1.7%) |
| 55 to 59 Years | 358 (1.6%) | 344 (1.8%) |
| 60 to 64 Years | 521 (2.4%) | 568 (3.0%) |
| 65 to 69 Years | 298 (1.3%) | 310 (1.7%) |
| 70 to 74 Years | 318 (1.4%) | 343 (1.8%) |
| 75 to 79 Years | 241 (1.1%) | 223 (1.2%) |
| 80 to 84 Years | 127 (0.6%) | 172 (0.9%) |
| 85 Years and over | 116 (0.5%) | 307 (1.6%) |
| Total | 22,203 (100.0%) | 18,699 (100.0%) |
Families and Households in State College borough
Median Family Size in State College borough
The median family size in State College borough is 2.87 persons per family, with married-couple families (2,718 | 81.1%) accounting for the largest median family size of 2.88 persons per family. On the other hand, single male/father families (193 | 5.8%) represent the smallest median family size with 2.82 persons per family.
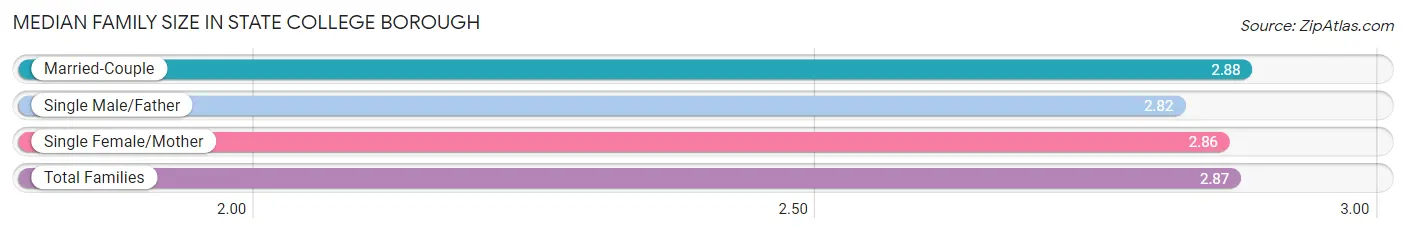
| Family Type | # Families | Family Size |
| Married-Couple | 2,718 (81.1%) | 2.88 |
| Single Male/Father | 193 (5.8%) | 2.82 |
| Single Female/Mother | 442 (13.2%) | 2.86 |
| Total Families | 3,353 (100.0%) | 2.87 |
Median Household Size in State College borough
The median household size in State College borough is 2.41 persons per household, with single female/mother households (442 | 3.9%) accounting for the largest median household size of 3.08 persons per household. non-family households (8,004 | 70.5%) represent the smallest median household size with 2.20 persons per household.
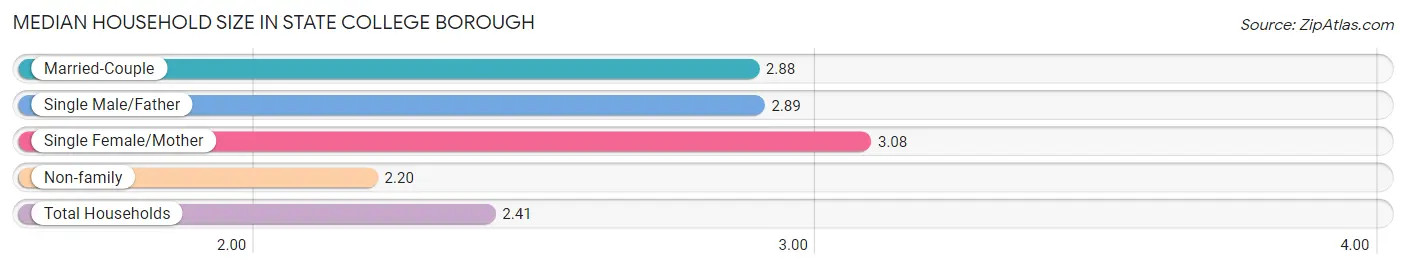
| Household Type | # Households | Household Size |
| Married-Couple | 2,718 (23.9%) | 2.88 |
| Single Male/Father | 193 (1.7%) | 2.89 |
| Single Female/Mother | 442 (3.9%) | 3.08 |
| Non-family | 8,004 (70.5%) | 2.20 |
| Total Households | 11,357 (100.0%) | 2.41 |
Household Size by Marriage Status in State College borough
Out of a total of 11,357 households in State College borough, 3,353 (29.5%) are family households, while 8,004 (70.5%) are nonfamily households. The most numerous type of family households are 2-person households, comprising 1,732, and the most common type of nonfamily households are 1-person households, comprising 4,965.
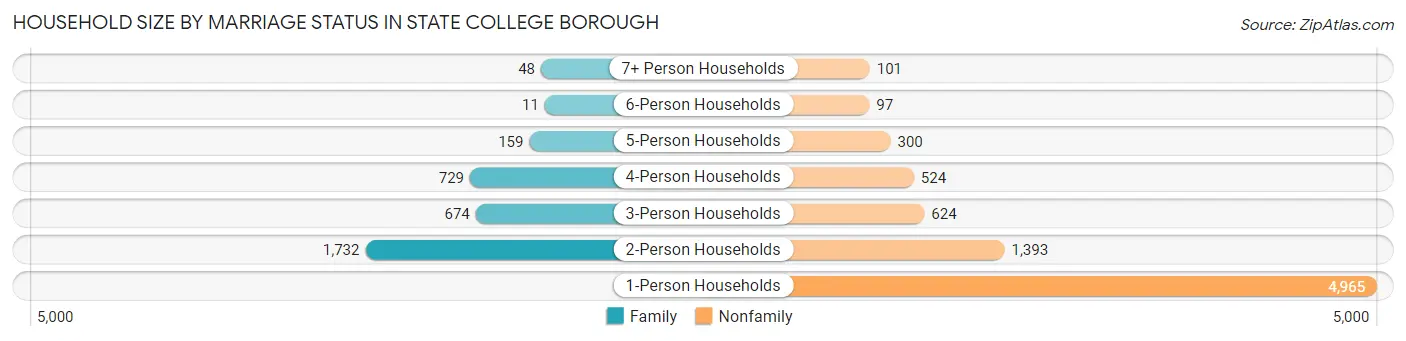
| Household Size | Family Households | Nonfamily Households |
| 1-Person Households | - | 4,965 (43.7%) |
| 2-Person Households | 1,732 (15.2%) | 1,393 (12.3%) |
| 3-Person Households | 674 (5.9%) | 624 (5.5%) |
| 4-Person Households | 729 (6.4%) | 524 (4.6%) |
| 5-Person Households | 159 (1.4%) | 300 (2.6%) |
| 6-Person Households | 11 (0.1%) | 97 (0.9%) |
| 7+ Person Households | 48 (0.4%) | 101 (0.9%) |
| Total | 3,353 (29.5%) | 8,004 (70.5%) |
Female Fertility in State College borough
Fertility by Age in State College borough
Average fertility rate in State College borough is 15.0 births per 1,000 women. Women in the age bracket of 20 to 34 years have the highest fertility rate with 24.0 births per 1,000 women. Women in the age bracket of 20 to 34 years acount for 92.2% of all women with births.
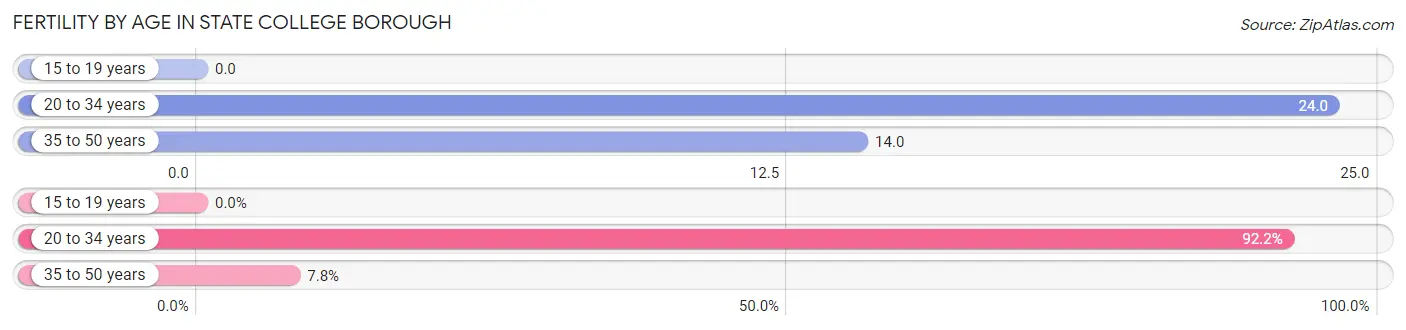
| Age Bracket | Women with Births | Births / 1,000 Women |
| 15 to 19 years | 0 (0.0%) | 0.0 |
| 20 to 34 years | 212 (92.2%) | 24.0 |
| 35 to 50 years | 18 (7.8%) | 14.0 |
| Total | 230 (100.0%) | 15.0 |
Fertility by Age by Marriage Status in State College borough
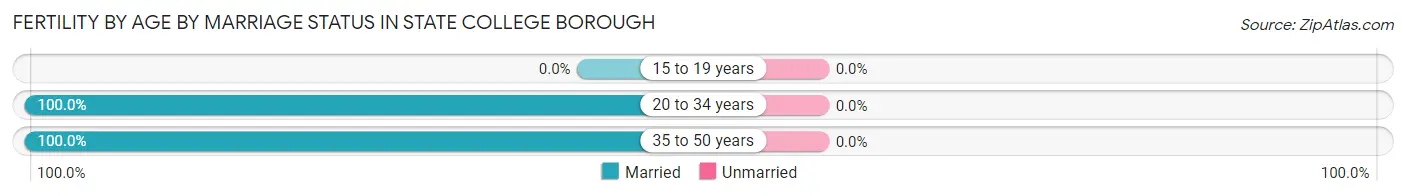
| Age Bracket | Married | Unmarried |
| 15 to 19 years | 0 (0.0%) | 0 (0.0%) |
| 20 to 34 years | 212 (100.0%) | 0 (0.0%) |
| 35 to 50 years | 18 (100.0%) | 0 (0.0%) |
| Total | 230 (100.0%) | 0 (0.0%) |
Fertility by Education in State College borough
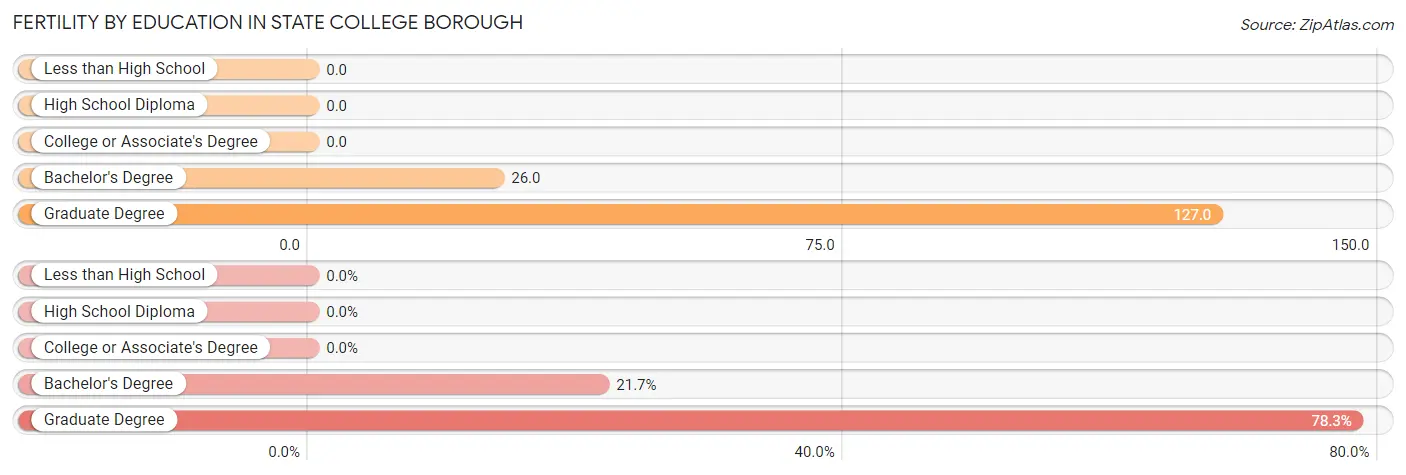
| Educational Attainment | Women with Births | Births / 1,000 Women |
| Less than High School | 0 (0.0%) | 0.0 |
| High School Diploma | 0 (0.0%) | 0.0 |
| College or Associate's Degree | 0 (0.0%) | 0.0 |
| Bachelor's Degree | 50 (21.7%) | 26.0 |
| Graduate Degree | 180 (78.3%) | 127.0 |
| Total | 230 (100.0%) | 15.0 |
Fertility by Education by Marriage Status in State College borough
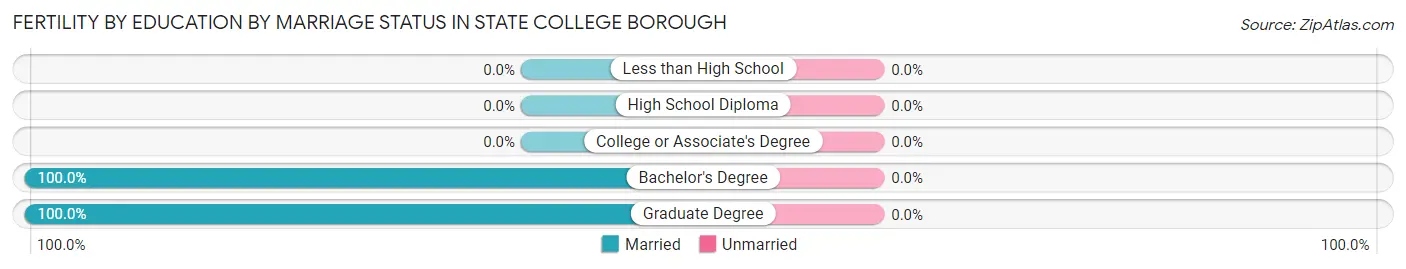
| Educational Attainment | Married | Unmarried |
| Less than High School | 0 (0.0%) | 0 (0.0%) |
| High School Diploma | 0 (0.0%) | 0 (0.0%) |
| College or Associate's Degree | 0 (0.0%) | 0 (0.0%) |
| Bachelor's Degree | 50 (100.0%) | 0 (0.0%) |
| Graduate Degree | 180 (100.0%) | 0 (0.0%) |
| Total | 230 (100.0%) | 0 (0.0%) |
Employment Characteristics in State College borough
Employment by Class of Employer in State College borough
Among the 15,190 employed individuals in State College borough, private company employees (8,570 | 56.4%), state government employees (3,315 | 21.8%), and not-for-profit organizations (1,966 | 12.9%) make up the most common classes of employment.
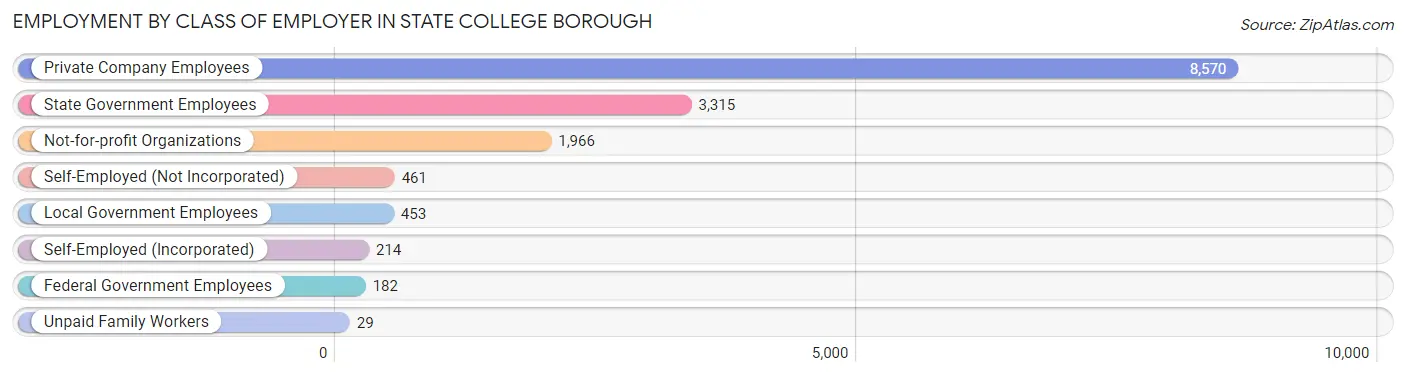
| Employer Class | # Employees | % Employees |
| Private Company Employees | 8,570 | 56.4% |
| Self-Employed (Incorporated) | 214 | 1.4% |
| Self-Employed (Not Incorporated) | 461 | 3.0% |
| Not-for-profit Organizations | 1,966 | 12.9% |
| Local Government Employees | 453 | 3.0% |
| State Government Employees | 3,315 | 21.8% |
| Federal Government Employees | 182 | 1.2% |
| Unpaid Family Workers | 29 | 0.2% |
| Total | 15,190 | 100.0% |
Employment Status by Age in State College borough
According to the labor force statistics for State College borough, out of the total population over 16 years of age (38,719), 43.9% or 16,998 individuals are in the labor force, with 3.9% or 663 of them unemployed. The age group with the highest labor force participation rate is 35 to 44 years, with 91.9% or 1,726 individuals in the labor force. Within the labor force, the 55 to 59 years age range has the highest percentage of unemployed individuals, with 16.8% or 98 of them being unemployed.
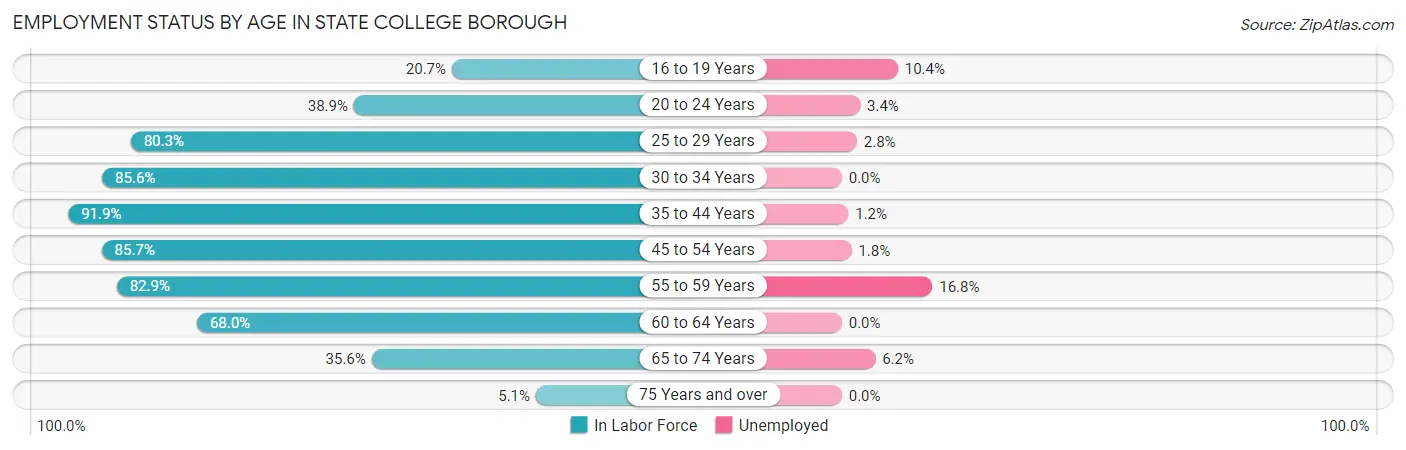
| Age Bracket | In Labor Force | Unemployed |
| 16 to 19 Years | 2,100 (20.7%) | 218 (10.4%) |
| 20 to 24 Years | 6,461 (38.9%) | 220 (3.4%) |
| 25 to 29 Years | 1,964 (80.3%) | 55 (2.8%) |
| 30 to 34 Years | 1,537 (85.6%) | 0 (0.0%) |
| 35 to 44 Years | 1,726 (91.9%) | 21 (1.2%) |
| 45 to 54 Years | 1,370 (85.7%) | 25 (1.8%) |
| 55 to 59 Years | 582 (82.9%) | 98 (16.8%) |
| 60 to 64 Years | 741 (68.0%) | 0 (0.0%) |
| 65 to 74 Years | 452 (35.6%) | 28 (6.2%) |
| 75 Years and over | 60 (5.1%) | 0 (0.0%) |
| Total | 16,998 (43.9%) | 663 (3.9%) |
Employment Status by Educational Attainment in State College borough
According to labor force statistics for State College borough, 83.3% of individuals (7,922) out of the total population between 25 and 64 years of age (9,510) are in the labor force, with 2.5% or 198 of them being unemployed. The group with the highest labor force participation rate are those with the educational attainment of bachelor's degree or higher, with 87.1% or 5,986 individuals in the labor force. Within the labor force, individuals with less than high school education have the highest percentage of unemployment, with 31.8% or 28 of them being unemployed.
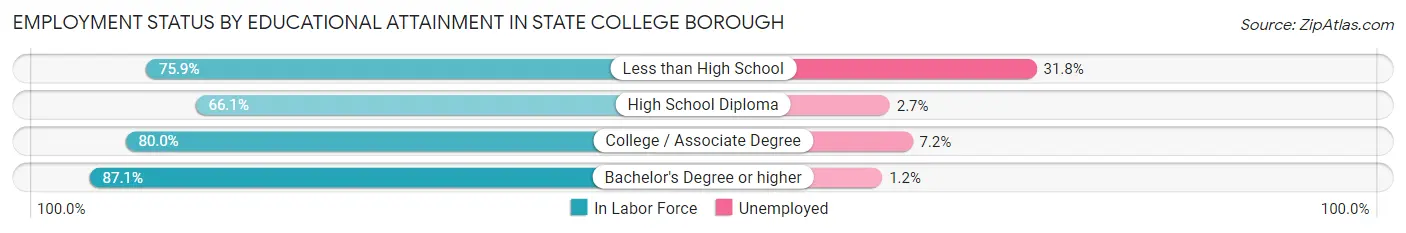
| Educational Attainment | In Labor Force | Unemployed |
| Less than High School | 88 (75.9%) | 37 (31.8%) |
| High School Diploma | 806 (66.1%) | 33 (2.7%) |
| College / Associate Degree | 1,042 (80.0%) | 94 (7.2%) |
| Bachelor's Degree or higher | 5,986 (87.1%) | 82 (1.2%) |
| Total | 7,922 (83.3%) | 238 (2.5%) |
Employment Occupations by Sex in State College borough
Management, Business, Science and Arts Occupations
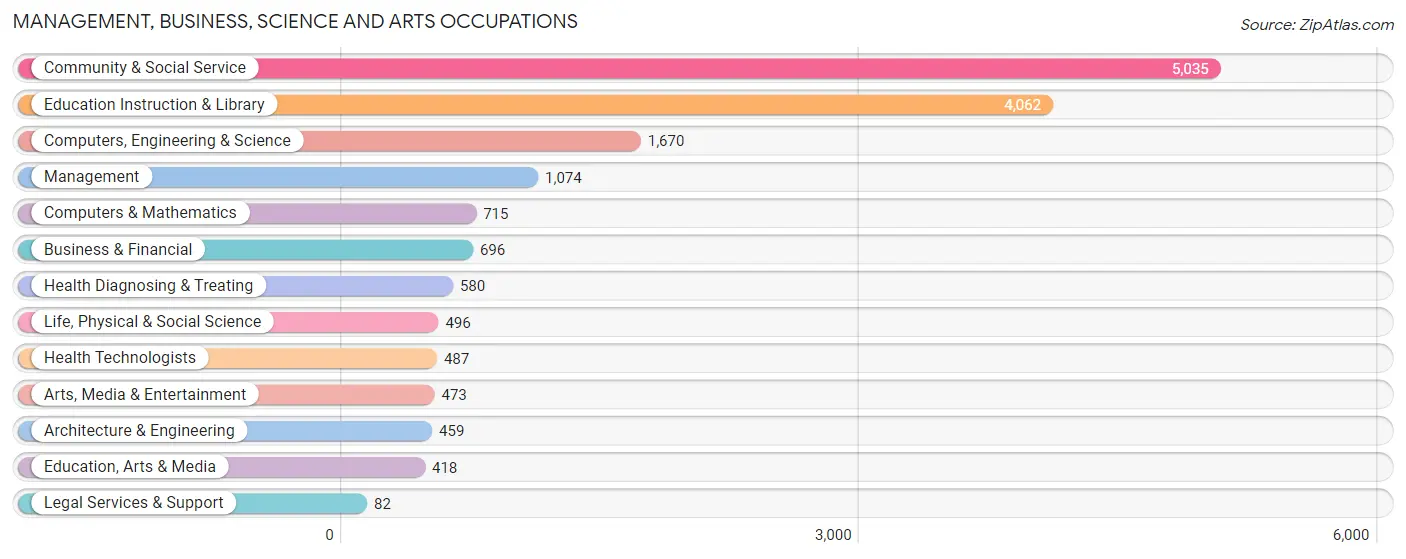
The most common Management, Business, Science and Arts occupations in State College borough are Community & Social Service (5,035 | 30.9%), Education Instruction & Library (4,062 | 24.9%), Computers, Engineering & Science (1,670 | 10.2%), Management (1,074 | 6.6%), and Computers & Mathematics (715 | 4.4%).
Management, Business, Science and Arts Occupations by Sex
Within the Management, Business, Science and Arts occupations in State College borough, the most male-oriented occupations are Architecture & Engineering (97.2%), Computers, Engineering & Science (78.6%), and Life, Physical & Social Science (77.2%), while the most female-oriented occupations are Health Technologists (62.0%), Health Diagnosing & Treating (61.0%), and Legal Services & Support (52.4%).
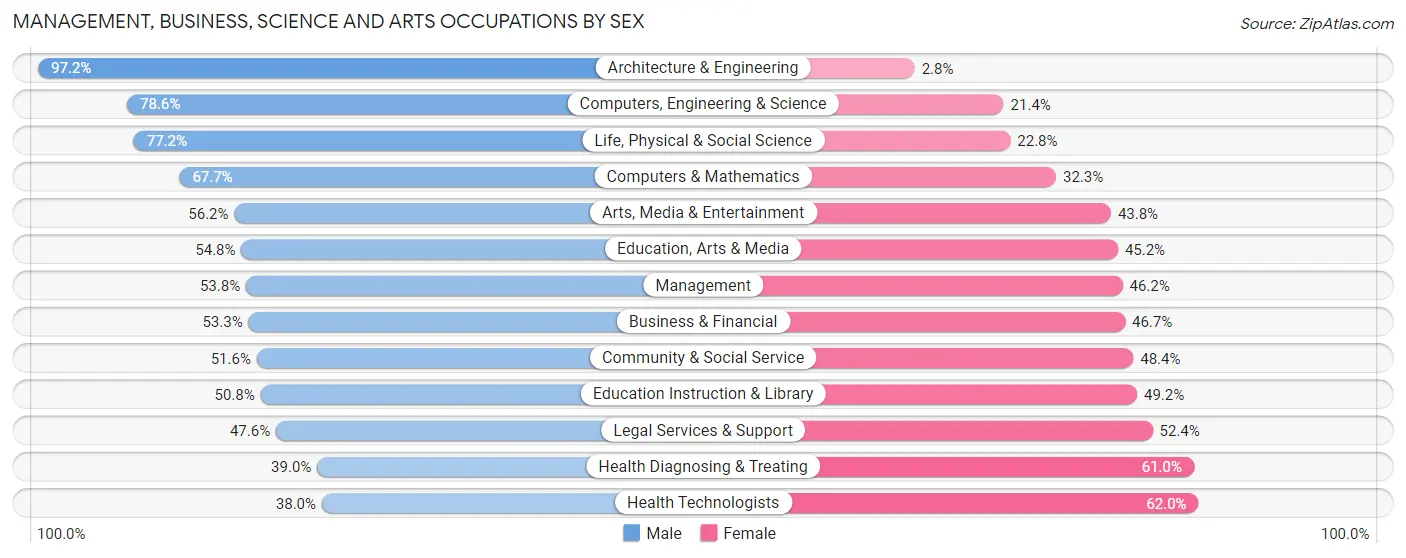
| Occupation | Male | Female |
| Management | 578 (53.8%) | 496 (46.2%) |
| Business & Financial | 371 (53.3%) | 325 (46.7%) |
| Computers, Engineering & Science | 1,313 (78.6%) | 357 (21.4%) |
| Computers & Mathematics | 484 (67.7%) | 231 (32.3%) |
| Architecture & Engineering | 446 (97.2%) | 13 (2.8%) |
| Life, Physical & Social Science | 383 (77.2%) | 113 (22.8%) |
| Community & Social Service | 2,597 (51.6%) | 2,438 (48.4%) |
| Education, Arts & Media | 229 (54.8%) | 189 (45.2%) |
| Legal Services & Support | 39 (47.6%) | 43 (52.4%) |
| Education Instruction & Library | 2,063 (50.8%) | 1,999 (49.2%) |
| Arts, Media & Entertainment | 266 (56.2%) | 207 (43.8%) |
| Health Diagnosing & Treating | 226 (39.0%) | 354 (61.0%) |
| Health Technologists | 185 (38.0%) | 302 (62.0%) |
| Total (Category) | 5,085 (56.2%) | 3,970 (43.8%) |
| Total (Overall) | 9,142 (56.1%) | 7,154 (43.9%) |
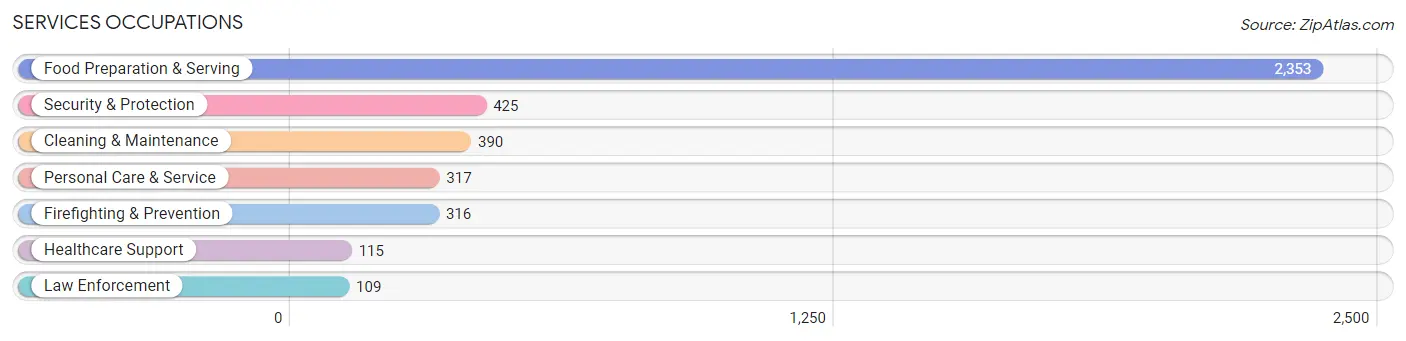
Services Occupations
The most common Services occupations in State College borough are Food Preparation & Serving (2,353 | 14.4%), Security & Protection (425 | 2.6%), Cleaning & Maintenance (390 | 2.4%), Personal Care & Service (317 | 1.9%), and Firefighting & Prevention (316 | 1.9%).
Services Occupations by Sex
Within the Services occupations in State College borough, the most male-oriented occupations are Cleaning & Maintenance (83.1%), Firefighting & Prevention (76.6%), and Security & Protection (72.0%), while the most female-oriented occupations are Healthcare Support (100.0%), Personal Care & Service (76.7%), and Food Preparation & Serving (55.6%).
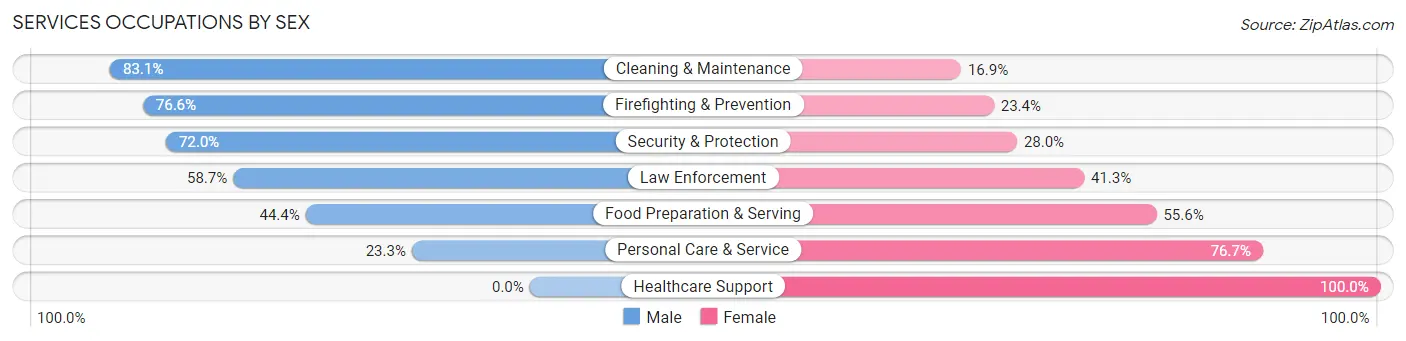
| Occupation | Male | Female |
| Healthcare Support | 0 (0.0%) | 115 (100.0%) |
| Security & Protection | 306 (72.0%) | 119 (28.0%) |
| Firefighting & Prevention | 242 (76.6%) | 74 (23.4%) |
| Law Enforcement | 64 (58.7%) | 45 (41.3%) |
| Food Preparation & Serving | 1,044 (44.4%) | 1,309 (55.6%) |
| Cleaning & Maintenance | 324 (83.1%) | 66 (16.9%) |
| Personal Care & Service | 74 (23.3%) | 243 (76.7%) |
| Total (Category) | 1,748 (48.6%) | 1,852 (51.4%) |
| Total (Overall) | 9,142 (56.1%) | 7,154 (43.9%) |
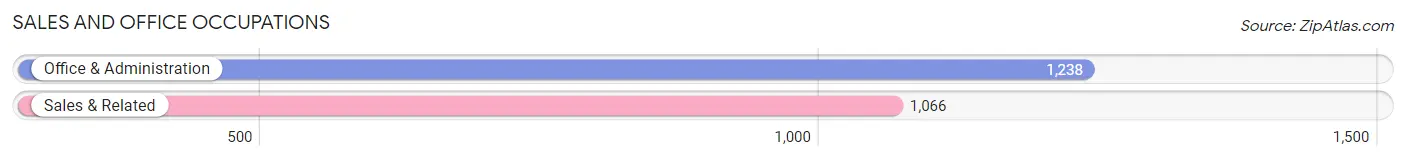
Sales and Office Occupations
The most common Sales and Office occupations in State College borough are Office & Administration (1,238 | 7.6%), and Sales & Related (1,066 | 6.5%).
Sales and Office Occupations by Sex
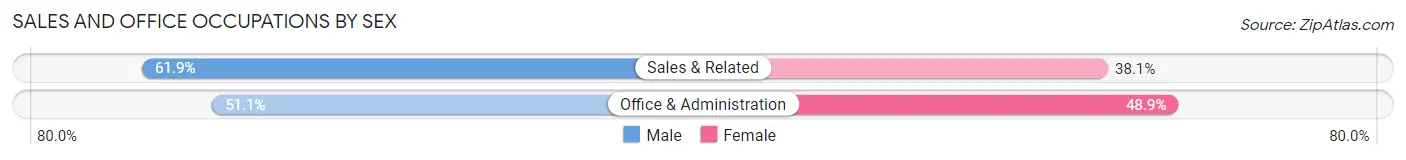
| Occupation | Male | Female |
| Sales & Related | 660 (61.9%) | 406 (38.1%) |
| Office & Administration | 633 (51.1%) | 605 (48.9%) |
| Total (Category) | 1,293 (56.1%) | 1,011 (43.9%) |
| Total (Overall) | 9,142 (56.1%) | 7,154 (43.9%) |
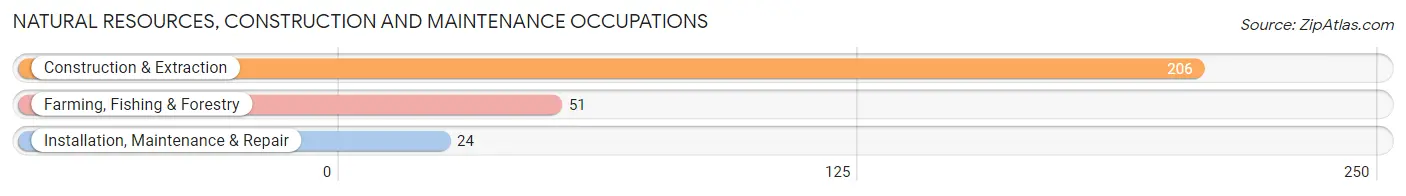
Natural Resources, Construction and Maintenance Occupations
The most common Natural Resources, Construction and Maintenance occupations in State College borough are Construction & Extraction (206 | 1.3%), Farming, Fishing & Forestry (51 | 0.3%), and Installation, Maintenance & Repair (24 | 0.2%).
Natural Resources, Construction and Maintenance Occupations by Sex
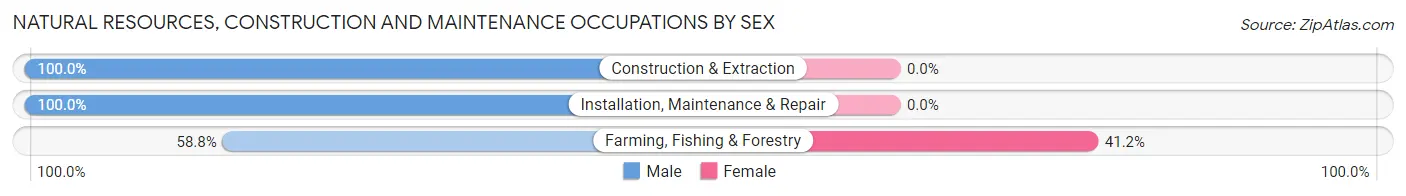
| Occupation | Male | Female |
| Farming, Fishing & Forestry | 30 (58.8%) | 21 (41.2%) |
| Construction & Extraction | 206 (100.0%) | 0 (0.0%) |
| Installation, Maintenance & Repair | 24 (100.0%) | 0 (0.0%) |
| Total (Category) | 260 (92.5%) | 21 (7.5%) |
| Total (Overall) | 9,142 (56.1%) | 7,154 (43.9%) |
Production, Transportation and Moving Occupations
The most common Production, Transportation and Moving occupations in State College borough are Material Moving (495 | 3.0%), Production (324 | 2.0%), and Transportation (237 | 1.5%).
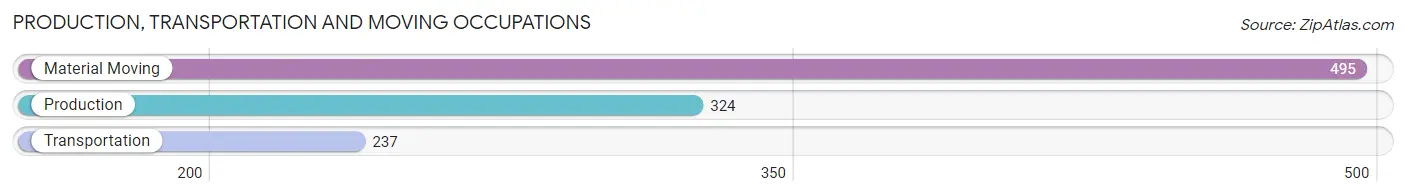
Production, Transportation and Moving Occupations by Sex
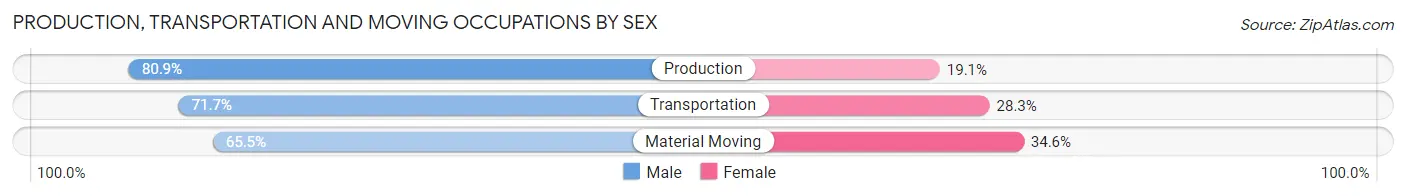
| Occupation | Male | Female |
| Production | 262 (80.9%) | 62 (19.1%) |
| Transportation | 170 (71.7%) | 67 (28.3%) |
| Material Moving | 324 (65.4%) | 171 (34.5%) |
| Total (Category) | 756 (71.6%) | 300 (28.4%) |
| Total (Overall) | 9,142 (56.1%) | 7,154 (43.9%) |
Employment Industries by Sex in State College borough
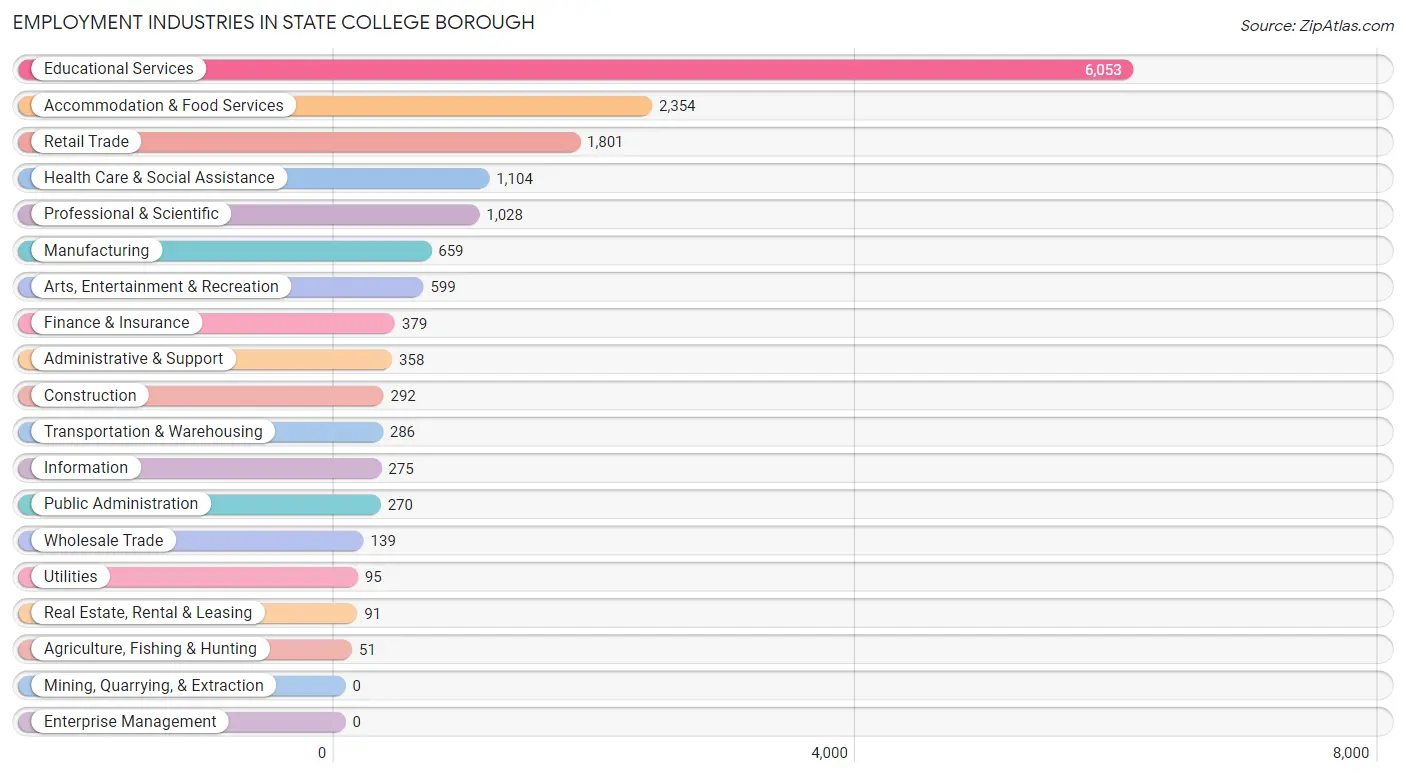
Employment Industries in State College borough
The major employment industries in State College borough include Educational Services (6,053 | 37.1%), Accommodation & Food Services (2,354 | 14.4%), Retail Trade (1,801 | 11.1%), Health Care & Social Assistance (1,104 | 6.8%), and Professional & Scientific (1,028 | 6.3%).
Employment Industries by Sex in State College borough
The State College borough industries that see more men than women are Construction (100.0%), Utilities (100.0%), and Finance & Insurance (84.4%), whereas the industries that tend to have a higher number of women are Health Care & Social Assistance (65.5%), Educational Services (50.3%), and Accommodation & Food Services (49.4%).
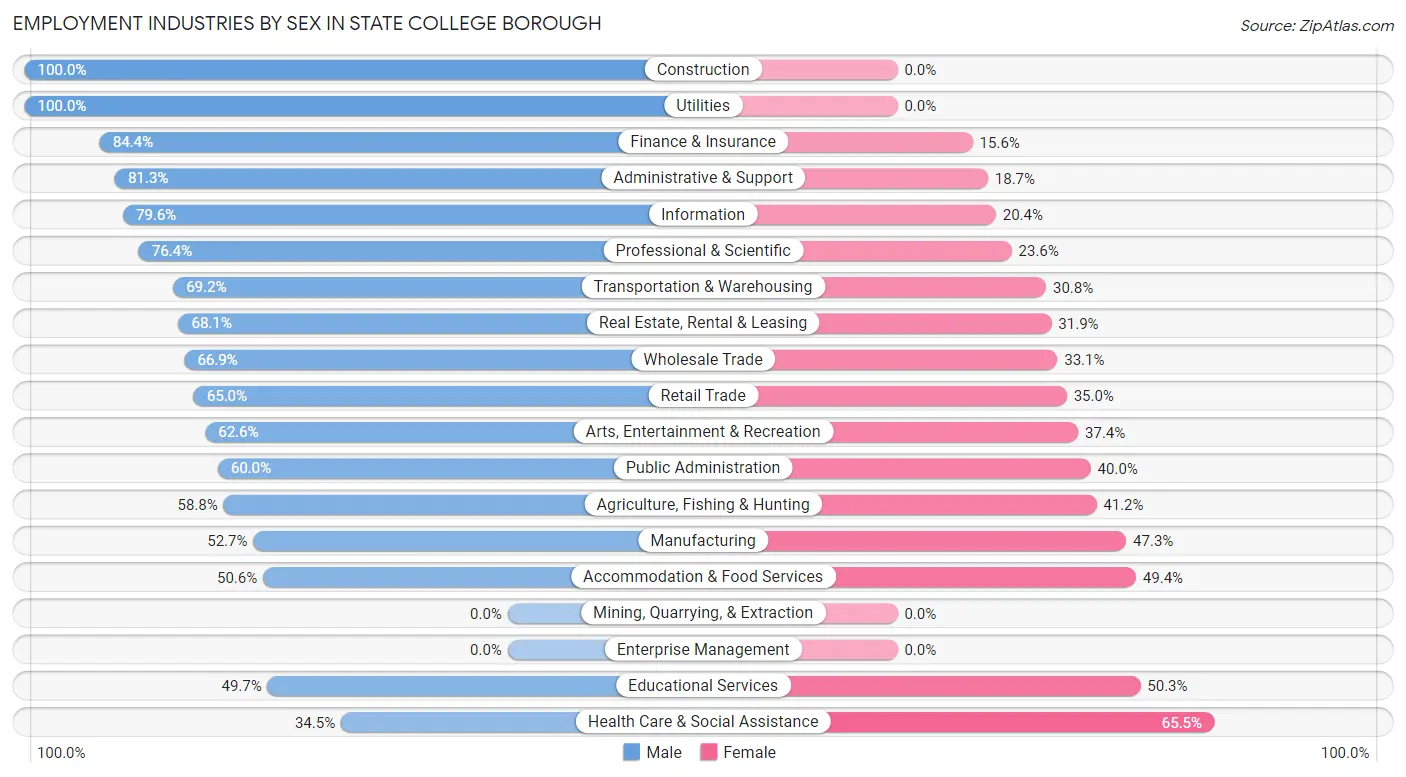
| Industry | Male | Female |
| Agriculture, Fishing & Hunting | 30 (58.8%) | 21 (41.2%) |
| Mining, Quarrying, & Extraction | 0 (0.0%) | 0 (0.0%) |
| Construction | 292 (100.0%) | 0 (0.0%) |
| Manufacturing | 347 (52.7%) | 312 (47.3%) |
| Wholesale Trade | 93 (66.9%) | 46 (33.1%) |
| Retail Trade | 1,170 (65.0%) | 631 (35.0%) |
| Transportation & Warehousing | 198 (69.2%) | 88 (30.8%) |
| Utilities | 95 (100.0%) | 0 (0.0%) |
| Information | 219 (79.6%) | 56 (20.4%) |
| Finance & Insurance | 320 (84.4%) | 59 (15.6%) |
| Real Estate, Rental & Leasing | 62 (68.1%) | 29 (31.9%) |
| Professional & Scientific | 785 (76.4%) | 243 (23.6%) |
| Enterprise Management | 0 (0.0%) | 0 (0.0%) |
| Administrative & Support | 291 (81.3%) | 67 (18.7%) |
| Educational Services | 3,009 (49.7%) | 3,044 (50.3%) |
| Health Care & Social Assistance | 381 (34.5%) | 723 (65.5%) |
| Arts, Entertainment & Recreation | 375 (62.6%) | 224 (37.4%) |
| Accommodation & Food Services | 1,192 (50.6%) | 1,162 (49.4%) |
| Public Administration | 162 (60.0%) | 108 (40.0%) |
| Total | 9,142 (56.1%) | 7,154 (43.9%) |
Education in State College borough
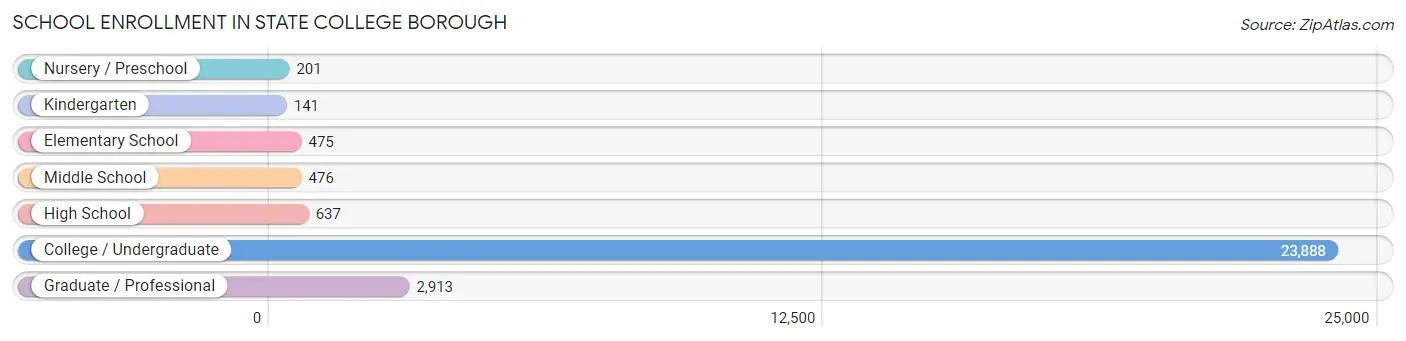
School Enrollment in State College borough
The most common levels of schooling among the 28,731 students in State College borough are college / undergraduate (23,888 | 83.1%), graduate / professional (2,913 | 10.1%), and high school (637 | 2.2%).
| School Level | # Students | % Students |
| Nursery / Preschool | 201 | 0.7% |
| Kindergarten | 141 | 0.5% |
| Elementary School | 475 | 1.7% |
| Middle School | 476 | 1.7% |
| High School | 637 | 2.2% |
| College / Undergraduate | 23,888 | 83.1% |
| Graduate / Professional | 2,913 | 10.1% |
| Total | 28,731 | 100.0% |
School Enrollment by Age by Funding Source in State College borough
Out of a total of 28,731 students who are enrolled in schools in State College borough, 1,494 (5.2%) attend a private institution, while the remaining 27,237 (94.8%) are enrolled in public schools. The age group of 3 to 4 year olds has the highest likelihood of being enrolled in private schools, with 167 (88.8% in the age bracket) enrolled. Conversely, the age group of 18 to 19 year olds has the lowest likelihood of being enrolled in a private school, with 9,359 (97.9% in the age bracket) attending a public institution.
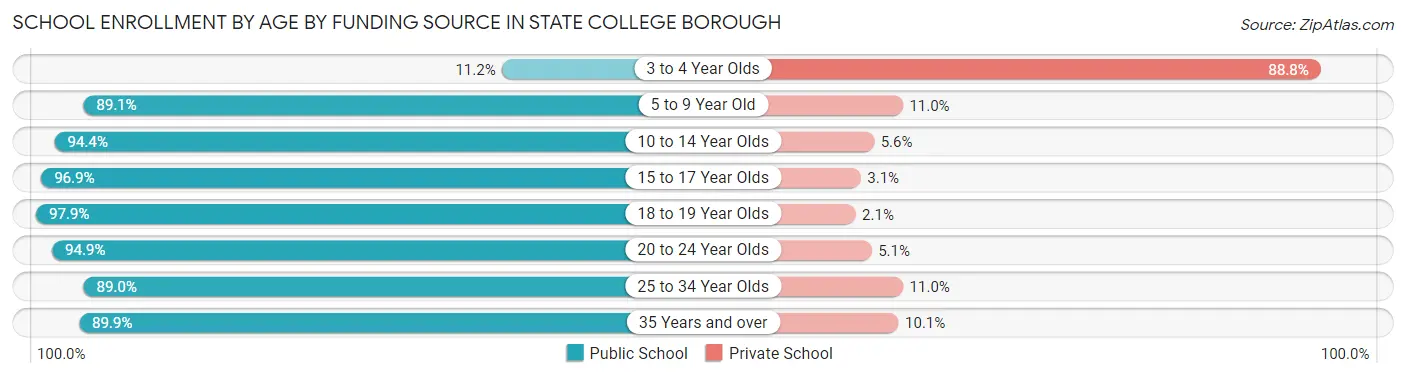
| Age Bracket | Public School | Private School |
| 3 to 4 Year Olds | 21 (11.2%) | 167 (88.8%) |
| 5 to 9 Year Old | 545 (89.0%) | 67 (11.0%) |
| 10 to 14 Year Olds | 490 (94.4%) | 29 (5.6%) |
| 15 to 17 Year Olds | 748 (96.9%) | 24 (3.1%) |
| 18 to 19 Year Olds | 9,359 (97.9%) | 205 (2.1%) |
| 20 to 24 Year Olds | 14,219 (94.9%) | 769 (5.1%) |
| 25 to 34 Year Olds | 1,604 (89.0%) | 198 (11.0%) |
| 35 Years and over | 257 (89.9%) | 29 (10.1%) |
| Total | 27,237 (94.8%) | 1,494 (5.2%) |
Educational Attainment by Field of Study in State College borough
Engineering (1,229 | 12.9%), business (920 | 9.7%), bio, nature & agricultural (907 | 9.5%), physical & health sciences (869 | 9.1%), and literature & languages (814 | 8.6%) are the most common fields of study among 9,518 individuals in State College borough who have obtained a bachelor's degree or higher.
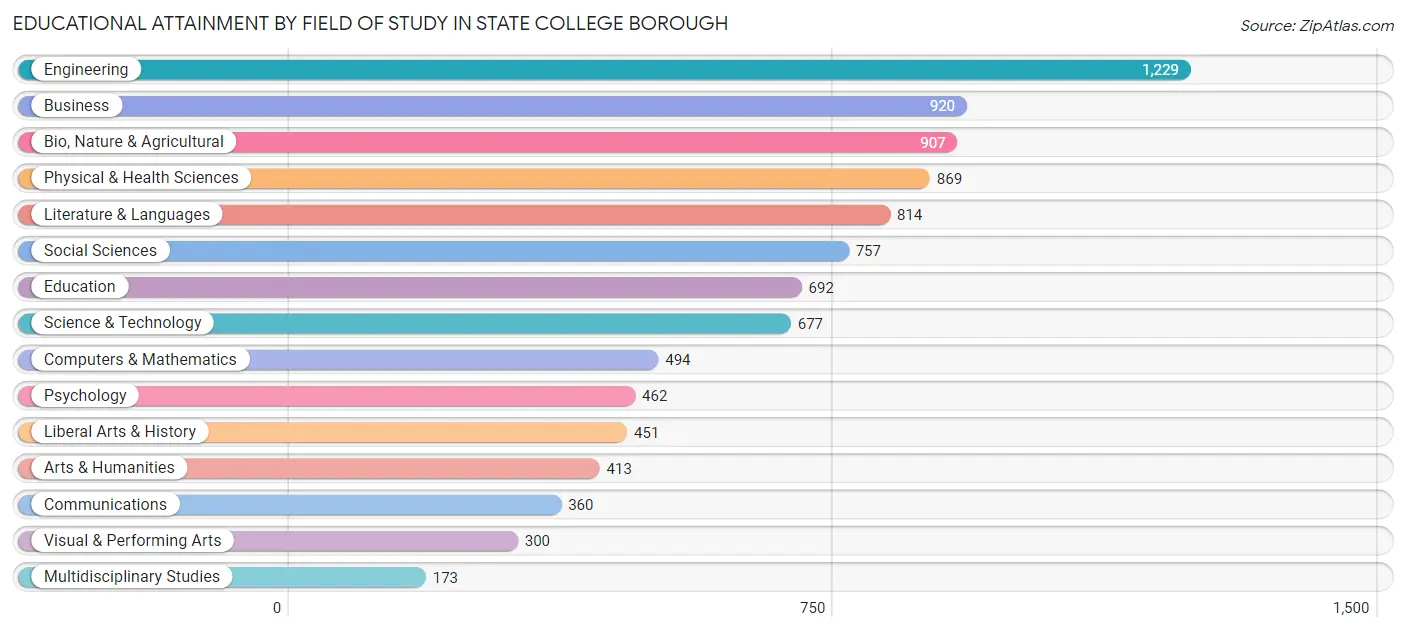
| Field of Study | # Graduates | % Graduates |
| Computers & Mathematics | 494 | 5.2% |
| Bio, Nature & Agricultural | 907 | 9.5% |
| Physical & Health Sciences | 869 | 9.1% |
| Psychology | 462 | 4.9% |
| Social Sciences | 757 | 8.0% |
| Engineering | 1,229 | 12.9% |
| Multidisciplinary Studies | 173 | 1.8% |
| Science & Technology | 677 | 7.1% |
| Business | 920 | 9.7% |
| Education | 692 | 7.3% |
| Literature & Languages | 814 | 8.6% |
| Liberal Arts & History | 451 | 4.7% |
| Visual & Performing Arts | 300 | 3.2% |
| Communications | 360 | 3.8% |
| Arts & Humanities | 413 | 4.3% |
| Total | 9,518 | 100.0% |
Transportation & Commute in State College borough
Vehicle Availability by Sex in State College borough
The most prevalent vehicle ownership categories in State College borough are males with 1 vehicle (2,884, accounting for 38.6%) and females with 1 vehicle (1,906, making up 52.2%).
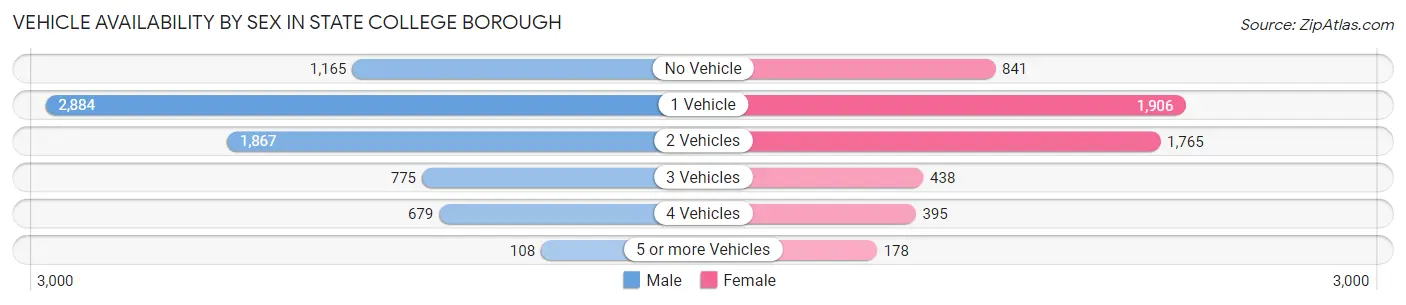
| Vehicles Available | Male | Female |
| No Vehicle | 1,165 (15.6%) | 841 (15.2%) |
| 1 Vehicle | 2,884 (38.6%) | 1,906 (34.5%) |
| 2 Vehicles | 1,867 (25.0%) | 1,765 (32.0%) |
| 3 Vehicles | 775 (10.4%) | 438 (7.9%) |
| 4 Vehicles | 679 (9.1%) | 395 (7.1%) |
| 5 or more Vehicles | 108 (1.4%) | 178 (3.2%) |
| Total | 7,478 (100.0%) | 5,523 (100.0%) |
Commute Time in State College borough
The most frequently occuring commute durations in State College borough are 10 to 14 minutes (3,810 commuters, 28.7%), 5 to 9 minutes (2,614 commuters, 19.7%), and 15 to 19 minutes (2,605 commuters, 19.6%).
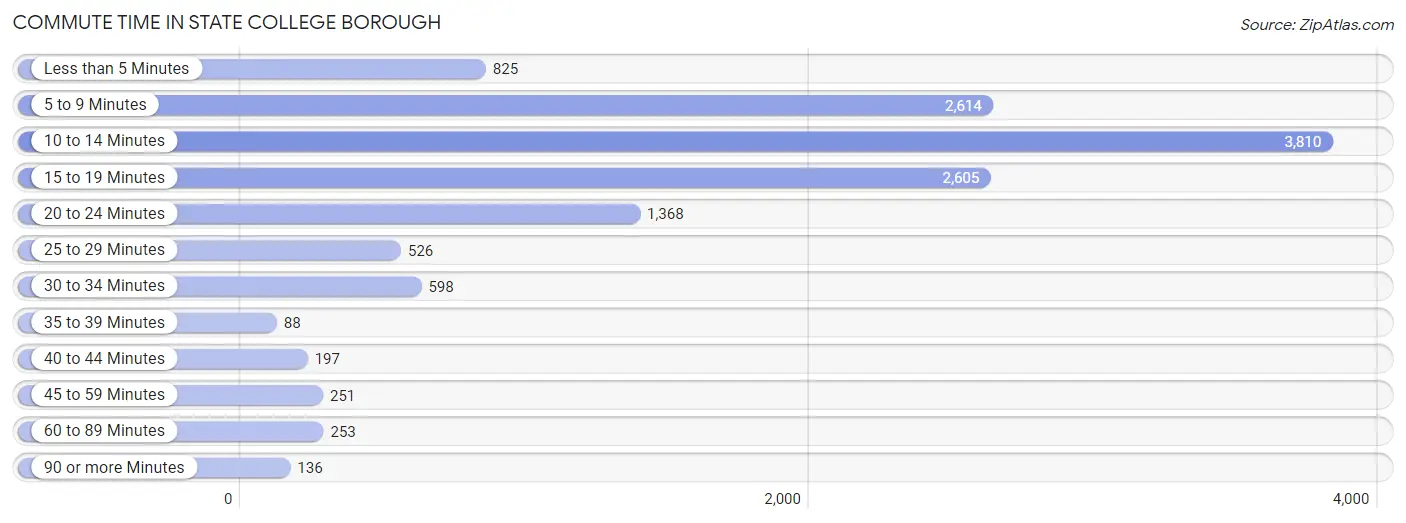
| Commute Time | # Commuters | % Commuters |
| Less than 5 Minutes | 825 | 6.2% |
| 5 to 9 Minutes | 2,614 | 19.7% |
| 10 to 14 Minutes | 3,810 | 28.7% |
| 15 to 19 Minutes | 2,605 | 19.6% |
| 20 to 24 Minutes | 1,368 | 10.3% |
| 25 to 29 Minutes | 526 | 4.0% |
| 30 to 34 Minutes | 598 | 4.5% |
| 35 to 39 Minutes | 88 | 0.7% |
| 40 to 44 Minutes | 197 | 1.5% |
| 45 to 59 Minutes | 251 | 1.9% |
| 60 to 89 Minutes | 253 | 1.9% |
| 90 or more Minutes | 136 | 1.0% |
Commute Time by Sex in State College borough
The most common commute times in State College borough are 10 to 14 minutes (2,166 commuters, 28.5%) for males and 10 to 14 minutes (1,644 commuters, 29.0%) for females.
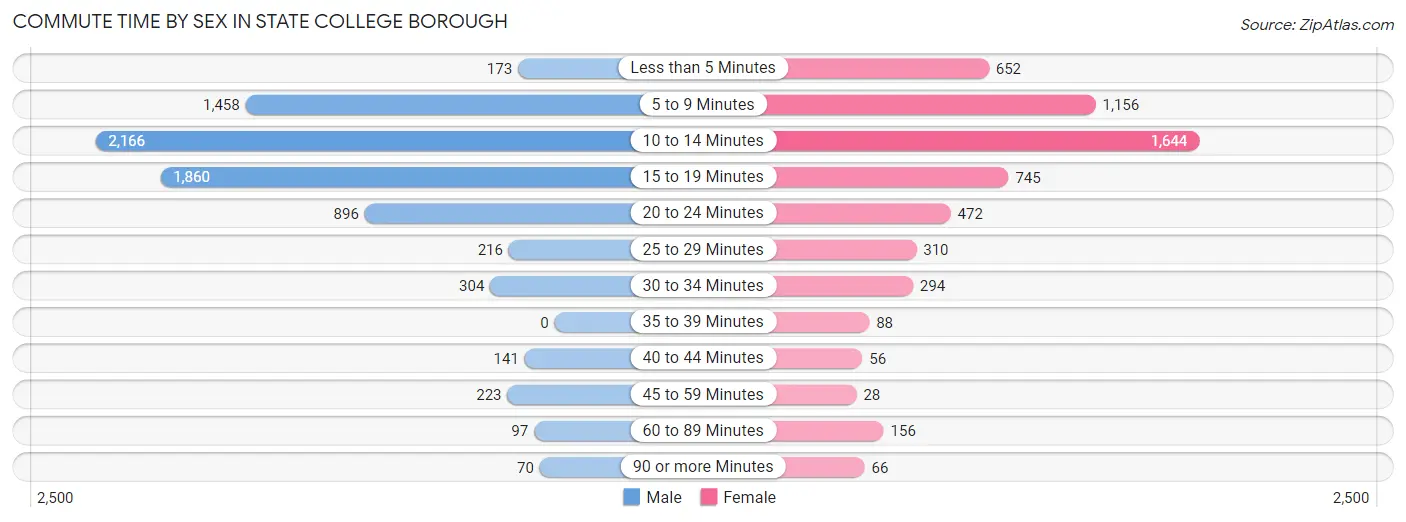
| Commute Time | Male | Female |
| Less than 5 Minutes | 173 (2.3%) | 652 (11.5%) |
| 5 to 9 Minutes | 1,458 (19.2%) | 1,156 (20.4%) |
| 10 to 14 Minutes | 2,166 (28.5%) | 1,644 (29.0%) |
| 15 to 19 Minutes | 1,860 (24.5%) | 745 (13.2%) |
| 20 to 24 Minutes | 896 (11.8%) | 472 (8.3%) |
| 25 to 29 Minutes | 216 (2.8%) | 310 (5.5%) |
| 30 to 34 Minutes | 304 (4.0%) | 294 (5.2%) |
| 35 to 39 Minutes | 0 (0.0%) | 88 (1.5%) |
| 40 to 44 Minutes | 141 (1.8%) | 56 (1.0%) |
| 45 to 59 Minutes | 223 (2.9%) | 28 (0.5%) |
| 60 to 89 Minutes | 97 (1.3%) | 156 (2.8%) |
| 90 or more Minutes | 70 (0.9%) | 66 (1.2%) |
Time of Departure to Work by Sex in State College borough
The most frequent times of departure to work in State College borough are 9:00 AM to 9:59 AM (1,050, 13.8%) for males and 9:00 AM to 9:59 AM (867, 15.3%) for females.
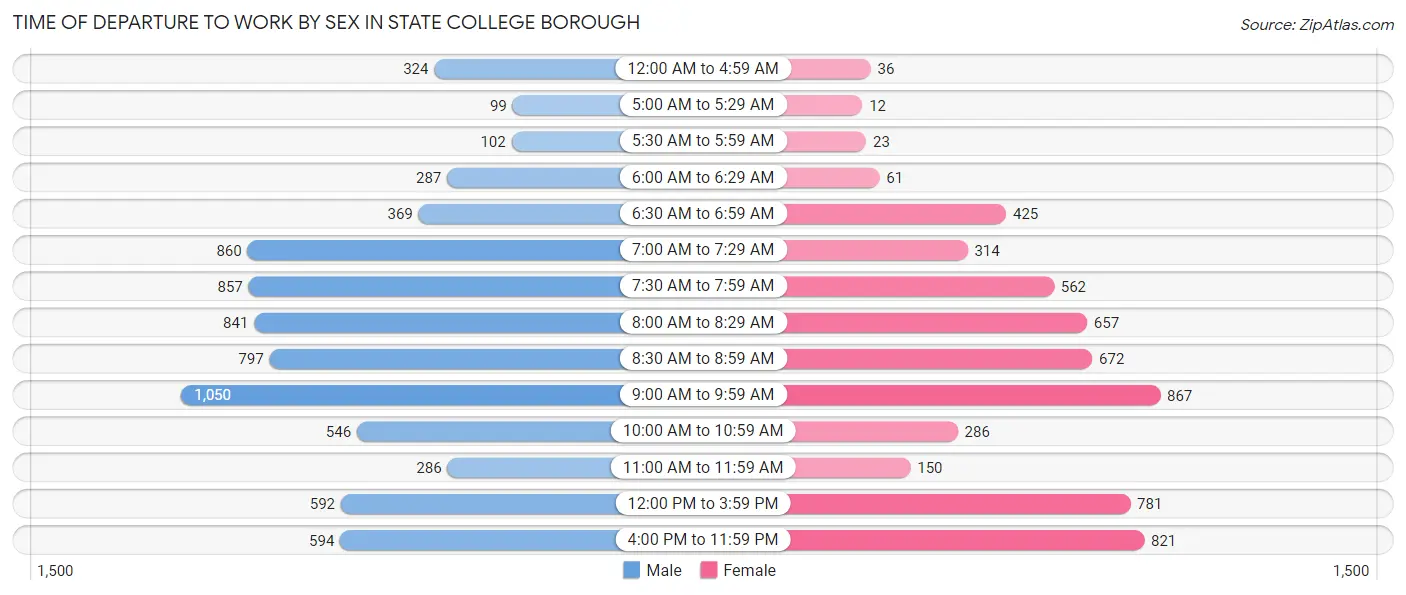
| Time of Departure | Male | Female |
| 12:00 AM to 4:59 AM | 324 (4.3%) | 36 (0.6%) |
| 5:00 AM to 5:29 AM | 99 (1.3%) | 12 (0.2%) |
| 5:30 AM to 5:59 AM | 102 (1.3%) | 23 (0.4%) |
| 6:00 AM to 6:29 AM | 287 (3.8%) | 61 (1.1%) |
| 6:30 AM to 6:59 AM | 369 (4.9%) | 425 (7.5%) |
| 7:00 AM to 7:29 AM | 860 (11.3%) | 314 (5.5%) |
| 7:30 AM to 7:59 AM | 857 (11.3%) | 562 (9.9%) |
| 8:00 AM to 8:29 AM | 841 (11.1%) | 657 (11.6%) |
| 8:30 AM to 8:59 AM | 797 (10.5%) | 672 (11.9%) |
| 9:00 AM to 9:59 AM | 1,050 (13.8%) | 867 (15.3%) |
| 10:00 AM to 10:59 AM | 546 (7.2%) | 286 (5.1%) |
| 11:00 AM to 11:59 AM | 286 (3.8%) | 150 (2.6%) |
| 12:00 PM to 3:59 PM | 592 (7.8%) | 781 (13.8%) |
| 4:00 PM to 11:59 PM | 594 (7.8%) | 821 (14.5%) |
| Total | 7,604 (100.0%) | 5,667 (100.0%) |
Housing Occupancy in State College borough
Occupancy by Ownership in State College borough
Of the total 11,357 dwellings in State College borough, owner-occupied units account for 2,976 (26.2%), while renter-occupied units make up 8,381 (73.8%).
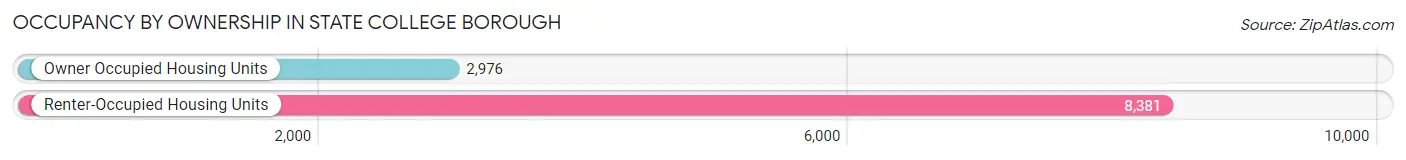
| Occupancy | # Housing Units | % Housing Units |
| Owner Occupied Housing Units | 2,976 | 26.2% |
| Renter-Occupied Housing Units | 8,381 | 73.8% |
| Total Occupied Housing Units | 11,357 | 100.0% |
Occupancy by Household Size in State College borough
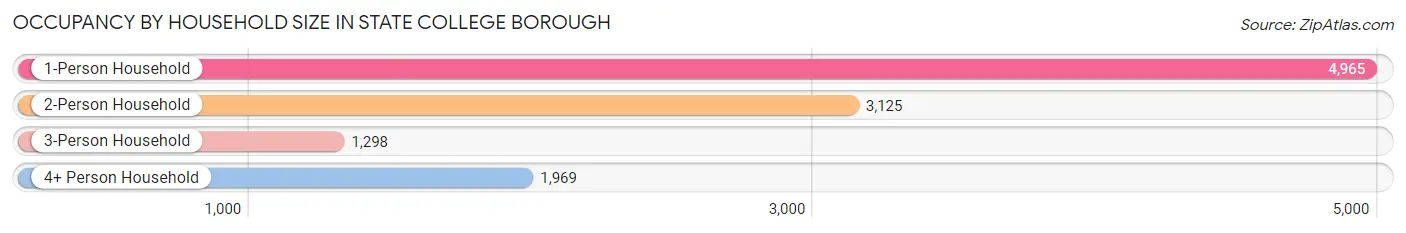
| Household Size | # Housing Units | % Housing Units |
| 1-Person Household | 4,965 | 43.7% |
| 2-Person Household | 3,125 | 27.5% |
| 3-Person Household | 1,298 | 11.4% |
| 4+ Person Household | 1,969 | 17.3% |
| Total Housing Units | 11,357 | 100.0% |
Occupancy by Ownership by Household Size in State College borough
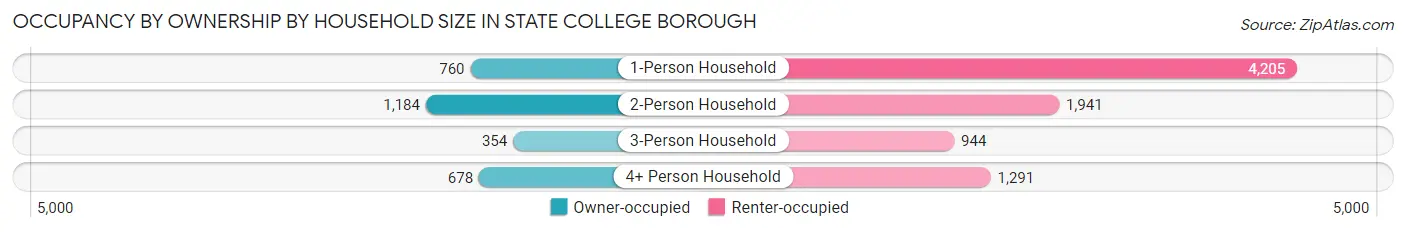
| Household Size | Owner-occupied | Renter-occupied |
| 1-Person Household | 760 (15.3%) | 4,205 (84.7%) |
| 2-Person Household | 1,184 (37.9%) | 1,941 (62.1%) |
| 3-Person Household | 354 (27.3%) | 944 (72.7%) |
| 4+ Person Household | 678 (34.4%) | 1,291 (65.6%) |
| Total Housing Units | 2,976 (26.2%) | 8,381 (73.8%) |
Occupancy by Educational Attainment in State College borough
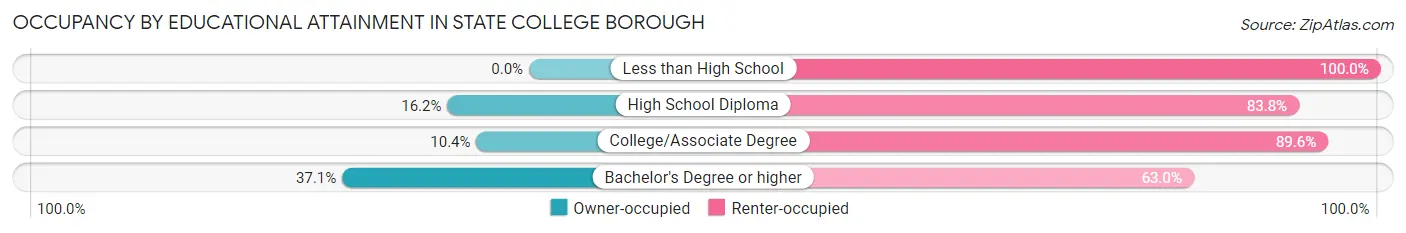
| Household Size | Owner-occupied | Renter-occupied |
| Less than High School | 0 (0.0%) | 135 (100.0%) |
| High School Diploma | 274 (16.2%) | 1,418 (83.8%) |
| College/Associate Degree | 325 (10.4%) | 2,790 (89.6%) |
| Bachelor's Degree or higher | 2,377 (37.0%) | 4,038 (62.9%) |
Occupancy by Age of Householder in State College borough
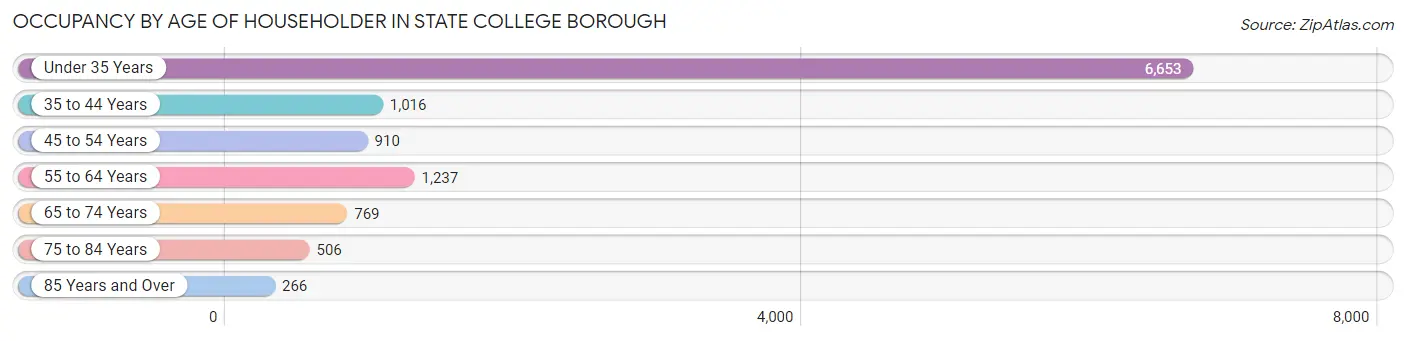
| Age Bracket | # Households | % Households |
| Under 35 Years | 6,653 | 58.6% |
| 35 to 44 Years | 1,016 | 8.9% |
| 45 to 54 Years | 910 | 8.0% |
| 55 to 64 Years | 1,237 | 10.9% |
| 65 to 74 Years | 769 | 6.8% |
| 75 to 84 Years | 506 | 4.5% |
| 85 Years and Over | 266 | 2.3% |
| Total | 11,357 | 100.0% |
Housing Finances in State College borough
Median Income by Occupancy in State College borough
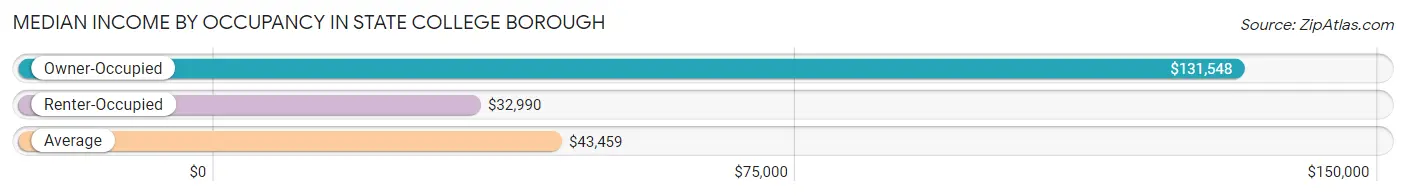
| Occupancy Type | # Households | Median Income |
| Owner-Occupied | 2,976 (26.2%) | $131,548 |
| Renter-Occupied | 8,381 (73.8%) | $32,990 |
| Average | 11,357 (100.0%) | $43,459 |
Occupancy by Householder Income Bracket in State College borough
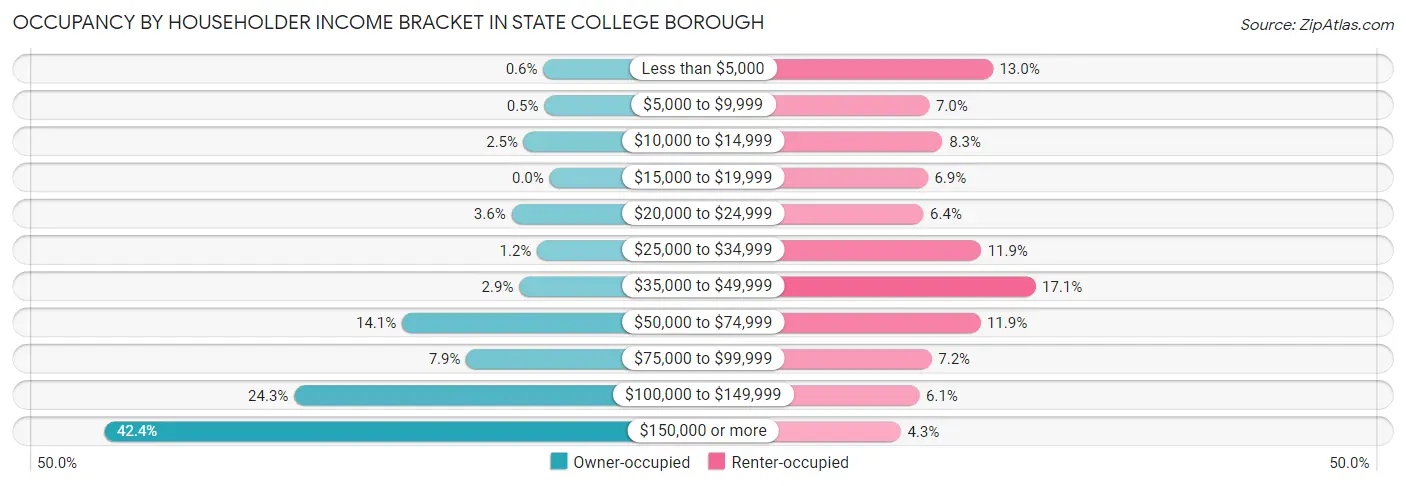
| Income Bracket | Owner-occupied | Renter-occupied |
| Less than $5,000 | 18 (0.6%) | 1,093 (13.0%) |
| $5,000 to $9,999 | 15 (0.5%) | 586 (7.0%) |
| $10,000 to $14,999 | 73 (2.5%) | 692 (8.3%) |
| $15,000 to $19,999 | 0 (0.0%) | 574 (6.9%) |
| $20,000 to $24,999 | 108 (3.6%) | 540 (6.4%) |
| $25,000 to $34,999 | 35 (1.2%) | 999 (11.9%) |
| $35,000 to $49,999 | 86 (2.9%) | 1,433 (17.1%) |
| $50,000 to $74,999 | 418 (14.1%) | 993 (11.8%) |
| $75,000 to $99,999 | 236 (7.9%) | 605 (7.2%) |
| $100,000 to $149,999 | 724 (24.3%) | 507 (6.0%) |
| $150,000 or more | 1,263 (42.4%) | 359 (4.3%) |
| Total | 2,976 (100.0%) | 8,381 (100.0%) |
Monthly Housing Cost Tiers in State College borough
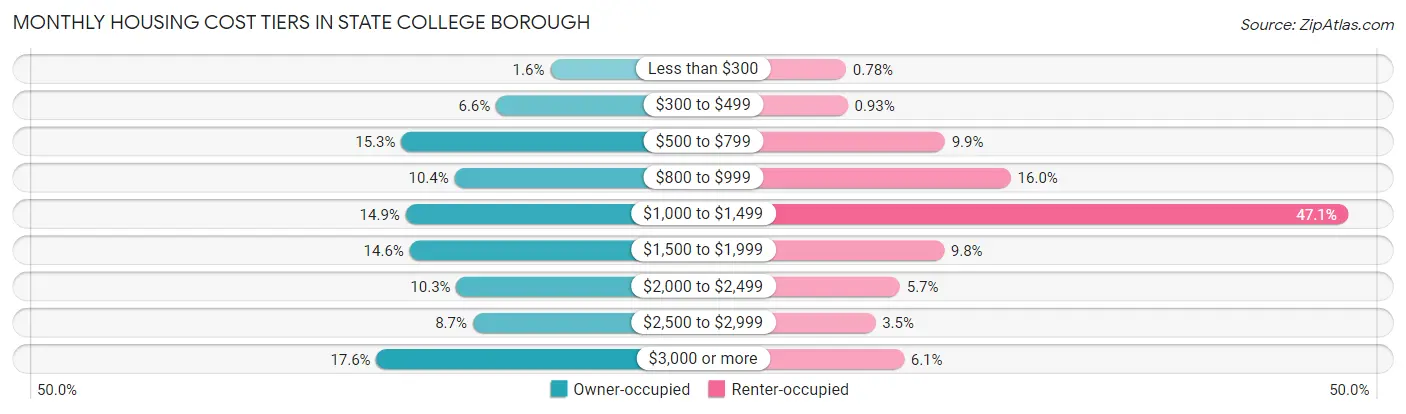
| Monthly Cost | Owner-occupied | Renter-occupied |
| Less than $300 | 48 (1.6%) | 65 (0.8%) |
| $300 to $499 | 196 (6.6%) | 78 (0.9%) |
| $500 to $799 | 456 (15.3%) | 828 (9.9%) |
| $800 to $999 | 310 (10.4%) | 1,337 (16.0%) |
| $1,000 to $1,499 | 444 (14.9%) | 3,944 (47.1%) |
| $1,500 to $1,999 | 433 (14.5%) | 821 (9.8%) |
| $2,000 to $2,499 | 305 (10.2%) | 481 (5.7%) |
| $2,500 to $2,999 | 260 (8.7%) | 292 (3.5%) |
| $3,000 or more | 524 (17.6%) | 512 (6.1%) |
| Total | 2,976 (100.0%) | 8,381 (100.0%) |
Physical Housing Characteristics in State College borough
Housing Structures in State College borough
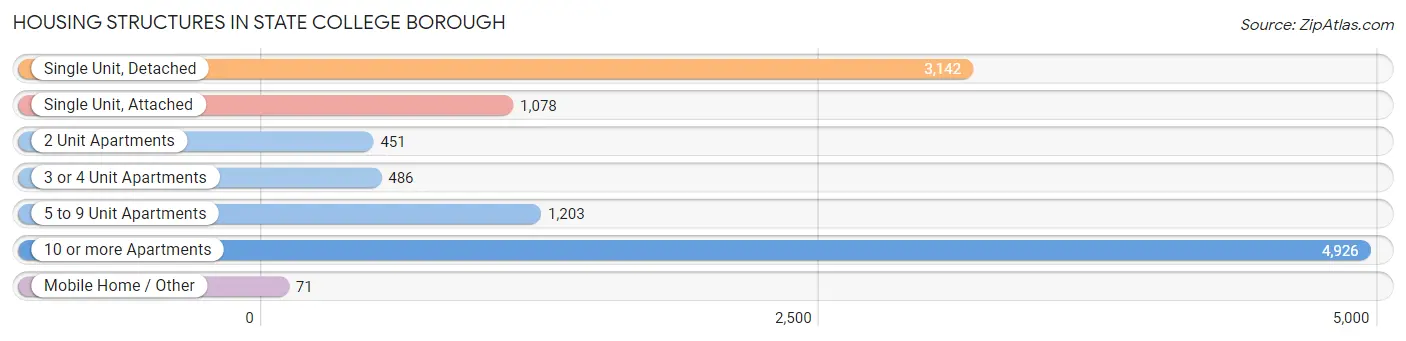
| Structure Type | # Housing Units | % Housing Units |
| Single Unit, Detached | 3,142 | 27.7% |
| Single Unit, Attached | 1,078 | 9.5% |
| 2 Unit Apartments | 451 | 4.0% |
| 3 or 4 Unit Apartments | 486 | 4.3% |
| 5 to 9 Unit Apartments | 1,203 | 10.6% |
| 10 or more Apartments | 4,926 | 43.4% |
| Mobile Home / Other | 71 | 0.6% |
| Total | 11,357 | 100.0% |
Housing Structures by Occupancy in State College borough
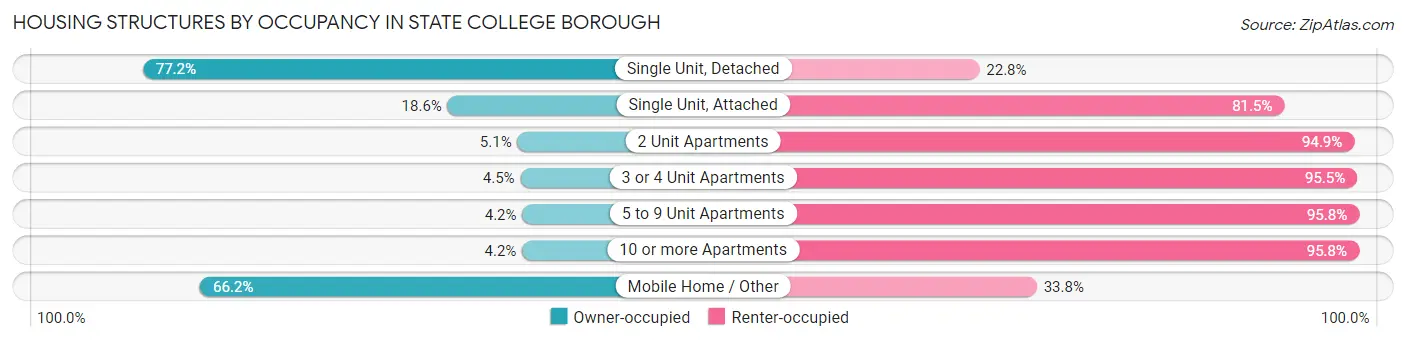
| Structure Type | Owner-occupied | Renter-occupied |
| Single Unit, Detached | 2,427 (77.2%) | 715 (22.8%) |
| Single Unit, Attached | 200 (18.5%) | 878 (81.5%) |
| 2 Unit Apartments | 23 (5.1%) | 428 (94.9%) |
| 3 or 4 Unit Apartments | 22 (4.5%) | 464 (95.5%) |
| 5 to 9 Unit Apartments | 50 (4.2%) | 1,153 (95.8%) |
| 10 or more Apartments | 207 (4.2%) | 4,719 (95.8%) |
| Mobile Home / Other | 47 (66.2%) | 24 (33.8%) |
| Total | 2,976 (26.2%) | 8,381 (73.8%) |
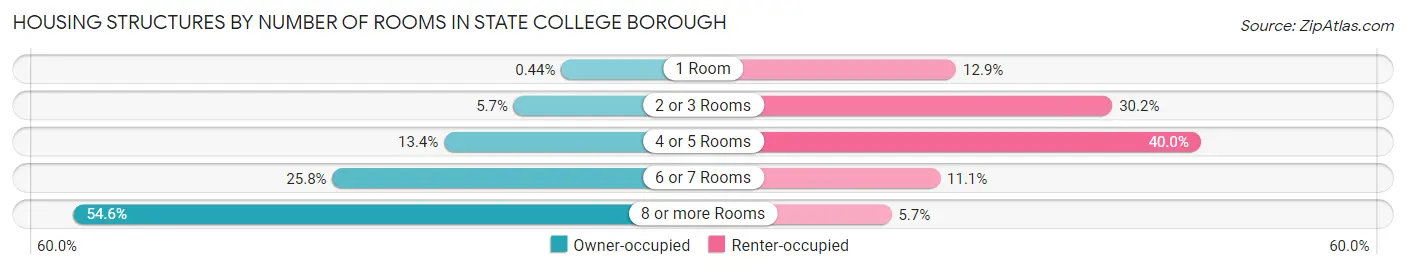
Housing Structures by Number of Rooms in State College borough
| Number of Rooms | Owner-occupied | Renter-occupied |
| 1 Room | 13 (0.4%) | 1,081 (12.9%) |
| 2 or 3 Rooms | 170 (5.7%) | 2,533 (30.2%) |
| 4 or 5 Rooms | 400 (13.4%) | 3,356 (40.0%) |
| 6 or 7 Rooms | 769 (25.8%) | 932 (11.1%) |
| 8 or more Rooms | 1,624 (54.6%) | 479 (5.7%) |
| Total | 2,976 (100.0%) | 8,381 (100.0%) |
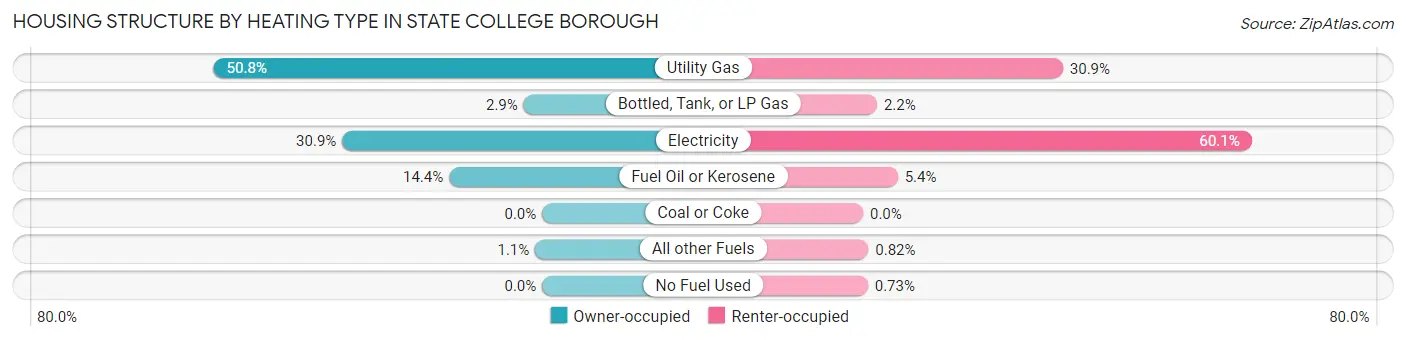
Housing Structure by Heating Type in State College borough
| Heating Type | Owner-occupied | Renter-occupied |
| Utility Gas | 1,511 (50.8%) | 2,589 (30.9%) |
| Bottled, Tank, or LP Gas | 85 (2.9%) | 180 (2.1%) |
| Electricity | 920 (30.9%) | 5,033 (60.1%) |
| Fuel Oil or Kerosene | 428 (14.4%) | 449 (5.4%) |
| Coal or Coke | 0 (0.0%) | 0 (0.0%) |
| All other Fuels | 32 (1.1%) | 69 (0.8%) |
| No Fuel Used | 0 (0.0%) | 61 (0.7%) |
| Total | 2,976 (100.0%) | 8,381 (100.0%) |
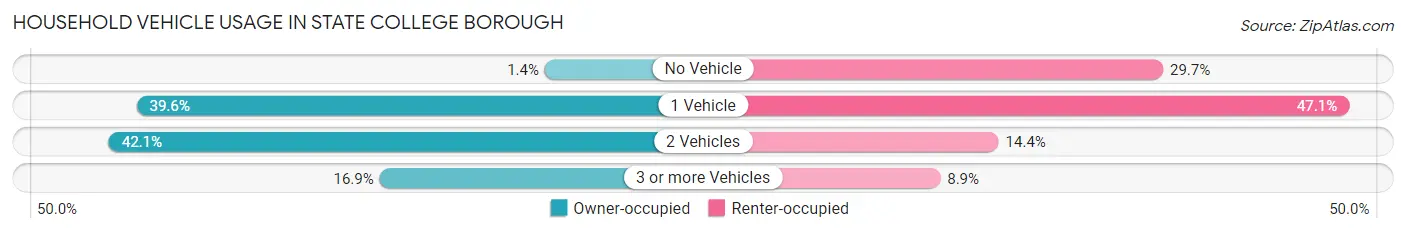
Household Vehicle Usage in State College borough
| Vehicles per Household | Owner-occupied | Renter-occupied |
| No Vehicle | 43 (1.4%) | 2,489 (29.7%) |
| 1 Vehicle | 1,177 (39.6%) | 3,943 (47.0%) |
| 2 Vehicles | 1,254 (42.1%) | 1,203 (14.3%) |
| 3 or more Vehicles | 502 (16.9%) | 746 (8.9%) |
| Total | 2,976 (100.0%) | 8,381 (100.0%) |
Real Estate & Mortgages in State College borough
Real Estate and Mortgage Overview in State College borough
| Characteristic | Without Mortgage | With Mortgage |
| Housing Units | 1,049 | 1,927 |
| Median Property Value | $343,100 | $414,500 |
| Median Household Income | $114,522 | $916 |
| Monthly Housing Costs | $742 | $515 |
| Real Estate Taxes | $4,309 | $31 |
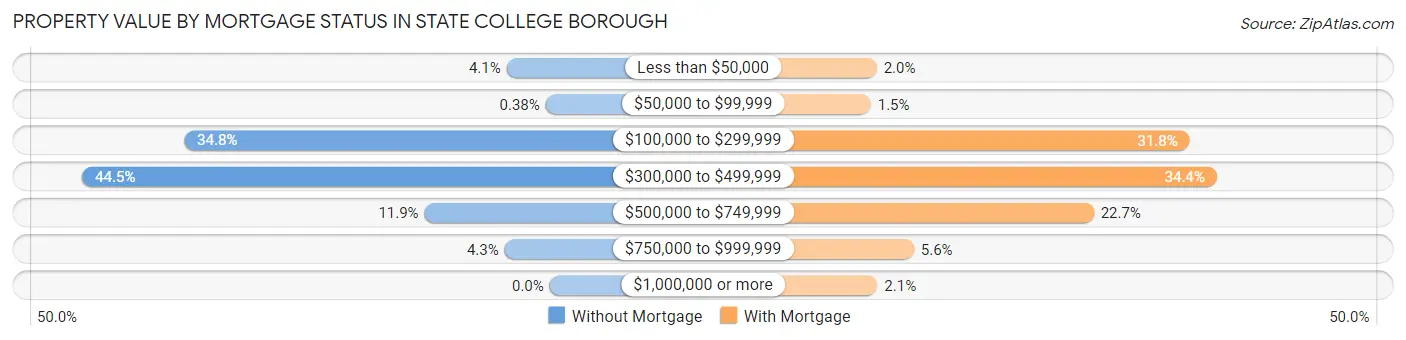
Property Value by Mortgage Status in State College borough
| Property Value | Without Mortgage | With Mortgage |
| Less than $50,000 | 43 (4.1%) | 39 (2.0%) |
| $50,000 to $99,999 | 4 (0.4%) | 28 (1.5%) |
| $100,000 to $299,999 | 365 (34.8%) | 613 (31.8%) |
| $300,000 to $499,999 | 467 (44.5%) | 663 (34.4%) |
| $500,000 to $749,999 | 125 (11.9%) | 437 (22.7%) |
| $750,000 to $999,999 | 45 (4.3%) | 107 (5.6%) |
| $1,000,000 or more | 0 (0.0%) | 40 (2.1%) |
| Total | 1,049 (100.0%) | 1,927 (100.0%) |
Household Income by Mortgage Status in State College borough
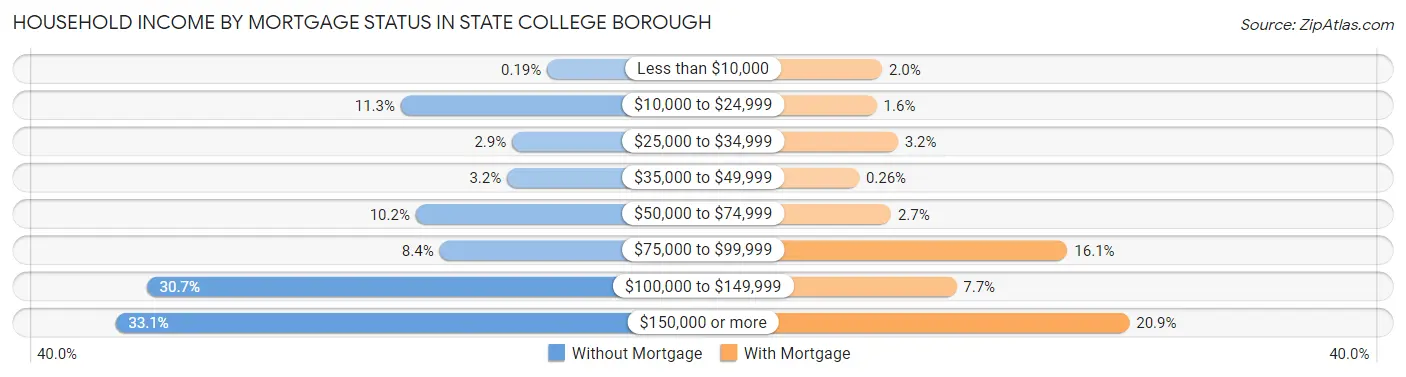
| Household Income | Without Mortgage | With Mortgage |
| Less than $10,000 | 2 (0.2%) | 39 (2.0%) |
| $10,000 to $24,999 | 119 (11.3%) | 31 (1.6%) |
| $25,000 to $34,999 | 30 (2.9%) | 62 (3.2%) |
| $35,000 to $49,999 | 34 (3.2%) | 5 (0.3%) |
| $50,000 to $74,999 | 107 (10.2%) | 52 (2.7%) |
| $75,000 to $99,999 | 88 (8.4%) | 311 (16.1%) |
| $100,000 to $149,999 | 322 (30.7%) | 148 (7.7%) |
| $150,000 or more | 347 (33.1%) | 402 (20.9%) |
| Total | 1,049 (100.0%) | 1,927 (100.0%) |
Property Value to Household Income Ratio in State College borough
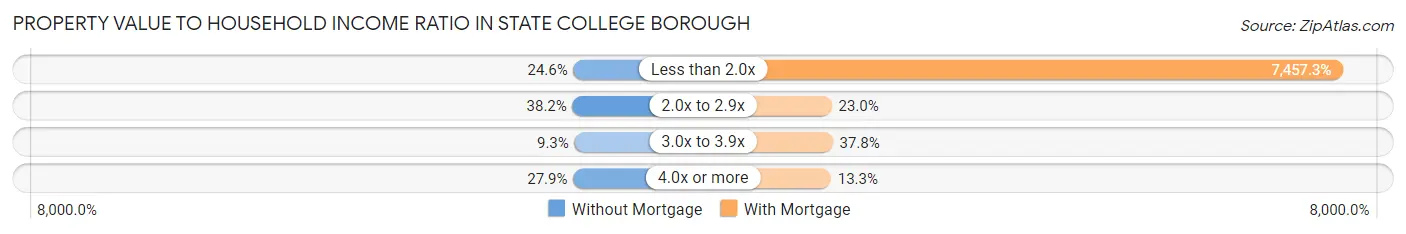
| Value-to-Income Ratio | Without Mortgage | With Mortgage |
| Less than 2.0x | 258 (24.6%) | 143,702 (7,457.3%) |
| 2.0x to 2.9x | 401 (38.2%) | 444 (23.0%) |
| 3.0x to 3.9x | 97 (9.2%) | 729 (37.8%) |
| 4.0x or more | 293 (27.9%) | 256 (13.3%) |
| Total | 1,049 (100.0%) | 1,927 (100.0%) |
Real Estate Taxes by Mortgage Status in State College borough
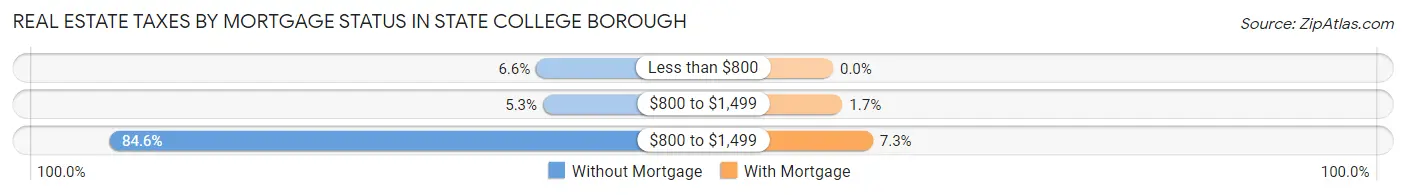
| Property Taxes | Without Mortgage | With Mortgage |
| Less than $800 | 69 (6.6%) | 0 (0.0%) |
| $800 to $1,499 | 56 (5.3%) | 33 (1.7%) |
| $800 to $1,499 | 887 (84.6%) | 140 (7.3%) |
| Total | 1,049 (100.0%) | 1,927 (100.0%) |
Health & Disability in State College borough
Health Insurance Coverage by Age in State College borough
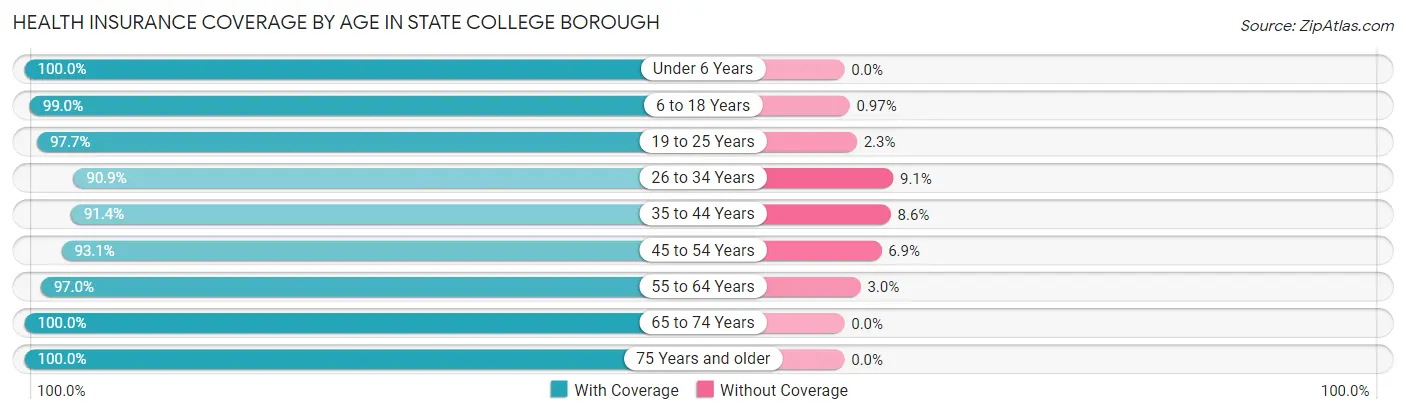
| Age Bracket | With Coverage | Without Coverage |
| Under 6 Years | 790 (100.0%) | 0 (0.0%) |
| 6 to 18 Years | 6,465 (99.0%) | 63 (1.0%) |
| 19 to 25 Years | 21,691 (97.7%) | 516 (2.3%) |
| 26 to 34 Years | 3,290 (90.9%) | 329 (9.1%) |
| 35 to 44 Years | 1,716 (91.4%) | 162 (8.6%) |
| 45 to 54 Years | 1,489 (93.1%) | 110 (6.9%) |
| 55 to 64 Years | 1,709 (97.0%) | 53 (3.0%) |
| 65 to 74 Years | 1,216 (100.0%) | 0 (0.0%) |
| 75 Years and older | 1,058 (100.0%) | 0 (0.0%) |
| Total | 39,424 (97.0%) | 1,233 (3.0%) |
Health Insurance Coverage by Citizenship Status in State College borough
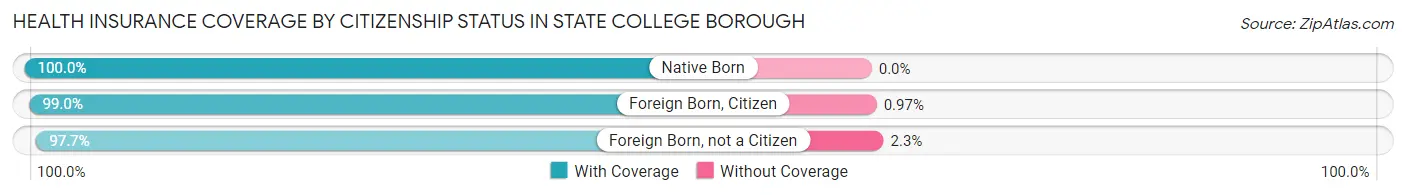
| Citizenship Status | With Coverage | Without Coverage |
| Native Born | 790 (100.0%) | 0 (0.0%) |
| Foreign Born, Citizen | 6,465 (99.0%) | 63 (1.0%) |
| Foreign Born, not a Citizen | 21,691 (97.7%) | 516 (2.3%) |
Health Insurance Coverage by Household Income in State College borough
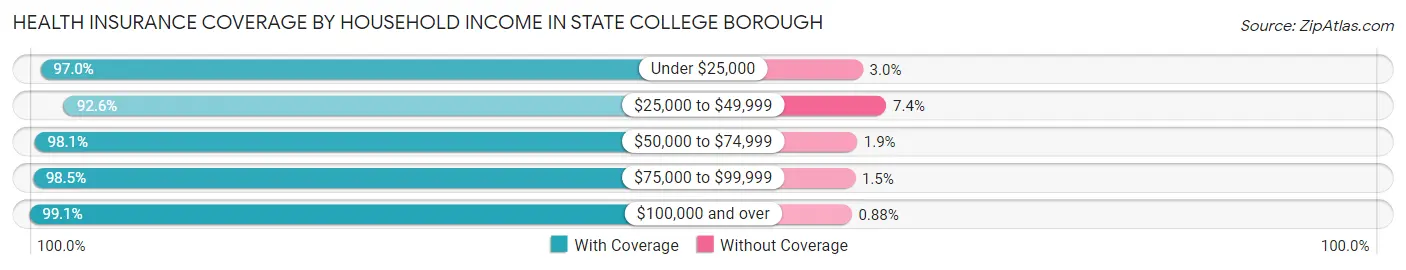
| Household Income | With Coverage | Without Coverage |
| Under $25,000 | 7,584 (97.0%) | 232 (3.0%) |
| $25,000 to $49,999 | 5,911 (92.6%) | 470 (7.4%) |
| $50,000 to $74,999 | 2,761 (98.1%) | 53 (1.9%) |
| $75,000 to $99,999 | 2,125 (98.5%) | 33 (1.5%) |
| $100,000 and over | 8,121 (99.1%) | 72 (0.9%) |
Public vs Private Health Insurance Coverage by Age in State College borough
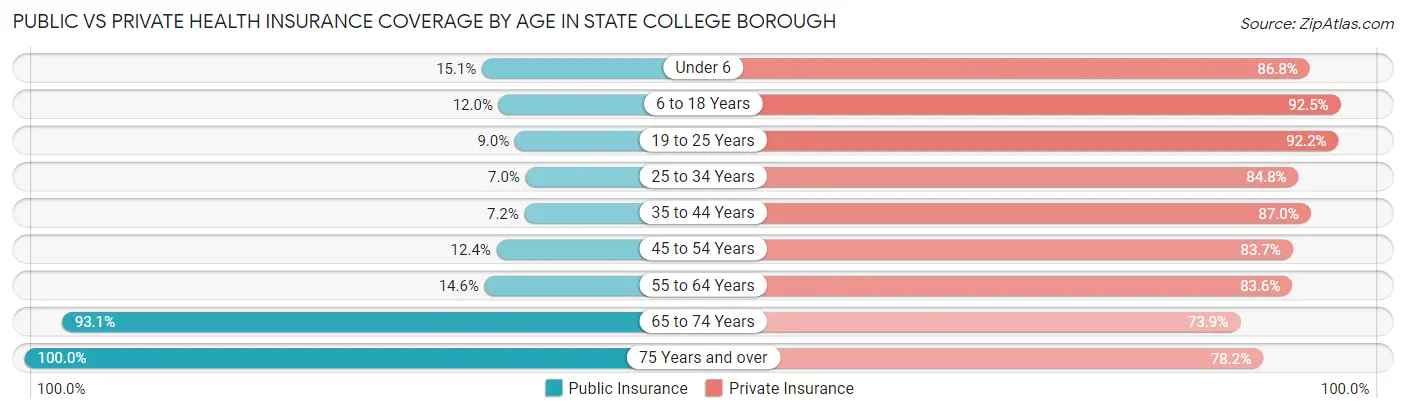
| Age Bracket | Public Insurance | Private Insurance |
| Under 6 | 119 (15.1%) | 686 (86.8%) |
| 6 to 18 Years | 783 (12.0%) | 6,041 (92.5%) |
| 19 to 25 Years | 1,989 (9.0%) | 20,468 (92.2%) |
| 25 to 34 Years | 253 (7.0%) | 3,067 (84.8%) |
| 35 to 44 Years | 135 (7.2%) | 1,634 (87.0%) |
| 45 to 54 Years | 198 (12.4%) | 1,338 (83.7%) |
| 55 to 64 Years | 257 (14.6%) | 1,473 (83.6%) |
| 65 to 74 Years | 1,132 (93.1%) | 899 (73.9%) |
| 75 Years and over | 1,058 (100.0%) | 827 (78.2%) |
| Total | 5,924 (14.6%) | 36,433 (89.6%) |
Disability Status by Sex by Age in State College borough
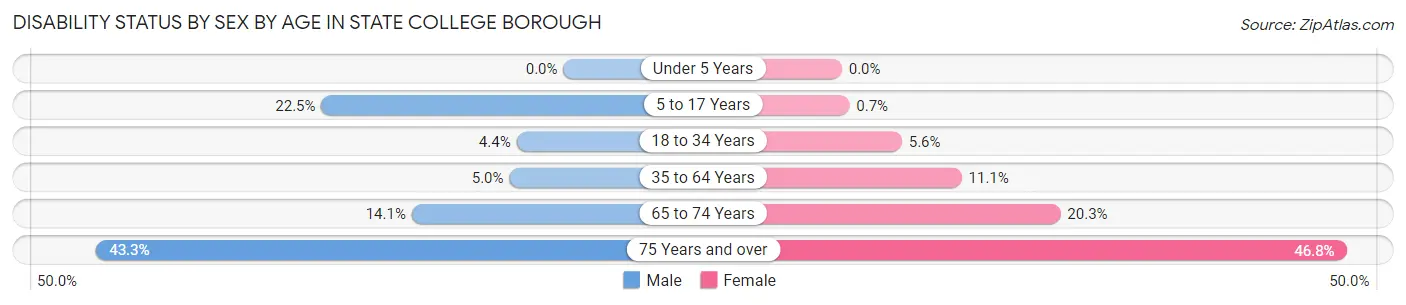
| Age Bracket | Male | Female |
| Under 5 Years | 0 (0.0%) | 0 (0.0%) |
| 5 to 17 Years | 228 (22.5%) | 7 (0.7%) |
| 18 to 34 Years | 733 (4.3%) | 759 (5.6%) |
| 35 to 64 Years | 139 (5.0%) | 274 (11.1%) |
| 65 to 74 Years | 83 (14.1%) | 127 (20.3%) |
| 75 Years and over | 192 (43.3%) | 288 (46.8%) |
Disability Class by Sex by Age in State College borough
Disability Class: Hearing Difficulty
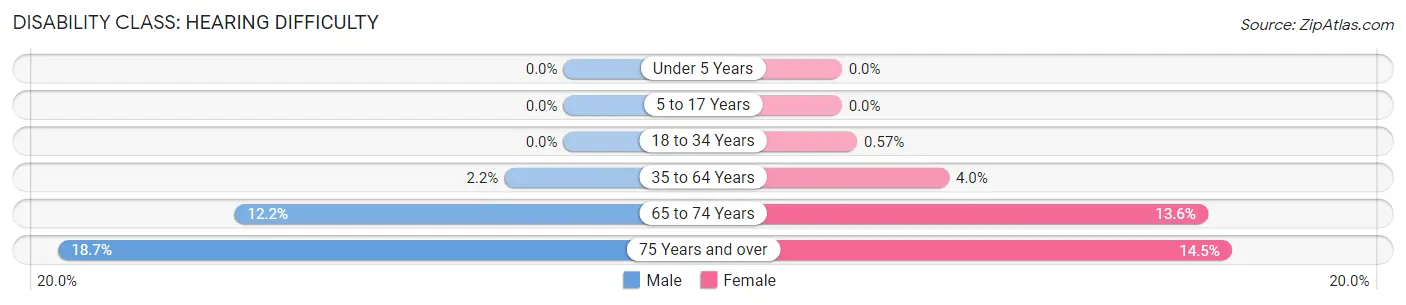
| Age Bracket | Male | Female |
| Under 5 Years | 0 (0.0%) | 0 (0.0%) |
| 5 to 17 Years | 0 (0.0%) | 0 (0.0%) |
| 18 to 34 Years | 0 (0.0%) | 78 (0.6%) |
| 35 to 64 Years | 61 (2.2%) | 98 (4.0%) |
| 65 to 74 Years | 72 (12.2%) | 85 (13.6%) |
| 75 Years and over | 83 (18.7%) | 89 (14.5%) |
Disability Class: Vision Difficulty
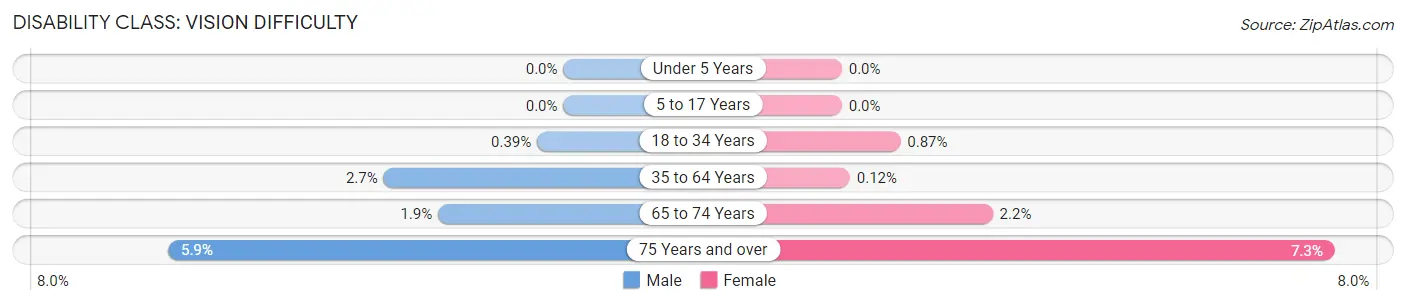
| Age Bracket | Male | Female |
| Under 5 Years | 0 (0.0%) | 0 (0.0%) |
| 5 to 17 Years | 0 (0.0%) | 0 (0.0%) |
| 18 to 34 Years | 66 (0.4%) | 118 (0.9%) |
| 35 to 64 Years | 74 (2.7%) | 3 (0.1%) |
| 65 to 74 Years | 11 (1.9%) | 14 (2.2%) |
| 75 Years and over | 26 (5.9%) | 45 (7.3%) |
Disability Class: Cognitive Difficulty
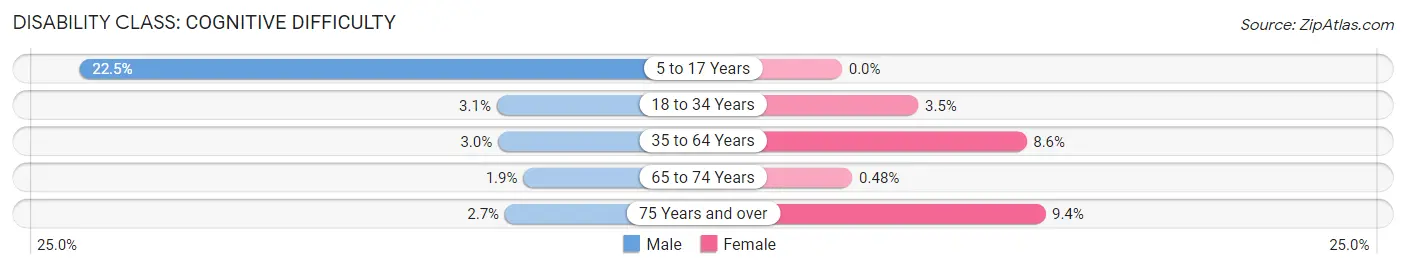
| Age Bracket | Male | Female |
| 5 to 17 Years | 228 (22.5%) | 0 (0.0%) |
| 18 to 34 Years | 520 (3.1%) | 482 (3.5%) |
| 35 to 64 Years | 84 (3.0%) | 211 (8.6%) |
| 65 to 74 Years | 11 (1.9%) | 3 (0.5%) |
| 75 Years and over | 12 (2.7%) | 58 (9.4%) |
Disability Class: Ambulatory Difficulty
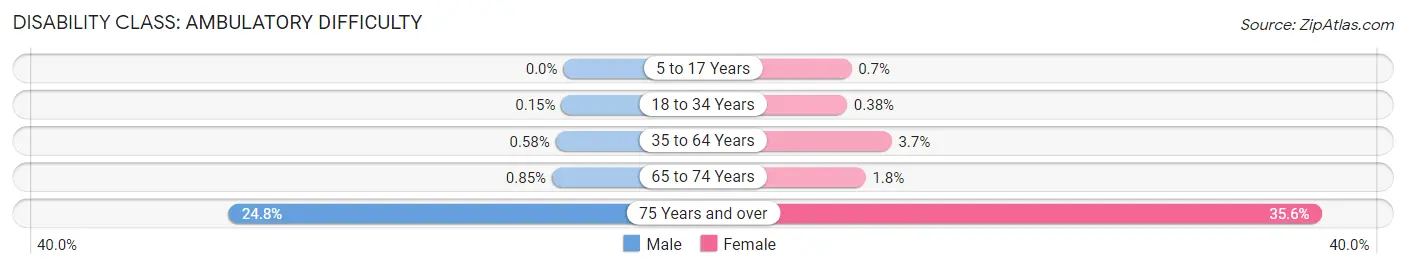
| Age Bracket | Male | Female |
| 5 to 17 Years | 0 (0.0%) | 7 (0.7%) |
| 18 to 34 Years | 25 (0.2%) | 52 (0.4%) |
| 35 to 64 Years | 16 (0.6%) | 91 (3.7%) |
| 65 to 74 Years | 5 (0.9%) | 11 (1.8%) |
| 75 Years and over | 110 (24.8%) | 219 (35.6%) |
Disability Class: Self-Care Difficulty
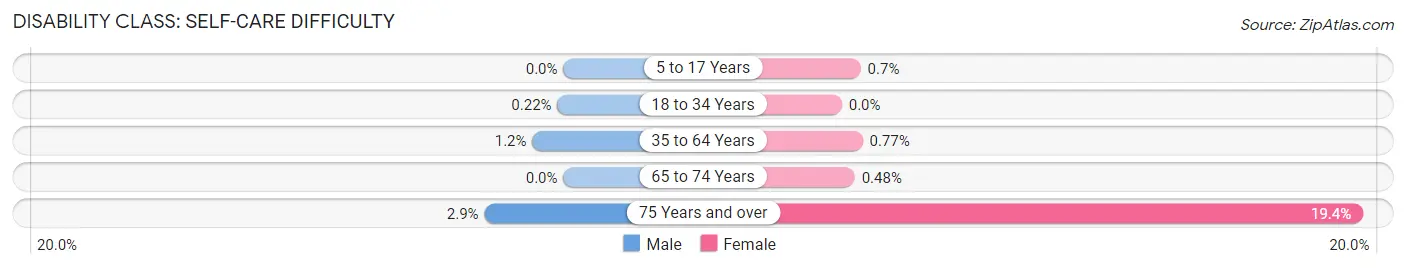
| Age Bracket | Male | Female |
| 5 to 17 Years | 0 (0.0%) | 7 (0.7%) |
| 18 to 34 Years | 37 (0.2%) | 0 (0.0%) |
| 35 to 64 Years | 32 (1.1%) | 19 (0.8%) |
| 65 to 74 Years | 0 (0.0%) | 3 (0.5%) |
| 75 Years and over | 13 (2.9%) | 119 (19.4%) |
Technology Access in State College borough
Computing Device Access in State College borough
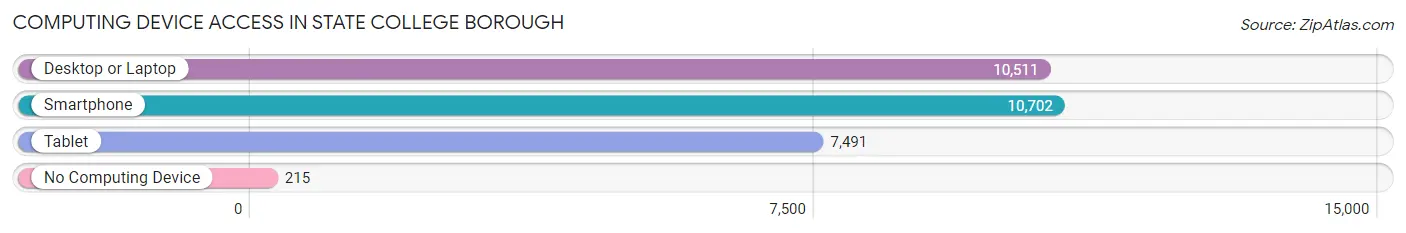
| Device Type | # Households | % Households |
| Desktop or Laptop | 10,511 | 92.5% |
| Smartphone | 10,702 | 94.2% |
| Tablet | 7,491 | 66.0% |
| No Computing Device | 215 | 1.9% |
| Total | 11,357 | 100.0% |
Internet Access in State College borough
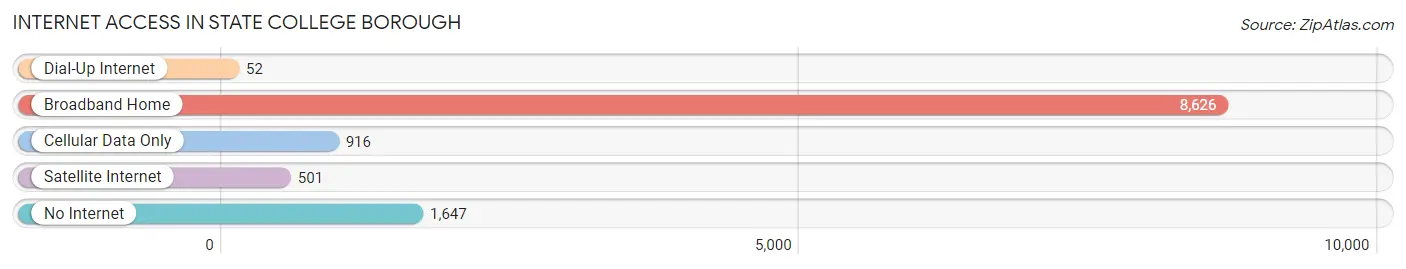
| Internet Type | # Households | % Households |
| Dial-Up Internet | 52 | 0.5% |
| Broadband Home | 8,626 | 75.9% |
| Cellular Data Only | 916 | 8.1% |
| Satellite Internet | 501 | 4.4% |
| No Internet | 1,647 | 14.5% |
| Total | 11,357 | 100.0% |
State College borough Summary
State College Borough is a borough located in Centre County, Pennsylvania, United States. It is the home of the Pennsylvania State University, which is the largest employer in the region. The borough population was 42,034 at the 2010 census, making it the most populous municipality in Centre County.
History
State College Borough was founded in 1896 as a result of the merger of College Township and the borough of Lemont. The borough was named after the college, which was founded in 1855 as the Farmers’ High School of Pennsylvania. The college was renamed the Pennsylvania State College in 1874 and the Pennsylvania State University in 1953.
The borough was incorporated in 1896 and has since grown to become the largest municipality in Centre County. The borough is home to the main campus of the university, as well as several other educational institutions, including the University Park campus of Penn State, the University of Pittsburgh at Johnstown, and the University of Pennsylvania at State College.
Geography
State College Borough is located in the central part of Centre County, in the Nittany Valley. It is bordered by College Township to the north, Ferguson Township to the east, Harris Township to the south, and Patton Township to the west. The borough is located approximately 90 miles northwest of Philadelphia and 140 miles east of Pittsburgh.
The borough is situated in the Nittany Valley, which is a narrow valley that runs through the center of Centre County. The valley is surrounded by mountains, including Mount Nittany to the east and Bald Eagle Mountain to the west. The borough is located at an elevation of 1,200 feet above sea level.
Economy
State College Borough is the economic hub of Centre County. The borough is home to the main campus of the Pennsylvania State University, which is the largest employer in the region. The university employs over 20,000 people, making it the largest employer in the county.
In addition to the university, the borough is home to several other educational institutions, including the University Park campus of Penn State, the University of Pittsburgh at Johnstown, and the University of Pennsylvania at State College.
The borough is also home to several large corporations, including AccuWeather, Unisys, and the Hershey Company. The borough is also home to several small businesses, including restaurants, retail stores, and professional services.
Demographics
As of the 2010 census, the borough had a population of 42,034. The racial makeup of the borough was 87.2% White, 4.2% African American, 0.2% Native American, 5.3% Asian, 0.1% Pacific Islander, and 2.0% from two or more races. Hispanic or Latino of any race were 4.2% of the population.
The median income for a household in the borough was $41,945, and the median income for a family was $63,917. The per capita income for the borough was $25,945. About 8.2% of families and 20.2% of the population were below the poverty line, including 15.2% of those under age 18 and 6.2% of those age 65 or over.
State College Borough is a diverse community with a variety of cultures and backgrounds. The borough is home to a large student population, as well as a growing number of professionals and retirees. The borough is a vibrant and growing community that is home to a variety of businesses, educational institutions, and cultural attractions.
Common Questions
What is Per Capita Income in State College borough?
Per Capita income in State College borough is $23,979.
What is the Median Family Income in State College borough?
Median Family Income in State College borough is $124,456.
What is the Median Household income in State College borough?
Median Household Income in State College borough is $43,459.
What is Income or Wage Gap in State College borough?
Income or Wage Gap in State College borough is 29.9%.
Women in State College borough earn 70.1 cents for every dollar earned by a man.
What is Inequality or Gini Index in State College borough?
Inequality or Gini Index in State College borough is 0.55.
What is the Total Population of State College borough?
Total Population of State College borough is 40,902.
What is the Total Male Population of State College borough?
Total Male Population of State College borough is 22,203.
What is the Total Female Population of State College borough?
Total Female Population of State College borough is 18,699.
What is the Ratio of Males per 100 Females in State College borough?
There are 118.74 Males per 100 Females in State College borough.
What is the Ratio of Females per 100 Males in State College borough?
There are 84.22 Females per 100 Males in State College borough.
What is the Median Population Age in State College borough?
Median Population Age in State College borough is 21.4 Years.
What is the Average Family Size in State College borough
Average Family Size in State College borough is 2.9 People.
What is the Average Household Size in State College borough
Average Household Size in State College borough is 2.4 People.
How Large is the Labor Force in State College borough?
There are 16,998 People in the Labor Forcein in State College borough.
What is the Percentage of People in the Labor Force in State College borough?
43.9% of People are in the Labor Force in State College borough.
What is the Unemployment Rate in State College borough?
Unemployment Rate in State College borough is 3.9%.