Cities with the Lowest Median Property Prices in Pennsylvania
RELATED REPORTS & OPTIONS
Lowest Property Prices
Pennsylvania
Compare Cities
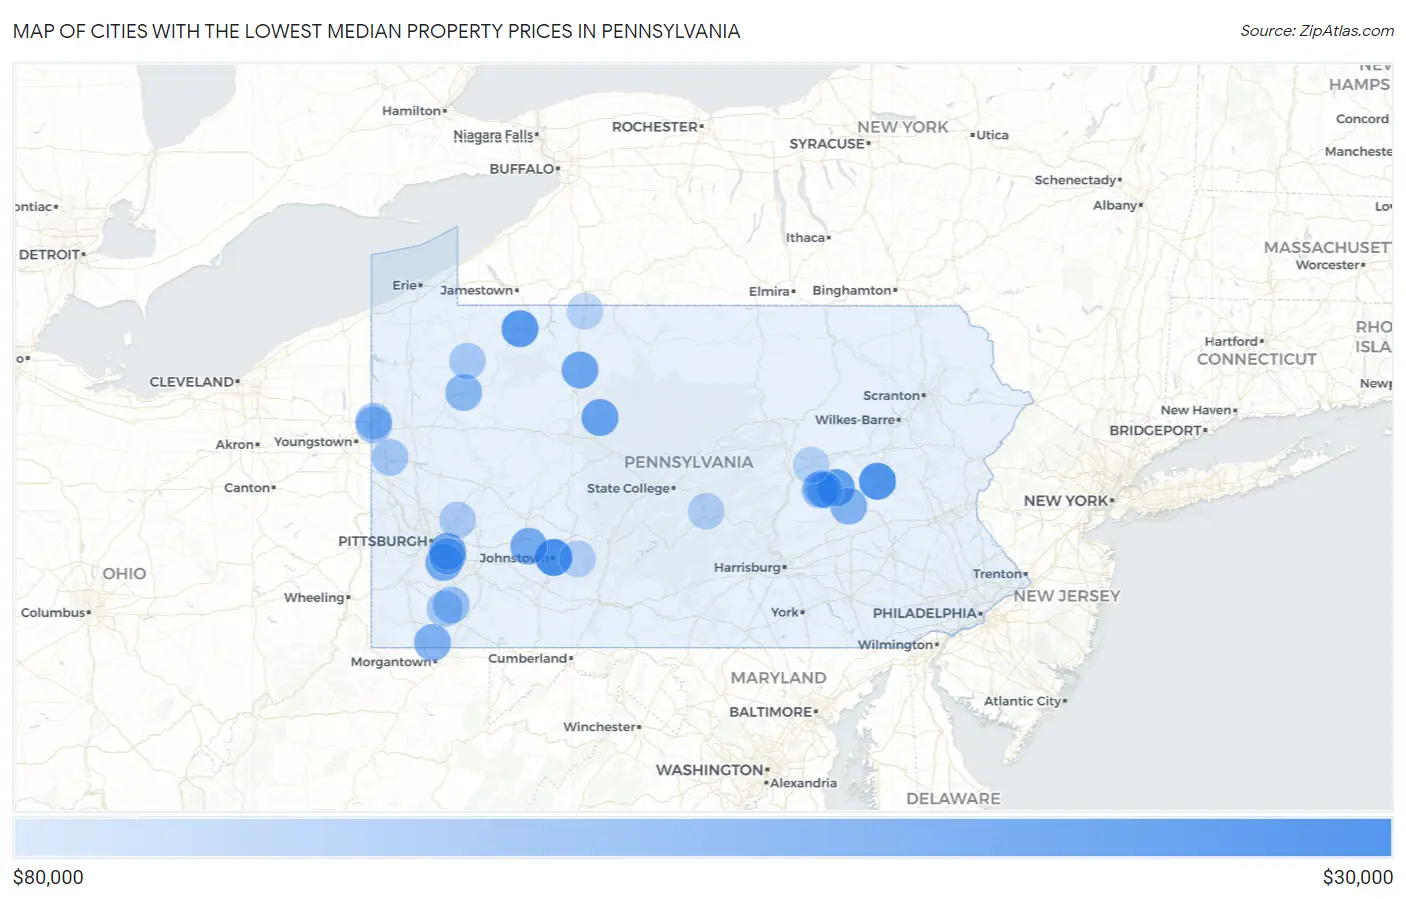
Map of Cities with the Lowest Median Property Prices in Pennsylvania
$80,000
$0
Cities with the Lowest Median Property Prices in Pennsylvania
| City | Avg Property Price | vs State | vs National | |
| 1. | Continental Courts | $33,453 | $225,125(-192k)#1 | $281,181(-248k)#56 |
| 2. | Franklin Borough | $37,406 | $225,125(-188k)#2 | $281,181(-244k)#89 |
| 3. | Johnstown | $39,411 | $225,125(-186k)#3 | $281,181(-242k)#116 |
| 4. | Shenandoah Borough | $41,579 | $225,125(-184k)#4 | $281,181(-240k)#136 |
| 5. | East Conemaugh Borough | $42,146 | $225,125(-183k)#5 | $281,181(-239k)#152 |
| 6. | Delano | $42,300 | $225,125(-183k)#6 | $281,181(-239k)#157 |
| 7. | Starbrick | $45,088 | $225,125(-180k)#7 | $281,181(-236k)#200 |
| 8. | Girardville Borough | $47,153 | $225,125(-178k)#8 | $281,181(-234k)#235 |
| 9. | Atlas | $47,755 | $225,125(-177k)#9 | $281,181(-233k)#248 |
| 10. | Gilberton Borough | $48,220 | $225,125(-177k)#10 | $281,181(-233k)#259 |
| 11. | Rouseville Borough | $48,782 | $225,125(-176k)#11 | $281,181(-232k)#271 |
| 12. | Force | $49,599 | $225,125(-176k)#12 | $281,181(-232k)#302 |
| 13. | Coaldale Borough Bedford County | $49,816 | $225,125(-175k)#13 | $281,181(-231k)#308 |
| 14. | South Fork Borough | $50,002 | $225,125(-175k)#14 | $281,181(-231k)#313 |
| 15. | Lansford Borough | $50,676 | $225,125(-174k)#15 | $281,181(-231k)#337 |
| 16. | Wilcox | $51,944 | $225,125(-173k)#16 | $281,181(-229k)#376 |
| 17. | Braddock Borough | $52,213 | $225,125(-173k)#17 | $281,181(-229k)#383 |
| 18. | Coalport Borough | $52,248 | $225,125(-173k)#18 | $281,181(-229k)#384 |
| 19. | Lorain Borough | $53,054 | $225,125(-172k)#19 | $281,181(-228k)#419 |
| 20. | Wall Borough | $53,219 | $225,125(-172k)#20 | $281,181(-228k)#425 |
| 21. | Coaldale Borough Schuylkill County | $53,461 | $225,125(-172k)#21 | $281,181(-228k)#439 |
| 22. | Donora Borough | $53,666 | $225,125(-171k)#22 | $281,181(-228k)#447 |
| 23. | Vintondale Borough | $53,713 | $225,125(-171k)#23 | $281,181(-227k)#449 |
| 24. | Morea | $53,910 | $225,125(-171k)#24 | $281,181(-227k)#457 |
| 25. | North Braddock Borough | $54,418 | $225,125(-171k)#25 | $281,181(-227k)#483 |
| 26. | Burnside Borough | $54,705 | $225,125(-170k)#26 | $281,181(-226k)#497 |
| 27. | Clairton | $54,878 | $225,125(-170k)#27 | $281,181(-226k)#507 |
| 28. | Robinson | $54,893 | $225,125(-170k)#28 | $281,181(-226k)#508 |
| 29. | Duquesne | $55,060 | $225,125(-170k)#29 | $281,181(-226k)#518 |
| 30. | South Renovo Borough | $55,233 | $225,125(-170k)#30 | $281,181(-226k)#526 |
| 31. | Bobtown | $57,664 | $225,125(-167k)#31 | $281,181(-224k)#641 |
| 32. | Mount Carmel Borough | $57,671 | $225,125(-167k)#32 | $281,181(-224k)#643 |
| 33. | Juniata Terrace Borough | $57,953 | $225,125(-167k)#33 | $281,181(-223k)#660 |
| 34. | Ashland Borough | $57,992 | $225,125(-167k)#34 | $281,181(-223k)#663 |
| 35. | Johnsonburg Borough | $58,205 | $225,125(-167k)#35 | $281,181(-223k)#680 |
| 36. | Glen Campbell Borough | $59,143 | $225,125(-166k)#36 | $281,181(-222k)#734 |
| 37. | Branchdale | $59,399 | $225,125(-166k)#37 | $281,181(-222k)#754 |
| 38. | Mckeesport | $60,017 | $225,125(-165k)#38 | $281,181(-221k)#790 |
| 39. | Ehrenfeld Borough | $60,224 | $225,125(-165k)#39 | $281,181(-221k)#805 |
| 40. | Scalp Level Borough | $60,561 | $225,125(-165k)#40 | $281,181(-221k)#826 |
| 41. | Shamokin | $60,580 | $225,125(-165k)#41 | $281,181(-221k)#828 |
| 42. | Brownsville Borough | $61,088 | $225,125(-164k)#42 | $281,181(-220k)#851 |
| 43. | Wheatland Borough | $61,195 | $225,125(-164k)#43 | $281,181(-220k)#857 |
| 44. | Charleroi Borough | $61,323 | $225,125(-164k)#44 | $281,181(-220k)#864 |
| 45. | Oil City | $61,630 | $225,125(-163k)#45 | $281,181(-220k)#879 |
| 46. | Kane Borough | $62,172 | $225,125(-163k)#46 | $281,181(-219k)#915 |
| 47. | Wallaceton Borough | $62,252 | $225,125(-163k)#47 | $281,181(-219k)#922 |
| 48. | Garrett Borough | $62,600 | $225,125(-163k)#48 | $281,181(-219k)#933 |
| 49. | Mahaffey Borough | $63,747 | $225,125(-161k)#49 | $281,181(-217k)#1,010 |
| 50. | Renovo Borough | $63,777 | $225,125(-161k)#50 | $281,181(-217k)#1,013 |
| 51. | Mckees Rocks Borough | $63,922 | $225,125(-161k)#51 | $281,181(-217k)#1,024 |
| 52. | Wilmerding Borough | $64,322 | $225,125(-161k)#52 | $281,181(-217k)#1,050 |
| 53. | Mount Oliver Borough | $64,595 | $225,125(-161k)#53 | $281,181(-217k)#1,066 |
| 54. | Rowes Run | $65,356 | $225,125(-160k)#54 | $281,181(-216k)#1,105 |
| 55. | Laurel Run Borough | $65,421 | $225,125(-160k)#55 | $281,181(-216k)#1,110 |
| 56. | Weissport Borough | $65,662 | $225,125(-159k)#56 | $281,181(-216k)#1,123 |
| 57. | Tarentum Borough | $65,715 | $225,125(-159k)#57 | $281,181(-215k)#1,128 |
| 58. | Fairview Ferndale | $65,738 | $225,125(-159k)#58 | $281,181(-215k)#1,130 |
| 59. | Callensburg Borough | $65,821 | $225,125(-159k)#59 | $281,181(-215k)#1,134 |
| 60. | East Pittsburgh Borough | $66,127 | $225,125(-159k)#60 | $281,181(-215k)#1,153 |
| 61. | Farrell | $66,475 | $225,125(-159k)#61 | $281,181(-215k)#1,178 |
| 62. | St Clair Borough | $66,528 | $225,125(-159k)#62 | $281,181(-215k)#1,182 |
| 63. | Eastvale Borough | $67,541 | $225,125(-158k)#63 | $281,181(-214k)#1,260 |
| 64. | Sharon | $68,343 | $225,125(-157k)#64 | $281,181(-213k)#1,321 |
| 65. | Dunbar Borough | $69,047 | $225,125(-156k)#65 | $281,181(-212k)#1,370 |
| 66. | Mount Jewett Borough | $69,215 | $225,125(-156k)#66 | $281,181(-212k)#1,377 |
| 67. | Grampian Borough | $69,920 | $225,125(-155k)#67 | $281,181(-211k)#1,435 |
| 68. | Marshallton | $70,028 | $225,125(-155k)#68 | $281,181(-211k)#1,439 |
| 69. | New Castle | $70,106 | $225,125(-155k)#69 | $281,181(-211k)#1,445 |
| 70. | Emporium Borough | $70,679 | $225,125(-154k)#70 | $281,181(-211k)#1,484 |
| 71. | Central City Borough | $71,006 | $225,125(-154k)#71 | $281,181(-210k)#1,510 |
| 72. | Titusville | $71,095 | $225,125(-154k)#72 | $281,181(-210k)#1,519 |
| 73. | Rimersburg Borough | $71,332 | $225,125(-154k)#73 | $281,181(-210k)#1,534 |
| 74. | Newton Hamilton Borough | $71,389 | $225,125(-154k)#74 | $281,181(-210k)#1,536 |
| 75. | Creekside Borough | $71,405 | $225,125(-154k)#75 | $281,181(-210k)#1,537 |
| 76. | Allison | $71,549 | $225,125(-154k)#76 | $281,181(-210k)#1,545 |
| 77. | West Elizabeth Borough | $71,650 | $225,125(-153k)#77 | $281,181(-210k)#1,550 |
| 78. | Pitcairn Borough | $72,133 | $225,125(-153k)#78 | $281,181(-209k)#1,579 |
| 79. | Arnold | $72,232 | $225,125(-153k)#79 | $281,181(-209k)#1,590 |
| 80. | Mount Carbon Borough | $72,300 | $225,125(-153k)#80 | $281,181(-209k)#1,598 |
| 81. | Seward Borough | $72,421 | $225,125(-153k)#81 | $281,181(-209k)#1,609 |
| 82. | Glassport Borough | $72,733 | $225,125(-152k)#82 | $281,181(-208k)#1,637 |
| 83. | Shinglehouse Borough | $72,922 | $225,125(-152k)#83 | $281,181(-208k)#1,661 |
| 84. | Rankin Borough | $72,994 | $225,125(-152k)#84 | $281,181(-208k)#1,665 |
| 85. | Port Vue Borough | $73,310 | $225,125(-152k)#85 | $281,181(-208k)#1,692 |
| 86. | Greensboro Borough | $73,449 | $225,125(-152k)#86 | $281,181(-208k)#1,704 |
| 87. | Beaverdale | $73,906 | $225,125(-151k)#87 | $281,181(-207k)#1,734 |
| 88. | Yeagertown | $74,081 | $225,125(-151k)#88 | $281,181(-207k)#1,747 |
| 89. | Fayette City Borough | $74,198 | $225,125(-151k)#89 | $281,181(-207k)#1,767 |
| 90. | Versailles Borough | $75,197 | $225,125(-150k)#90 | $281,181(-206k)#1,849 |
| 91. | Tidioute Borough | $75,301 | $225,125(-150k)#91 | $281,181(-206k)#1,859 |
| 92. | Turtle Creek Borough | $75,334 | $225,125(-150k)#92 | $281,181(-206k)#1,862 |
| 93. | Bradford | $75,546 | $225,125(-150k)#93 | $281,181(-206k)#1,882 |
| 94. | Summerville Borough | $75,586 | $225,125(-150k)#94 | $281,181(-206k)#1,885 |
| 95. | Nanty Glo Borough | $75,624 | $225,125(-150k)#95 | $281,181(-206k)#1,888 |
| 96. | Riverside | $75,910 | $225,125(-149k)#96 | $281,181(-205k)#1,910 |
| 97. | Brownstown Borough | $76,153 | $225,125(-149k)#97 | $281,181(-205k)#1,936 |
| 98. | Bolivar Borough | $76,191 | $225,125(-149k)#98 | $281,181(-205k)#1,945 |
| 99. | North Charleroi Borough | $76,288 | $225,125(-149k)#99 | $281,181(-205k)#1,953 |
| 100. | Kulpmont Borough | $76,319 | $225,125(-149k)#100 | $281,181(-205k)#1,956 |
Common Questions
What are the Top 10 Cities with the Lowest Median Property Prices in Pennsylvania?
Top 10 Cities with the Lowest Median Property Prices in Pennsylvania are:
What city has the Lowest Median Property Prices in Pennsylvania?
Johnstown has the Lowest Median Property Prices in Pennsylvania with $39,411.
What is the Median Property Prices in the State of Pennsylvania?
Median Property Prices in Pennsylvania is $225,125.
What is the Median Property Prices in the United States?
Median Property Prices in the United States is $281,181.