Cities with the Most Immigrants from Sierra Leone in Pennsylvania
RELATED REPORTS & OPTIONS
Sierra Leone
Pennsylvania
Compare Cities
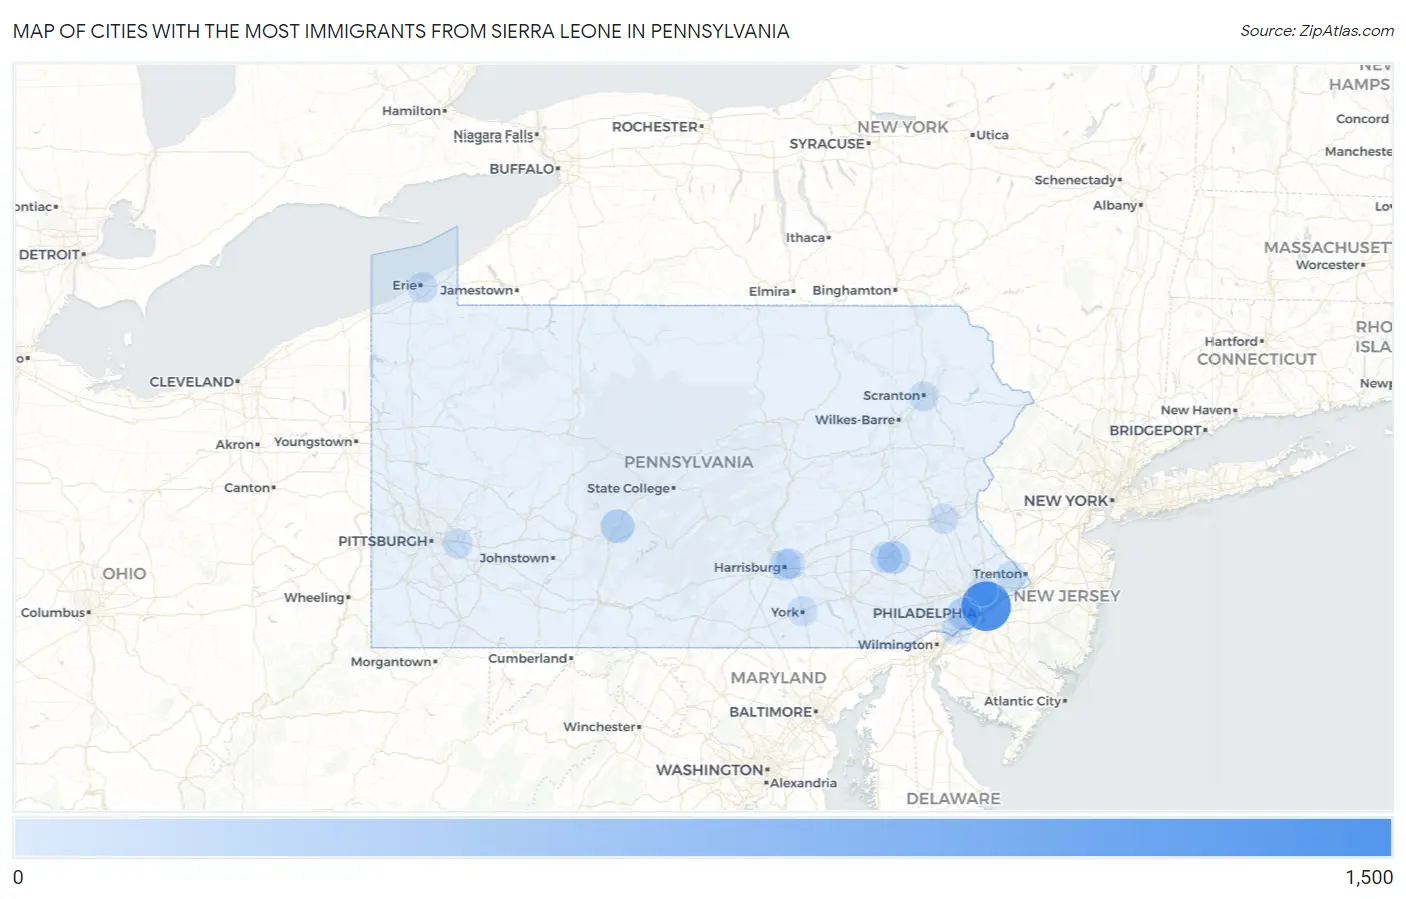
Map of Cities with the Most Immigrants from Sierra Leone in Pennsylvania
0
1,500
Cities with the Most Immigrants from Sierra Leone in Pennsylvania
| City | Sierra Leone | vs State | vs National | |
| 1. | Philadelphia | 1,111 | 3,949(28.13%)#1 | 47,598(2.33%)#3 |
| 2. | Yeadon Borough | 245 | 3,949(6.20%)#2 | 47,598(0.51%)#32 |
| 3. | Sharon Hill Borough | 228 | 3,949(5.77%)#3 | 47,598(0.48%)#37 |
| 4. | Greenwood | 191 | 3,949(4.84%)#4 | 47,598(0.40%)#43 |
| 5. | Reading | 151 | 3,949(3.82%)#5 | 47,598(0.32%)#65 |
| 6. | Drexel Hill | 148 | 3,949(3.75%)#6 | 47,598(0.31%)#67 |
| 7. | Lansdowne Borough | 116 | 3,949(2.94%)#7 | 47,598(0.24%)#91 |
| 8. | Collingdale Borough | 105 | 3,949(2.66%)#8 | 47,598(0.22%)#105 |
| 9. | Harrisburg | 77 | 3,949(1.95%)#9 | 47,598(0.16%)#137 |
| 10. | West Lawn | 73 | 3,949(1.85%)#10 | 47,598(0.15%)#142 |
| 11. | Aldan Borough | 69 | 3,949(1.75%)#11 | 47,598(0.14%)#156 |
| 12. | Darby Borough | 61 | 3,949(1.54%)#12 | 47,598(0.13%)#172 |
| 13. | Clifton Heights Borough | 54 | 3,949(1.37%)#13 | 47,598(0.11%)#194 |
| 14. | Sinking Spring Borough | 47 | 3,949(1.19%)#14 | 47,598(0.10%)#210 |
| 15. | West Chester Borough | 37 | 3,949(0.94%)#15 | 47,598(0.08%)#246 |
| 16. | Erie | 21 | 3,949(0.53%)#16 | 47,598(0.04%)#321 |
| 17. | Progress | 21 | 3,949(0.53%)#17 | 47,598(0.04%)#330 |
| 18. | Bristol Borough | 21 | 3,949(0.53%)#18 | 47,598(0.04%)#331 |
| 19. | Greencastle Borough | 21 | 3,949(0.53%)#19 | 47,598(0.04%)#333 |
| 20. | East Lansdowne Borough | 19 | 3,949(0.48%)#20 | 47,598(0.04%)#355 |
| 21. | Steelton Borough | 18 | 3,949(0.46%)#21 | 47,598(0.04%)#359 |
| 22. | Colwyn Borough | 17 | 3,949(0.43%)#22 | 47,598(0.04%)#368 |
| 23. | Folcroft Borough | 16 | 3,949(0.41%)#23 | 47,598(0.03%)#374 |
| 24. | Monroeville | 13 | 3,949(0.33%)#24 | 47,598(0.03%)#398 |
| 25. | Woodbourne | 13 | 3,949(0.33%)#25 | 47,598(0.03%)#399 |
| 26. | Allentown | 9 | 3,949(0.23%)#26 | 47,598(0.02%)#439 |
| 27. | Glenside | 9 | 3,949(0.23%)#27 | 47,598(0.02%)#446 |
| 28. | Scranton | 8 | 3,949(0.20%)#28 | 47,598(0.02%)#454 |
| 29. | Chester | 8 | 3,949(0.20%)#29 | 47,598(0.02%)#456 |
| 30. | Goldsboro Borough | 4 | 3,949(0.10%)#30 | 47,598(0.01%)#504 |
| 31. | York | 3 | 3,949(0.08%)#31 | 47,598(0.01%)#508 |
| 32. | Kane Borough | 3 | 3,949(0.08%)#32 | 47,598(0.01%)#513 |
Common Questions
What are the Top 10 Cities with the Most Immigrants from Sierra Leone in Pennsylvania?
Top 10 Cities with the Most Immigrants from Sierra Leone in Pennsylvania are:
#1
1,111
#2
191
#3
151
#4
148
#5
77
#6
73
#7
21
#8
21
#9
13
#10
13
What city has the Most Immigrants from Sierra Leone in Pennsylvania?
Philadelphia has the Most Immigrants from Sierra Leone in Pennsylvania with 1,111.
What is the Total Immigrants from Sierra Leone in the State of Pennsylvania?
Total Immigrants from Sierra Leone in Pennsylvania is 3,949.
What is the Total Immigrants from Sierra Leone in the United States?
Total Immigrants from Sierra Leone in the United States is 47,598.