Messiah College, PA Map & Demographics
Messiah College Map
Messiah College Overview
$23,051
PER CAPITA INCOME
13.6%
WAGE / INCOME GAP [ % ]
86.4¢/ $1
WAGE / INCOME GAP [ $ ]
0.20
INEQUALITY / GINI INDEX
2,246
TOTAL POPULATION
1,007
MALE POPULATION
1,239
FEMALE POPULATION
81.28
MALES / 100 FEMALES
123.04
FEMALES / 100 MALES
19.9
MEDIAN AGE
2.0
AVG FAMILY SIZE
1.7
AVG HOUSEHOLD SIZE
1,556
LABOR FORCE [ PEOPLE ]
69.3%
PERCENT IN LABOR FORCE
5.9%
UNEMPLOYMENT RATE
Messiah College Area Codes
Income in Messiah College
Income Overview in Messiah College
| Characteristic | Number | Measure |
| Per Capita Income | 2,246 | $23,051 |
| Median Family Income | 2 | $0 |
| Mean Family Income | 2 | $0 |
| Median Household Income | 3 | $0 |
| Mean Household Income | 3 | $0 |
| Income Deficit | 2 | $0 |
| Wage / Income Gap (%) | 2,246 | 13.57% |
| Wage / Income Gap ($) | 2,246 | 86.43¢ per $1 |
| Gini / Inequality Index | 2,246 | 0.20 |
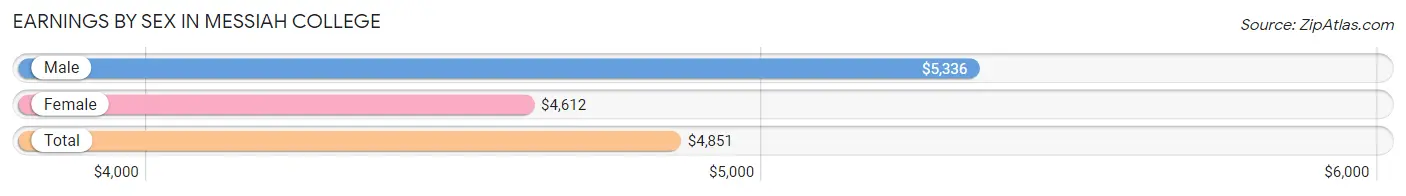
Earnings by Sex in Messiah College
Average Earnings in Messiah College are $4,851, $5,336 for men and $4,612 for women, a difference of 13.6%.
| Sex | Number | Average Earnings |
| Male | 969 (45.2%) | $5,336 |
| Female | 1,177 (54.8%) | $4,612 |
| Total | 2,146 (100.0%) | $4,851 |
Earnings by Sex by Income Bracket in Messiah College
The most common earnings brackets in Messiah College are $2,500 to $4,999 for men (232 | 23.9%) and $2,500 to $4,999 for women (422 | 35.8%).
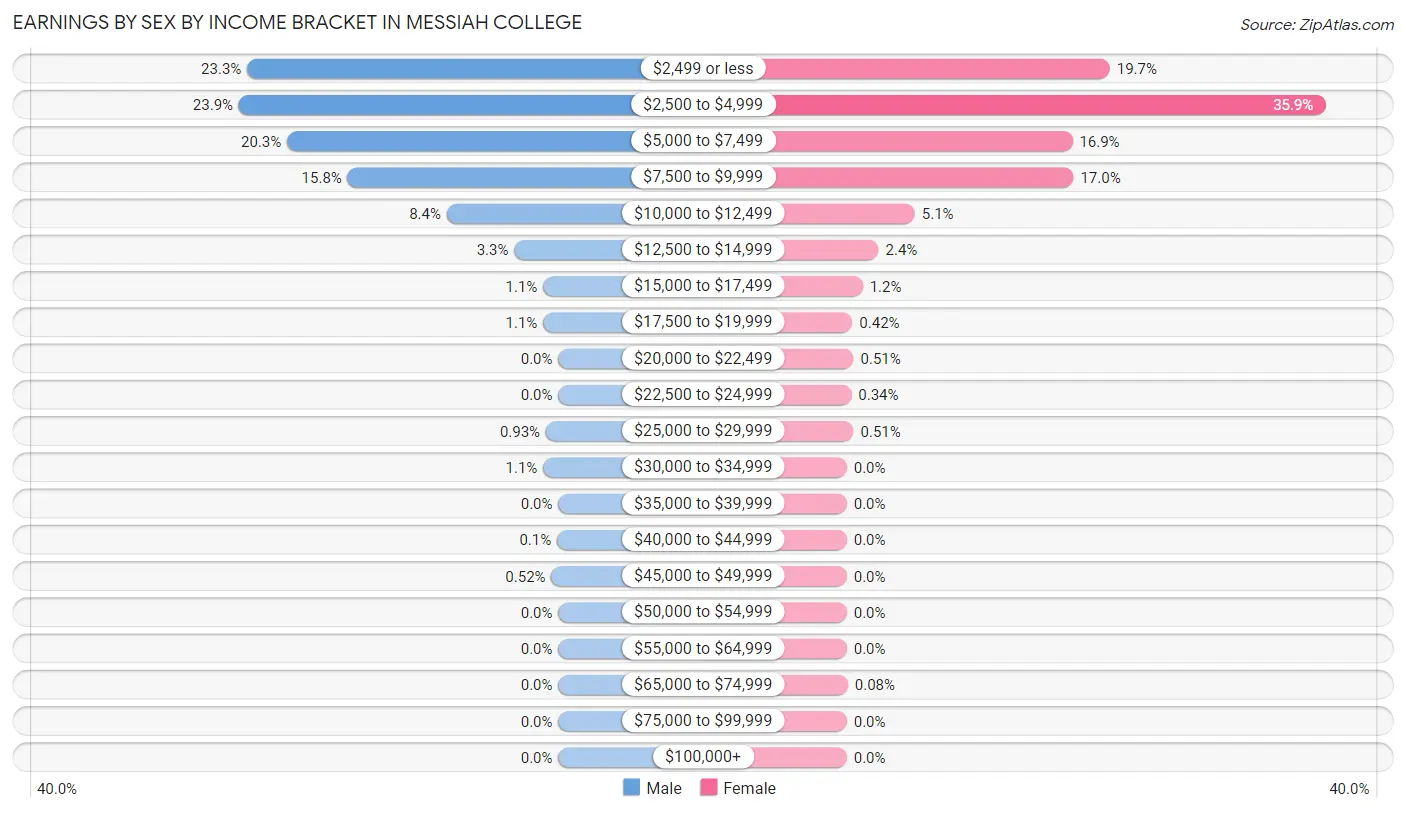
| Income | Male | Female |
| $2,499 or less | 226 (23.3%) | 232 (19.7%) |
| $2,500 to $4,999 | 232 (23.9%) | 422 (35.8%) |
| $5,000 to $7,499 | 197 (20.3%) | 199 (16.9%) |
| $7,500 to $9,999 | 153 (15.8%) | 200 (17.0%) |
| $10,000 to $12,499 | 81 (8.4%) | 60 (5.1%) |
| $12,500 to $14,999 | 32 (3.3%) | 28 (2.4%) |
| $15,000 to $17,499 | 11 (1.1%) | 14 (1.2%) |
| $17,500 to $19,999 | 11 (1.1%) | 5 (0.4%) |
| $20,000 to $22,499 | 0 (0.0%) | 6 (0.5%) |
| $22,500 to $24,999 | 0 (0.0%) | 4 (0.3%) |
| $25,000 to $29,999 | 9 (0.9%) | 6 (0.5%) |
| $30,000 to $34,999 | 11 (1.1%) | 0 (0.0%) |
| $35,000 to $39,999 | 0 (0.0%) | 0 (0.0%) |
| $40,000 to $44,999 | 1 (0.1%) | 0 (0.0%) |
| $45,000 to $49,999 | 5 (0.5%) | 0 (0.0%) |
| $50,000 to $54,999 | 0 (0.0%) | 0 (0.0%) |
| $55,000 to $64,999 | 0 (0.0%) | 0 (0.0%) |
| $65,000 to $74,999 | 0 (0.0%) | 1 (0.1%) |
| $75,000 to $99,999 | 0 (0.0%) | 0 (0.0%) |
| $100,000+ | 0 (0.0%) | 0 (0.0%) |
| Total | 969 (100.0%) | 1,177 (100.0%) |
Earnings by Sex by Educational Attainment in Messiah College
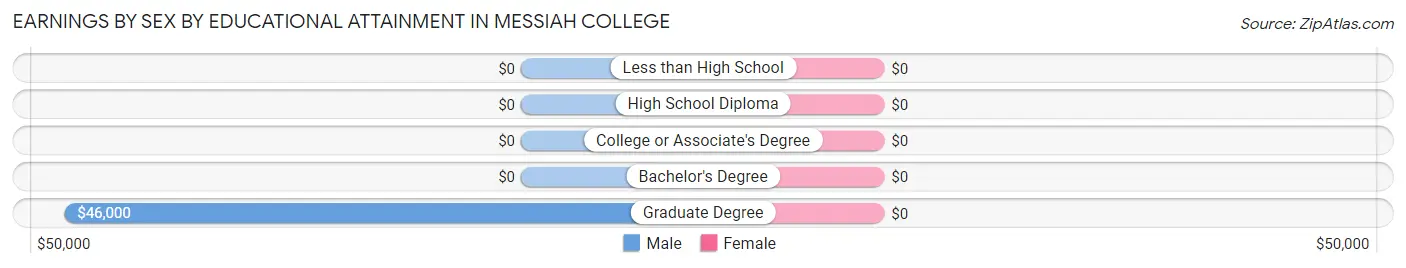
| Educational Attainment | Male Income | Female Income |
| Less than High School | - | - |
| High School Diploma | - | - |
| College or Associate's Degree | - | - |
| Bachelor's Degree | - | - |
| Graduate Degree | $46,000 | $0 |
| Total | $29,583 | $0 |
Family Income in Messiah College
Family Income Brackets in Messiah College
According to the Messiah College family income data, there are 2 families falling into the $50,000 to $74,999 income range, which is the most common income bracket and makes up 100.0% of all families.
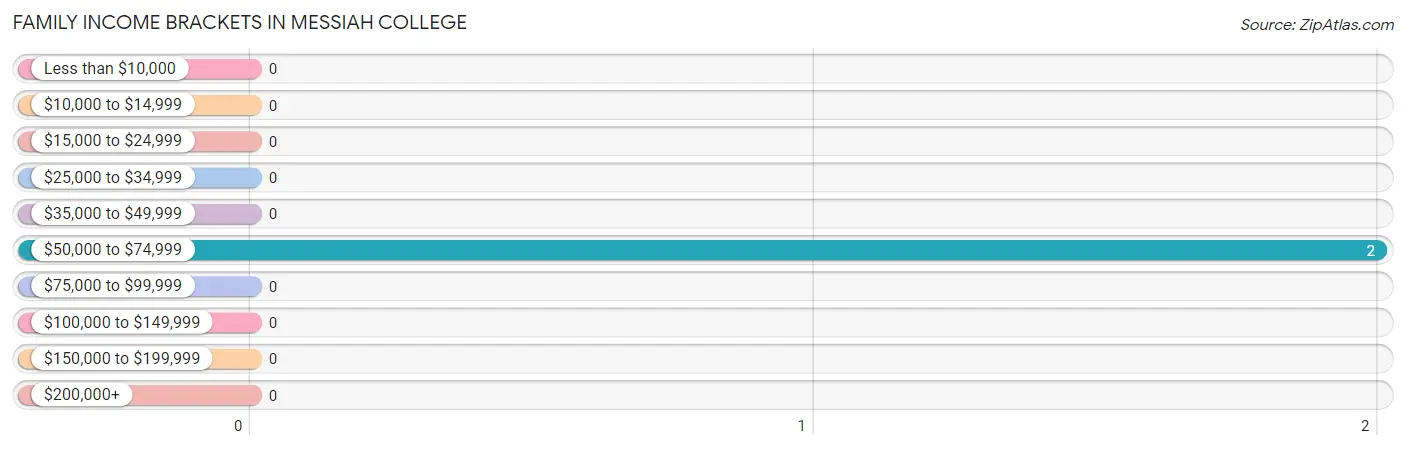
| Income Bracket | # Families | % Families |
| Less than $10,000 | 0 | 0.0% |
| $10,000 to $14,999 | 0 | 0.0% |
| $15,000 to $24,999 | 0 | 0.0% |
| $25,000 to $34,999 | 0 | 0.0% |
| $35,000 to $49,999 | 0 | 0.0% |
| $50,000 to $74,999 | 2 | 100.0% |
| $75,000 to $99,999 | 0 | 0.0% |
| $100,000 to $149,999 | 0 | 0.0% |
| $150,000 to $199,999 | 0 | 0.0% |
| $200,000+ | 0 | 0.0% |
Family Income by Famaliy Size in Messiah College
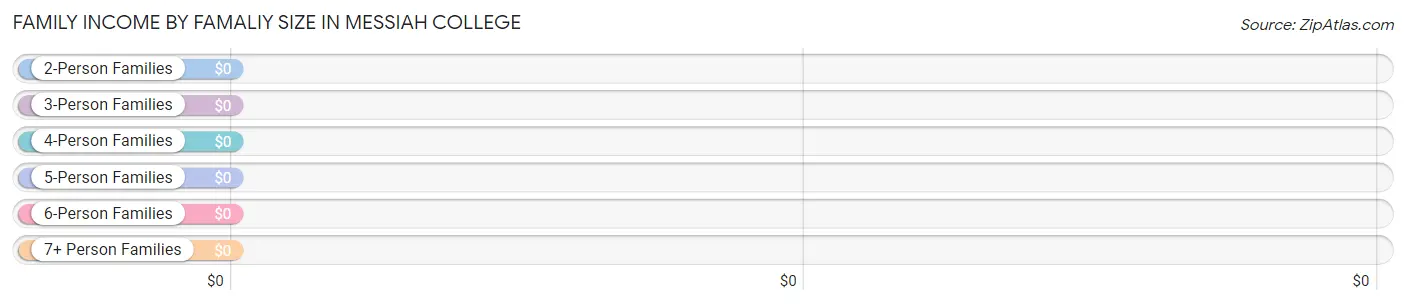
| Income Bracket | # Families | Median Income |
| 2-Person Families | 2 (100.0%) | $0 |
| 3-Person Families | 0 (0.0%) | $0 |
| 4-Person Families | 0 (0.0%) | $0 |
| 5-Person Families | 0 (0.0%) | $0 |
| 6-Person Families | 0 (0.0%) | $0 |
| 7+ Person Families | 0 (0.0%) | $0 |
| Total | 2 (100.0%) | $0 |
Family Income by Number of Earners in Messiah College
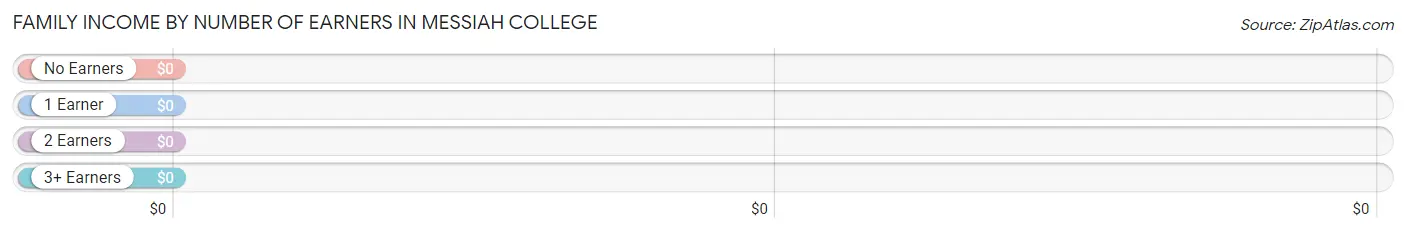
| Number of Earners | # Families | Median Income |
| No Earners | 0 (0.0%) | $0 |
| 1 Earner | 2 (100.0%) | $0 |
| 2 Earners | 0 (0.0%) | $0 |
| 3+ Earners | 0 (0.0%) | $0 |
| Total | 2 (100.0%) | $0 |
Household Income in Messiah College
Household Income Brackets in Messiah College
With 2 households falling in the category, the $50,000 to $74,999 income range is the most frequent in Messiah College, accounting for 66.7% of all households.
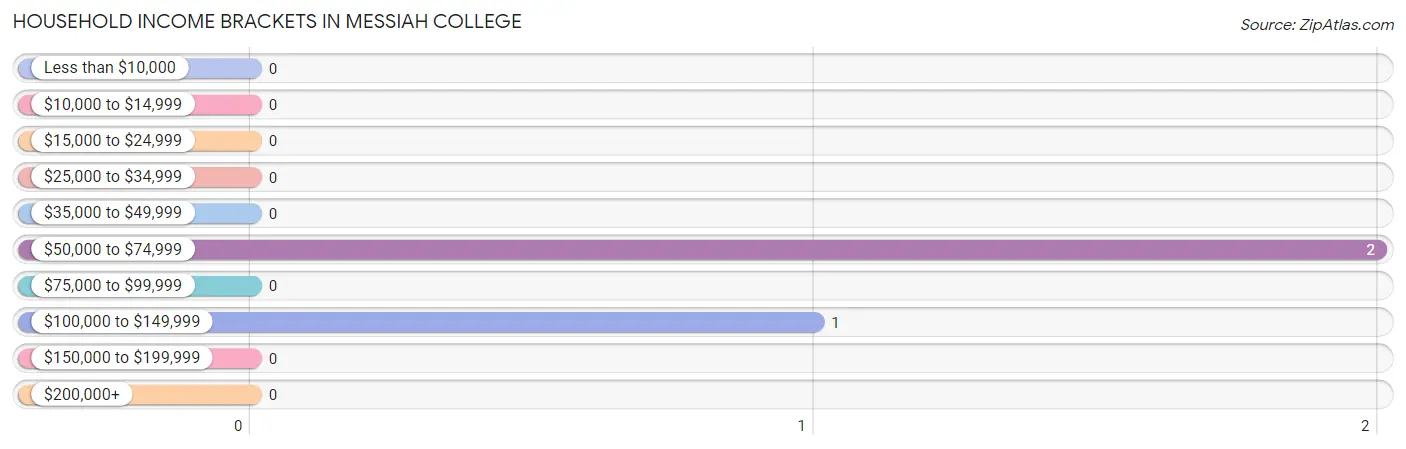
| Income Bracket | # Households | % Households |
| Less than $10,000 | 0 | 0.0% |
| $10,000 to $14,999 | 0 | 0.0% |
| $15,000 to $24,999 | 0 | 0.0% |
| $25,000 to $34,999 | 0 | 0.0% |
| $35,000 to $49,999 | 0 | 0.0% |
| $50,000 to $74,999 | 2 | 66.7% |
| $75,000 to $99,999 | 0 | 0.0% |
| $100,000 to $149,999 | 1 | 33.3% |
| $150,000 to $199,999 | 0 | 0.0% |
| $200,000+ | 0 | 0.0% |
Household Income by Householder Age in Messiah College
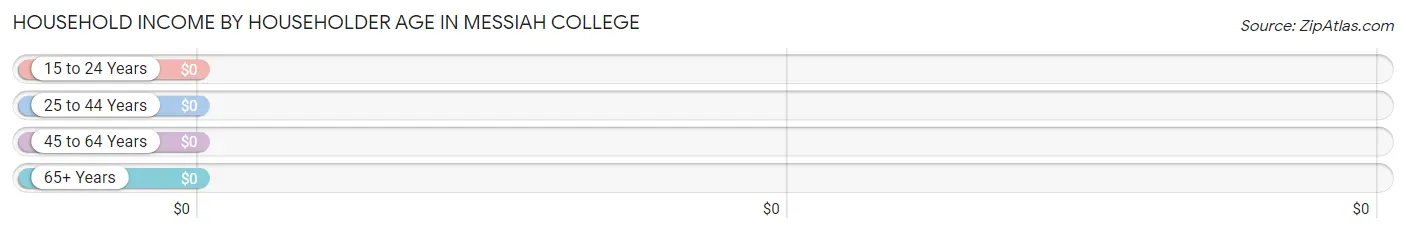
| Income Bracket | # Households | Median Income |
| 15 to 24 Years | 0 (0.0%) | $0 |
| 25 to 44 Years | 0 (0.0%) | $0 |
| 45 to 64 Years | 2 (66.7%) | $0 |
| 65+ Years | 1 (33.3%) | $0 |
| Total | 3 (100.0%) | $0 |
Poverty in Messiah College
Income Below Poverty by Sex and Age in Messiah College
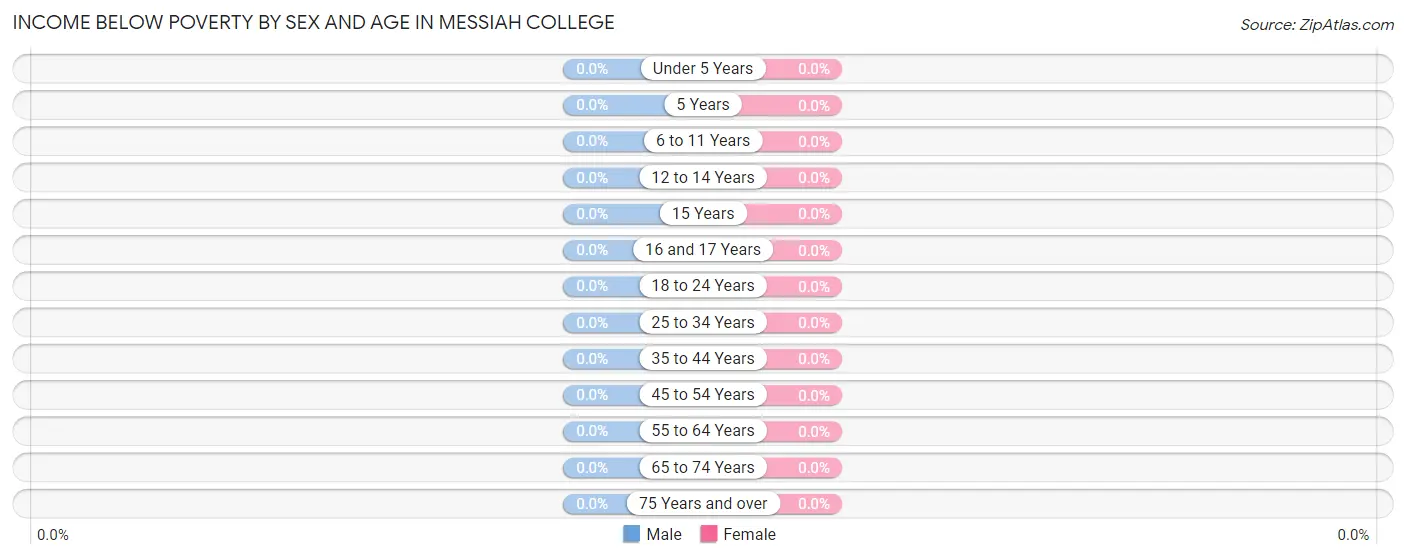
| Age Bracket | Male | Female |
| Under 5 Years | 0 (0.0%) | 0 (0.0%) |
| 5 Years | 0 (0.0%) | 0 (0.0%) |
| 6 to 11 Years | 0 (0.0%) | 0 (0.0%) |
| 12 to 14 Years | 0 (0.0%) | 0 (0.0%) |
| 15 Years | 0 (0.0%) | 0 (0.0%) |
| 16 and 17 Years | 0 (0.0%) | 0 (0.0%) |
| 18 to 24 Years | 0 (0.0%) | 0 (0.0%) |
| 25 to 34 Years | 0 (0.0%) | 0 (0.0%) |
| 35 to 44 Years | 0 (0.0%) | 0 (0.0%) |
| 45 to 54 Years | 0 (0.0%) | 0 (0.0%) |
| 55 to 64 Years | 0 (0.0%) | 0 (0.0%) |
| 65 to 74 Years | 0 (0.0%) | 0 (0.0%) |
| 75 Years and over | 0 (0.0%) | 0 (0.0%) |
| Total | 0 (0.0%) | 0 (0.0%) |
Income Above Poverty by Sex and Age in Messiah College
According to the poverty statistics in Messiah College, males aged 65 to 74 years and females aged 55 to 64 years are the age groups that are most secure financially, with 100.0% of males and 100.0% of females in these age groups living above the poverty line.
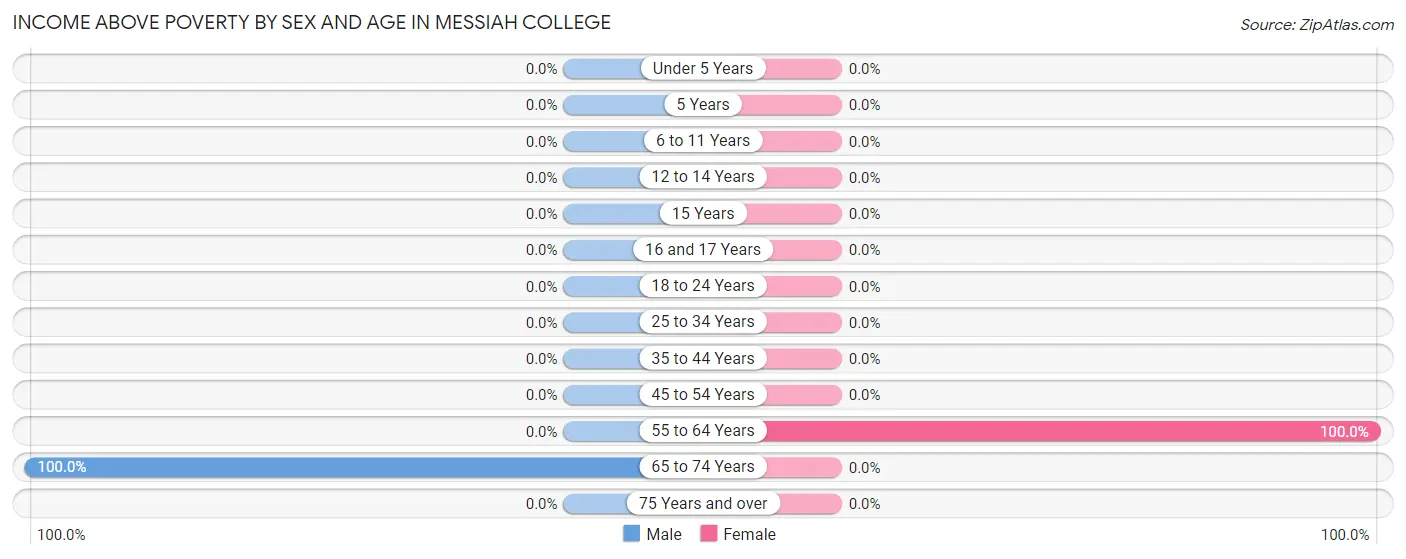
| Age Bracket | Male | Female |
| Under 5 Years | 0 (0.0%) | 0 (0.0%) |
| 5 Years | 0 (0.0%) | 0 (0.0%) |
| 6 to 11 Years | 0 (0.0%) | 0 (0.0%) |
| 12 to 14 Years | 0 (0.0%) | 0 (0.0%) |
| 15 Years | 0 (0.0%) | 0 (0.0%) |
| 16 and 17 Years | 0 (0.0%) | 0 (0.0%) |
| 18 to 24 Years | 0 (0.0%) | 0 (0.0%) |
| 25 to 34 Years | 0 (0.0%) | 0 (0.0%) |
| 35 to 44 Years | 0 (0.0%) | 0 (0.0%) |
| 45 to 54 Years | 0 (0.0%) | 0 (0.0%) |
| 55 to 64 Years | 0 (0.0%) | 2 (100.0%) |
| 65 to 74 Years | 3 (100.0%) | 0 (0.0%) |
| 75 Years and over | 0 (0.0%) | 0 (0.0%) |
| Total | 3 (100.0%) | 2 (100.0%) |
Income Below Poverty Among Married-Couple Families in Messiah College
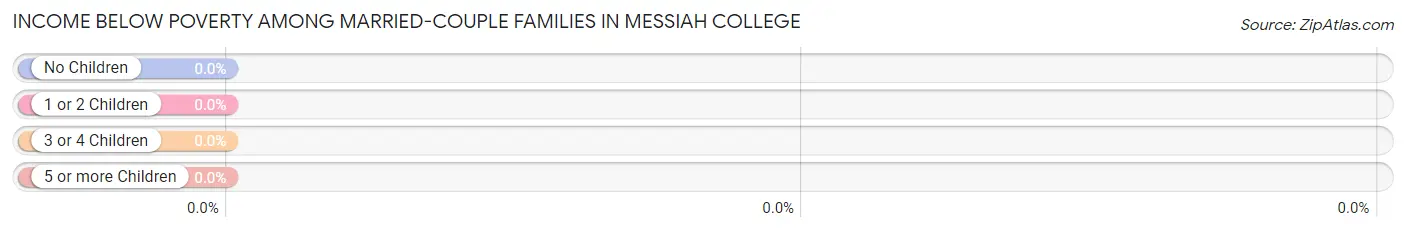
| Children | Above Poverty | Below Poverty |
| No Children | 2 (100.0%) | 0 (0.0%) |
| 1 or 2 Children | 0 (0.0%) | 0 (0.0%) |
| 3 or 4 Children | 0 (0.0%) | 0 (0.0%) |
| 5 or more Children | 0 (0.0%) | 0 (0.0%) |
| Total | 2 (100.0%) | 0 (0.0%) |
Income Below Poverty Among Single-Parent Households in Messiah College
| Children | Single Father | Single Mother |
| No Children | 0 (0.0%) | 0 (0.0%) |
| 1 or 2 Children | 0 (0.0%) | 0 (0.0%) |
| 3 or 4 Children | 0 (0.0%) | 0 (0.0%) |
| 5 or more Children | 0 (0.0%) | 0 (0.0%) |
| Total | 0 (0.0%) | 0 (0.0%) |
Income Below Poverty Among Married-Couple vs Single-Parent Households in Messiah College
| Children | Married-Couple Families | Single-Parent Households |
| No Children | 0 (0.0%) | 0 (0.0%) |
| 1 or 2 Children | 0 (0.0%) | 0 (0.0%) |
| 3 or 4 Children | 0 (0.0%) | 0 (0.0%) |
| 5 or more Children | 0 (0.0%) | 0 (0.0%) |
| Total | 0 (0.0%) | 0 (0.0%) |
Race in Messiah College
The most populous races in Messiah College are White / Caucasian (1,906 | 84.9%), Hispanic or Latino (155 | 6.9%), and Black / African American (140 | 6.2%).
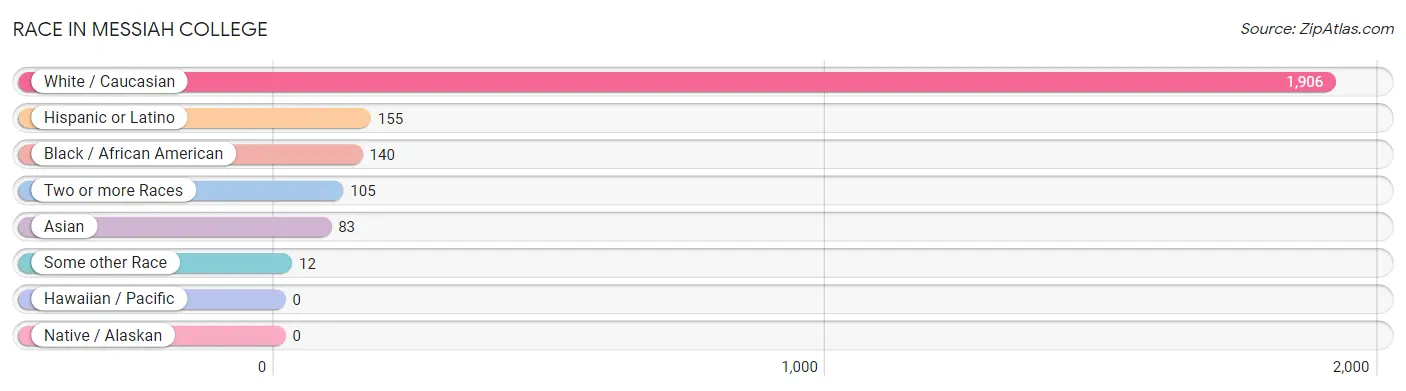
| Race | # Population | % Population |
| Asian | 83 | 3.7% |
| Black / African American | 140 | 6.2% |
| Hawaiian / Pacific | 0 | 0.0% |
| Hispanic or Latino | 155 | 6.9% |
| Native / Alaskan | 0 | 0.0% |
| White / Caucasian | 1,906 | 84.9% |
| Two or more Races | 105 | 4.7% |
| Some other Race | 12 | 0.5% |
| Total | 2,246 | 100.0% |
Ancestry in Messiah College
The most populous ancestries reported in Messiah College are German (788 | 35.1%), Irish (488 | 21.7%), Italian (256 | 11.4%), Polish (187 | 8.3%), and English (126 | 5.6%), together accounting for 82.2% of all Messiah College residents.
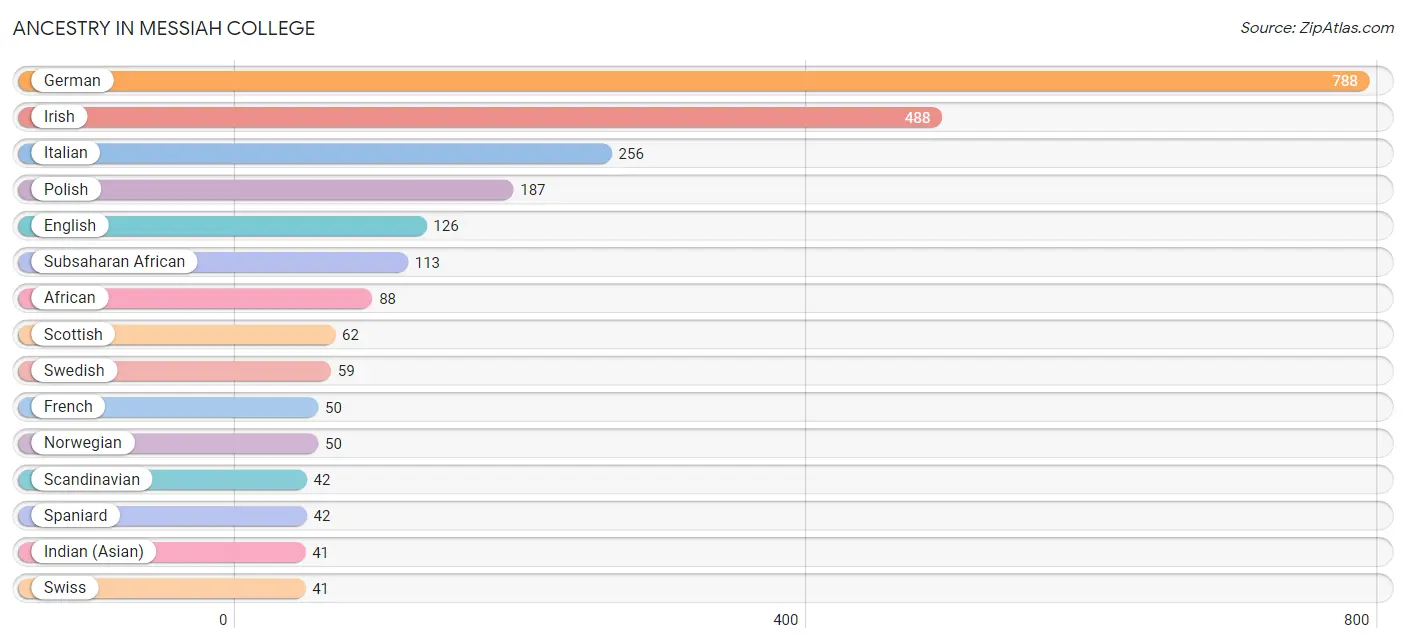
| Ancestry | # Population | % Population |
| African | 88 | 3.9% |
| Arab | 5 | 0.2% |
| Barbadian | 1 | 0.0% |
| Belgian | 6 | 0.3% |
| Bhutanese | 9 | 0.4% |
| Brazilian | 3 | 0.1% |
| British | 17 | 0.8% |
| Burmese | 24 | 1.1% |
| Central American | 20 | 0.9% |
| Cherokee | 13 | 0.6% |
| Croatian | 11 | 0.5% |
| Dominican | 11 | 0.5% |
| Dutch | 38 | 1.7% |
| Ecuadorian | 10 | 0.4% |
| English | 126 | 5.6% |
| Ethiopian | 13 | 0.6% |
| Finnish | 5 | 0.2% |
| French | 50 | 2.2% |
| German | 788 | 35.1% |
| Greek | 8 | 0.4% |
| Guatemalan | 20 | 0.9% |
| Haitian | 13 | 0.6% |
| Hungarian | 12 | 0.5% |
| Indian (Asian) | 41 | 1.8% |
| Irish | 488 | 21.7% |
| Italian | 256 | 11.4% |
| Jamaican | 4 | 0.2% |
| Japanese | 7 | 0.3% |
| Korean | 29 | 1.3% |
| Lebanese | 5 | 0.2% |
| Lithuanian | 9 | 0.4% |
| Mexican | 32 | 1.4% |
| Mongolian | 6 | 0.3% |
| Navajo | 4 | 0.2% |
| Norwegian | 50 | 2.2% |
| Polish | 187 | 8.3% |
| Portuguese | 5 | 0.2% |
| Potawatomi | 7 | 0.3% |
| Puerto Rican | 25 | 1.1% |
| Romanian | 9 | 0.4% |
| Russian | 38 | 1.7% |
| Scandinavian | 42 | 1.9% |
| Scotch-Irish | 35 | 1.6% |
| Scottish | 62 | 2.8% |
| Serbian | 13 | 0.6% |
| Sioux | 5 | 0.2% |
| Slavic | 1 | 0.0% |
| Slovak | 18 | 0.8% |
| South American | 15 | 0.7% |
| Spaniard | 42 | 1.9% |
| Sri Lankan | 6 | 0.3% |
| Subsaharan African | 113 | 5.0% |
| Swedish | 59 | 2.6% |
| Swiss | 41 | 1.8% |
| Thai | 22 | 1.0% |
| Ukrainian | 10 | 0.4% |
| Venezuelan | 5 | 0.2% |
| Welsh | 11 | 0.5% |
| Yugoslavian | 6 | 0.3% |
| Zimbabwean | 12 | 0.5% | View All 60 Rows |
Immigrants in Messiah College
The most numerous immigrant groups reported in Messiah College came from Asia (48 | 2.1%), China (29 | 1.3%), Eastern Asia (29 | 1.3%), Latin America (29 | 1.3%), and Africa (26 | 1.2%), together accounting for 7.2% of all Messiah College residents.
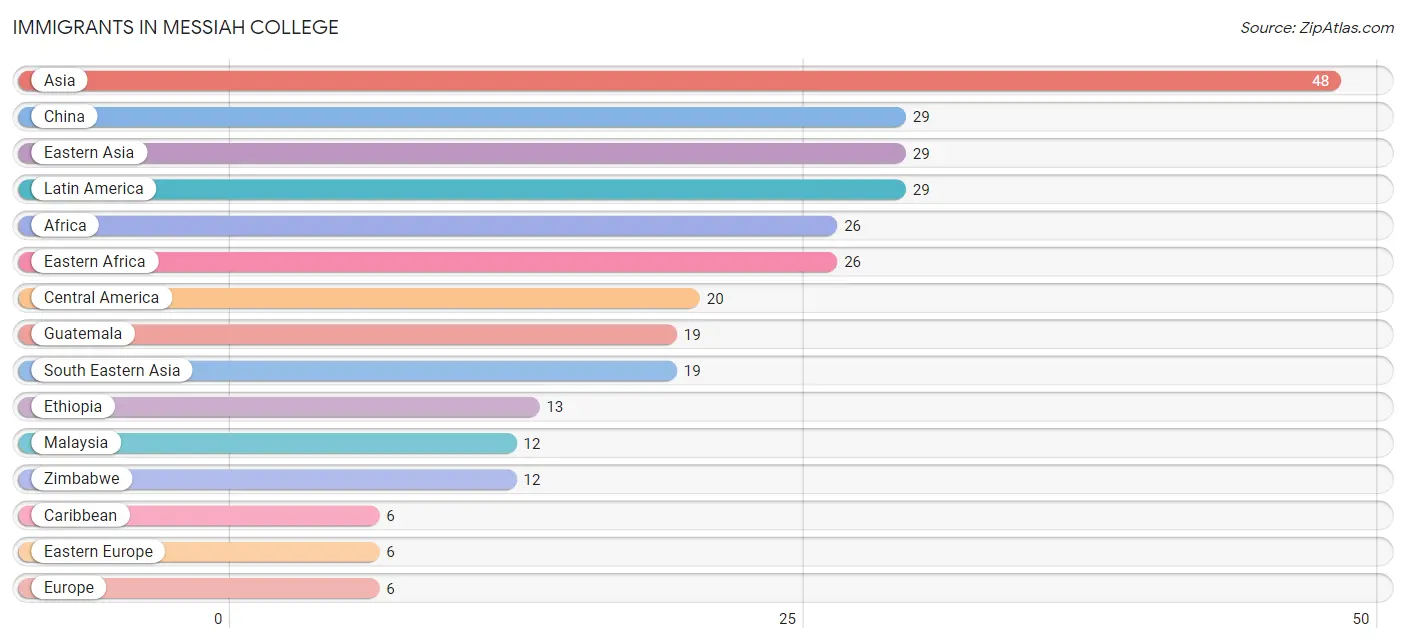
| Immigration Origin | # Population | % Population |
| Africa | 26 | 1.2% |
| Asia | 48 | 2.1% |
| Brazil | 3 | 0.1% |
| Caribbean | 6 | 0.3% |
| Central America | 20 | 0.9% |
| China | 29 | 1.3% |
| Eastern Africa | 26 | 1.2% |
| Eastern Asia | 29 | 1.3% |
| Eastern Europe | 6 | 0.3% |
| Ethiopia | 13 | 0.6% |
| Europe | 6 | 0.3% |
| Guatemala | 19 | 0.9% |
| Haiti | 6 | 0.3% |
| Latin America | 29 | 1.3% |
| Malaysia | 12 | 0.5% |
| Mexico | 1 | 0.0% |
| Philippines | 1 | 0.0% |
| Russia | 6 | 0.3% |
| South America | 3 | 0.1% |
| South Eastern Asia | 19 | 0.9% |
| Vietnam | 6 | 0.3% |
| Zimbabwe | 12 | 0.5% | View All 22 Rows |
Sex and Age in Messiah College
Sex and Age in Messiah College
The most populous age groups in Messiah College are 20 to 24 Years (498 | 49.4%) for men and 15 to 19 Years (675 | 54.5%) for women.
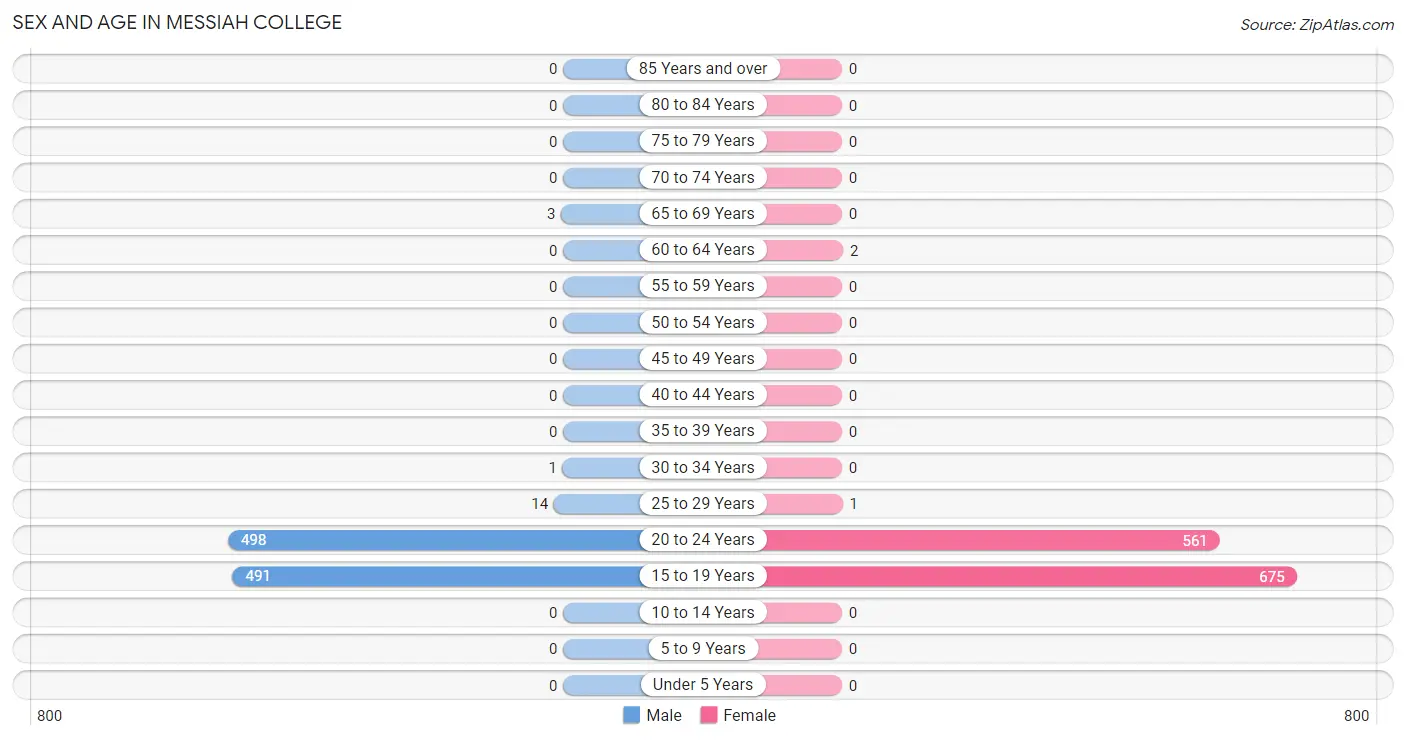
| Age Bracket | Male | Female |
| Under 5 Years | 0 (0.0%) | 0 (0.0%) |
| 5 to 9 Years | 0 (0.0%) | 0 (0.0%) |
| 10 to 14 Years | 0 (0.0%) | 0 (0.0%) |
| 15 to 19 Years | 491 (48.8%) | 675 (54.5%) |
| 20 to 24 Years | 498 (49.4%) | 561 (45.3%) |
| 25 to 29 Years | 14 (1.4%) | 1 (0.1%) |
| 30 to 34 Years | 1 (0.1%) | 0 (0.0%) |
| 35 to 39 Years | 0 (0.0%) | 0 (0.0%) |
| 40 to 44 Years | 0 (0.0%) | 0 (0.0%) |
| 45 to 49 Years | 0 (0.0%) | 0 (0.0%) |
| 50 to 54 Years | 0 (0.0%) | 0 (0.0%) |
| 55 to 59 Years | 0 (0.0%) | 0 (0.0%) |
| 60 to 64 Years | 0 (0.0%) | 2 (0.2%) |
| 65 to 69 Years | 3 (0.3%) | 0 (0.0%) |
| 70 to 74 Years | 0 (0.0%) | 0 (0.0%) |
| 75 to 79 Years | 0 (0.0%) | 0 (0.0%) |
| 80 to 84 Years | 0 (0.0%) | 0 (0.0%) |
| 85 Years and over | 0 (0.0%) | 0 (0.0%) |
| Total | 1,007 (100.0%) | 1,239 (100.0%) |
Families and Households in Messiah College
Median Family Size in Messiah College
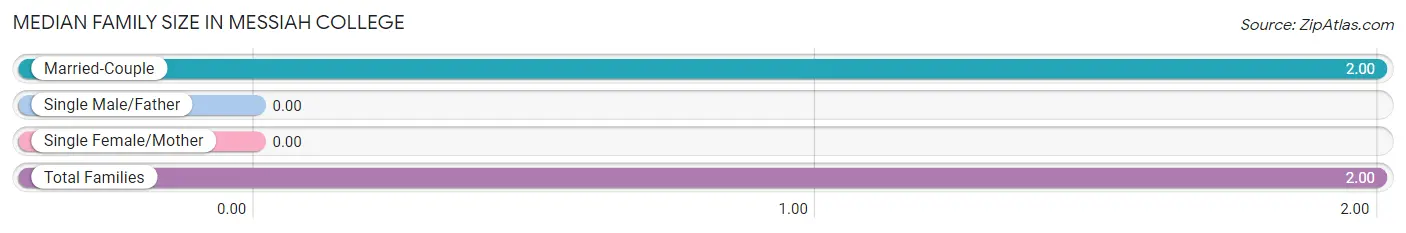
| Family Type | # Families | Family Size |
| Married-Couple | 2 (100.0%) | 2.00 |
| Single Male/Father | 0 (0.0%) | - |
| Single Female/Mother | 0 (0.0%) | - |
| Total Families | 2 (100.0%) | 2.00 |
Median Household Size in Messiah College
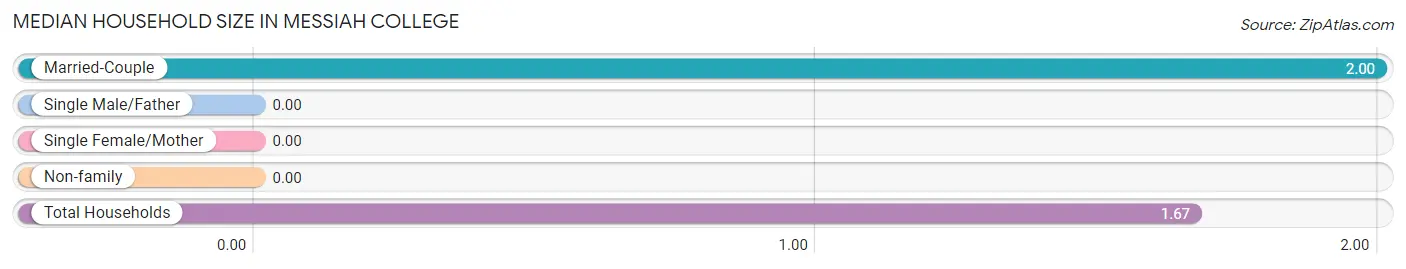
| Household Type | # Households | Household Size |
| Married-Couple | 2 (66.7%) | 2.00 |
| Single Male/Father | 0 (0.0%) | - |
| Single Female/Mother | 0 (0.0%) | - |
| Non-family | 1 (33.3%) | - |
| Total Households | 3 (100.0%) | 1.67 |
Household Size by Marriage Status in Messiah College
Out of a total of 3 households in Messiah College, 2 (66.7%) are family households, while 1 (33.3%) are nonfamily households. The most numerous type of family households are 2-person households, comprising 2, and the most common type of nonfamily households are 1-person households, comprising 1.
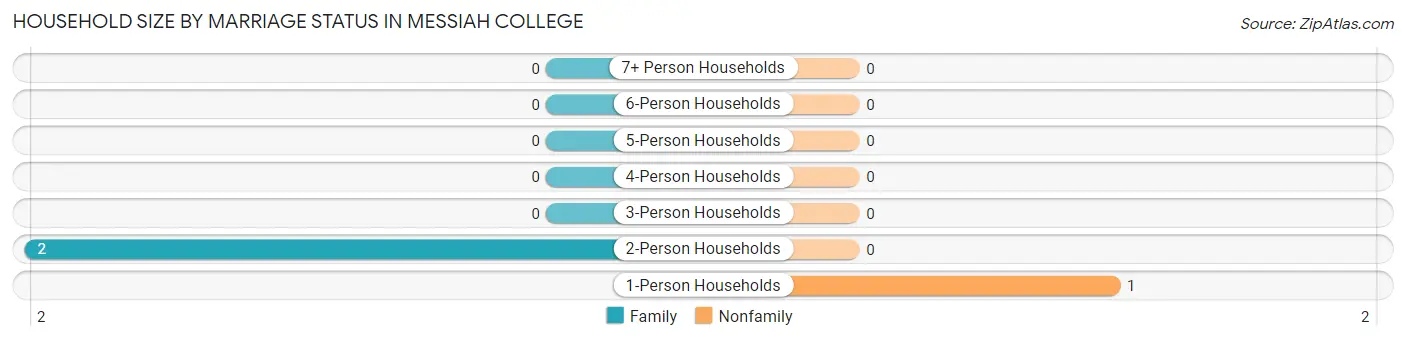
| Household Size | Family Households | Nonfamily Households |
| 1-Person Households | - | 1 (33.3%) |
| 2-Person Households | 2 (66.7%) | 0 (0.0%) |
| 3-Person Households | 0 (0.0%) | 0 (0.0%) |
| 4-Person Households | 0 (0.0%) | 0 (0.0%) |
| 5-Person Households | 0 (0.0%) | 0 (0.0%) |
| 6-Person Households | 0 (0.0%) | 0 (0.0%) |
| 7+ Person Households | 0 (0.0%) | 0 (0.0%) |
| Total | 2 (66.7%) | 1 (33.3%) |
Female Fertility in Messiah College
Fertility by Age in Messiah College
Average fertility rate in Messiah College is 1.0 births per 1,000 women. Women in the age bracket of 20 to 34 years have the highest fertility rate with 2.0 births per 1,000 women. Women in the age bracket of 20 to 34 years acount for 100.0% of all women with births.
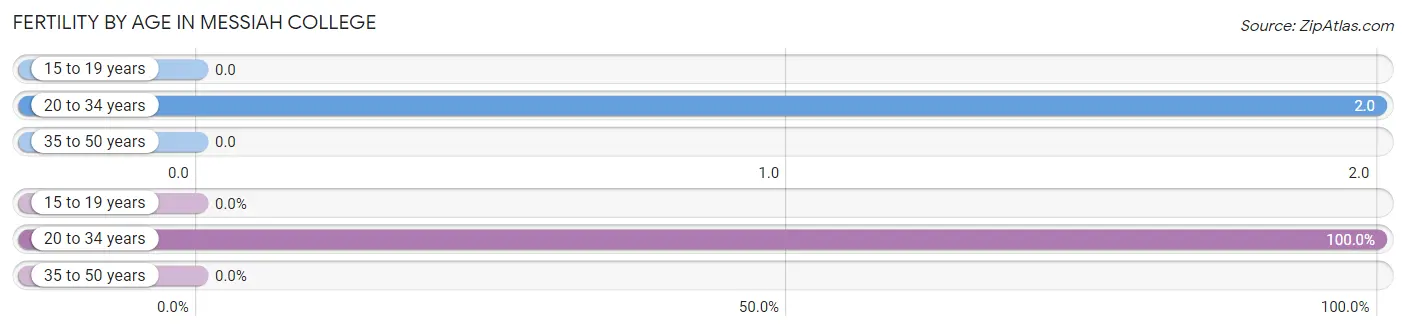
| Age Bracket | Women with Births | Births / 1,000 Women |
| 15 to 19 years | 0 (0.0%) | 0.0 |
| 20 to 34 years | 1 (100.0%) | 2.0 |
| 35 to 50 years | 0 (0.0%) | 0.0 |
| Total | 1 (100.0%) | 1.0 |
Fertility by Age by Marriage Status in Messiah College
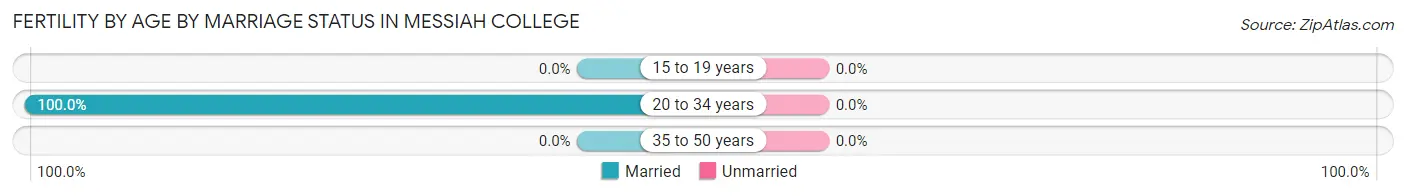
| Age Bracket | Married | Unmarried |
| 15 to 19 years | 0 (0.0%) | 0 (0.0%) |
| 20 to 34 years | 1 (100.0%) | 0 (0.0%) |
| 35 to 50 years | 0 (0.0%) | 0 (0.0%) |
| Total | 1 (100.0%) | 0 (0.0%) |
Fertility by Education in Messiah College
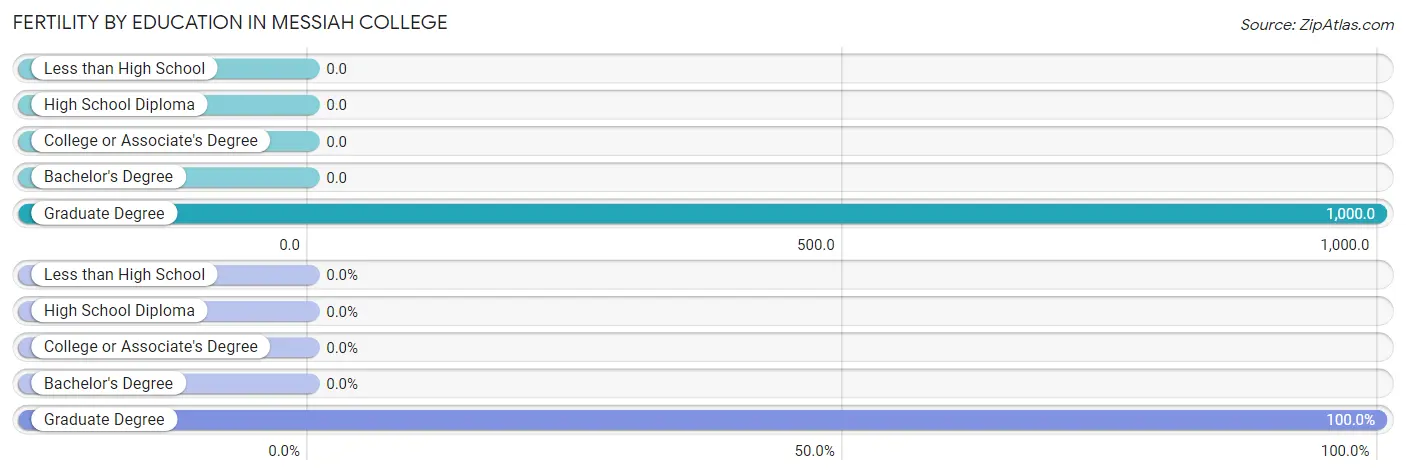
| Educational Attainment | Women with Births | Births / 1,000 Women |
| Less than High School | 0 (0.0%) | 0.0 |
| High School Diploma | 0 (0.0%) | 0.0 |
| College or Associate's Degree | 0 (0.0%) | 0.0 |
| Bachelor's Degree | 0 (0.0%) | 0.0 |
| Graduate Degree | 1 (100.0%) | 1,000.0 |
| Total | 1 (100.0%) | 1.0 |
Fertility by Education by Marriage Status in Messiah College
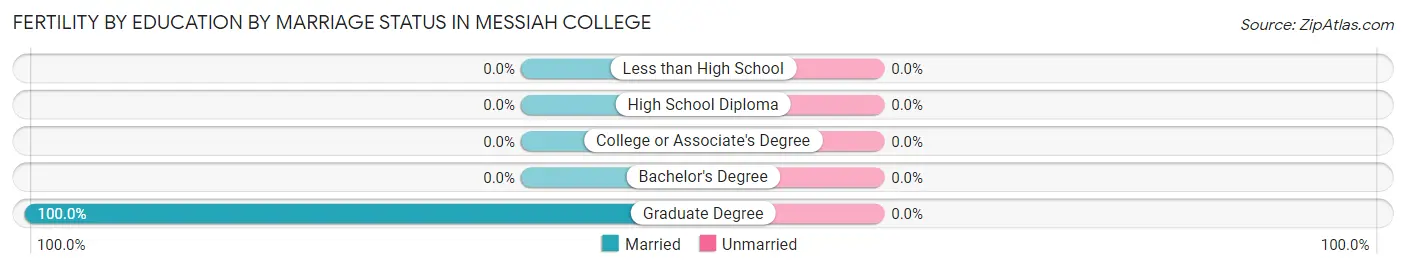
| Educational Attainment | Married | Unmarried |
| Less than High School | 0 (0.0%) | 0 (0.0%) |
| High School Diploma | 0 (0.0%) | 0 (0.0%) |
| College or Associate's Degree | 0 (0.0%) | 0 (0.0%) |
| Bachelor's Degree | 0 (0.0%) | 0 (0.0%) |
| Graduate Degree | 1 (100.0%) | 0 (0.0%) |
| Total | 1 (100.0%) | 0 (0.0%) |
Employment Characteristics in Messiah College
Employment by Class of Employer in Messiah College
Among the 1,008 employed individuals in Messiah College, private company employees (876 | 86.9%), not-for-profit organizations (97 | 9.6%), and local government employees (24 | 2.4%) make up the most common classes of employment.
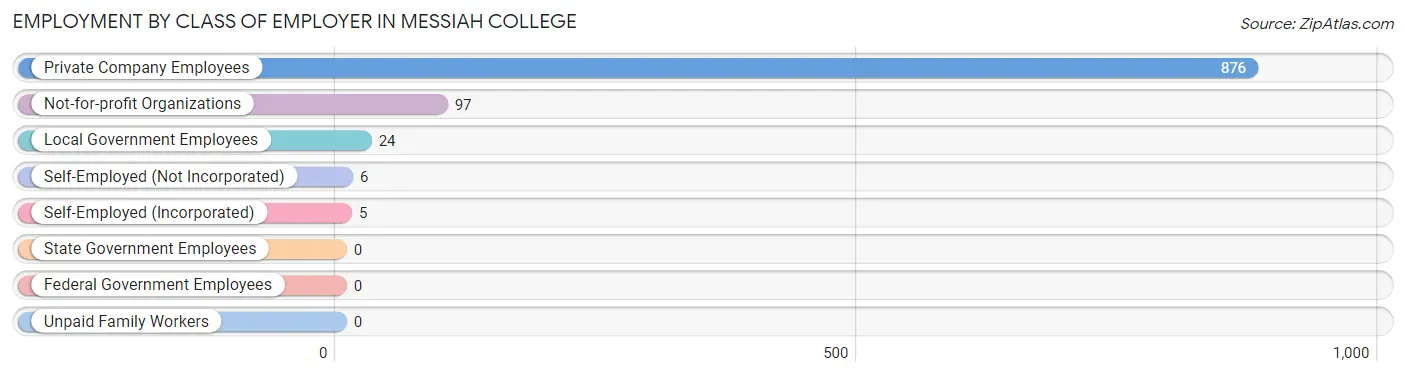
| Employer Class | # Employees | % Employees |
| Private Company Employees | 876 | 86.9% |
| Self-Employed (Incorporated) | 5 | 0.5% |
| Self-Employed (Not Incorporated) | 6 | 0.6% |
| Not-for-profit Organizations | 97 | 9.6% |
| Local Government Employees | 24 | 2.4% |
| State Government Employees | 0 | 0.0% |
| Federal Government Employees | 0 | 0.0% |
| Unpaid Family Workers | 0 | 0.0% |
| Total | 1,008 | 100.0% |
Employment Status by Age in Messiah College
According to the labor force statistics for Messiah College, out of the total population over 16 years of age (2,246), 69.3% or 1,556 individuals are in the labor force, with 5.9% or 92 of them unemployed. The age group with the highest labor force participation rate is 25 to 29 years, with 100.0% or 15 individuals in the labor force. Within the labor force, the 20 to 24 years age range has the highest percentage of unemployed individuals, with 9.0% or 72 of them being unemployed.
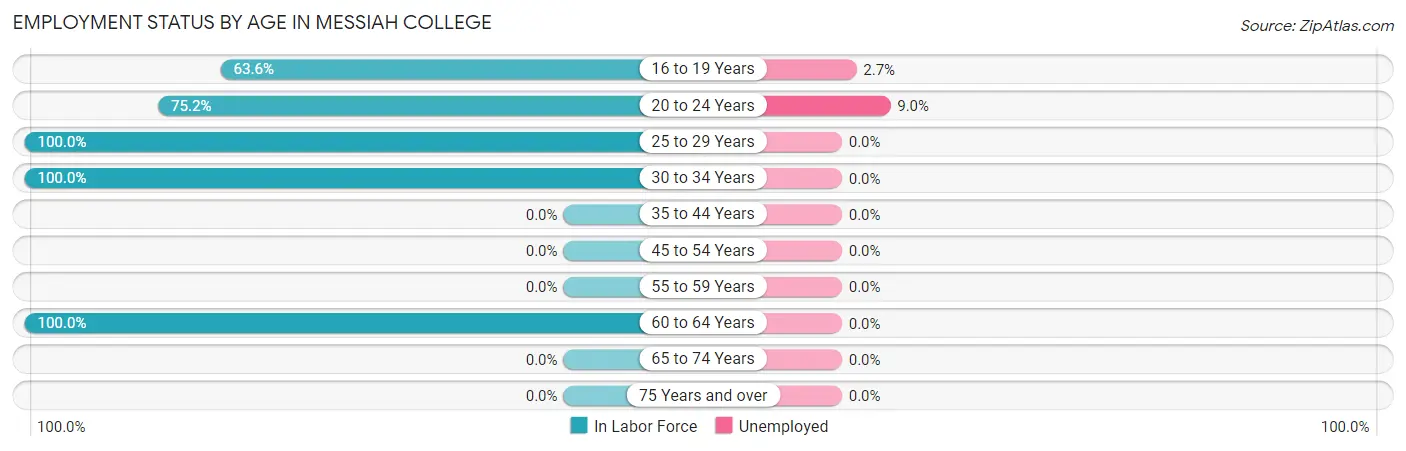
| Age Bracket | In Labor Force | Unemployed |
| 16 to 19 Years | 742 (63.6%) | 20 (2.7%) |
| 20 to 24 Years | 796 (75.2%) | 72 (9.0%) |
| 25 to 29 Years | 15 (100.0%) | 0 (0.0%) |
| 30 to 34 Years | 1 (100.0%) | 0 (0.0%) |
| 35 to 44 Years | 0 (0.0%) | 0 (0.0%) |
| 45 to 54 Years | 0 (0.0%) | 0 (0.0%) |
| 55 to 59 Years | 0 (0.0%) | 0 (0.0%) |
| 60 to 64 Years | 2 (100.0%) | 0 (0.0%) |
| 65 to 74 Years | 0 (0.0%) | 0 (0.0%) |
| 75 Years and over | 0 (0.0%) | 0 (0.0%) |
| Total | 1,556 (69.3%) | 92 (5.9%) |
Employment Status by Educational Attainment in Messiah College
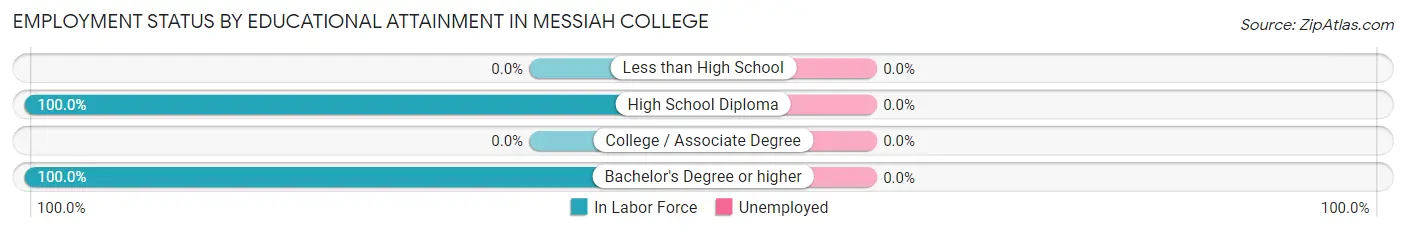
| Educational Attainment | In Labor Force | Unemployed |
| Less than High School | 0 (0.0%) | 0 (0.0%) |
| High School Diploma | 2 (100.0%) | 0 (0.0%) |
| College / Associate Degree | 0 (0.0%) | 0 (0.0%) |
| Bachelor's Degree or higher | 16 (100.0%) | 0 (0.0%) |
| Total | 18 (100.0%) | 0 (0.0%) |
Employment Occupations by Sex in Messiah College
Management, Business, Science and Arts Occupations
The most common Management, Business, Science and Arts occupations in Messiah College are Community & Social Service (172 | 11.7%), Education Instruction & Library (117 | 8.0%), Management (49 | 3.4%), Arts, Media & Entertainment (44 | 3.0%), and Computers, Engineering & Science (25 | 1.7%).
Management, Business, Science and Arts Occupations by Sex
Within the Management, Business, Science and Arts occupations in Messiah College, the most male-oriented occupations are Architecture & Engineering (100.0%), Education, Arts & Media (100.0%), and Community & Social Service (41.3%), while the most female-oriented occupations are Computers & Mathematics (100.0%), Life, Physical & Social Science (100.0%), and Health Diagnosing & Treating (100.0%).
| Occupation | Male | Female |
| Management | 7 (14.3%) | 42 (85.7%) |
| Business & Financial | 6 (37.5%) | 10 (62.5%) |
| Computers, Engineering & Science | 7 (28.0%) | 18 (72.0%) |
| Computers & Mathematics | 0 (0.0%) | 6 (100.0%) |
| Architecture & Engineering | 7 (100.0%) | 0 (0.0%) |
| Life, Physical & Social Science | 0 (0.0%) | 12 (100.0%) |
| Community & Social Service | 71 (41.3%) | 101 (58.7%) |
| Education, Arts & Media | 11 (100.0%) | 0 (0.0%) |
| Legal Services & Support | 0 (0.0%) | 0 (0.0%) |
| Education Instruction & Library | 42 (35.9%) | 75 (64.1%) |
| Arts, Media & Entertainment | 18 (40.9%) | 26 (59.1%) |
| Health Diagnosing & Treating | 0 (0.0%) | 5 (100.0%) |
| Health Technologists | 0 (0.0%) | 0 (0.0%) |
| Total (Category) | 91 (34.1%) | 176 (65.9%) |
| Total (Overall) | 598 (40.8%) | 866 (59.2%) |
Services Occupations
The most common Services occupations in Messiah College are Food Preparation & Serving (512 | 35.0%), Personal Care & Service (242 | 16.5%), Cleaning & Maintenance (103 | 7.0%), Security & Protection (39 | 2.7%), and Firefighting & Prevention (39 | 2.7%).
Services Occupations by Sex
Within the Services occupations in Messiah College, the most male-oriented occupations are Cleaning & Maintenance (65.0%), Security & Protection (64.1%), and Firefighting & Prevention (64.1%), while the most female-oriented occupations are Healthcare Support (100.0%), Food Preparation & Serving (72.3%), and Personal Care & Service (38.0%).
| Occupation | Male | Female |
| Healthcare Support | 0 (0.0%) | 19 (100.0%) |
| Security & Protection | 25 (64.1%) | 14 (35.9%) |
| Firefighting & Prevention | 25 (64.1%) | 14 (35.9%) |
| Law Enforcement | 0 (0.0%) | 0 (0.0%) |
| Food Preparation & Serving | 142 (27.7%) | 370 (72.3%) |
| Cleaning & Maintenance | 67 (65.0%) | 36 (34.9%) |
| Personal Care & Service | 150 (62.0%) | 92 (38.0%) |
| Total (Category) | 384 (42.0%) | 531 (58.0%) |
| Total (Overall) | 598 (40.8%) | 866 (59.2%) |
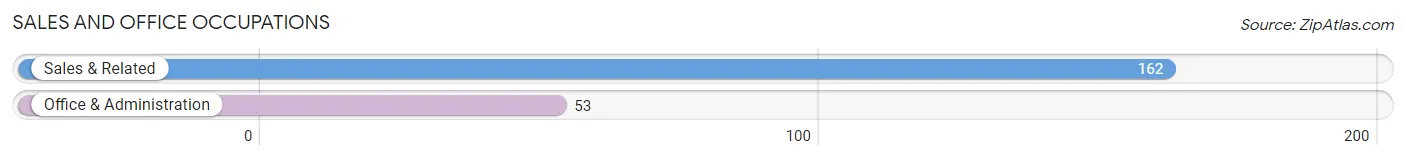
Sales and Office Occupations
The most common Sales and Office occupations in Messiah College are Sales & Related (162 | 11.1%), and Office & Administration (53 | 3.6%).
Sales and Office Occupations by Sex

| Occupation | Male | Female |
| Sales & Related | 64 (39.5%) | 98 (60.5%) |
| Office & Administration | 7 (13.2%) | 46 (86.8%) |
| Total (Category) | 71 (33.0%) | 144 (67.0%) |
| Total (Overall) | 598 (40.8%) | 866 (59.2%) |
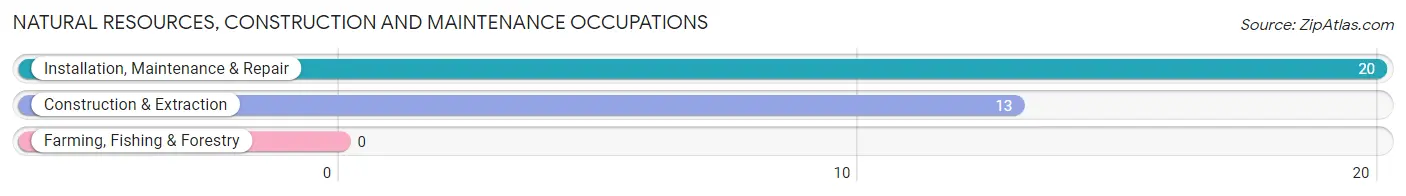
Natural Resources, Construction and Maintenance Occupations
The most common Natural Resources, Construction and Maintenance occupations in Messiah College are Installation, Maintenance & Repair (20 | 1.4%), and Construction & Extraction (13 | 0.9%).
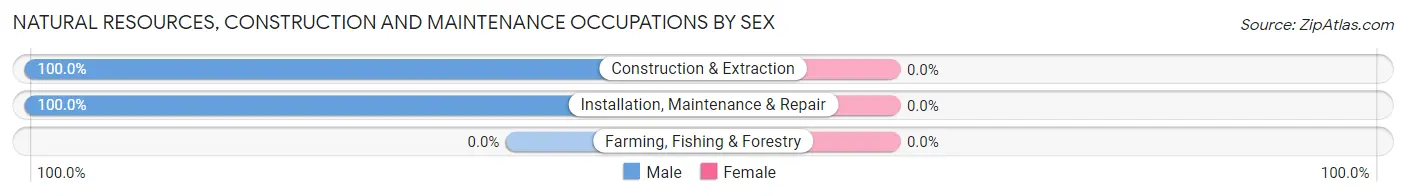
Natural Resources, Construction and Maintenance Occupations by Sex
| Occupation | Male | Female |
| Farming, Fishing & Forestry | 0 (0.0%) | 0 (0.0%) |
| Construction & Extraction | 13 (100.0%) | 0 (0.0%) |
| Installation, Maintenance & Repair | 20 (100.0%) | 0 (0.0%) |
| Total (Category) | 33 (100.0%) | 0 (0.0%) |
| Total (Overall) | 598 (40.8%) | 866 (59.2%) |
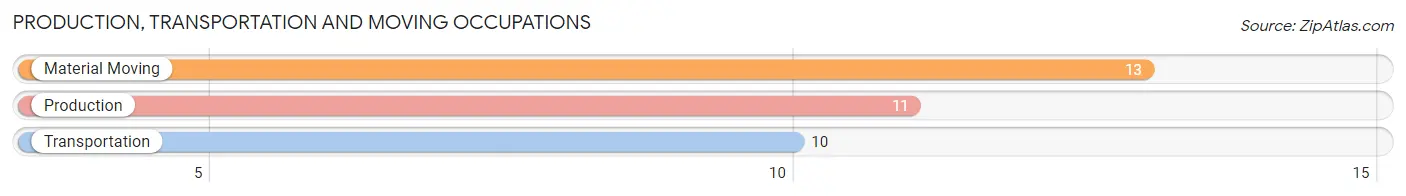
Production, Transportation and Moving Occupations
The most common Production, Transportation and Moving occupations in Messiah College are Material Moving (13 | 0.9%), Production (11 | 0.7%), and Transportation (10 | 0.7%).
Production, Transportation and Moving Occupations by Sex
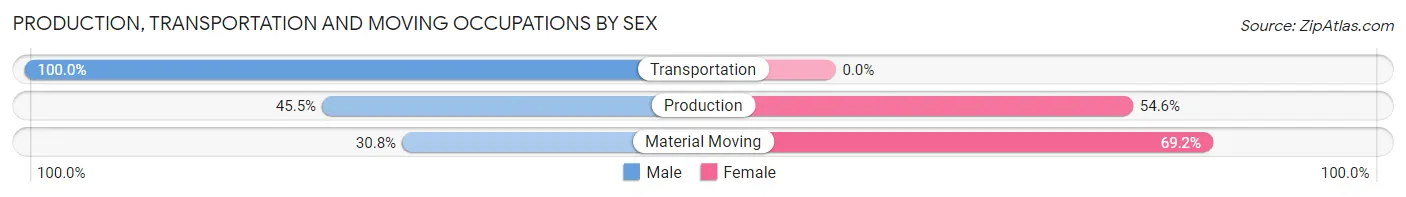
| Occupation | Male | Female |
| Production | 5 (45.5%) | 6 (54.5%) |
| Transportation | 10 (100.0%) | 0 (0.0%) |
| Material Moving | 4 (30.8%) | 9 (69.2%) |
| Total (Category) | 19 (55.9%) | 15 (44.1%) |
| Total (Overall) | 598 (40.8%) | 866 (59.2%) |
Employment Industries by Sex in Messiah College
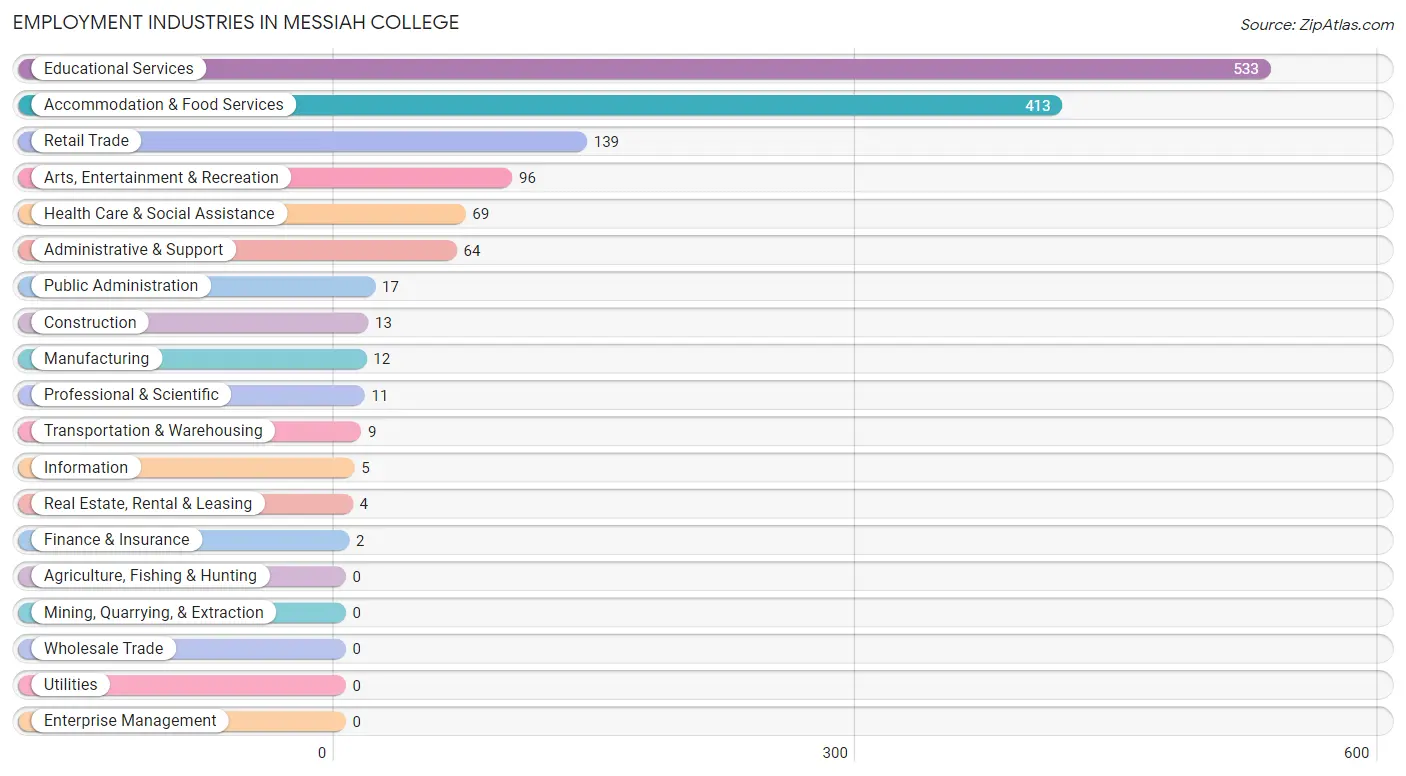
Employment Industries in Messiah College
The major employment industries in Messiah College include Educational Services (533 | 36.4%), Accommodation & Food Services (413 | 28.2%), Retail Trade (139 | 9.5%), Arts, Entertainment & Recreation (96 | 6.6%), and Health Care & Social Assistance (69 | 4.7%).
Employment Industries by Sex in Messiah College
The Messiah College industries that see more men than women are Construction (100.0%), Manufacturing (100.0%), and Information (100.0%), whereas the industries that tend to have a higher number of women are Finance & Insurance (100.0%), Real Estate, Rental & Leasing (100.0%), and Administrative & Support (92.2%).
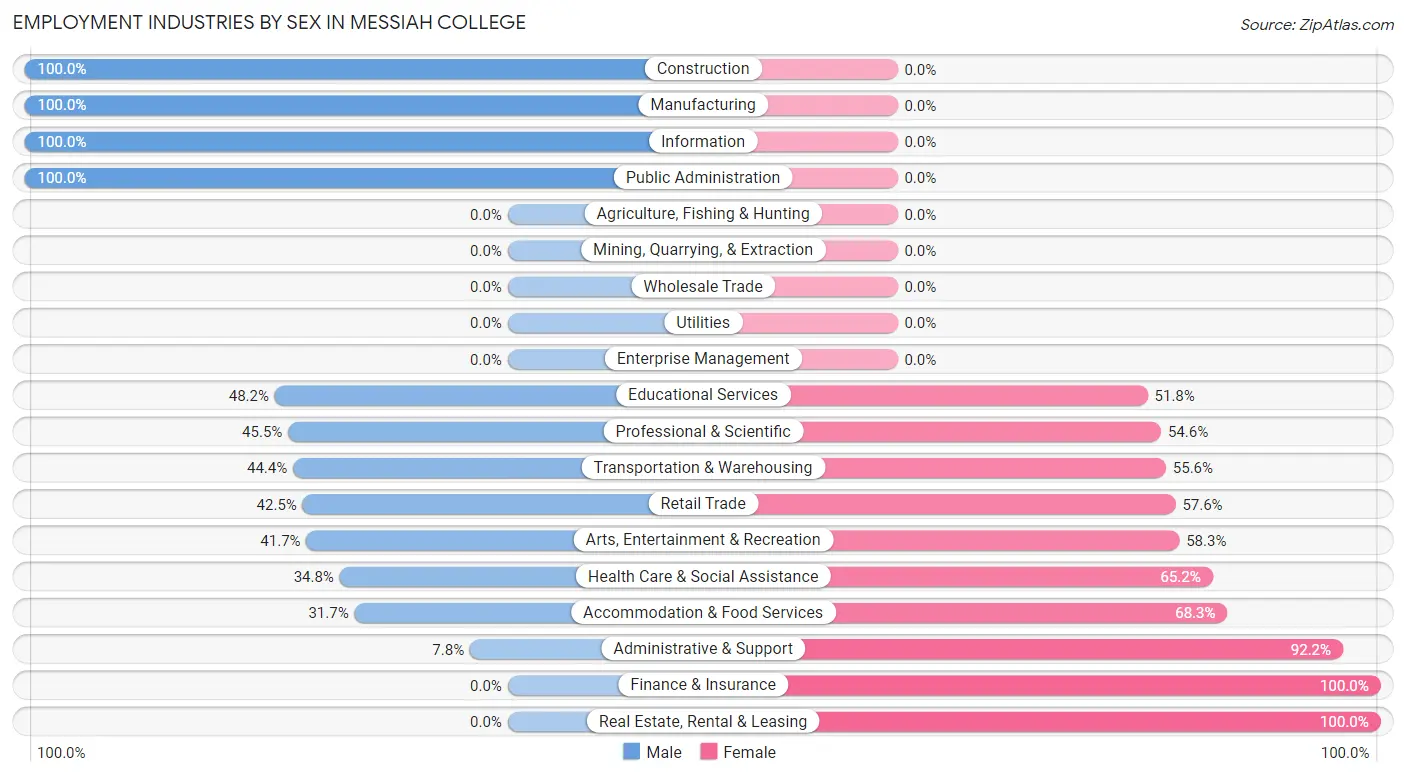
| Industry | Male | Female |
| Agriculture, Fishing & Hunting | 0 (0.0%) | 0 (0.0%) |
| Mining, Quarrying, & Extraction | 0 (0.0%) | 0 (0.0%) |
| Construction | 13 (100.0%) | 0 (0.0%) |
| Manufacturing | 12 (100.0%) | 0 (0.0%) |
| Wholesale Trade | 0 (0.0%) | 0 (0.0%) |
| Retail Trade | 59 (42.4%) | 80 (57.6%) |
| Transportation & Warehousing | 4 (44.4%) | 5 (55.6%) |
| Utilities | 0 (0.0%) | 0 (0.0%) |
| Information | 5 (100.0%) | 0 (0.0%) |
| Finance & Insurance | 0 (0.0%) | 2 (100.0%) |
| Real Estate, Rental & Leasing | 0 (0.0%) | 4 (100.0%) |
| Professional & Scientific | 5 (45.5%) | 6 (54.5%) |
| Enterprise Management | 0 (0.0%) | 0 (0.0%) |
| Administrative & Support | 5 (7.8%) | 59 (92.2%) |
| Educational Services | 257 (48.2%) | 276 (51.8%) |
| Health Care & Social Assistance | 24 (34.8%) | 45 (65.2%) |
| Arts, Entertainment & Recreation | 40 (41.7%) | 56 (58.3%) |
| Accommodation & Food Services | 131 (31.7%) | 282 (68.3%) |
| Public Administration | 17 (100.0%) | 0 (0.0%) |
| Total | 598 (40.8%) | 866 (59.2%) |
Education in Messiah College
School Enrollment in Messiah College
The most common levels of schooling among the 2,234 students in Messiah College are college / undergraduate (2,225 | 99.6%), and graduate / professional (9 | 0.4%).
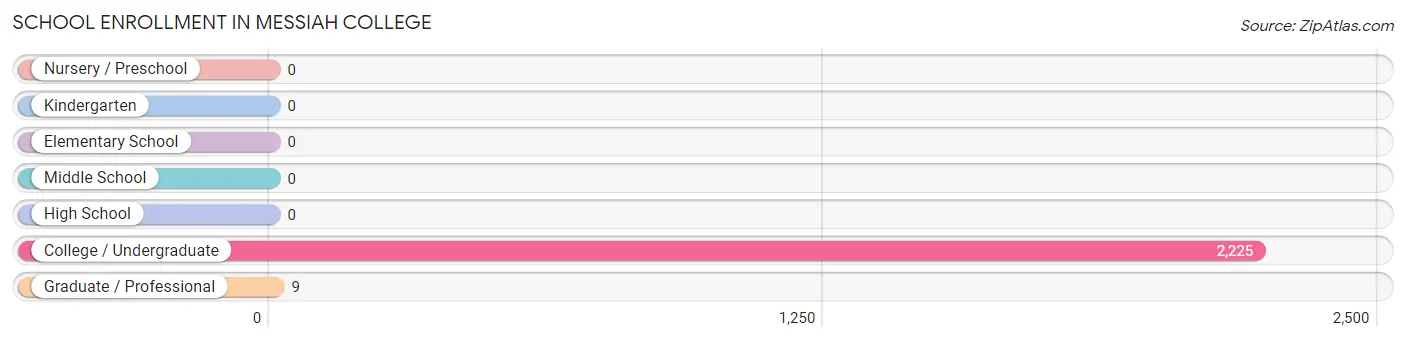
| School Level | # Students | % Students |
| Nursery / Preschool | 0 | 0.0% |
| Kindergarten | 0 | 0.0% |
| Elementary School | 0 | 0.0% |
| Middle School | 0 | 0.0% |
| High School | 0 | 0.0% |
| College / Undergraduate | 2,225 | 99.6% |
| Graduate / Professional | 9 | 0.4% |
| Total | 2,234 | 100.0% |
School Enrollment by Age by Funding Source in Messiah College
Out of a total of 2,234 students who are enrolled in schools in Messiah College, 2,020 (90.4%) attend a private institution, while the remaining 214 (9.6%) are enrolled in public schools. The age group of 20 to 24 year olds has the highest likelihood of being enrolled in private schools, with 1,001 (94.5% in the age bracket) enrolled. Conversely, the age group of 25 to 34 year olds has the lowest likelihood of being enrolled in a private school, with 9 (100.0% in the age bracket) attending a public institution.
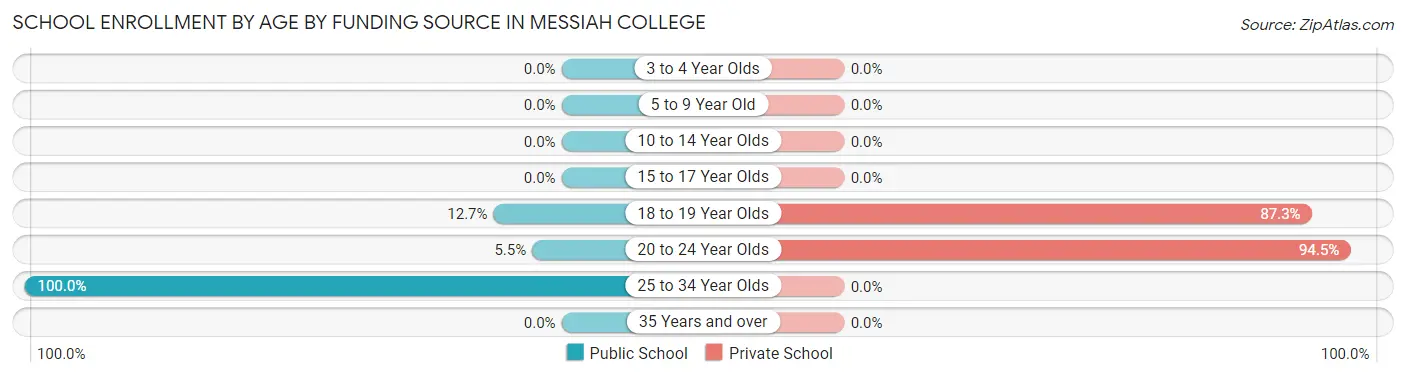
| Age Bracket | Public School | Private School |
| 3 to 4 Year Olds | 0 (0.0%) | 0 (0.0%) |
| 5 to 9 Year Old | 0 (0.0%) | 0 (0.0%) |
| 10 to 14 Year Olds | 0 (0.0%) | 0 (0.0%) |
| 15 to 17 Year Olds | 0 (0.0%) | 0 (0.0%) |
| 18 to 19 Year Olds | 148 (12.7%) | 1,018 (87.3%) |
| 20 to 24 Year Olds | 58 (5.5%) | 1,001 (94.5%) |
| 25 to 34 Year Olds | 9 (100.0%) | 0 (0.0%) |
| 35 Years and over | 0 (0.0%) | 0 (0.0%) |
| Total | 214 (9.6%) | 2,020 (90.4%) |
Educational Attainment by Field of Study in Messiah College
Business (11 | 64.7%), computers & mathematics (5 | 29.4%), and communications (1 | 5.9%) are the most common fields of study among 17 individuals in Messiah College who have obtained a bachelor's degree or higher.
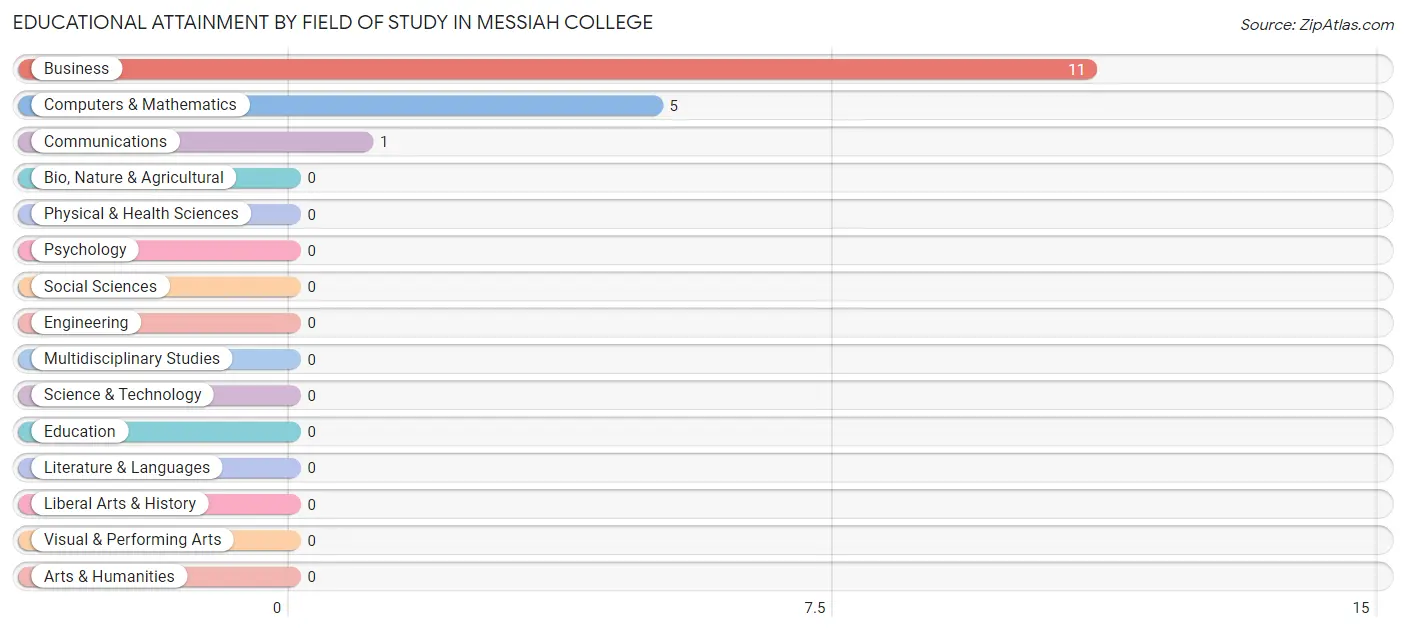
| Field of Study | # Graduates | % Graduates |
| Computers & Mathematics | 5 | 29.4% |
| Bio, Nature & Agricultural | 0 | 0.0% |
| Physical & Health Sciences | 0 | 0.0% |
| Psychology | 0 | 0.0% |
| Social Sciences | 0 | 0.0% |
| Engineering | 0 | 0.0% |
| Multidisciplinary Studies | 0 | 0.0% |
| Science & Technology | 0 | 0.0% |
| Business | 11 | 64.7% |
| Education | 0 | 0.0% |
| Literature & Languages | 0 | 0.0% |
| Liberal Arts & History | 0 | 0.0% |
| Visual & Performing Arts | 0 | 0.0% |
| Communications | 1 | 5.9% |
| Arts & Humanities | 0 | 0.0% |
| Total | 17 | 100.0% |
Transportation & Commute in Messiah College
Vehicle Availability by Sex in Messiah College
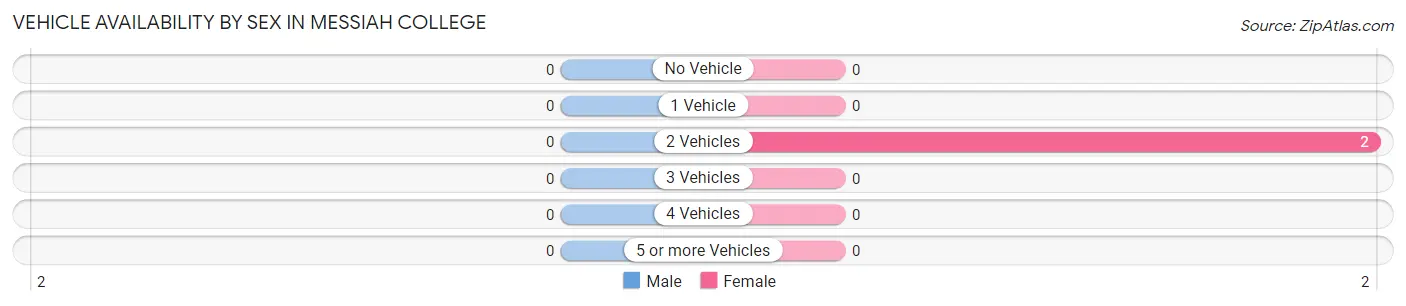
| Vehicles Available | Male | Female |
| No Vehicle | 0 (0.0%) | 0 (0.0%) |
| 1 Vehicle | 0 (0.0%) | 0 (0.0%) |
| 2 Vehicles | 0 (0.0%) | 2 (100.0%) |
| 3 Vehicles | 0 (0.0%) | 0 (0.0%) |
| 4 Vehicles | 0 (0.0%) | 0 (0.0%) |
| 5 or more Vehicles | 0 (0.0%) | 0 (0.0%) |
| Total | 0 (0.0%) | 2 (100.0%) |
Commute Time in Messiah College
The most frequently occuring commute durations in Messiah College are 5 to 9 minutes (461 commuters, 51.4%), less than 5 minutes (213 commuters, 23.8%), and 10 to 14 minutes (102 commuters, 11.4%).
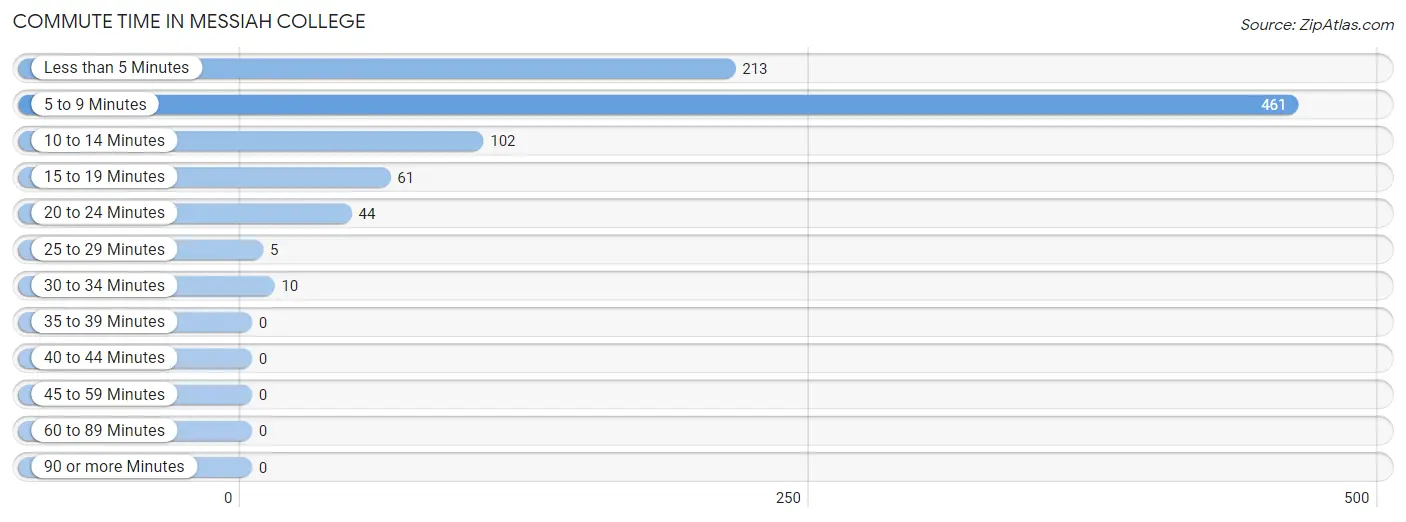
| Commute Time | # Commuters | % Commuters |
| Less than 5 Minutes | 213 | 23.8% |
| 5 to 9 Minutes | 461 | 51.4% |
| 10 to 14 Minutes | 102 | 11.4% |
| 15 to 19 Minutes | 61 | 6.8% |
| 20 to 24 Minutes | 44 | 4.9% |
| 25 to 29 Minutes | 5 | 0.6% |
| 30 to 34 Minutes | 10 | 1.1% |
| 35 to 39 Minutes | 0 | 0.0% |
| 40 to 44 Minutes | 0 | 0.0% |
| 45 to 59 Minutes | 0 | 0.0% |
| 60 to 89 Minutes | 0 | 0.0% |
| 90 or more Minutes | 0 | 0.0% |
Commute Time by Sex in Messiah College
The most common commute times in Messiah College are 5 to 9 minutes (147 commuters, 43.8%) for males and 5 to 9 minutes (314 commuters, 56.1%) for females.
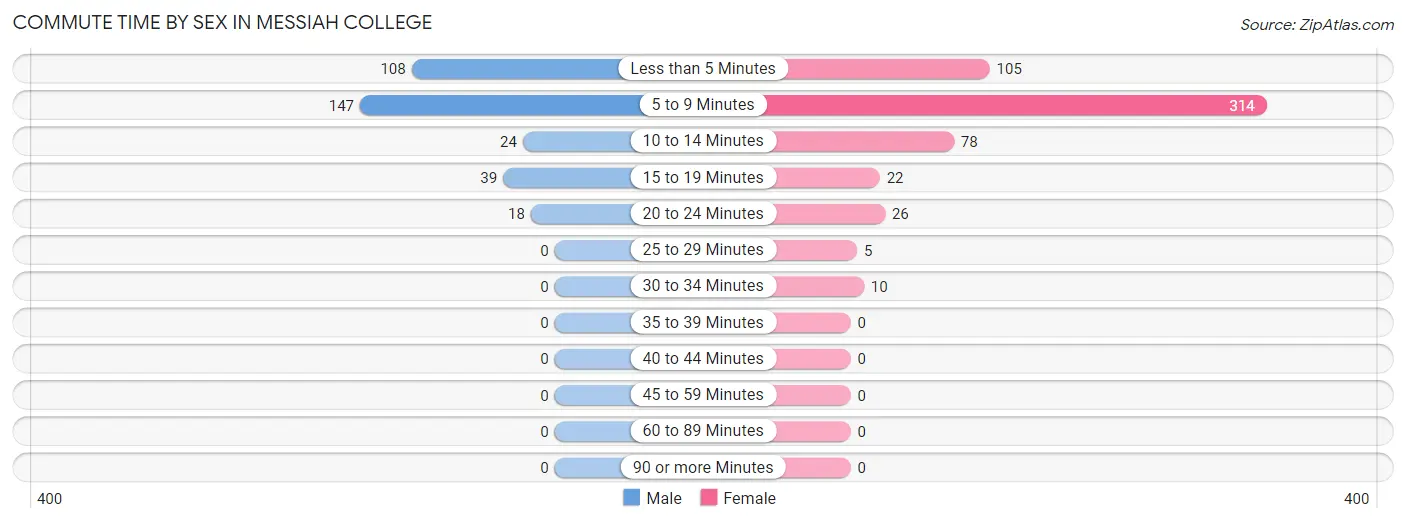
| Commute Time | Male | Female |
| Less than 5 Minutes | 108 (32.1%) | 105 (18.8%) |
| 5 to 9 Minutes | 147 (43.8%) | 314 (56.1%) |
| 10 to 14 Minutes | 24 (7.1%) | 78 (13.9%) |
| 15 to 19 Minutes | 39 (11.6%) | 22 (3.9%) |
| 20 to 24 Minutes | 18 (5.4%) | 26 (4.6%) |
| 25 to 29 Minutes | 0 (0.0%) | 5 (0.9%) |
| 30 to 34 Minutes | 0 (0.0%) | 10 (1.8%) |
| 35 to 39 Minutes | 0 (0.0%) | 0 (0.0%) |
| 40 to 44 Minutes | 0 (0.0%) | 0 (0.0%) |
| 45 to 59 Minutes | 0 (0.0%) | 0 (0.0%) |
| 60 to 89 Minutes | 0 (0.0%) | 0 (0.0%) |
| 90 or more Minutes | 0 (0.0%) | 0 (0.0%) |
Time of Departure to Work by Sex in Messiah College
The most frequent times of departure to work in Messiah College are 4:00 PM to 11:59 PM (157, 46.7%) for males and 12:00 PM to 3:59 PM (199, 35.5%) for females.
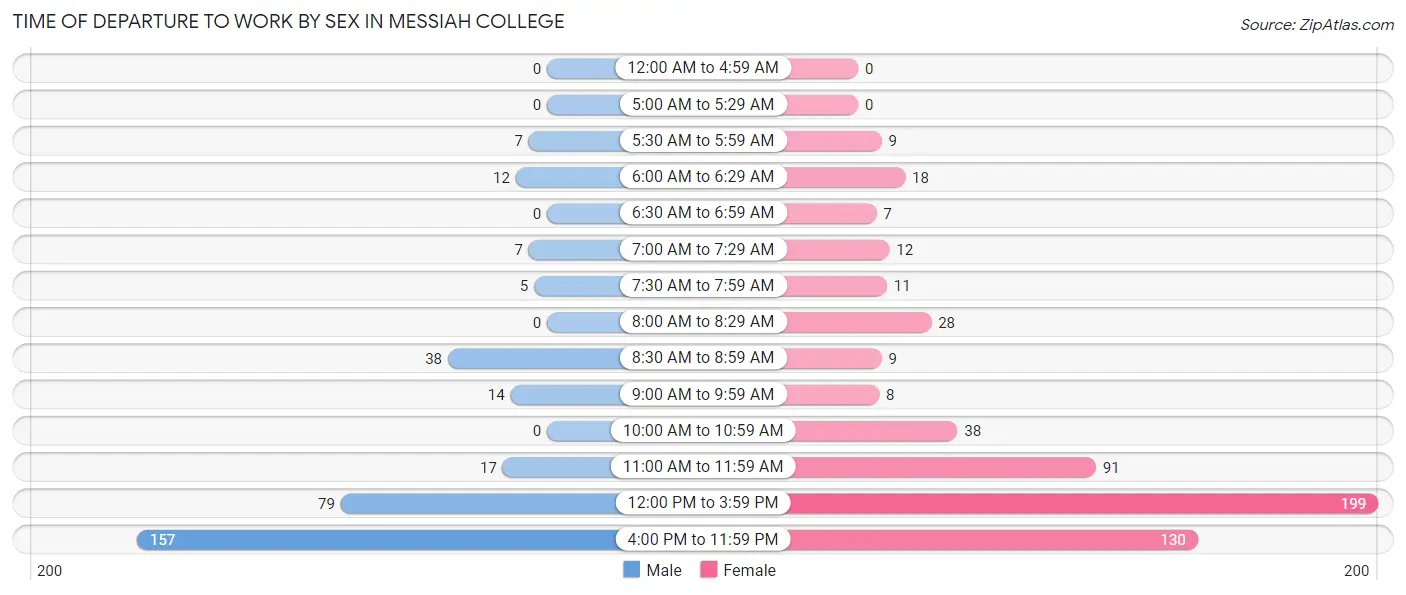
| Time of Departure | Male | Female |
| 12:00 AM to 4:59 AM | 0 (0.0%) | 0 (0.0%) |
| 5:00 AM to 5:29 AM | 0 (0.0%) | 0 (0.0%) |
| 5:30 AM to 5:59 AM | 7 (2.1%) | 9 (1.6%) |
| 6:00 AM to 6:29 AM | 12 (3.6%) | 18 (3.2%) |
| 6:30 AM to 6:59 AM | 0 (0.0%) | 7 (1.3%) |
| 7:00 AM to 7:29 AM | 7 (2.1%) | 12 (2.1%) |
| 7:30 AM to 7:59 AM | 5 (1.5%) | 11 (2.0%) |
| 8:00 AM to 8:29 AM | 0 (0.0%) | 28 (5.0%) |
| 8:30 AM to 8:59 AM | 38 (11.3%) | 9 (1.6%) |
| 9:00 AM to 9:59 AM | 14 (4.2%) | 8 (1.4%) |
| 10:00 AM to 10:59 AM | 0 (0.0%) | 38 (6.8%) |
| 11:00 AM to 11:59 AM | 17 (5.1%) | 91 (16.3%) |
| 12:00 PM to 3:59 PM | 79 (23.5%) | 199 (35.5%) |
| 4:00 PM to 11:59 PM | 157 (46.7%) | 130 (23.2%) |
| Total | 336 (100.0%) | 560 (100.0%) |
Housing Occupancy in Messiah College
Occupancy by Ownership in Messiah College
Of the total 3 dwellings in Messiah College, owner-occupied units account for 1 (33.3%), while renter-occupied units make up 2 (66.7%).
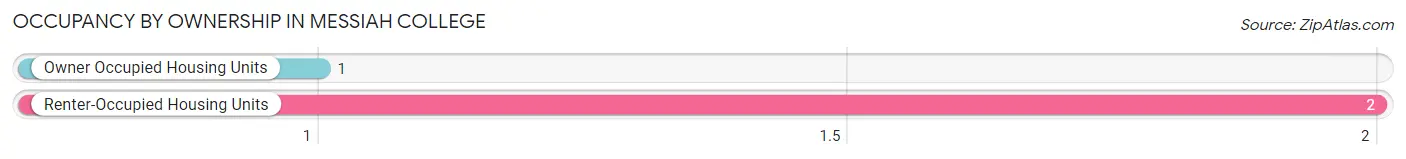
| Occupancy | # Housing Units | % Housing Units |
| Owner Occupied Housing Units | 1 | 33.3% |
| Renter-Occupied Housing Units | 2 | 66.7% |
| Total Occupied Housing Units | 3 | 100.0% |
Occupancy by Household Size in Messiah College
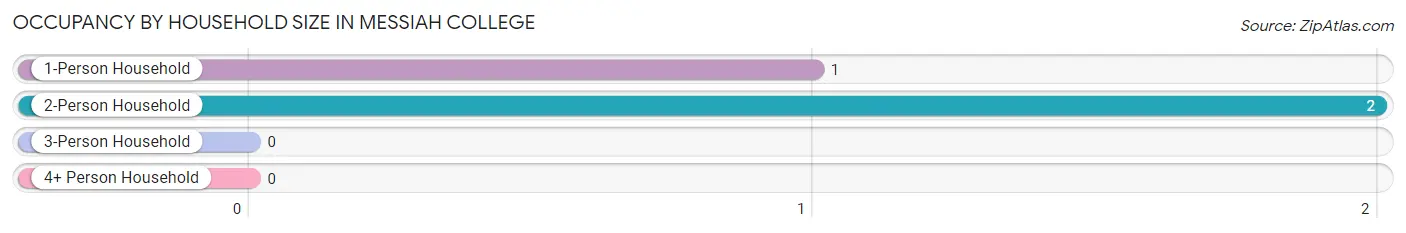
| Household Size | # Housing Units | % Housing Units |
| 1-Person Household | 1 | 33.3% |
| 2-Person Household | 2 | 66.7% |
| 3-Person Household | 0 | 0.0% |
| 4+ Person Household | 0 | 0.0% |
| Total Housing Units | 3 | 100.0% |
Occupancy by Ownership by Household Size in Messiah College
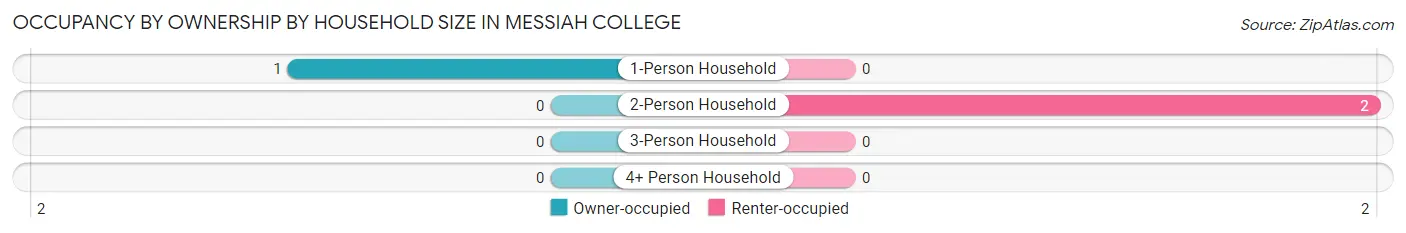
| Household Size | Owner-occupied | Renter-occupied |
| 1-Person Household | 1 (100.0%) | 0 (0.0%) |
| 2-Person Household | 0 (0.0%) | 2 (100.0%) |
| 3-Person Household | 0 (0.0%) | 0 (0.0%) |
| 4+ Person Household | 0 (0.0%) | 0 (0.0%) |
| Total Housing Units | 1 (33.3%) | 2 (66.7%) |
Occupancy by Educational Attainment in Messiah College
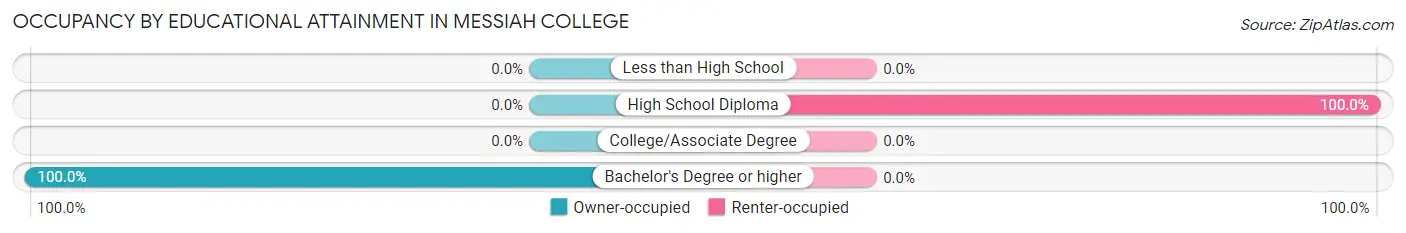
| Household Size | Owner-occupied | Renter-occupied |
| Less than High School | 0 (0.0%) | 0 (0.0%) |
| High School Diploma | 0 (0.0%) | 2 (100.0%) |
| College/Associate Degree | 0 (0.0%) | 0 (0.0%) |
| Bachelor's Degree or higher | 1 (100.0%) | 0 (0.0%) |
Occupancy by Age of Householder in Messiah College
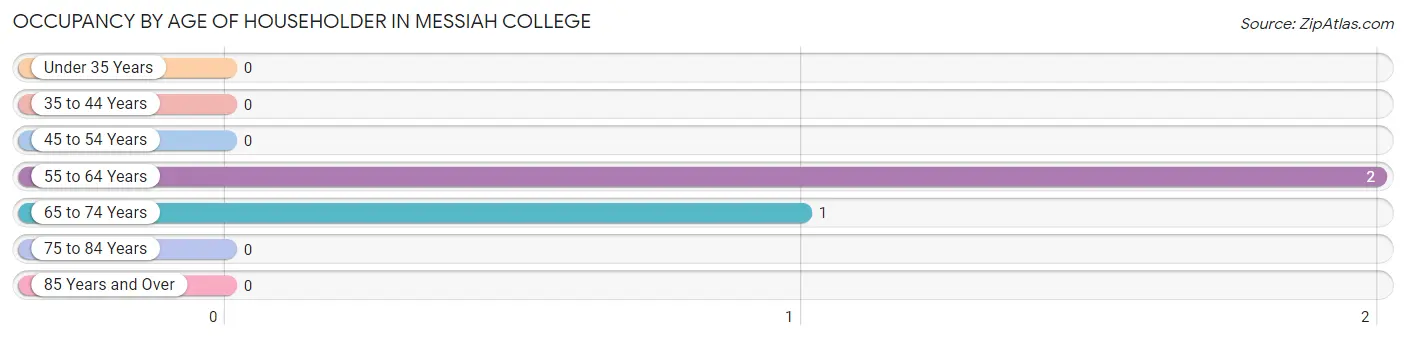
| Age Bracket | # Households | % Households |
| Under 35 Years | 0 | 0.0% |
| 35 to 44 Years | 0 | 0.0% |
| 45 to 54 Years | 0 | 0.0% |
| 55 to 64 Years | 2 | 66.7% |
| 65 to 74 Years | 1 | 33.3% |
| 75 to 84 Years | 0 | 0.0% |
| 85 Years and Over | 0 | 0.0% |
| Total | 3 | 100.0% |
Housing Finances in Messiah College
Median Income by Occupancy in Messiah College
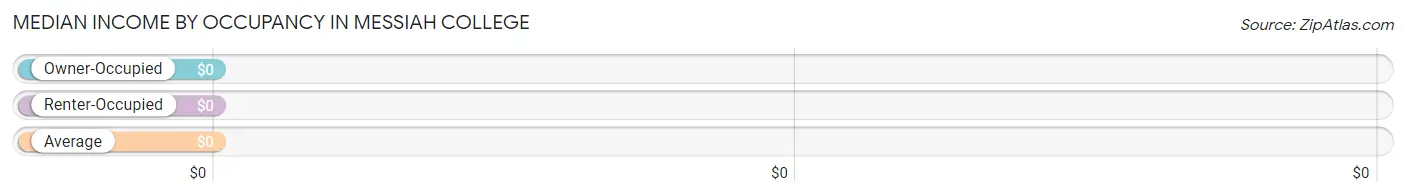
| Occupancy Type | # Households | Median Income |
| Owner-Occupied | 1 (33.3%) | $0 |
| Renter-Occupied | 2 (66.7%) | $0 |
| Average | 3 (100.0%) | $0 |
Occupancy by Householder Income Bracket in Messiah College
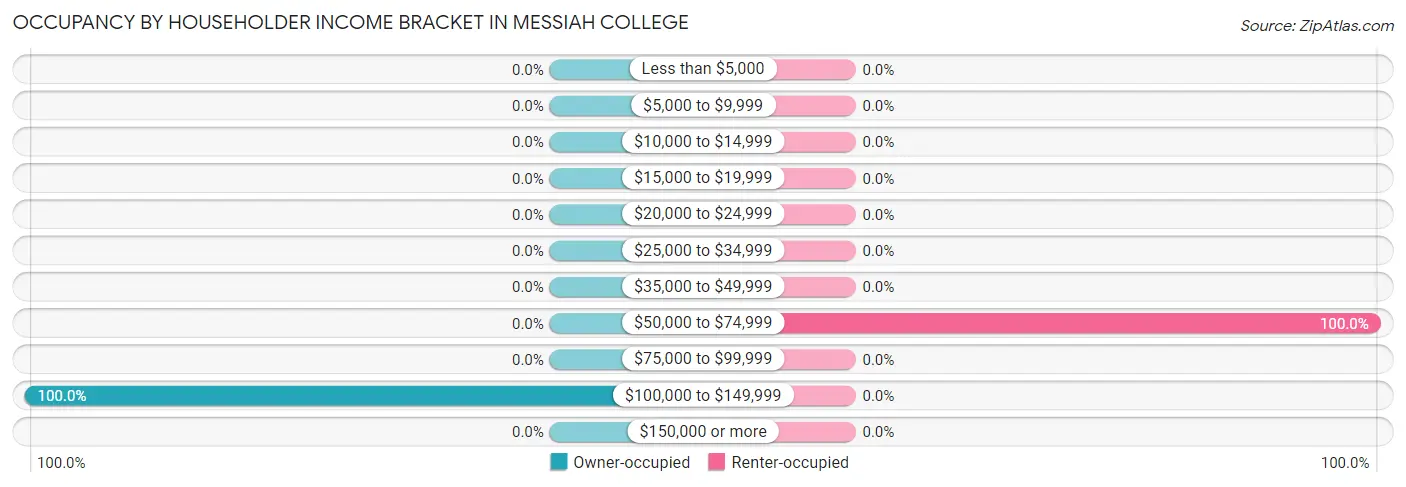
| Income Bracket | Owner-occupied | Renter-occupied |
| Less than $5,000 | 0 (0.0%) | 0 (0.0%) |
| $5,000 to $9,999 | 0 (0.0%) | 0 (0.0%) |
| $10,000 to $14,999 | 0 (0.0%) | 0 (0.0%) |
| $15,000 to $19,999 | 0 (0.0%) | 0 (0.0%) |
| $20,000 to $24,999 | 0 (0.0%) | 0 (0.0%) |
| $25,000 to $34,999 | 0 (0.0%) | 0 (0.0%) |
| $35,000 to $49,999 | 0 (0.0%) | 0 (0.0%) |
| $50,000 to $74,999 | 0 (0.0%) | 2 (100.0%) |
| $75,000 to $99,999 | 0 (0.0%) | 0 (0.0%) |
| $100,000 to $149,999 | 1 (100.0%) | 0 (0.0%) |
| $150,000 or more | 0 (0.0%) | 0 (0.0%) |
| Total | 1 (100.0%) | 2 (100.0%) |
Monthly Housing Cost Tiers in Messiah College
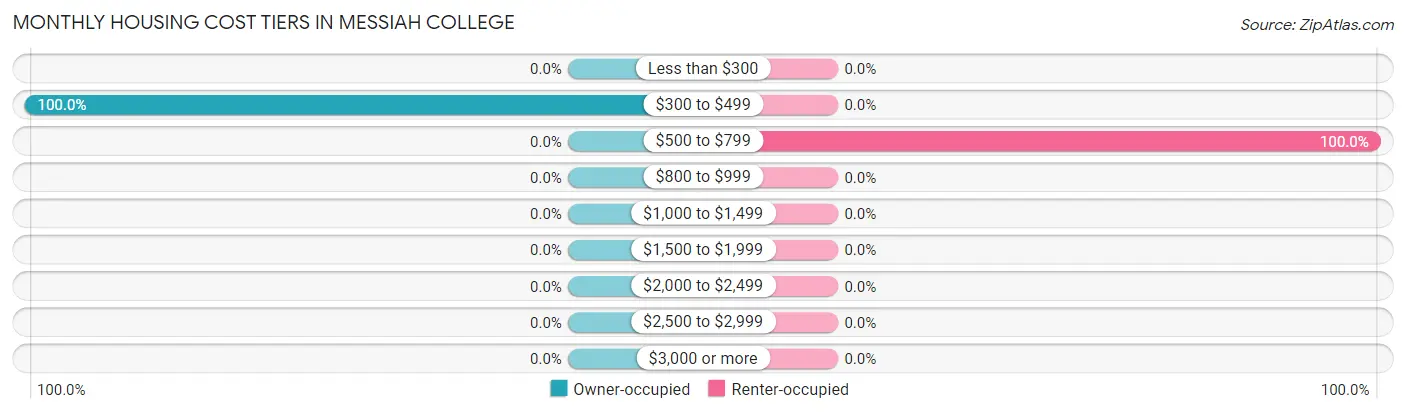
| Monthly Cost | Owner-occupied | Renter-occupied |
| Less than $300 | 0 (0.0%) | 0 (0.0%) |
| $300 to $499 | 1 (100.0%) | 0 (0.0%) |
| $500 to $799 | 0 (0.0%) | 2 (100.0%) |
| $800 to $999 | 0 (0.0%) | 0 (0.0%) |
| $1,000 to $1,499 | 0 (0.0%) | 0 (0.0%) |
| $1,500 to $1,999 | 0 (0.0%) | 0 (0.0%) |
| $2,000 to $2,499 | 0 (0.0%) | 0 (0.0%) |
| $2,500 to $2,999 | 0 (0.0%) | 0 (0.0%) |
| $3,000 or more | 0 (0.0%) | 0 (0.0%) |
| Total | 1 (100.0%) | 2 (100.0%) |
Physical Housing Characteristics in Messiah College
Housing Structures in Messiah College
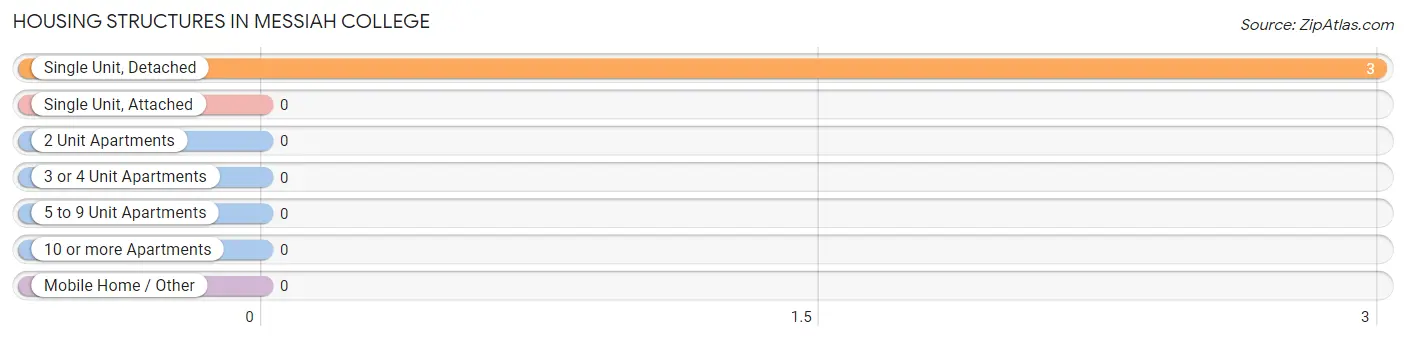
| Structure Type | # Housing Units | % Housing Units |
| Single Unit, Detached | 3 | 100.0% |
| Single Unit, Attached | 0 | 0.0% |
| 2 Unit Apartments | 0 | 0.0% |
| 3 or 4 Unit Apartments | 0 | 0.0% |
| 5 to 9 Unit Apartments | 0 | 0.0% |
| 10 or more Apartments | 0 | 0.0% |
| Mobile Home / Other | 0 | 0.0% |
| Total | 3 | 100.0% |
Housing Structures by Occupancy in Messiah College
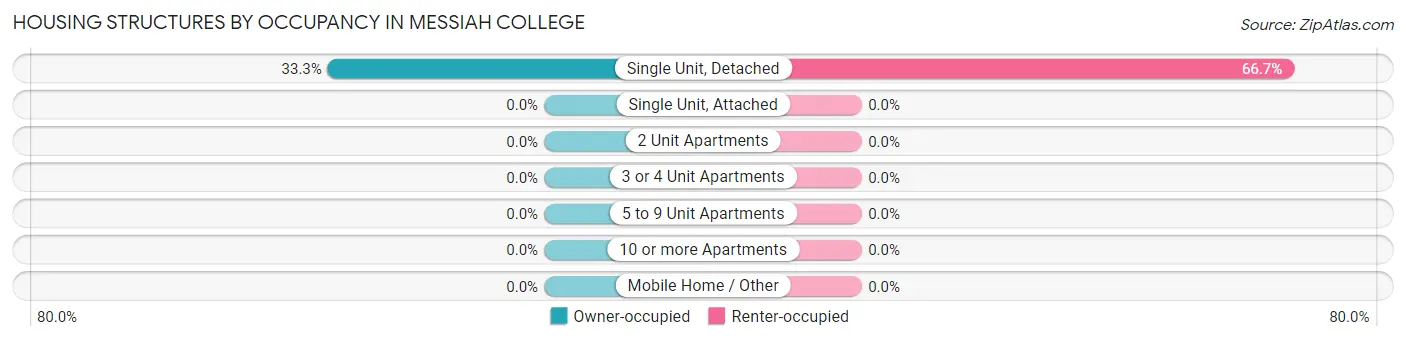
| Structure Type | Owner-occupied | Renter-occupied |
| Single Unit, Detached | 1 (33.3%) | 2 (66.7%) |
| Single Unit, Attached | 0 (0.0%) | 0 (0.0%) |
| 2 Unit Apartments | 0 (0.0%) | 0 (0.0%) |
| 3 or 4 Unit Apartments | 0 (0.0%) | 0 (0.0%) |
| 5 to 9 Unit Apartments | 0 (0.0%) | 0 (0.0%) |
| 10 or more Apartments | 0 (0.0%) | 0 (0.0%) |
| Mobile Home / Other | 0 (0.0%) | 0 (0.0%) |
| Total | 1 (33.3%) | 2 (66.7%) |
Housing Structures by Number of Rooms in Messiah College
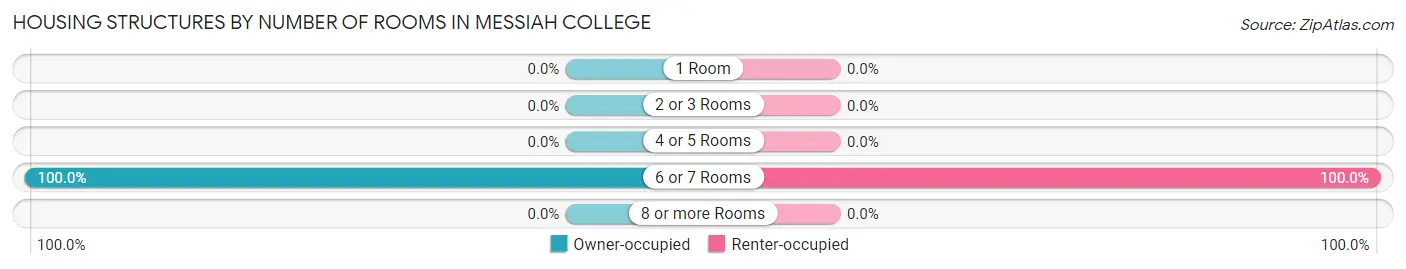
| Number of Rooms | Owner-occupied | Renter-occupied |
| 1 Room | 0 (0.0%) | 0 (0.0%) |
| 2 or 3 Rooms | 0 (0.0%) | 0 (0.0%) |
| 4 or 5 Rooms | 0 (0.0%) | 0 (0.0%) |
| 6 or 7 Rooms | 1 (100.0%) | 2 (100.0%) |
| 8 or more Rooms | 0 (0.0%) | 0 (0.0%) |
| Total | 1 (100.0%) | 2 (100.0%) |
Housing Structure by Heating Type in Messiah College
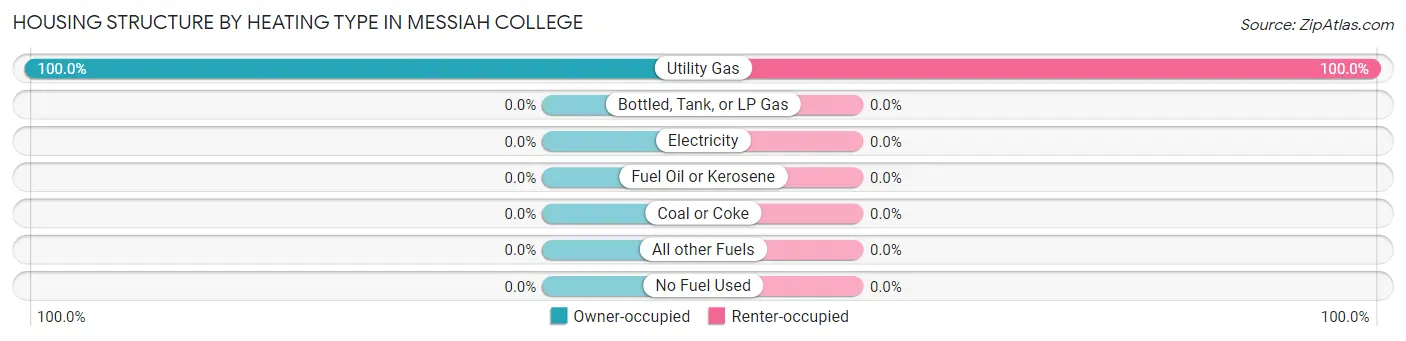
| Heating Type | Owner-occupied | Renter-occupied |
| Utility Gas | 1 (100.0%) | 2 (100.0%) |
| Bottled, Tank, or LP Gas | 0 (0.0%) | 0 (0.0%) |
| Electricity | 0 (0.0%) | 0 (0.0%) |
| Fuel Oil or Kerosene | 0 (0.0%) | 0 (0.0%) |
| Coal or Coke | 0 (0.0%) | 0 (0.0%) |
| All other Fuels | 0 (0.0%) | 0 (0.0%) |
| No Fuel Used | 0 (0.0%) | 0 (0.0%) |
| Total | 1 (100.0%) | 2 (100.0%) |
Household Vehicle Usage in Messiah College
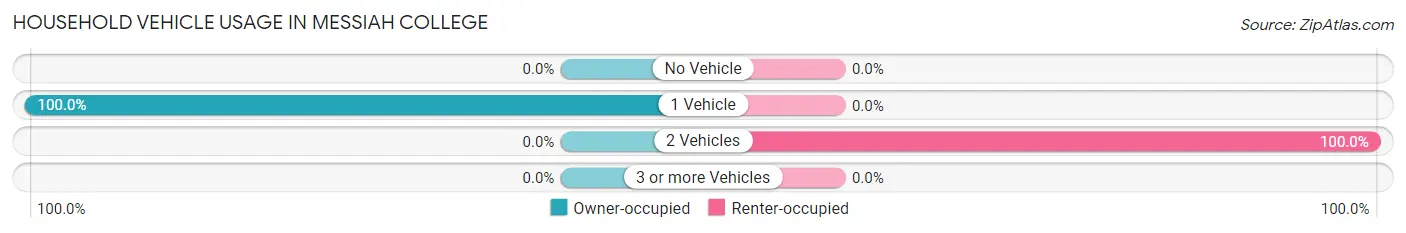
| Vehicles per Household | Owner-occupied | Renter-occupied |
| No Vehicle | 0 (0.0%) | 0 (0.0%) |
| 1 Vehicle | 1 (100.0%) | 0 (0.0%) |
| 2 Vehicles | 0 (0.0%) | 2 (100.0%) |
| 3 or more Vehicles | 0 (0.0%) | 0 (0.0%) |
| Total | 1 (100.0%) | 2 (100.0%) |
Real Estate & Mortgages in Messiah College
Real Estate and Mortgage Overview in Messiah College
| Characteristic | Without Mortgage | With Mortgage |
| Housing Units | 1 | 0 |
| Median Property Value | - | - |
| Median Household Income | - | - |
| Monthly Housing Costs | - | - |
| Real Estate Taxes | - | - |
Property Value by Mortgage Status in Messiah College
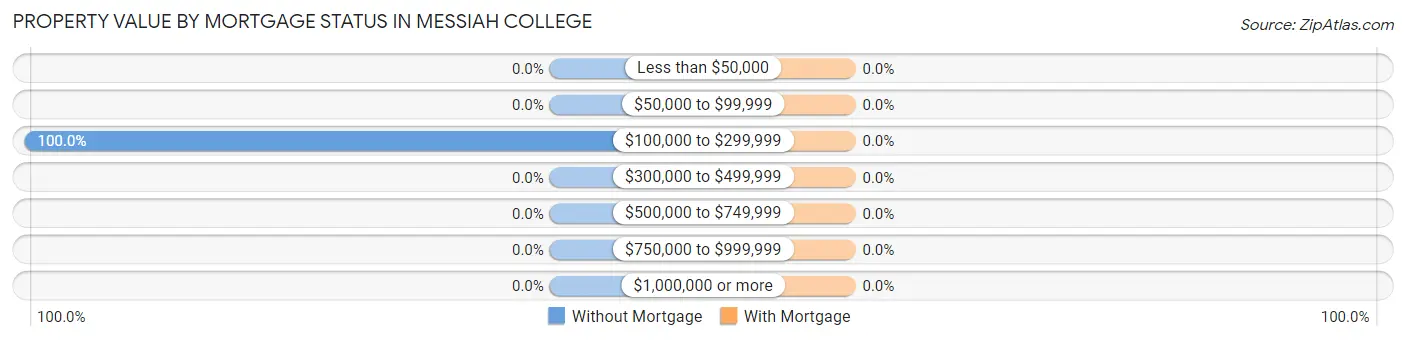
| Property Value | Without Mortgage | With Mortgage |
| Less than $50,000 | 0 (0.0%) | 0 (0.0%) |
| $50,000 to $99,999 | 0 (0.0%) | 0 (0.0%) |
| $100,000 to $299,999 | 1 (100.0%) | 0 (0.0%) |
| $300,000 to $499,999 | 0 (0.0%) | 0 (0.0%) |
| $500,000 to $749,999 | 0 (0.0%) | 0 (0.0%) |
| $750,000 to $999,999 | 0 (0.0%) | 0 (0.0%) |
| $1,000,000 or more | 0 (0.0%) | 0 (0.0%) |
| Total | 1 (100.0%) | 0 (0.0%) |
Household Income by Mortgage Status in Messiah College
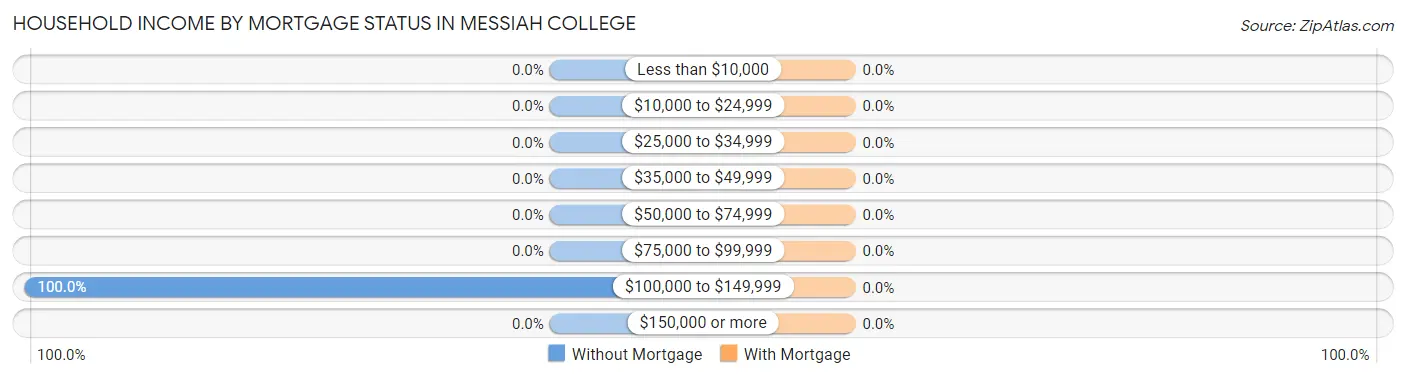
| Household Income | Without Mortgage | With Mortgage |
| Less than $10,000 | 0 (0.0%) | 0 (0.0%) |
| $10,000 to $24,999 | 0 (0.0%) | 0 (0.0%) |
| $25,000 to $34,999 | 0 (0.0%) | 0 (0.0%) |
| $35,000 to $49,999 | 0 (0.0%) | 0 (0.0%) |
| $50,000 to $74,999 | 0 (0.0%) | 0 (0.0%) |
| $75,000 to $99,999 | 0 (0.0%) | 0 (0.0%) |
| $100,000 to $149,999 | 1 (100.0%) | 0 (0.0%) |
| $150,000 or more | 0 (0.0%) | 0 (0.0%) |
| Total | 1 (100.0%) | 0 (0.0%) |
Property Value to Household Income Ratio in Messiah College
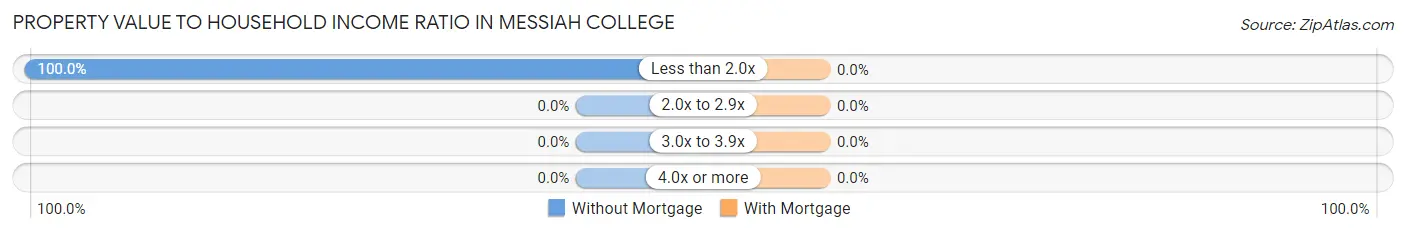
| Value-to-Income Ratio | Without Mortgage | With Mortgage |
| Less than 2.0x | 1 (100.0%) | 0 (0.0%) |
| 2.0x to 2.9x | 0 (0.0%) | 0 (0.0%) |
| 3.0x to 3.9x | 0 (0.0%) | 0 (0.0%) |
| 4.0x or more | 0 (0.0%) | 0 (0.0%) |
| Total | 1 (100.0%) | 0 (0.0%) |
Real Estate Taxes by Mortgage Status in Messiah College
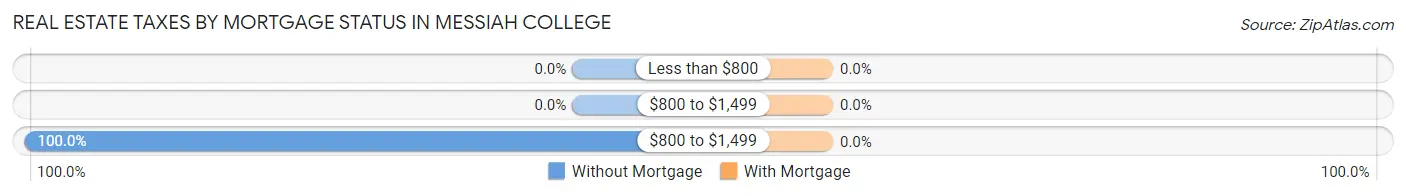
| Property Taxes | Without Mortgage | With Mortgage |
| Less than $800 | 0 (0.0%) | 0 (0.0%) |
| $800 to $1,499 | 0 (0.0%) | 0 (0.0%) |
| $800 to $1,499 | 1 (100.0%) | 0 (0.0%) |
| Total | 1 (100.0%) | 0 (0.0%) |
Health & Disability in Messiah College
Health Insurance Coverage by Age in Messiah College
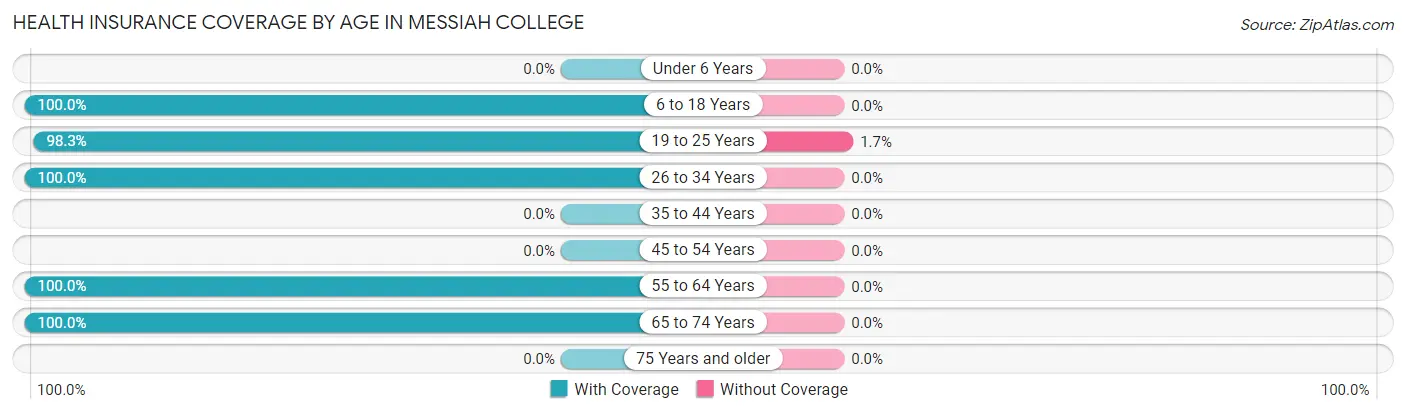
| Age Bracket | With Coverage | Without Coverage |
| Under 6 Years | 0 (0.0%) | 0 (0.0%) |
| 6 to 18 Years | 540 (100.0%) | 0 (0.0%) |
| 19 to 25 Years | 1,657 (98.3%) | 28 (1.7%) |
| 26 to 34 Years | 16 (100.0%) | 0 (0.0%) |
| 35 to 44 Years | 0 (0.0%) | 0 (0.0%) |
| 45 to 54 Years | 0 (0.0%) | 0 (0.0%) |
| 55 to 64 Years | 2 (100.0%) | 0 (0.0%) |
| 65 to 74 Years | 3 (100.0%) | 0 (0.0%) |
| 75 Years and older | 0 (0.0%) | 0 (0.0%) |
| Total | 2,218 (98.8%) | 28 (1.3%) |
Health Insurance Coverage by Citizenship Status in Messiah College
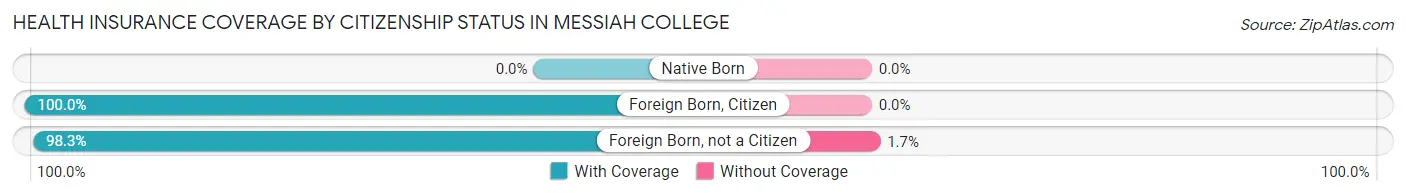
| Citizenship Status | With Coverage | Without Coverage |
| Native Born | 0 (0.0%) | 0 (0.0%) |
| Foreign Born, Citizen | 540 (100.0%) | 0 (0.0%) |
| Foreign Born, not a Citizen | 1,657 (98.3%) | 28 (1.7%) |
Health Insurance Coverage by Household Income in Messiah College
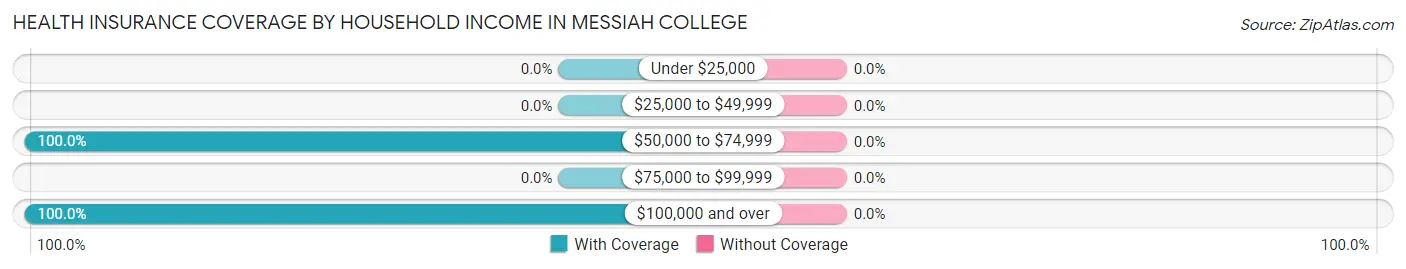
| Household Income | With Coverage | Without Coverage |
| Under $25,000 | 0 (0.0%) | 0 (0.0%) |
| $25,000 to $49,999 | 0 (0.0%) | 0 (0.0%) |
| $50,000 to $74,999 | 4 (100.0%) | 0 (0.0%) |
| $75,000 to $99,999 | 0 (0.0%) | 0 (0.0%) |
| $100,000 and over | 1 (100.0%) | 0 (0.0%) |
Public vs Private Health Insurance Coverage by Age in Messiah College
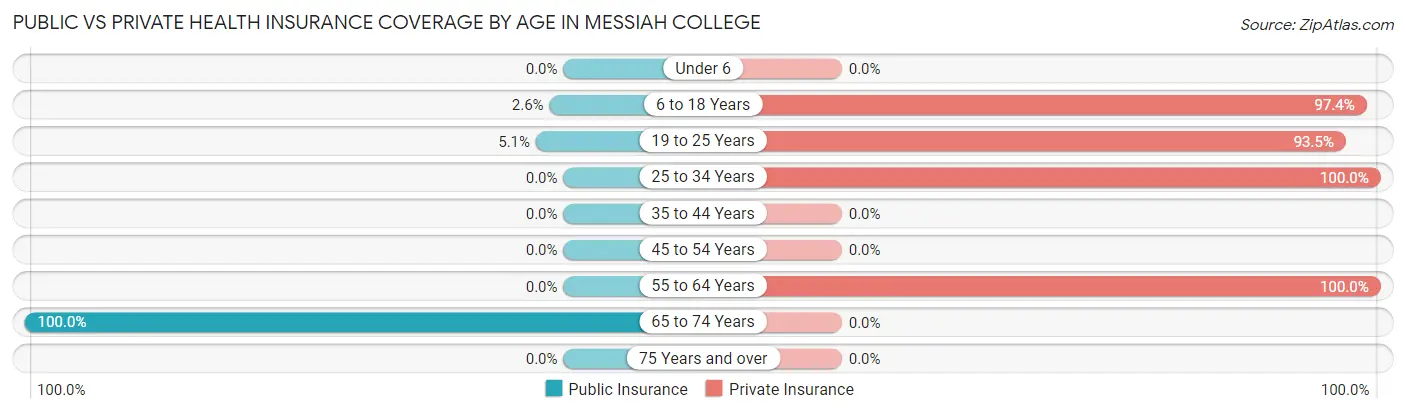
| Age Bracket | Public Insurance | Private Insurance |
| Under 6 | 0 (0.0%) | 0 (0.0%) |
| 6 to 18 Years | 14 (2.6%) | 526 (97.4%) |
| 19 to 25 Years | 86 (5.1%) | 1,576 (93.5%) |
| 25 to 34 Years | 0 (0.0%) | 16 (100.0%) |
| 35 to 44 Years | 0 (0.0%) | 0 (0.0%) |
| 45 to 54 Years | 0 (0.0%) | 0 (0.0%) |
| 55 to 64 Years | 0 (0.0%) | 2 (100.0%) |
| 65 to 74 Years | 3 (100.0%) | 0 (0.0%) |
| 75 Years and over | 0 (0.0%) | 0 (0.0%) |
| Total | 103 (4.6%) | 2,120 (94.4%) |
Disability Status by Sex by Age in Messiah College
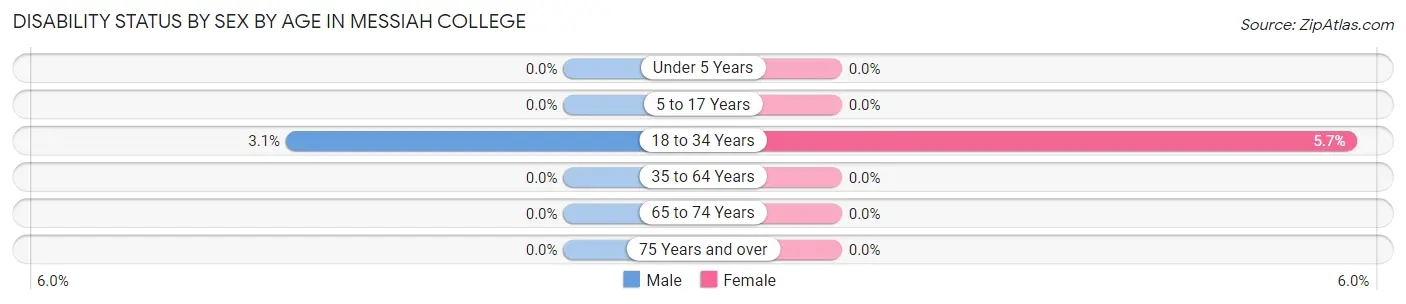
| Age Bracket | Male | Female |
| Under 5 Years | 0 (0.0%) | 0 (0.0%) |
| 5 to 17 Years | 0 (0.0%) | 0 (0.0%) |
| 18 to 34 Years | 31 (3.1%) | 71 (5.7%) |
| 35 to 64 Years | 0 (0.0%) | 0 (0.0%) |
| 65 to 74 Years | 0 (0.0%) | 0 (0.0%) |
| 75 Years and over | 0 (0.0%) | 0 (0.0%) |
Disability Class by Sex by Age in Messiah College
Disability Class: Hearing Difficulty
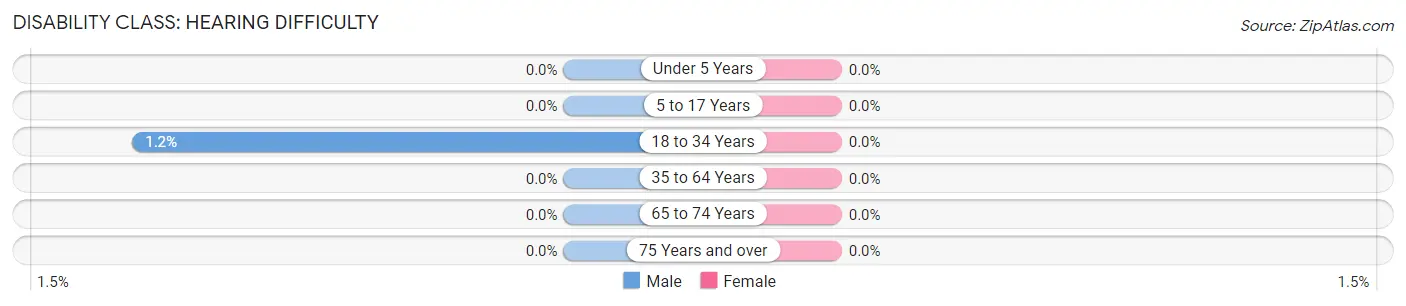
| Age Bracket | Male | Female |
| Under 5 Years | 0 (0.0%) | 0 (0.0%) |
| 5 to 17 Years | 0 (0.0%) | 0 (0.0%) |
| 18 to 34 Years | 12 (1.2%) | 0 (0.0%) |
| 35 to 64 Years | 0 (0.0%) | 0 (0.0%) |
| 65 to 74 Years | 0 (0.0%) | 0 (0.0%) |
| 75 Years and over | 0 (0.0%) | 0 (0.0%) |
Disability Class: Vision Difficulty
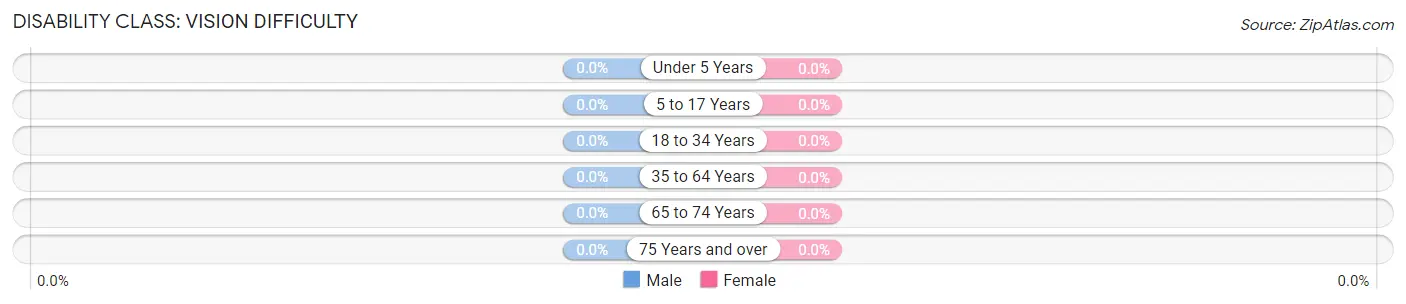
| Age Bracket | Male | Female |
| Under 5 Years | 0 (0.0%) | 0 (0.0%) |
| 5 to 17 Years | 0 (0.0%) | 0 (0.0%) |
| 18 to 34 Years | 0 (0.0%) | 0 (0.0%) |
| 35 to 64 Years | 0 (0.0%) | 0 (0.0%) |
| 65 to 74 Years | 0 (0.0%) | 0 (0.0%) |
| 75 Years and over | 0 (0.0%) | 0 (0.0%) |
Disability Class: Cognitive Difficulty
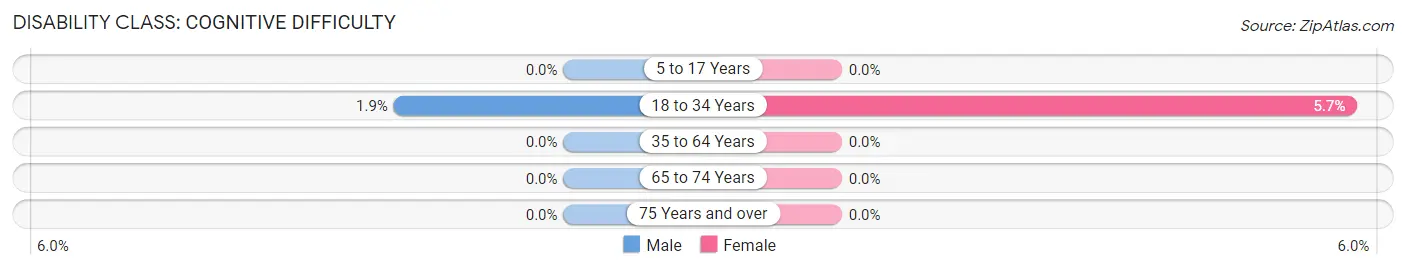
| Age Bracket | Male | Female |
| 5 to 17 Years | 0 (0.0%) | 0 (0.0%) |
| 18 to 34 Years | 19 (1.9%) | 71 (5.7%) |
| 35 to 64 Years | 0 (0.0%) | 0 (0.0%) |
| 65 to 74 Years | 0 (0.0%) | 0 (0.0%) |
| 75 Years and over | 0 (0.0%) | 0 (0.0%) |
Disability Class: Ambulatory Difficulty
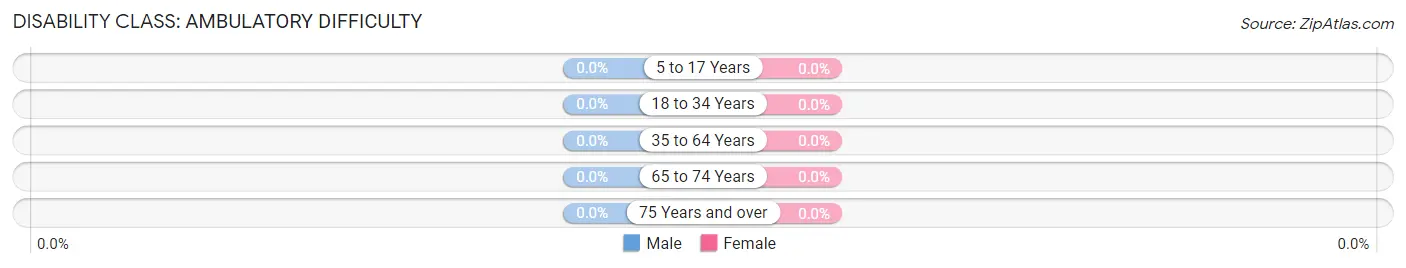
| Age Bracket | Male | Female |
| 5 to 17 Years | 0 (0.0%) | 0 (0.0%) |
| 18 to 34 Years | 0 (0.0%) | 0 (0.0%) |
| 35 to 64 Years | 0 (0.0%) | 0 (0.0%) |
| 65 to 74 Years | 0 (0.0%) | 0 (0.0%) |
| 75 Years and over | 0 (0.0%) | 0 (0.0%) |
Disability Class: Self-Care Difficulty
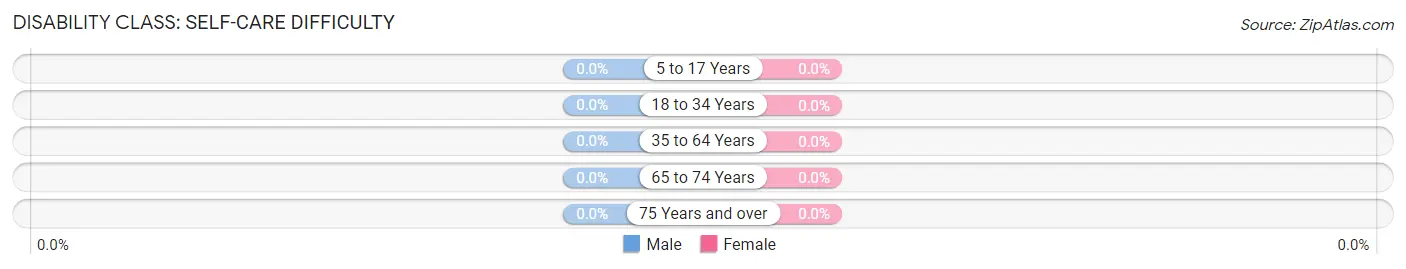
| Age Bracket | Male | Female |
| 5 to 17 Years | 0 (0.0%) | 0 (0.0%) |
| 18 to 34 Years | 0 (0.0%) | 0 (0.0%) |
| 35 to 64 Years | 0 (0.0%) | 0 (0.0%) |
| 65 to 74 Years | 0 (0.0%) | 0 (0.0%) |
| 75 Years and over | 0 (0.0%) | 0 (0.0%) |
Technology Access in Messiah College
Computing Device Access in Messiah College
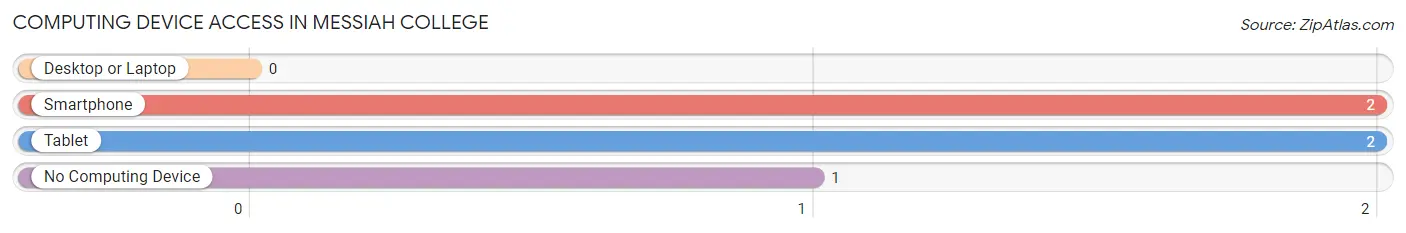
| Device Type | # Households | % Households |
| Desktop or Laptop | 0 | 0.0% |
| Smartphone | 2 | 66.7% |
| Tablet | 2 | 66.7% |
| No Computing Device | 1 | 33.3% |
| Total | 3 | 100.0% |
Internet Access in Messiah College
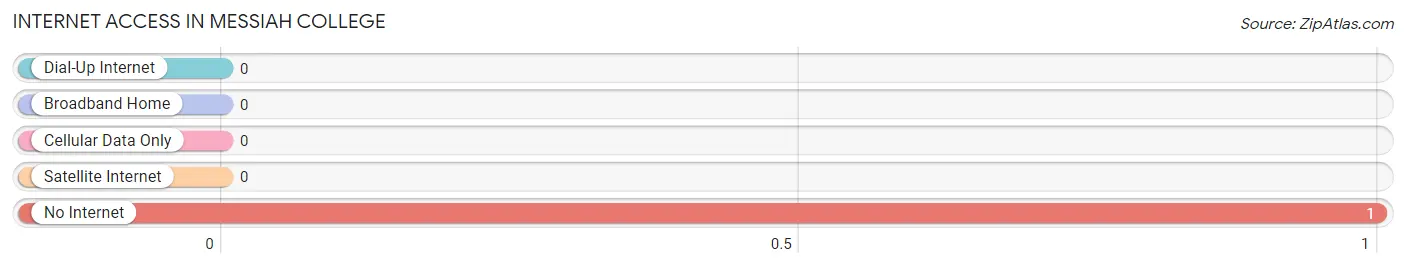
| Internet Type | # Households | % Households |
| Dial-Up Internet | 0 | 0.0% |
| Broadband Home | 0 | 0.0% |
| Cellular Data Only | 0 | 0.0% |
| Satellite Internet | 0 | 0.0% |
| No Internet | 1 | 33.3% |
| Total | 3 | 100.0% |
Messiah College Summary
Messiah College is a private Christian college located in Mechanicsburg, Pennsylvania. Founded in 1909, the college is affiliated with the Brethren in Christ Church and offers a variety of undergraduate and graduate degree programs. The college is known for its strong academic programs, vibrant campus life, and commitment to service and faith.
History
Messiah College was founded in 1909 by the Brethren in Christ Church as a Bible school. The school was originally located in Harrisburg, Pennsylvania, and was known as the Harrisburg Bible Institute. In 1937, the school moved to its current location in Mechanicsburg and was renamed Messiah Bible School. In 1960, the school was granted college status and was renamed Messiah College.
Geography
Messiah College is located in Mechanicsburg, Pennsylvania, a borough in Cumberland County. The college is situated on a 200-acre campus in the heart of the Susquehanna Valley. The college is located just minutes from Harrisburg, the state capital, and is within easy driving distance of Philadelphia, Baltimore, and Washington, D.C.
Economy
The economy of Mechanicsburg is largely driven by the presence of Messiah College. The college is the largest employer in the borough, providing jobs for over 1,000 people. The college also contributes to the local economy through its purchases of goods and services from local businesses. In addition, the college attracts students from all over the world, providing a boost to the local tourism industry.
Demographics
As of the 2010 census, the population of Mechanicsburg was 8,981. The population is largely white (90.2%), with small percentages of African Americans (3.2%), Asians (2.2%), and Hispanics (2.2%). The median household income in Mechanicsburg is $50,945, and the median age is 38.7.
Conclusion
Messiah College is a private Christian college located in Mechanicsburg, Pennsylvania. Founded in 1909, the college is affiliated with the Brethren in Christ Church and offers a variety of undergraduate and graduate degree programs. The college is known for its strong academic programs, vibrant campus life, and commitment to service and faith. The college is the largest employer in the borough, providing jobs for over 1,000 people and contributing to the local economy. The population of Mechanicsburg is largely white, with small percentages of African Americans, Asians, and Hispanics.
Common Questions
What is Per Capita Income in Messiah College?
Per Capita income in Messiah College is $23,051.
What is Income or Wage Gap in Messiah College?
Income or Wage Gap in Messiah College is 13.6%.
Women in Messiah College earn 86.4 cents for every dollar earned by a man.
What is Inequality or Gini Index in Messiah College?
Inequality or Gini Index in Messiah College is 0.20.
What is the Total Population of Messiah College?
Total Population of Messiah College is 2,246.
What is the Total Male Population of Messiah College?
Total Male Population of Messiah College is 1,007.
What is the Total Female Population of Messiah College?
Total Female Population of Messiah College is 1,239.
What is the Ratio of Males per 100 Females in Messiah College?
There are 81.28 Males per 100 Females in Messiah College.
What is the Ratio of Females per 100 Males in Messiah College?
There are 123.04 Females per 100 Males in Messiah College.
What is the Median Population Age in Messiah College?
Median Population Age in Messiah College is 19.9 Years.
What is the Average Family Size in Messiah College
Average Family Size in Messiah College is 2.0 People.
What is the Average Household Size in Messiah College
Average Household Size in Messiah College is 1.7 People.
How Large is the Labor Force in Messiah College?
There are 1,556 People in the Labor Forcein in Messiah College.
What is the Percentage of People in the Labor Force in Messiah College?
69.3% of People are in the Labor Force in Messiah College.
What is the Unemployment Rate in Messiah College?
Unemployment Rate in Messiah College is 5.9%.