Arcadia University, PA Map & Demographics
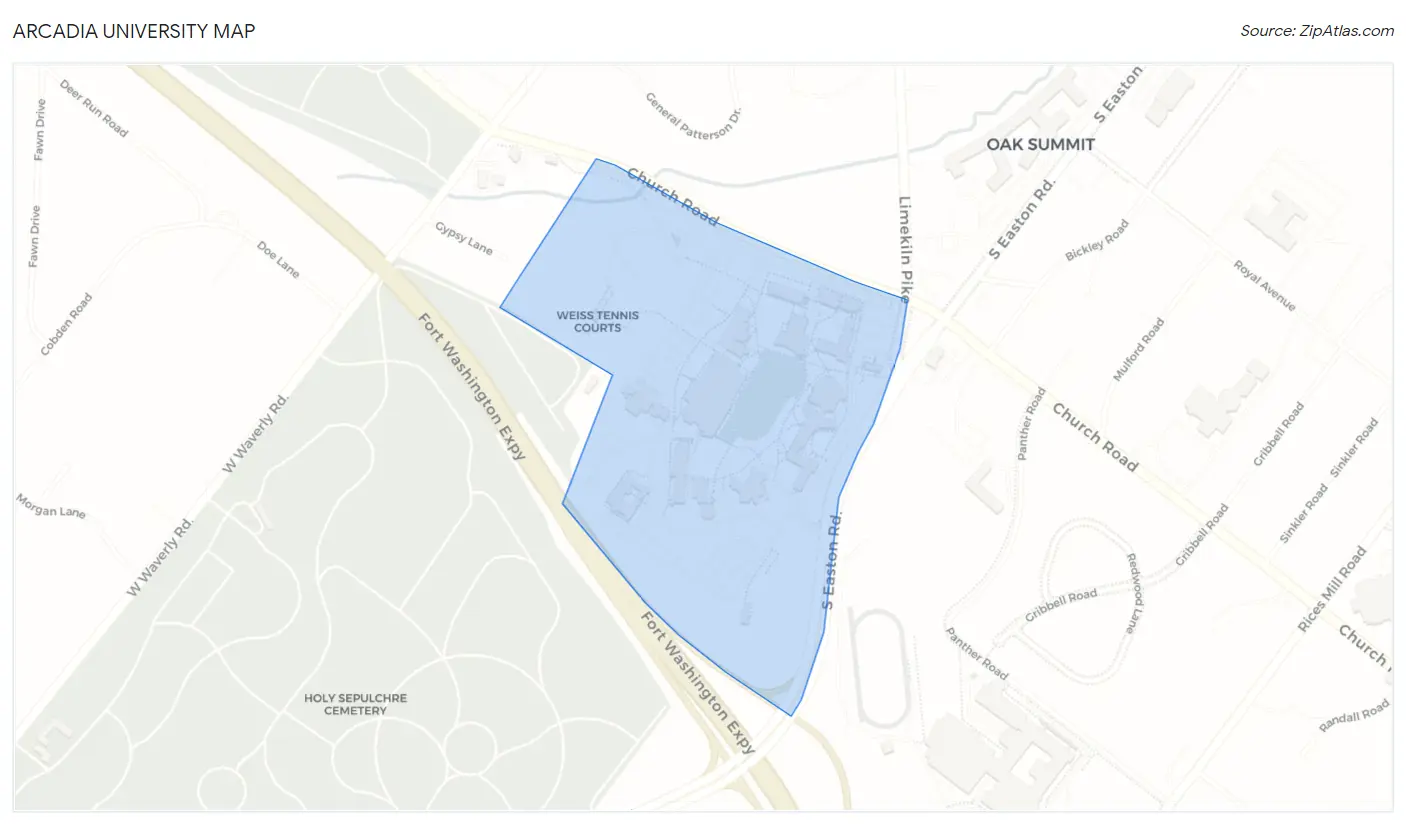
Arcadia University Map
Arcadia University Overview
$2,563
PER CAPITA INCOME
1.3%
WAGE / INCOME GAP [ % ]
98.7¢/ $1
WAGE / INCOME GAP [ $ ]
672
TOTAL POPULATION
234
MALE POPULATION
438
FEMALE POPULATION
53.42
MALES / 100 FEMALES
187.18
FEMALES / 100 MALES
19.6
MEDIAN AGE
299
LABOR FORCE [ PEOPLE ]
44.5%
PERCENT IN LABOR FORCE
2.7%
UNEMPLOYMENT RATE
Income in Arcadia University
Income Overview in Arcadia University
| Characteristic | Number | Measure |
| Per Capita Income | 672 | $2,563 |
| Median Family Income | 0 | $0 |
| Mean Family Income | 0 | $0 |
| Median Household Income | 0 | $0 |
| Mean Household Income | 0 | $0 |
| Income Deficit | 0 | $0 |
| Wage / Income Gap (%) | 672 | 1.34% |
| Wage / Income Gap ($) | 672 | 98.66¢ per $1 |
| Gini / Inequality Index | 672 | 0.00 |
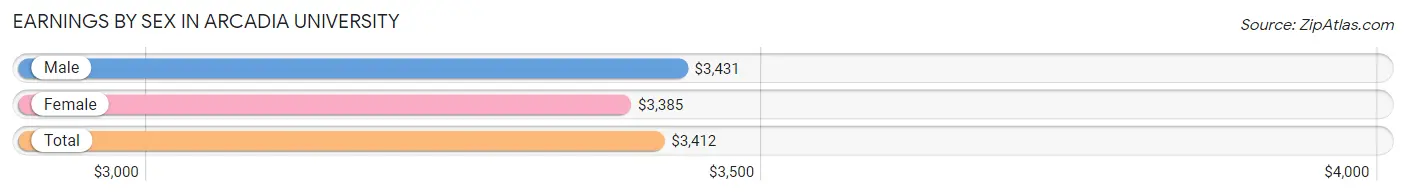
Earnings by Sex in Arcadia University
Average Earnings in Arcadia University are $3,412, $3,431 for men and $3,385 for women, a difference of 1.3%.
| Sex | Number | Average Earnings |
| Male | 155 (40.0%) | $3,431 |
| Female | 233 (60.1%) | $3,385 |
| Total | 388 (100.0%) | $3,412 |
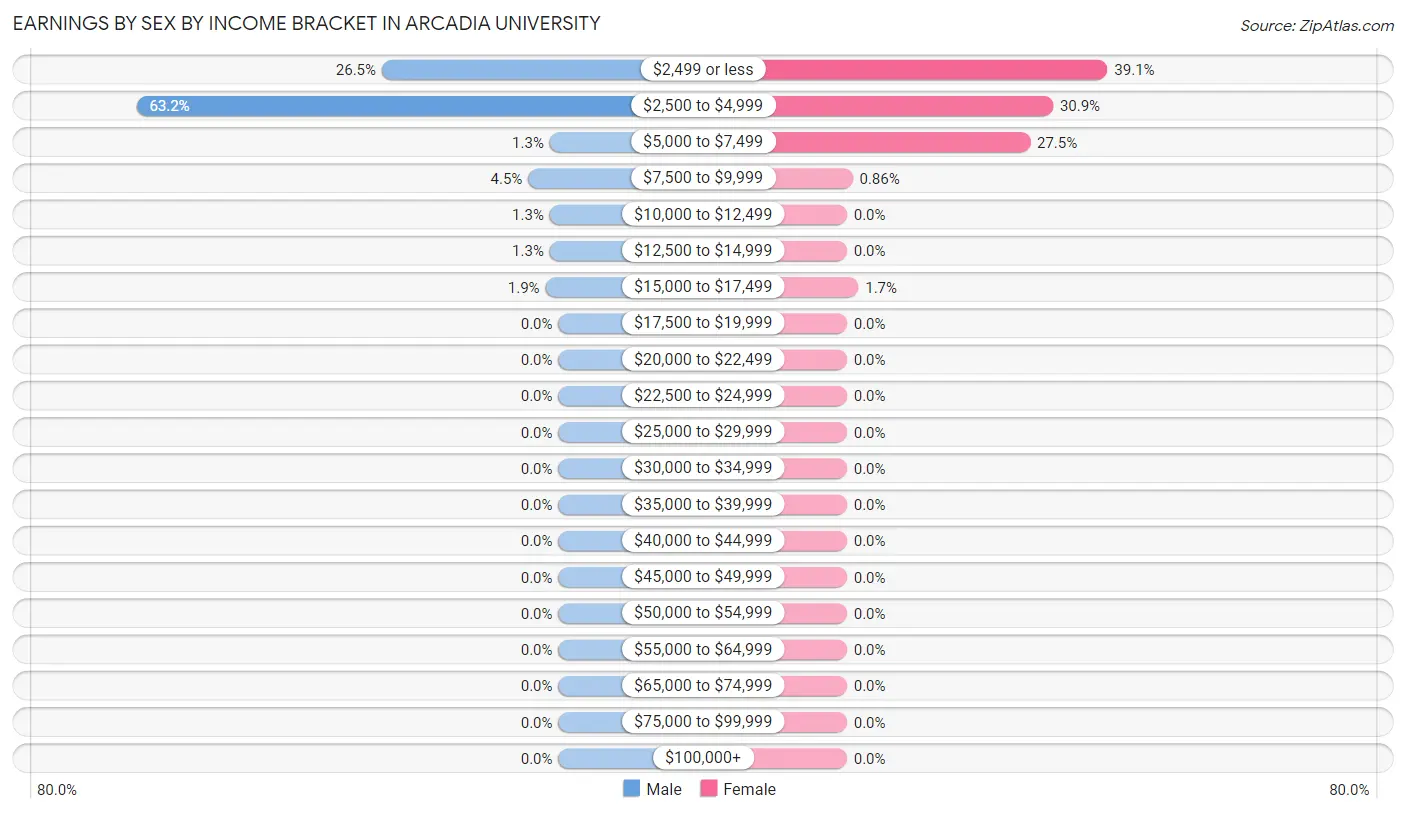
Earnings by Sex by Income Bracket in Arcadia University
The most common earnings brackets in Arcadia University are $2,500 to $4,999 for men (98 | 63.2%) and $2,499 or less for women (91 | 39.1%).
| Income | Male | Female |
| $2,499 or less | 41 (26.5%) | 91 (39.1%) |
| $2,500 to $4,999 | 98 (63.2%) | 72 (30.9%) |
| $5,000 to $7,499 | 2 (1.3%) | 64 (27.5%) |
| $7,500 to $9,999 | 7 (4.5%) | 2 (0.9%) |
| $10,000 to $12,499 | 2 (1.3%) | 0 (0.0%) |
| $12,500 to $14,999 | 2 (1.3%) | 0 (0.0%) |
| $15,000 to $17,499 | 3 (1.9%) | 4 (1.7%) |
| $17,500 to $19,999 | 0 (0.0%) | 0 (0.0%) |
| $20,000 to $22,499 | 0 (0.0%) | 0 (0.0%) |
| $22,500 to $24,999 | 0 (0.0%) | 0 (0.0%) |
| $25,000 to $29,999 | 0 (0.0%) | 0 (0.0%) |
| $30,000 to $34,999 | 0 (0.0%) | 0 (0.0%) |
| $35,000 to $39,999 | 0 (0.0%) | 0 (0.0%) |
| $40,000 to $44,999 | 0 (0.0%) | 0 (0.0%) |
| $45,000 to $49,999 | 0 (0.0%) | 0 (0.0%) |
| $50,000 to $54,999 | 0 (0.0%) | 0 (0.0%) |
| $55,000 to $64,999 | 0 (0.0%) | 0 (0.0%) |
| $65,000 to $74,999 | 0 (0.0%) | 0 (0.0%) |
| $75,000 to $99,999 | 0 (0.0%) | 0 (0.0%) |
| $100,000+ | 0 (0.0%) | 0 (0.0%) |
| Total | 155 (100.0%) | 233 (100.0%) |
Earnings by Sex by Educational Attainment in Arcadia University
| Educational Attainment | Male Income | Female Income |
| Less than High School | - | - |
| High School Diploma | - | - |
| College or Associate's Degree | - | - |
| Bachelor's Degree | - | - |
| Graduate Degree | - | - |
| Total | - | - |
Family Income in Arcadia University
Family Income Brackets in Arcadia University
| Income Bracket | # Families | % Families |
| Less than $10,000 | 0 | 0.0% |
| $10,000 to $14,999 | 0 | 0.0% |
| $15,000 to $24,999 | 0 | 0.0% |
| $25,000 to $34,999 | 0 | 0.0% |
| $35,000 to $49,999 | 0 | 0.0% |
| $50,000 to $74,999 | 0 | 0.0% |
| $75,000 to $99,999 | 0 | 0.0% |
| $100,000 to $149,999 | 0 | 0.0% |
| $150,000 to $199,999 | 0 | 0.0% |
| $200,000+ | 0 | 0.0% |
Family Income by Famaliy Size in Arcadia University
| Income Bracket | # Families | Median Income |
| 2-Person Families | 0 (0.0%) | $0 |
| 3-Person Families | 0 (0.0%) | $0 |
| 4-Person Families | 0 (0.0%) | $0 |
| 5-Person Families | 0 (0.0%) | $0 |
| 6-Person Families | 0 (0.0%) | $0 |
| 7+ Person Families | 0 (0.0%) | $0 |
| Total | 0 (0.0%) | $0 |
Family Income by Number of Earners in Arcadia University
| Number of Earners | # Families | Median Income |
| No Earners | 0 (0.0%) | $0 |
| 1 Earner | 0 (0.0%) | $0 |
| 2 Earners | 0 (0.0%) | $0 |
| 3+ Earners | 0 (0.0%) | $0 |
| Total | 0 (0.0%) | $0 |
Household Income in Arcadia University
Household Income Brackets in Arcadia University
| Income Bracket | # Households | % Households |
| Less than $10,000 | 0 | 0.0% |
| $10,000 to $14,999 | 0 | 0.0% |
| $15,000 to $24,999 | 0 | 0.0% |
| $25,000 to $34,999 | 0 | 0.0% |
| $35,000 to $49,999 | 0 | 0.0% |
| $50,000 to $74,999 | 0 | 0.0% |
| $75,000 to $99,999 | 0 | 0.0% |
| $100,000 to $149,999 | 0 | 0.0% |
| $150,000 to $199,999 | 0 | 0.0% |
| $200,000+ | 0 | 0.0% |
Household Income by Householder Age in Arcadia University
| Income Bracket | # Households | Median Income |
| 15 to 24 Years | 0 (0.0%) | $0 |
| 25 to 44 Years | 0 (0.0%) | $0 |
| 45 to 64 Years | 0 (0.0%) | $0 |
| 65+ Years | 0 (0.0%) | $0 |
| Total | 0 (0.0%) | $0 |
Poverty in Arcadia University
Income Below Poverty by Sex and Age in Arcadia University
| Age Bracket | Male | Female |
| Under 5 Years | 0 (0.0%) | 0 (0.0%) |
| 5 Years | 0 (0.0%) | 0 (0.0%) |
| 6 to 11 Years | 0 (0.0%) | 0 (0.0%) |
| 12 to 14 Years | 0 (0.0%) | 0 (0.0%) |
| 15 Years | 0 (0.0%) | 0 (0.0%) |
| 16 and 17 Years | 0 (0.0%) | 0 (0.0%) |
| 18 to 24 Years | 0 (0.0%) | 0 (0.0%) |
| 25 to 34 Years | 0 (0.0%) | 0 (0.0%) |
| 35 to 44 Years | 0 (0.0%) | 0 (0.0%) |
| 45 to 54 Years | 0 (0.0%) | 0 (0.0%) |
| 55 to 64 Years | 0 (0.0%) | 0 (0.0%) |
| 65 to 74 Years | 0 (0.0%) | 0 (0.0%) |
| 75 Years and over | 0 (0.0%) | 0 (0.0%) |
| Total | 0 (0.0%) | 0 (0.0%) |
Income Above Poverty by Sex and Age in Arcadia University
| Age Bracket | Male | Female |
| Under 5 Years | 0 (0.0%) | 0 (0.0%) |
| 5 Years | 0 (0.0%) | 0 (0.0%) |
| 6 to 11 Years | 0 (0.0%) | 0 (0.0%) |
| 12 to 14 Years | 0 (0.0%) | 0 (0.0%) |
| 15 Years | 0 (0.0%) | 0 (0.0%) |
| 16 and 17 Years | 0 (0.0%) | 0 (0.0%) |
| 18 to 24 Years | 0 (0.0%) | 0 (0.0%) |
| 25 to 34 Years | 0 (0.0%) | 0 (0.0%) |
| 35 to 44 Years | 0 (0.0%) | 0 (0.0%) |
| 45 to 54 Years | 0 (0.0%) | 0 (0.0%) |
| 55 to 64 Years | 0 (0.0%) | 0 (0.0%) |
| 65 to 74 Years | 0 (0.0%) | 0 (0.0%) |
| 75 Years and over | 0 (0.0%) | 0 (0.0%) |
| Total | 0 (0.0%) | 0 (0.0%) |
Income Below Poverty Among Married-Couple Families in Arcadia University
| Children | Above Poverty | Below Poverty |
| No Children | 0 (0.0%) | 0 (0.0%) |
| 1 or 2 Children | 0 (0.0%) | 0 (0.0%) |
| 3 or 4 Children | 0 (0.0%) | 0 (0.0%) |
| 5 or more Children | 0 (0.0%) | 0 (0.0%) |
| Total | 0 (0.0%) | 0 (0.0%) |
Income Below Poverty Among Single-Parent Households in Arcadia University
| Children | Single Father | Single Mother |
| No Children | 0 (0.0%) | 0 (0.0%) |
| 1 or 2 Children | 0 (0.0%) | 0 (0.0%) |
| 3 or 4 Children | 0 (0.0%) | 0 (0.0%) |
| 5 or more Children | 0 (0.0%) | 0 (0.0%) |
| Total | 0 (0.0%) | 0 (0.0%) |
Income Below Poverty Among Married-Couple vs Single-Parent Households in Arcadia University
| Children | Married-Couple Families | Single-Parent Households |
| No Children | 0 (0.0%) | 0 (0.0%) |
| 1 or 2 Children | 0 (0.0%) | 0 (0.0%) |
| 3 or 4 Children | 0 (0.0%) | 0 (0.0%) |
| 5 or more Children | 0 (0.0%) | 0 (0.0%) |
| Total | 0 (0.0%) | 0 (0.0%) |
Race in Arcadia University
The most populous races in Arcadia University are White / Caucasian (525 | 78.1%), Black / African American (60 | 8.9%), and Hispanic or Latino (51 | 7.6%).
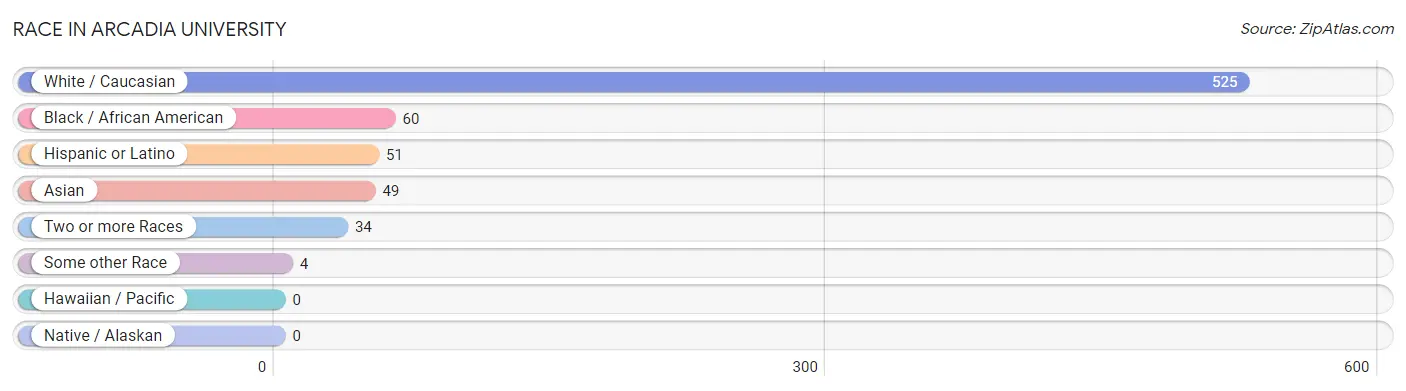
| Race | # Population | % Population |
| Asian | 49 | 7.3% |
| Black / African American | 60 | 8.9% |
| Hawaiian / Pacific | 0 | 0.0% |
| Hispanic or Latino | 51 | 7.6% |
| Native / Alaskan | 0 | 0.0% |
| White / Caucasian | 525 | 78.1% |
| Two or more Races | 34 | 5.1% |
| Some other Race | 4 | 0.6% |
| Total | 672 | 100.0% |
Ancestry in Arcadia University
The most populous ancestries reported in Arcadia University are Italian (73 | 10.9%), Irish (71 | 10.6%), English (50 | 7.4%), German (47 | 7.0%), and Indian (Asian) (39 | 5.8%), together accounting for 41.7% of all Arcadia University residents.
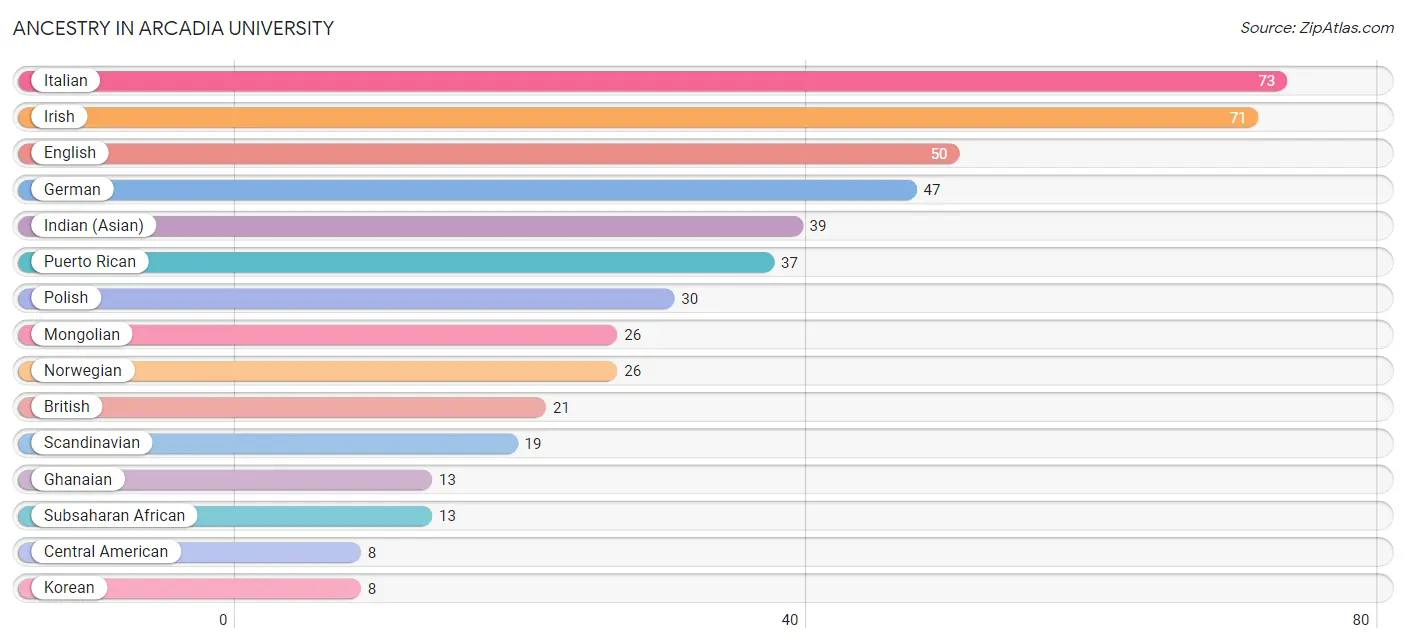
| Ancestry | # Population | % Population |
| Arab | 4 | 0.6% |
| British | 21 | 3.1% |
| Central American | 8 | 1.2% |
| Egyptian | 4 | 0.6% |
| English | 50 | 7.4% |
| German | 47 | 7.0% |
| Ghanaian | 13 | 1.9% |
| Greek | 6 | 0.9% |
| Indian (Asian) | 39 | 5.8% |
| Irish | 71 | 10.6% |
| Italian | 73 | 10.9% |
| Korean | 8 | 1.2% |
| Mongolian | 26 | 3.9% |
| Norwegian | 26 | 3.9% |
| Panamanian | 8 | 1.2% |
| Polish | 30 | 4.5% |
| Puerto Rican | 37 | 5.5% |
| Romanian | 3 | 0.4% |
| Scandinavian | 19 | 2.8% |
| Slovak | 3 | 0.4% |
| Subsaharan African | 13 | 1.9% | View All 21 Rows |
Immigrants in Arcadia University
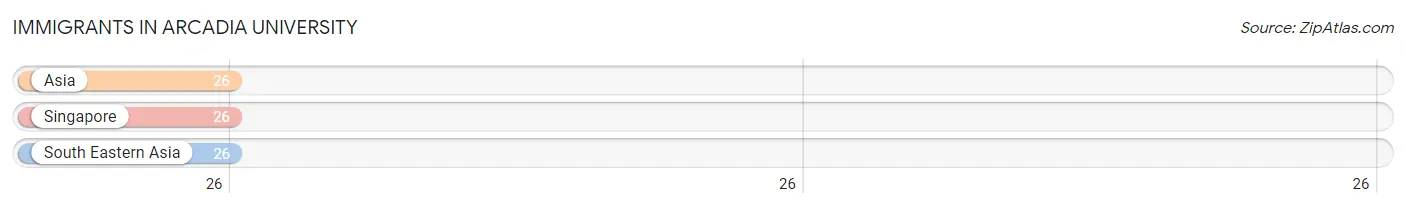
The most numerous immigrant groups reported in Arcadia University came from Asia (26 | 3.9%), Singapore (26 | 3.9%), and South Eastern Asia (26 | 3.9%), together accounting for 11.6% of all Arcadia University residents.
| Immigration Origin | # Population | % Population |
| Asia | 26 | 3.9% |
| Singapore | 26 | 3.9% |
| South Eastern Asia | 26 | 3.9% | View All 3 Rows |
Sex and Age in Arcadia University
Sex and Age in Arcadia University
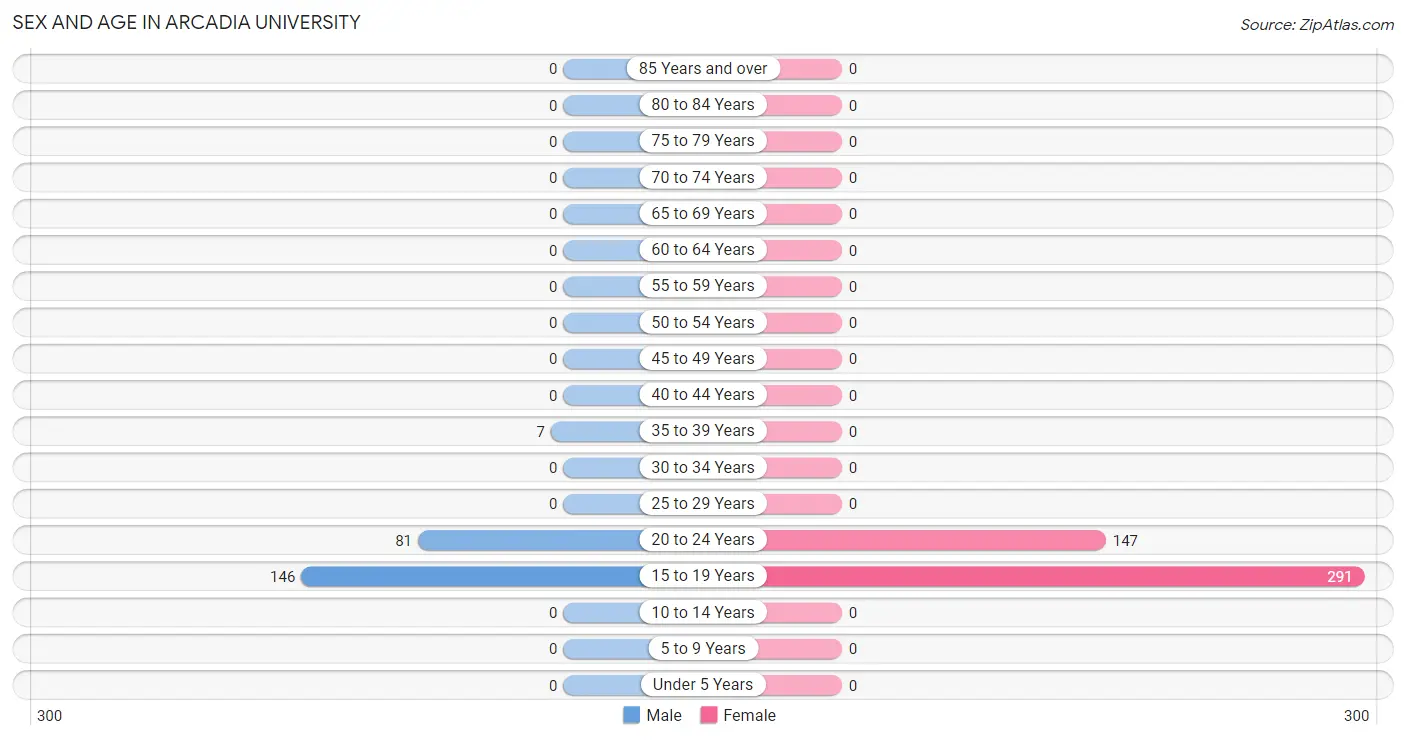
The most populous age groups in Arcadia University are 15 to 19 Years (146 | 62.4%) for men and 15 to 19 Years (291 | 66.4%) for women.
| Age Bracket | Male | Female |
| Under 5 Years | 0 (0.0%) | 0 (0.0%) |
| 5 to 9 Years | 0 (0.0%) | 0 (0.0%) |
| 10 to 14 Years | 0 (0.0%) | 0 (0.0%) |
| 15 to 19 Years | 146 (62.4%) | 291 (66.4%) |
| 20 to 24 Years | 81 (34.6%) | 147 (33.6%) |
| 25 to 29 Years | 0 (0.0%) | 0 (0.0%) |
| 30 to 34 Years | 0 (0.0%) | 0 (0.0%) |
| 35 to 39 Years | 7 (3.0%) | 0 (0.0%) |
| 40 to 44 Years | 0 (0.0%) | 0 (0.0%) |
| 45 to 49 Years | 0 (0.0%) | 0 (0.0%) |
| 50 to 54 Years | 0 (0.0%) | 0 (0.0%) |
| 55 to 59 Years | 0 (0.0%) | 0 (0.0%) |
| 60 to 64 Years | 0 (0.0%) | 0 (0.0%) |
| 65 to 69 Years | 0 (0.0%) | 0 (0.0%) |
| 70 to 74 Years | 0 (0.0%) | 0 (0.0%) |
| 75 to 79 Years | 0 (0.0%) | 0 (0.0%) |
| 80 to 84 Years | 0 (0.0%) | 0 (0.0%) |
| 85 Years and over | 0 (0.0%) | 0 (0.0%) |
| Total | 234 (100.0%) | 438 (100.0%) |
Families and Households in Arcadia University
Median Family Size in Arcadia University
| Family Type | # Families | Family Size |
| Married-Couple | 0 (0.0%) | - |
| Single Male/Father | 0 (0.0%) | - |
| Single Female/Mother | 0 (0.0%) | - |
| Total Families | 0 (0.0%) | - |
Median Household Size in Arcadia University
| Household Type | # Households | Household Size |
| Married-Couple | 0 (0.0%) | - |
| Single Male/Father | 0 (0.0%) | - |
| Single Female/Mother | 0 (0.0%) | - |
| Non-family | 0 (0.0%) | - |
| Total Households | 0 (0.0%) | - |
Household Size by Marriage Status in Arcadia University
| Household Size | Family Households | Nonfamily Households |
| 1-Person Households | - | 0 (0.0%) |
| 2-Person Households | 0 (0.0%) | 0 (0.0%) |
| 3-Person Households | 0 (0.0%) | 0 (0.0%) |
| 4-Person Households | 0 (0.0%) | 0 (0.0%) |
| 5-Person Households | 0 (0.0%) | 0 (0.0%) |
| 6-Person Households | 0 (0.0%) | 0 (0.0%) |
| 7+ Person Households | 0 (0.0%) | 0 (0.0%) |
| Total | 0 (0.0%) | 0 (0.0%) |
Female Fertility in Arcadia University
Fertility by Age in Arcadia University
| Age Bracket | Women with Births | Births / 1,000 Women |
| 15 to 19 years | 0 (0.0%) | 0.0 |
| 20 to 34 years | 0 (0.0%) | 0.0 |
| 35 to 50 years | 0 (0.0%) | 0.0 |
| Total | 0 (0.0%) | 0.0 |
Fertility by Age by Marriage Status in Arcadia University
| Age Bracket | Married | Unmarried |
| 15 to 19 years | 0 (0.0%) | 0 (0.0%) |
| 20 to 34 years | 0 (0.0%) | 0 (0.0%) |
| 35 to 50 years | 0 (0.0%) | 0 (0.0%) |
| Total | 0 (0.0%) | 0 (0.0%) |
Fertility by Education in Arcadia University
| Educational Attainment | Women with Births | Births / 1,000 Women |
| Less than High School | 0 (0.0%) | 0.0 |
| High School Diploma | 0 (0.0%) | 0.0 |
| College or Associate's Degree | 0 (0.0%) | 0.0 |
| Bachelor's Degree | 0 (0.0%) | 0.0 |
| Graduate Degree | 0 (0.0%) | 0.0 |
| Total | 0 (0.0%) | 0.0 |
Fertility by Education by Marriage Status in Arcadia University
| Educational Attainment | Married | Unmarried |
| Less than High School | 0 (0.0%) | 0 (0.0%) |
| High School Diploma | 0 (0.0%) | 0 (0.0%) |
| College or Associate's Degree | 0 (0.0%) | 0 (0.0%) |
| Bachelor's Degree | 0 (0.0%) | 0 (0.0%) |
| Graduate Degree | 0 (0.0%) | 0 (0.0%) |
| Total | 0 (0.0%) | 0 (0.0%) |
Employment Characteristics in Arcadia University
Employment by Class of Employer in Arcadia University
Among the 277 employed individuals in Arcadia University, private company employees (196 | 70.8%), not-for-profit organizations (69 | 24.9%), and state government employees (10 | 3.6%) make up the most common classes of employment.
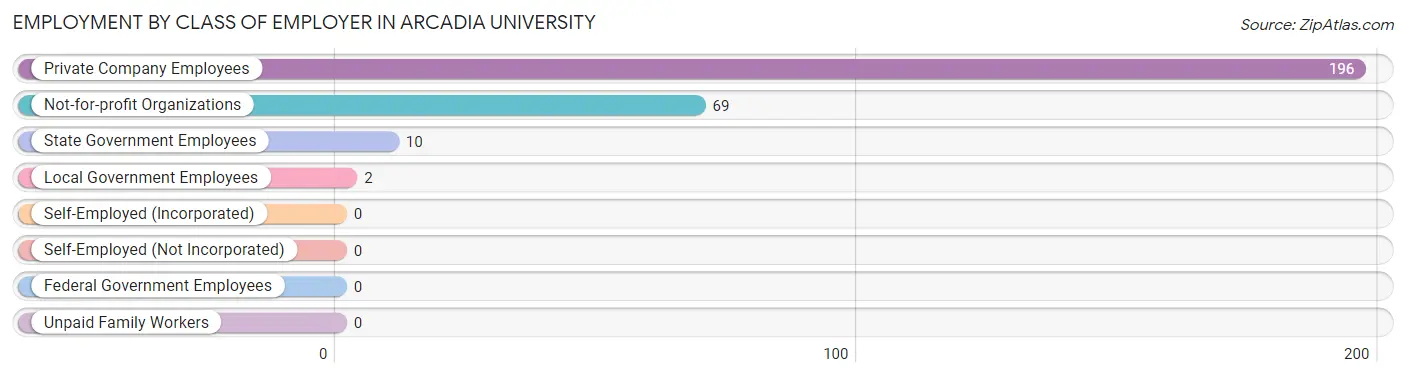
| Employer Class | # Employees | % Employees |
| Private Company Employees | 196 | 70.8% |
| Self-Employed (Incorporated) | 0 | 0.0% |
| Self-Employed (Not Incorporated) | 0 | 0.0% |
| Not-for-profit Organizations | 69 | 24.9% |
| Local Government Employees | 2 | 0.7% |
| State Government Employees | 10 | 3.6% |
| Federal Government Employees | 0 | 0.0% |
| Unpaid Family Workers | 0 | 0.0% |
| Total | 277 | 100.0% |
Employment Status by Age in Arcadia University
According to the labor force statistics for Arcadia University, out of the total population over 16 years of age (672), 44.5% or 299 individuals are in the labor force, with 2.7% or 8 of them unemployed. The age group with the highest labor force participation rate is 20 to 24 years, with 79.8% or 182 individuals in the labor force. Within the labor force, the 16 to 19 years age range has the highest percentage of unemployed individuals, with 6.8% or 8 of them being unemployed.
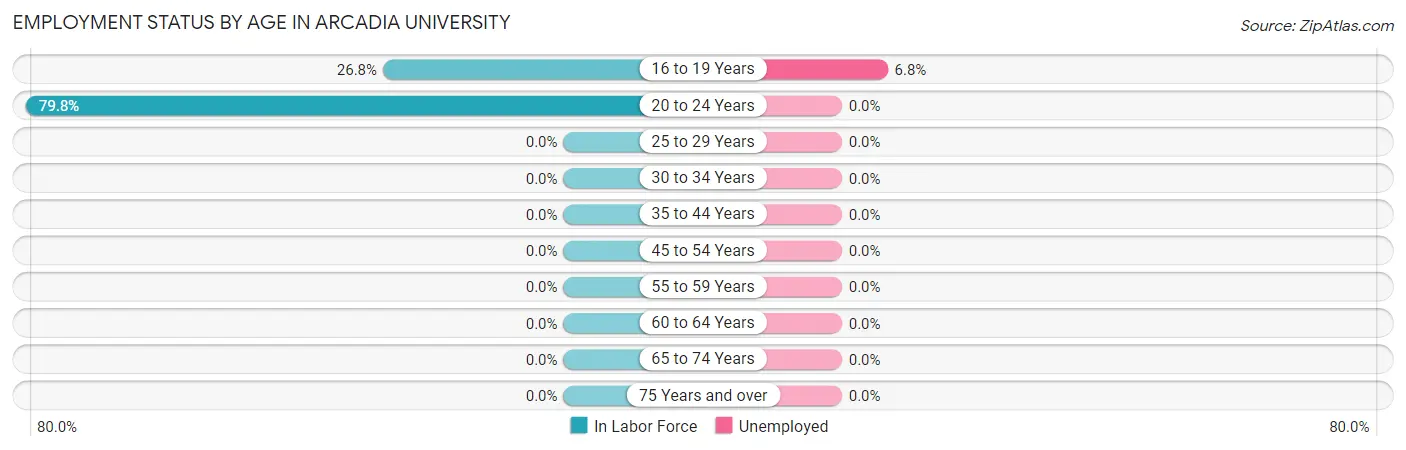
| Age Bracket | In Labor Force | Unemployed |
| 16 to 19 Years | 117 (26.8%) | 8 (6.8%) |
| 20 to 24 Years | 182 (79.8%) | 0 (0.0%) |
| 25 to 29 Years | 0 (0.0%) | 0 (0.0%) |
| 30 to 34 Years | 0 (0.0%) | 0 (0.0%) |
| 35 to 44 Years | 0 (0.0%) | 0 (0.0%) |
| 45 to 54 Years | 0 (0.0%) | 0 (0.0%) |
| 55 to 59 Years | 0 (0.0%) | 0 (0.0%) |
| 60 to 64 Years | 0 (0.0%) | 0 (0.0%) |
| 65 to 74 Years | 0 (0.0%) | 0 (0.0%) |
| 75 Years and over | 0 (0.0%) | 0 (0.0%) |
| Total | 299 (44.5%) | 8 (2.7%) |
Employment Status by Educational Attainment in Arcadia University

| Educational Attainment | In Labor Force | Unemployed |
| Less than High School | 0 (0.0%) | 0 (0.0%) |
| High School Diploma | 0 (0.0%) | 0 (0.0%) |
| College / Associate Degree | 0 (0.0%) | 0 (0.0%) |
| Bachelor's Degree or higher | 0 (0.0%) | 0 (0.0%) |
| Total | 0 (0.0%) | 0 (0.0%) |
Employment Occupations by Sex in Arcadia University
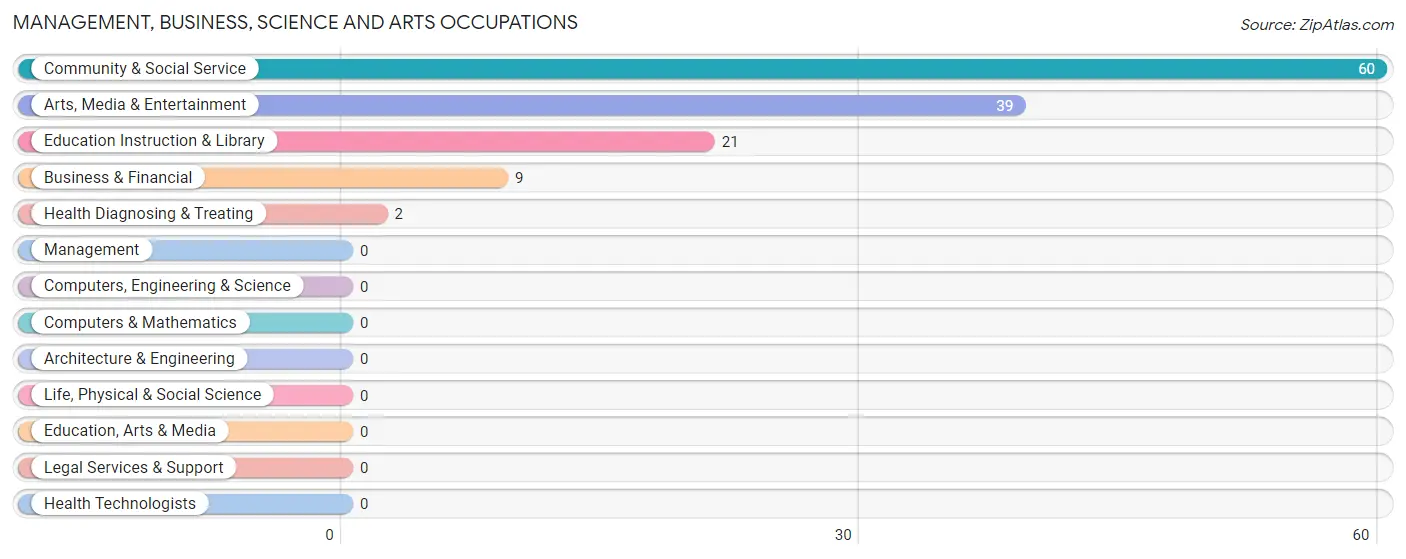
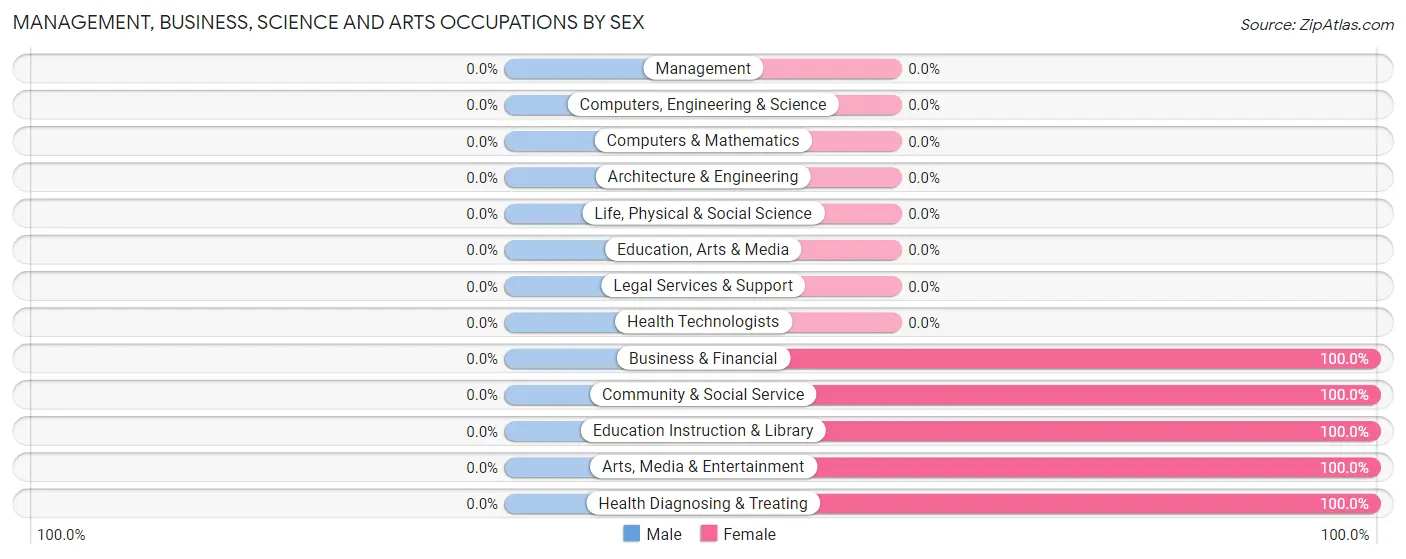
Management, Business, Science and Arts Occupations
The most common Management, Business, Science and Arts occupations in Arcadia University are Community & Social Service (60 | 20.6%), Arts, Media & Entertainment (39 | 13.4%), Education Instruction & Library (21 | 7.2%), Business & Financial (9 | 3.1%), and Health Diagnosing & Treating (2 | 0.7%).
Management, Business, Science and Arts Occupations by Sex
| Occupation | Male | Female |
| Management | 0 (0.0%) | 0 (0.0%) |
| Business & Financial | 0 (0.0%) | 9 (100.0%) |
| Computers, Engineering & Science | 0 (0.0%) | 0 (0.0%) |
| Computers & Mathematics | 0 (0.0%) | 0 (0.0%) |
| Architecture & Engineering | 0 (0.0%) | 0 (0.0%) |
| Life, Physical & Social Science | 0 (0.0%) | 0 (0.0%) |
| Community & Social Service | 0 (0.0%) | 60 (100.0%) |
| Education, Arts & Media | 0 (0.0%) | 0 (0.0%) |
| Legal Services & Support | 0 (0.0%) | 0 (0.0%) |
| Education Instruction & Library | 0 (0.0%) | 21 (100.0%) |
| Arts, Media & Entertainment | 0 (0.0%) | 39 (100.0%) |
| Health Diagnosing & Treating | 0 (0.0%) | 2 (100.0%) |
| Health Technologists | 0 (0.0%) | 0 (0.0%) |
| Total (Category) | 0 (0.0%) | 71 (100.0%) |
| Total (Overall) | 112 (38.5%) | 179 (61.5%) |
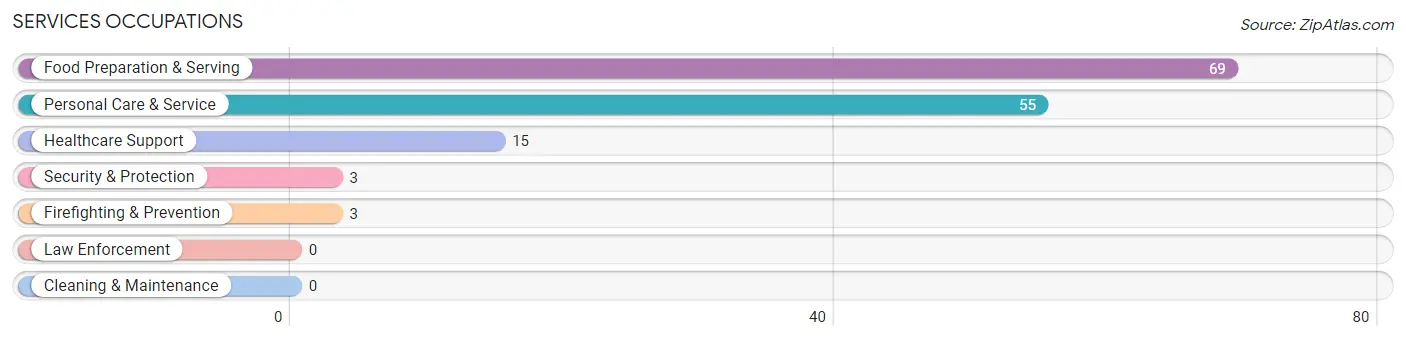
Services Occupations
The most common Services occupations in Arcadia University are Food Preparation & Serving (69 | 23.7%), Personal Care & Service (55 | 18.9%), Healthcare Support (15 | 5.1%), Security & Protection (3 | 1.0%), and Firefighting & Prevention (3 | 1.0%).
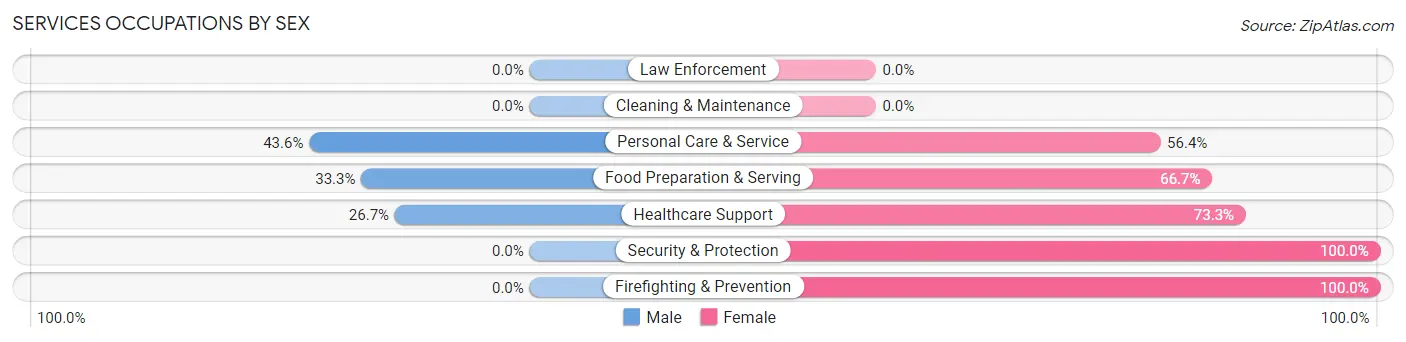
Services Occupations by Sex
Within the Services occupations in Arcadia University, the most male-oriented occupations are Personal Care & Service (43.6%), Food Preparation & Serving (33.3%), and Healthcare Support (26.7%), while the most female-oriented occupations are Security & Protection (100.0%), Firefighting & Prevention (100.0%), and Healthcare Support (73.3%).
| Occupation | Male | Female |
| Healthcare Support | 4 (26.7%) | 11 (73.3%) |
| Security & Protection | 0 (0.0%) | 3 (100.0%) |
| Firefighting & Prevention | 0 (0.0%) | 3 (100.0%) |
| Law Enforcement | 0 (0.0%) | 0 (0.0%) |
| Food Preparation & Serving | 23 (33.3%) | 46 (66.7%) |
| Cleaning & Maintenance | 0 (0.0%) | 0 (0.0%) |
| Personal Care & Service | 24 (43.6%) | 31 (56.4%) |
| Total (Category) | 51 (35.9%) | 91 (64.1%) |
| Total (Overall) | 112 (38.5%) | 179 (61.5%) |
Sales and Office Occupations
The most common Sales and Office occupations in Arcadia University are Sales & Related (34 | 11.7%), and Office & Administration (5 | 1.7%).

Sales and Office Occupations by Sex

| Occupation | Male | Female |
| Sales & Related | 29 (85.3%) | 5 (14.7%) |
| Office & Administration | 2 (40.0%) | 3 (60.0%) |
| Total (Category) | 31 (79.5%) | 8 (20.5%) |
| Total (Overall) | 112 (38.5%) | 179 (61.5%) |
Natural Resources, Construction and Maintenance Occupations
The most common Natural Resources, Construction and Maintenance occupations in Arcadia University are Construction & Extraction (26 | 8.9%), and Installation, Maintenance & Repair (9 | 3.1%).

Natural Resources, Construction and Maintenance Occupations by Sex

| Occupation | Male | Female |
| Farming, Fishing & Forestry | 0 (0.0%) | 0 (0.0%) |
| Construction & Extraction | 26 (100.0%) | 0 (0.0%) |
| Installation, Maintenance & Repair | 0 (0.0%) | 9 (100.0%) |
| Total (Category) | 26 (74.3%) | 9 (25.7%) |
| Total (Overall) | 112 (38.5%) | 179 (61.5%) |
Production, Transportation and Moving Occupations
The most common Production, Transportation and Moving occupations in Arcadia University are , and Production (4 | 1.4%).
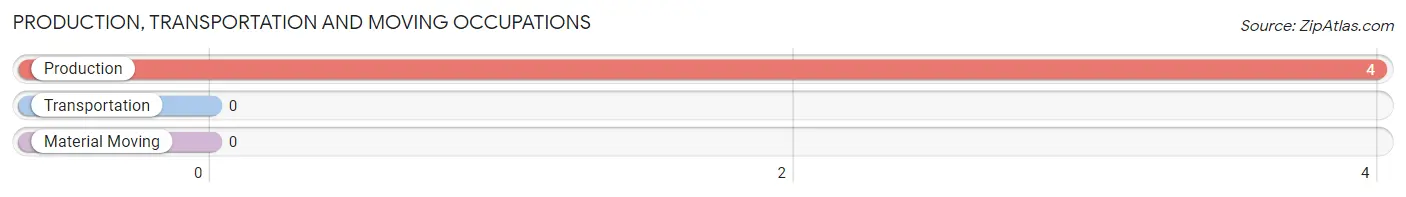
Production, Transportation and Moving Occupations by Sex

| Occupation | Male | Female |
| Production | 4 (100.0%) | 0 (0.0%) |
| Transportation | 0 (0.0%) | 0 (0.0%) |
| Material Moving | 0 (0.0%) | 0 (0.0%) |
| Total (Category) | 4 (100.0%) | 0 (0.0%) |
| Total (Overall) | 112 (38.5%) | 179 (61.5%) |
Employment Industries by Sex in Arcadia University
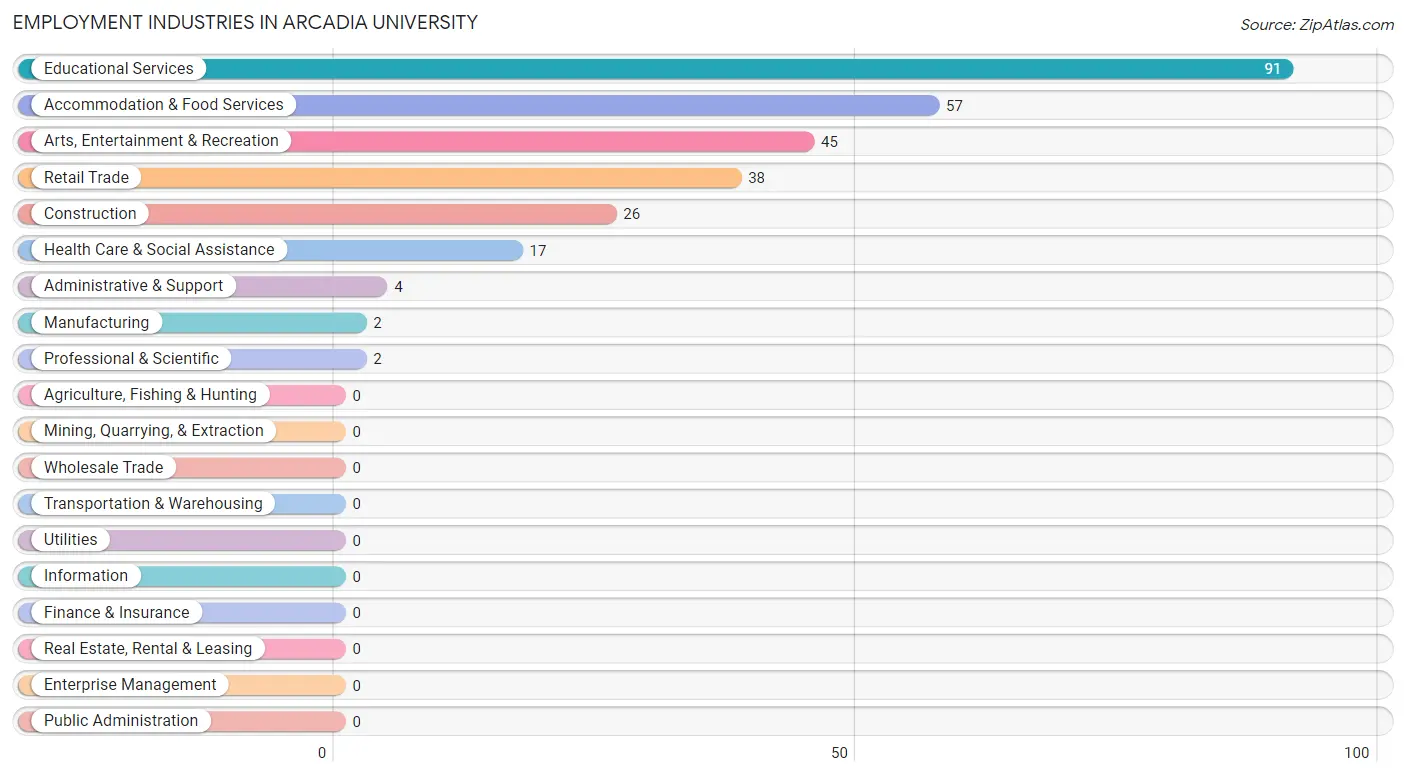
Employment Industries in Arcadia University
The major employment industries in Arcadia University include Educational Services (91 | 31.3%), Accommodation & Food Services (57 | 19.6%), Arts, Entertainment & Recreation (45 | 15.5%), Retail Trade (38 | 13.1%), and Construction (26 | 8.9%).
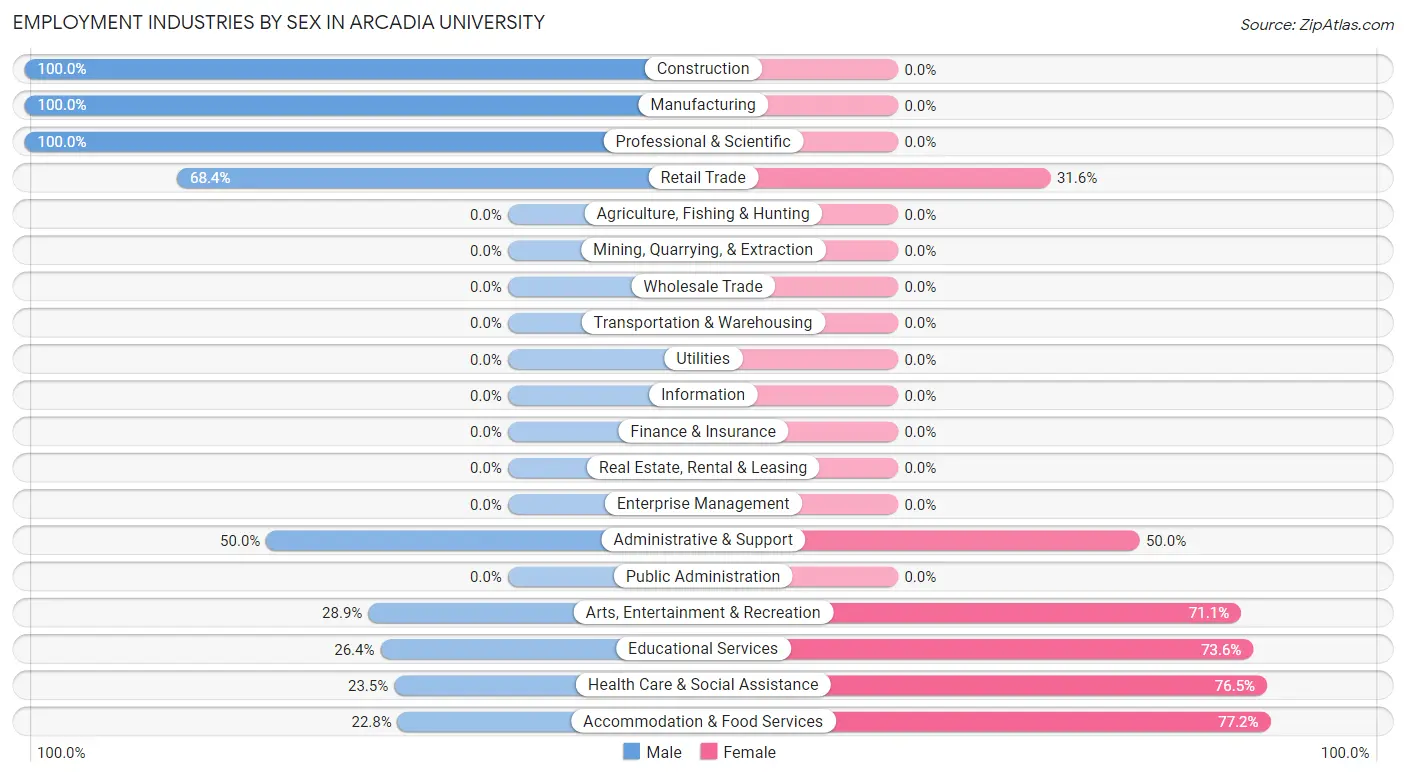
Employment Industries by Sex in Arcadia University
The Arcadia University industries that see more men than women are Construction (100.0%), Manufacturing (100.0%), and Professional & Scientific (100.0%), whereas the industries that tend to have a higher number of women are Accommodation & Food Services (77.2%), Health Care & Social Assistance (76.5%), and Educational Services (73.6%).
| Industry | Male | Female |
| Agriculture, Fishing & Hunting | 0 (0.0%) | 0 (0.0%) |
| Mining, Quarrying, & Extraction | 0 (0.0%) | 0 (0.0%) |
| Construction | 26 (100.0%) | 0 (0.0%) |
| Manufacturing | 2 (100.0%) | 0 (0.0%) |
| Wholesale Trade | 0 (0.0%) | 0 (0.0%) |
| Retail Trade | 26 (68.4%) | 12 (31.6%) |
| Transportation & Warehousing | 0 (0.0%) | 0 (0.0%) |
| Utilities | 0 (0.0%) | 0 (0.0%) |
| Information | 0 (0.0%) | 0 (0.0%) |
| Finance & Insurance | 0 (0.0%) | 0 (0.0%) |
| Real Estate, Rental & Leasing | 0 (0.0%) | 0 (0.0%) |
| Professional & Scientific | 2 (100.0%) | 0 (0.0%) |
| Enterprise Management | 0 (0.0%) | 0 (0.0%) |
| Administrative & Support | 2 (50.0%) | 2 (50.0%) |
| Educational Services | 24 (26.4%) | 67 (73.6%) |
| Health Care & Social Assistance | 4 (23.5%) | 13 (76.5%) |
| Arts, Entertainment & Recreation | 13 (28.9%) | 32 (71.1%) |
| Accommodation & Food Services | 13 (22.8%) | 44 (77.2%) |
| Public Administration | 0 (0.0%) | 0 (0.0%) |
| Total | 112 (38.5%) | 179 (61.5%) |
Education in Arcadia University
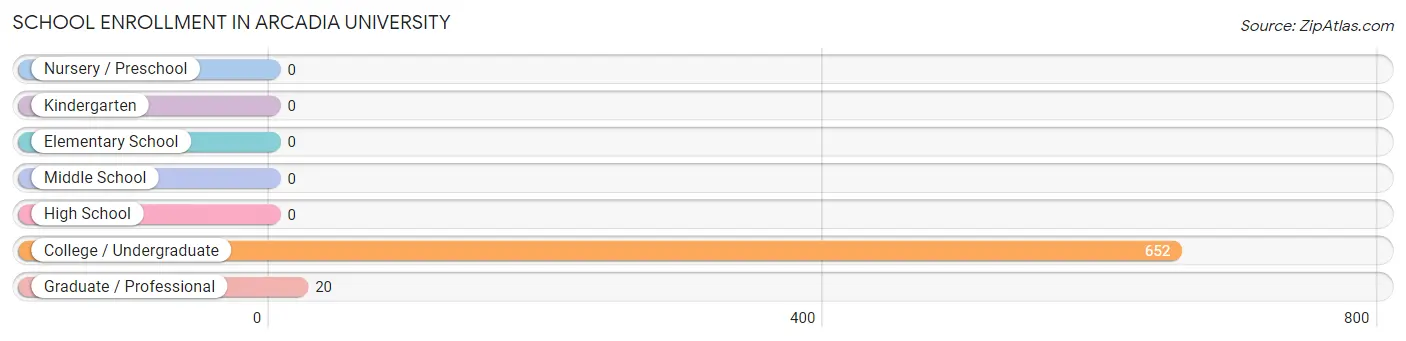
School Enrollment in Arcadia University
The most common levels of schooling among the 672 students in Arcadia University are college / undergraduate (652 | 97.0%), and graduate / professional (20 | 3.0%).
| School Level | # Students | % Students |
| Nursery / Preschool | 0 | 0.0% |
| Kindergarten | 0 | 0.0% |
| Elementary School | 0 | 0.0% |
| Middle School | 0 | 0.0% |
| High School | 0 | 0.0% |
| College / Undergraduate | 652 | 97.0% |
| Graduate / Professional | 20 | 3.0% |
| Total | 672 | 100.0% |
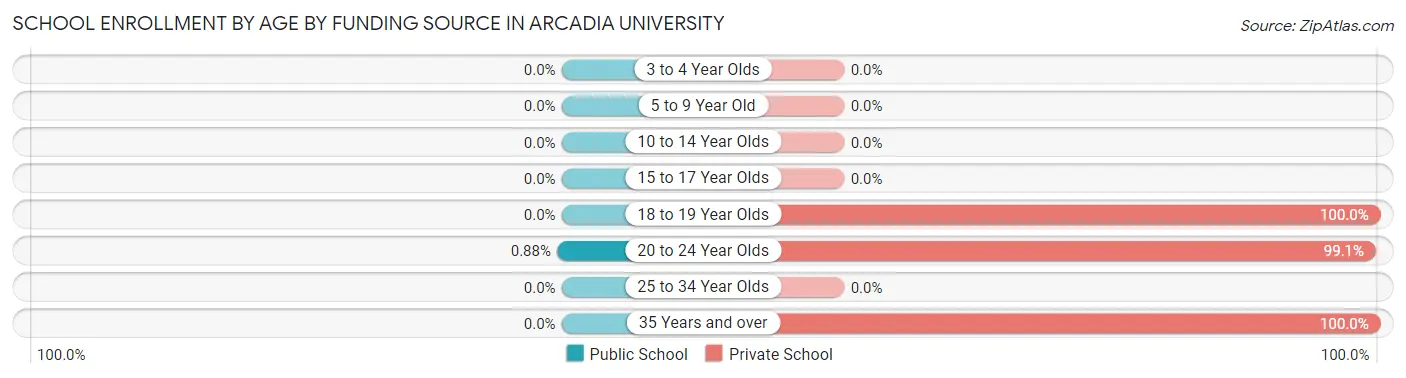
School Enrollment by Age by Funding Source in Arcadia University
Out of a total of 672 students who are enrolled in schools in Arcadia University, 670 (99.7%) attend a private institution, while the remaining 2 (0.3%) are enrolled in public schools. The age group of 18 to 19 year olds has the highest likelihood of being enrolled in private schools, with 437 (100.0% in the age bracket) enrolled. Conversely, the age group of 20 to 24 year olds has the lowest likelihood of being enrolled in a private school, with 2 (0.9% in the age bracket) attending a public institution.
| Age Bracket | Public School | Private School |
| 3 to 4 Year Olds | 0 (0.0%) | 0 (0.0%) |
| 5 to 9 Year Old | 0 (0.0%) | 0 (0.0%) |
| 10 to 14 Year Olds | 0 (0.0%) | 0 (0.0%) |
| 15 to 17 Year Olds | 0 (0.0%) | 0 (0.0%) |
| 18 to 19 Year Olds | 0 (0.0%) | 437 (100.0%) |
| 20 to 24 Year Olds | 2 (0.9%) | 226 (99.1%) |
| 25 to 34 Year Olds | 0 (0.0%) | 0 (0.0%) |
| 35 Years and over | 0 (0.0%) | 7 (100.0%) |
| Total | 2 (0.3%) | 670 (99.7%) |
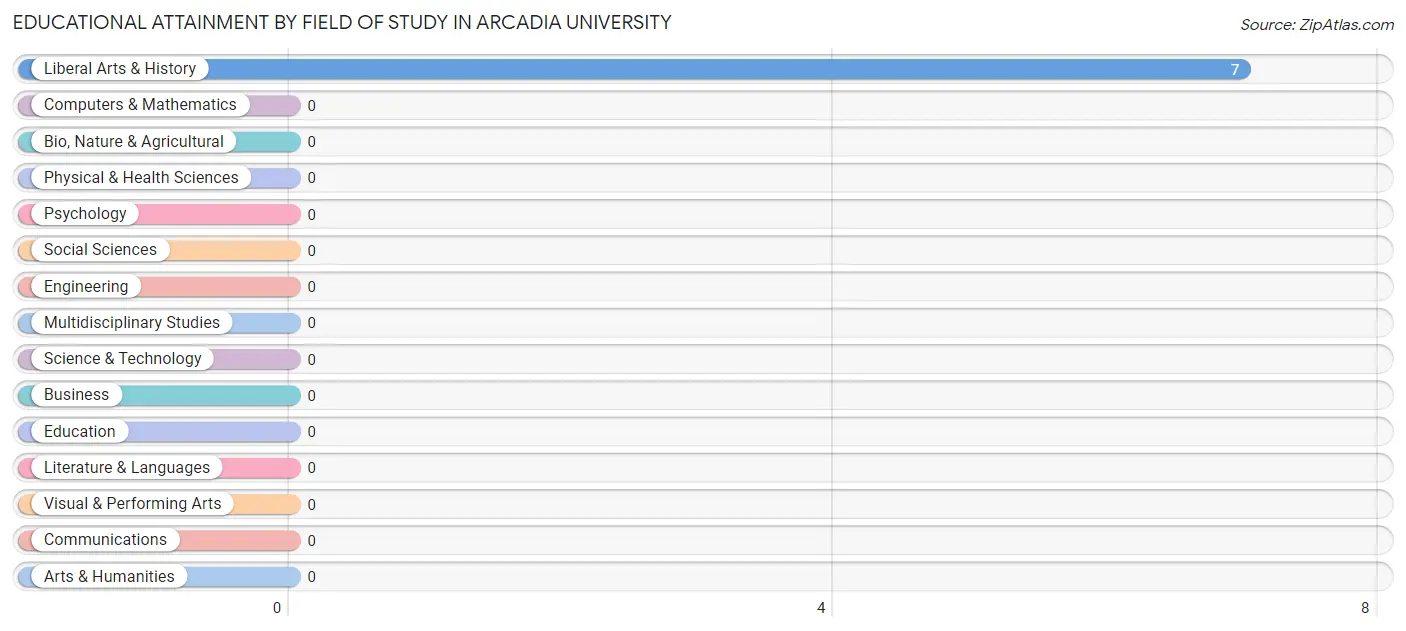
Educational Attainment by Field of Study in Arcadia University
, and liberal arts & history (7 | 100.0%) are the most common fields of study among 7 individuals in Arcadia University who have obtained a bachelor's degree or higher.
| Field of Study | # Graduates | % Graduates |
| Computers & Mathematics | 0 | 0.0% |
| Bio, Nature & Agricultural | 0 | 0.0% |
| Physical & Health Sciences | 0 | 0.0% |
| Psychology | 0 | 0.0% |
| Social Sciences | 0 | 0.0% |
| Engineering | 0 | 0.0% |
| Multidisciplinary Studies | 0 | 0.0% |
| Science & Technology | 0 | 0.0% |
| Business | 0 | 0.0% |
| Education | 0 | 0.0% |
| Literature & Languages | 0 | 0.0% |
| Liberal Arts & History | 7 | 100.0% |
| Visual & Performing Arts | 0 | 0.0% |
| Communications | 0 | 0.0% |
| Arts & Humanities | 0 | 0.0% |
| Total | 7 | 100.0% |
Transportation & Commute in Arcadia University
Vehicle Availability by Sex in Arcadia University
| Vehicles Available | Male | Female |
| No Vehicle | 0 (0.0%) | 0 (0.0%) |
| 1 Vehicle | 0 (0.0%) | 0 (0.0%) |
| 2 Vehicles | 0 (0.0%) | 0 (0.0%) |
| 3 Vehicles | 0 (0.0%) | 0 (0.0%) |
| 4 Vehicles | 0 (0.0%) | 0 (0.0%) |
| 5 or more Vehicles | 0 (0.0%) | 0 (0.0%) |
| Total | 0 (0.0%) | 0 (0.0%) |
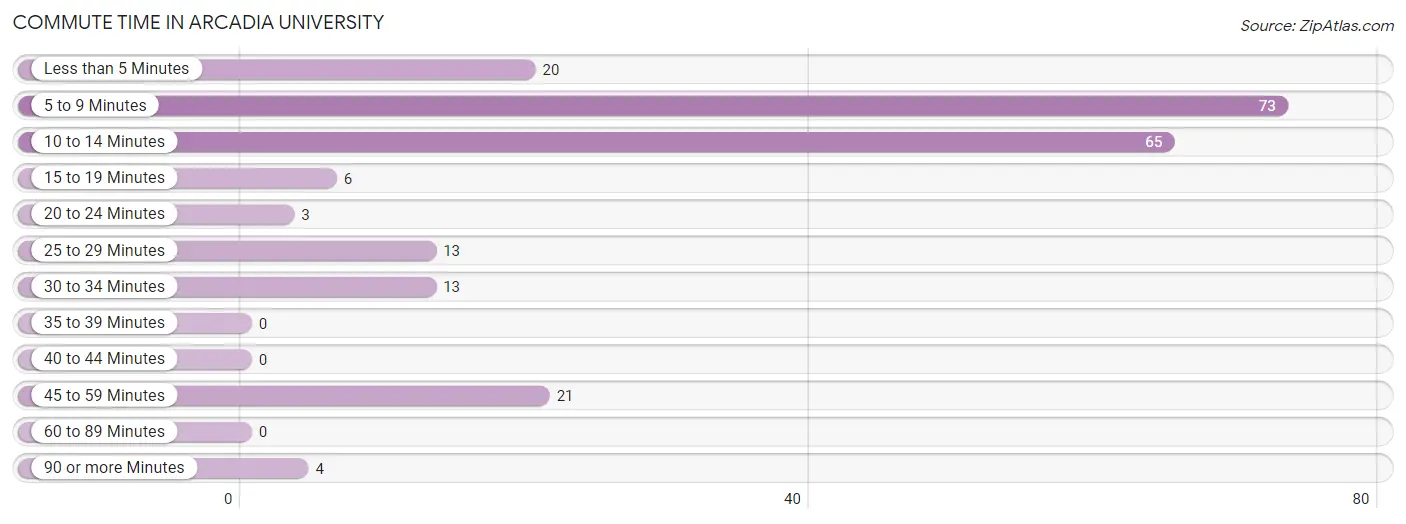
Commute Time in Arcadia University
The most frequently occuring commute durations in Arcadia University are 5 to 9 minutes (73 commuters, 33.5%), 10 to 14 minutes (65 commuters, 29.8%), and 45 to 59 minutes (21 commuters, 9.6%).
| Commute Time | # Commuters | % Commuters |
| Less than 5 Minutes | 20 | 9.2% |
| 5 to 9 Minutes | 73 | 33.5% |
| 10 to 14 Minutes | 65 | 29.8% |
| 15 to 19 Minutes | 6 | 2.8% |
| 20 to 24 Minutes | 3 | 1.4% |
| 25 to 29 Minutes | 13 | 6.0% |
| 30 to 34 Minutes | 13 | 6.0% |
| 35 to 39 Minutes | 0 | 0.0% |
| 40 to 44 Minutes | 0 | 0.0% |
| 45 to 59 Minutes | 21 | 9.6% |
| 60 to 89 Minutes | 0 | 0.0% |
| 90 or more Minutes | 4 | 1.8% |
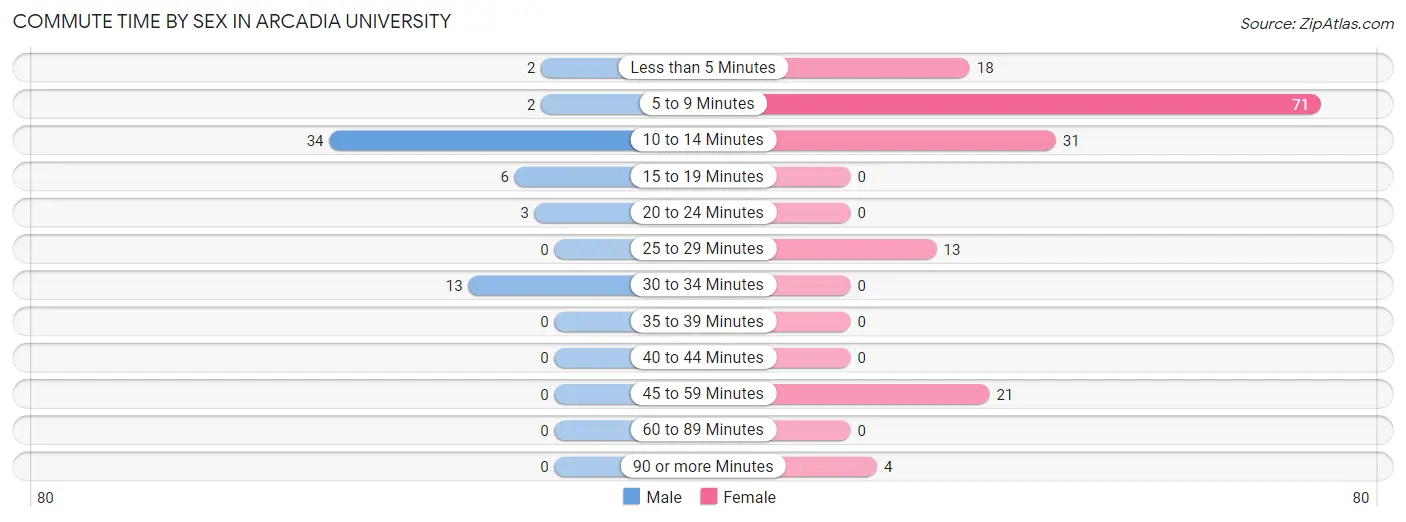
Commute Time by Sex in Arcadia University
The most common commute times in Arcadia University are 10 to 14 minutes (34 commuters, 56.7%) for males and 5 to 9 minutes (71 commuters, 44.9%) for females.
| Commute Time | Male | Female |
| Less than 5 Minutes | 2 (3.3%) | 18 (11.4%) |
| 5 to 9 Minutes | 2 (3.3%) | 71 (44.9%) |
| 10 to 14 Minutes | 34 (56.7%) | 31 (19.6%) |
| 15 to 19 Minutes | 6 (10.0%) | 0 (0.0%) |
| 20 to 24 Minutes | 3 (5.0%) | 0 (0.0%) |
| 25 to 29 Minutes | 0 (0.0%) | 13 (8.2%) |
| 30 to 34 Minutes | 13 (21.7%) | 0 (0.0%) |
| 35 to 39 Minutes | 0 (0.0%) | 0 (0.0%) |
| 40 to 44 Minutes | 0 (0.0%) | 0 (0.0%) |
| 45 to 59 Minutes | 0 (0.0%) | 21 (13.3%) |
| 60 to 89 Minutes | 0 (0.0%) | 0 (0.0%) |
| 90 or more Minutes | 0 (0.0%) | 4 (2.5%) |
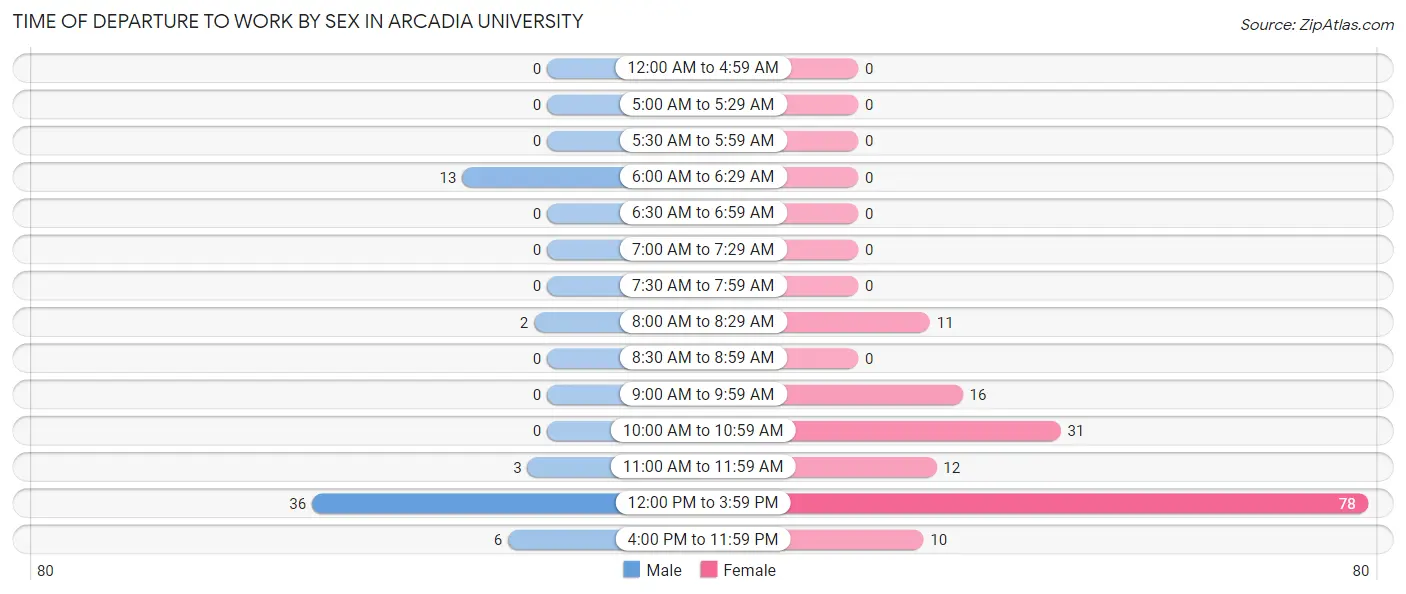
Time of Departure to Work by Sex in Arcadia University
The most frequent times of departure to work in Arcadia University are 12:00 PM to 3:59 PM (36, 60.0%) for males and 12:00 PM to 3:59 PM (78, 49.4%) for females.
| Time of Departure | Male | Female |
| 12:00 AM to 4:59 AM | 0 (0.0%) | 0 (0.0%) |
| 5:00 AM to 5:29 AM | 0 (0.0%) | 0 (0.0%) |
| 5:30 AM to 5:59 AM | 0 (0.0%) | 0 (0.0%) |
| 6:00 AM to 6:29 AM | 13 (21.7%) | 0 (0.0%) |
| 6:30 AM to 6:59 AM | 0 (0.0%) | 0 (0.0%) |
| 7:00 AM to 7:29 AM | 0 (0.0%) | 0 (0.0%) |
| 7:30 AM to 7:59 AM | 0 (0.0%) | 0 (0.0%) |
| 8:00 AM to 8:29 AM | 2 (3.3%) | 11 (7.0%) |
| 8:30 AM to 8:59 AM | 0 (0.0%) | 0 (0.0%) |
| 9:00 AM to 9:59 AM | 0 (0.0%) | 16 (10.1%) |
| 10:00 AM to 10:59 AM | 0 (0.0%) | 31 (19.6%) |
| 11:00 AM to 11:59 AM | 3 (5.0%) | 12 (7.6%) |
| 12:00 PM to 3:59 PM | 36 (60.0%) | 78 (49.4%) |
| 4:00 PM to 11:59 PM | 6 (10.0%) | 10 (6.3%) |
| Total | 60 (100.0%) | 158 (100.0%) |
Housing Occupancy in Arcadia University
Occupancy by Ownership in Arcadia University
| Occupancy | # Housing Units | % Housing Units |
| Owner Occupied Housing Units | 0 | 0.0% |
| Renter-Occupied Housing Units | 0 | 0.0% |
| Total Occupied Housing Units | 0 | 0.0% |
Occupancy by Household Size in Arcadia University
| Household Size | # Housing Units | % Housing Units |
| 1-Person Household | 0 | 0.0% |
| 2-Person Household | 0 | 0.0% |
| 3-Person Household | 0 | 0.0% |
| 4+ Person Household | 0 | 0.0% |
| Total Housing Units | 0 | 0.0% |
Occupancy by Ownership by Household Size in Arcadia University
| Household Size | Owner-occupied | Renter-occupied |
| 1-Person Household | 0 (0.0%) | 0 (0.0%) |
| 2-Person Household | 0 (0.0%) | 0 (0.0%) |
| 3-Person Household | 0 (0.0%) | 0 (0.0%) |
| 4+ Person Household | 0 (0.0%) | 0 (0.0%) |
| Total Housing Units | 0 (0.0%) | 0 (0.0%) |
Occupancy by Educational Attainment in Arcadia University
| Household Size | Owner-occupied | Renter-occupied |
| Less than High School | 0 (0.0%) | 0 (0.0%) |
| High School Diploma | 0 (0.0%) | 0 (0.0%) |
| College/Associate Degree | 0 (0.0%) | 0 (0.0%) |
| Bachelor's Degree or higher | 0 (0.0%) | 0 (0.0%) |
Occupancy by Age of Householder in Arcadia University
| Age Bracket | # Households | % Households |
| Under 35 Years | 0 | 0.0% |
| 35 to 44 Years | 0 | 0.0% |
| 45 to 54 Years | 0 | 0.0% |
| 55 to 64 Years | 0 | 0.0% |
| 65 to 74 Years | 0 | 0.0% |
| 75 to 84 Years | 0 | 0.0% |
| 85 Years and Over | 0 | 0.0% |
| Total | 0 | 0.0% |
Housing Finances in Arcadia University
Median Income by Occupancy in Arcadia University
| Occupancy Type | # Households | Median Income |
| Owner-Occupied | 0 (0.0%) | $0 |
| Renter-Occupied | 0 (0.0%) | $0 |
| Average | 0 (0.0%) | $0 |
Occupancy by Householder Income Bracket in Arcadia University
| Income Bracket | Owner-occupied | Renter-occupied |
| Less than $5,000 | 0 (0.0%) | 0 (0.0%) |
| $5,000 to $9,999 | 0 (0.0%) | 0 (0.0%) |
| $10,000 to $14,999 | 0 (0.0%) | 0 (0.0%) |
| $15,000 to $19,999 | 0 (0.0%) | 0 (0.0%) |
| $20,000 to $24,999 | 0 (0.0%) | 0 (0.0%) |
| $25,000 to $34,999 | 0 (0.0%) | 0 (0.0%) |
| $35,000 to $49,999 | 0 (0.0%) | 0 (0.0%) |
| $50,000 to $74,999 | 0 (0.0%) | 0 (0.0%) |
| $75,000 to $99,999 | 0 (0.0%) | 0 (0.0%) |
| $100,000 to $149,999 | 0 (0.0%) | 0 (0.0%) |
| $150,000 or more | 0 (0.0%) | 0 (0.0%) |
| Total | 0 (0.0%) | 0 (0.0%) |
Monthly Housing Cost Tiers in Arcadia University
| Monthly Cost | Owner-occupied | Renter-occupied |
| Less than $300 | 0 (0.0%) | 0 (0.0%) |
| $300 to $499 | 0 (0.0%) | 0 (0.0%) |
| $500 to $799 | 0 (0.0%) | 0 (0.0%) |
| $800 to $999 | 0 (0.0%) | 0 (0.0%) |
| $1,000 to $1,499 | 0 (0.0%) | 0 (0.0%) |
| $1,500 to $1,999 | 0 (0.0%) | 0 (0.0%) |
| $2,000 to $2,499 | 0 (0.0%) | 0 (0.0%) |
| $2,500 to $2,999 | 0 (0.0%) | 0 (0.0%) |
| $3,000 or more | 0 (0.0%) | 0 (0.0%) |
| Total | 0 (0.0%) | 0 (0.0%) |
Physical Housing Characteristics in Arcadia University
Housing Structures in Arcadia University
| Structure Type | # Housing Units | % Housing Units |
| Single Unit, Detached | 0 | 0.0% |
| Single Unit, Attached | 0 | 0.0% |
| 2 Unit Apartments | 0 | 0.0% |
| 3 or 4 Unit Apartments | 0 | 0.0% |
| 5 to 9 Unit Apartments | 0 | 0.0% |
| 10 or more Apartments | 0 | 0.0% |
| Mobile Home / Other | 0 | 0.0% |
| Total | 0 | 0.0% |
Housing Structures by Occupancy in Arcadia University
| Structure Type | Owner-occupied | Renter-occupied |
| Single Unit, Detached | 0 (0.0%) | 0 (0.0%) |
| Single Unit, Attached | 0 (0.0%) | 0 (0.0%) |
| 2 Unit Apartments | 0 (0.0%) | 0 (0.0%) |
| 3 or 4 Unit Apartments | 0 (0.0%) | 0 (0.0%) |
| 5 to 9 Unit Apartments | 0 (0.0%) | 0 (0.0%) |
| 10 or more Apartments | 0 (0.0%) | 0 (0.0%) |
| Mobile Home / Other | 0 (0.0%) | 0 (0.0%) |
| Total | 0 (0.0%) | 0 (0.0%) |
Housing Structures by Number of Rooms in Arcadia University
| Number of Rooms | Owner-occupied | Renter-occupied |
| 1 Room | 0 (0.0%) | 0 (0.0%) |
| 2 or 3 Rooms | 0 (0.0%) | 0 (0.0%) |
| 4 or 5 Rooms | 0 (0.0%) | 0 (0.0%) |
| 6 or 7 Rooms | 0 (0.0%) | 0 (0.0%) |
| 8 or more Rooms | 0 (0.0%) | 0 (0.0%) |
| Total | 0 (0.0%) | 0 (0.0%) |
Housing Structure by Heating Type in Arcadia University
| Heating Type | Owner-occupied | Renter-occupied |
| Utility Gas | 0 (0.0%) | 0 (0.0%) |
| Bottled, Tank, or LP Gas | 0 (0.0%) | 0 (0.0%) |
| Electricity | 0 (0.0%) | 0 (0.0%) |
| Fuel Oil or Kerosene | 0 (0.0%) | 0 (0.0%) |
| Coal or Coke | 0 (0.0%) | 0 (0.0%) |
| All other Fuels | 0 (0.0%) | 0 (0.0%) |
| No Fuel Used | 0 (0.0%) | 0 (0.0%) |
| Total | 0 (0.0%) | 0 (0.0%) |
Household Vehicle Usage in Arcadia University
| Vehicles per Household | Owner-occupied | Renter-occupied |
| No Vehicle | 0 (0.0%) | 0 (0.0%) |
| 1 Vehicle | 0 (0.0%) | 0 (0.0%) |
| 2 Vehicles | 0 (0.0%) | 0 (0.0%) |
| 3 or more Vehicles | 0 (0.0%) | 0 (0.0%) |
| Total | 0 (0.0%) | 0 (0.0%) |
Real Estate & Mortgages in Arcadia University
Real Estate and Mortgage Overview in Arcadia University
| Characteristic | Without Mortgage | With Mortgage |
| Housing Units | 0 | 0 |
| Median Property Value | - | - |
| Median Household Income | - | - |
| Monthly Housing Costs | - | - |
| Real Estate Taxes | - | - |
Property Value by Mortgage Status in Arcadia University
| Property Value | Without Mortgage | With Mortgage |
| Less than $50,000 | 0 (0.0%) | 0 (0.0%) |
| $50,000 to $99,999 | 0 (0.0%) | 0 (0.0%) |
| $100,000 to $299,999 | 0 (0.0%) | 0 (0.0%) |
| $300,000 to $499,999 | 0 (0.0%) | 0 (0.0%) |
| $500,000 to $749,999 | 0 (0.0%) | 0 (0.0%) |
| $750,000 to $999,999 | 0 (0.0%) | 0 (0.0%) |
| $1,000,000 or more | 0 (0.0%) | 0 (0.0%) |
| Total | 0 (0.0%) | 0 (0.0%) |
Household Income by Mortgage Status in Arcadia University
| Household Income | Without Mortgage | With Mortgage |
| Less than $10,000 | 0 (0.0%) | 0 (0.0%) |
| $10,000 to $24,999 | 0 (0.0%) | 0 (0.0%) |
| $25,000 to $34,999 | 0 (0.0%) | 0 (0.0%) |
| $35,000 to $49,999 | 0 (0.0%) | 0 (0.0%) |
| $50,000 to $74,999 | 0 (0.0%) | 0 (0.0%) |
| $75,000 to $99,999 | 0 (0.0%) | 0 (0.0%) |
| $100,000 to $149,999 | 0 (0.0%) | 0 (0.0%) |
| $150,000 or more | 0 (0.0%) | 0 (0.0%) |
| Total | 0 (0.0%) | 0 (0.0%) |
Property Value to Household Income Ratio in Arcadia University

| Value-to-Income Ratio | Without Mortgage | With Mortgage |
| Less than 2.0x | 0 (0.0%) | 0 (0.0%) |
| 2.0x to 2.9x | 0 (0.0%) | 0 (0.0%) |
| 3.0x to 3.9x | 0 (0.0%) | 0 (0.0%) |
| 4.0x or more | 0 (0.0%) | 0 (0.0%) |
| Total | 0 (0.0%) | 0 (0.0%) |
Real Estate Taxes by Mortgage Status in Arcadia University

| Property Taxes | Without Mortgage | With Mortgage |
| Less than $800 | 0 (0.0%) | 0 (0.0%) |
| $800 to $1,499 | 0 (0.0%) | 0 (0.0%) |
| $800 to $1,499 | 0 (0.0%) | 0 (0.0%) |
| Total | 0 (0.0%) | 0 (0.0%) |
Health & Disability in Arcadia University
Health Insurance Coverage by Age in Arcadia University
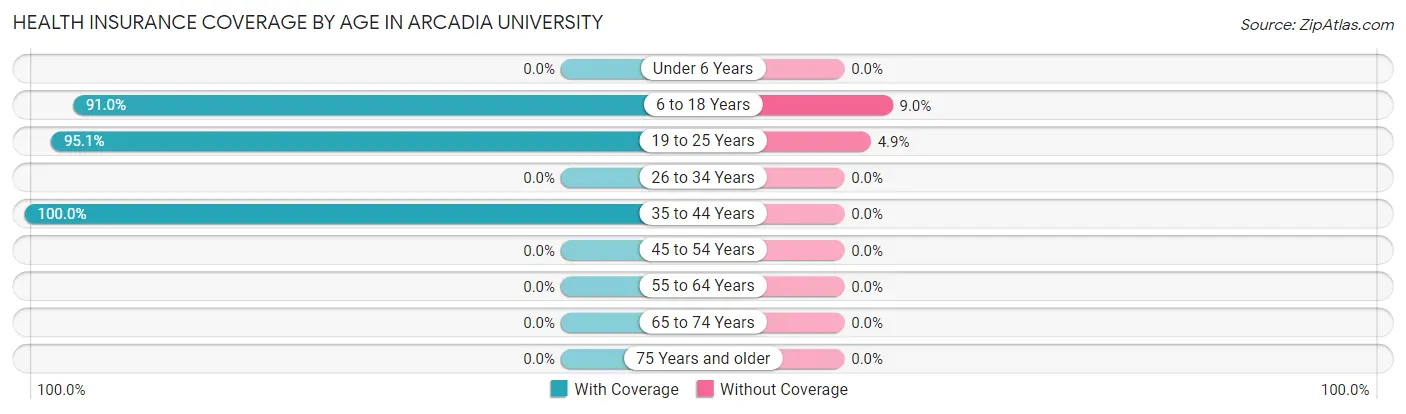
| Age Bracket | With Coverage | Without Coverage |
| Under 6 Years | 0 (0.0%) | 0 (0.0%) |
| 6 to 18 Years | 162 (91.0%) | 16 (9.0%) |
| 19 to 25 Years | 463 (95.1%) | 24 (4.9%) |
| 26 to 34 Years | 0 (0.0%) | 0 (0.0%) |
| 35 to 44 Years | 7 (100.0%) | 0 (0.0%) |
| 45 to 54 Years | 0 (0.0%) | 0 (0.0%) |
| 55 to 64 Years | 0 (0.0%) | 0 (0.0%) |
| 65 to 74 Years | 0 (0.0%) | 0 (0.0%) |
| 75 Years and older | 0 (0.0%) | 0 (0.0%) |
| Total | 632 (94.1%) | 40 (5.9%) |
Health Insurance Coverage by Citizenship Status in Arcadia University

| Citizenship Status | With Coverage | Without Coverage |
| Native Born | 0 (0.0%) | 0 (0.0%) |
| Foreign Born, Citizen | 162 (91.0%) | 16 (9.0%) |
| Foreign Born, not a Citizen | 463 (95.1%) | 24 (4.9%) |
Health Insurance Coverage by Household Income in Arcadia University
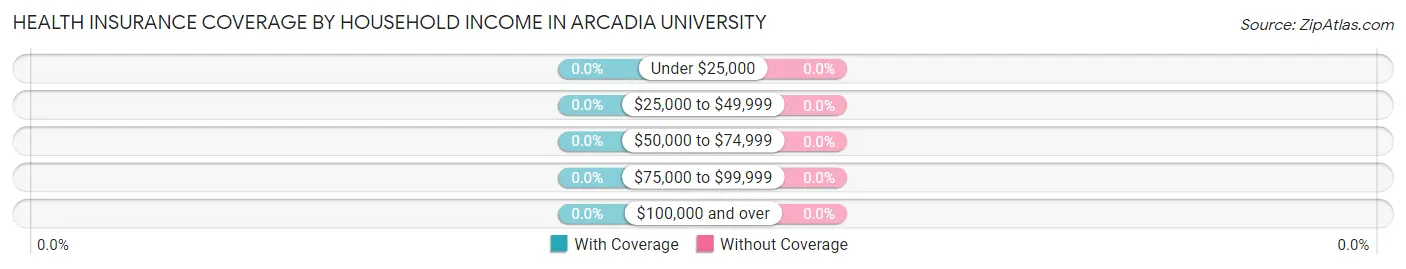
| Household Income | With Coverage | Without Coverage |
| Under $25,000 | 0 (0.0%) | 0 (0.0%) |
| $25,000 to $49,999 | 0 (0.0%) | 0 (0.0%) |
| $50,000 to $74,999 | 0 (0.0%) | 0 (0.0%) |
| $75,000 to $99,999 | 0 (0.0%) | 0 (0.0%) |
| $100,000 and over | 0 (0.0%) | 0 (0.0%) |
Public vs Private Health Insurance Coverage by Age in Arcadia University
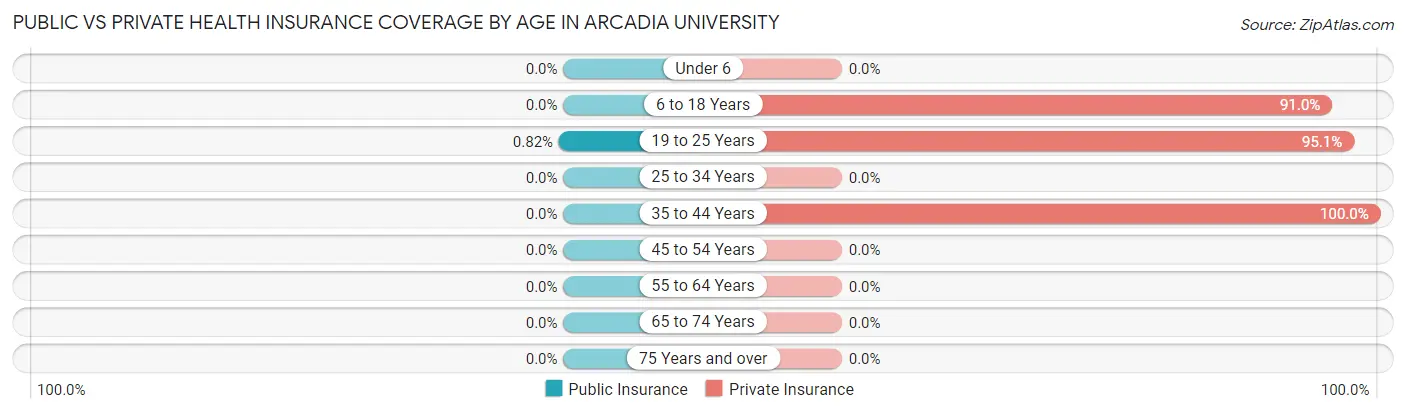
| Age Bracket | Public Insurance | Private Insurance |
| Under 6 | 0 (0.0%) | 0 (0.0%) |
| 6 to 18 Years | 0 (0.0%) | 162 (91.0%) |
| 19 to 25 Years | 4 (0.8%) | 463 (95.1%) |
| 25 to 34 Years | 0 (0.0%) | 0 (0.0%) |
| 35 to 44 Years | 0 (0.0%) | 7 (100.0%) |
| 45 to 54 Years | 0 (0.0%) | 0 (0.0%) |
| 55 to 64 Years | 0 (0.0%) | 0 (0.0%) |
| 65 to 74 Years | 0 (0.0%) | 0 (0.0%) |
| 75 Years and over | 0 (0.0%) | 0 (0.0%) |
| Total | 4 (0.6%) | 632 (94.1%) |
Disability Status by Sex by Age in Arcadia University
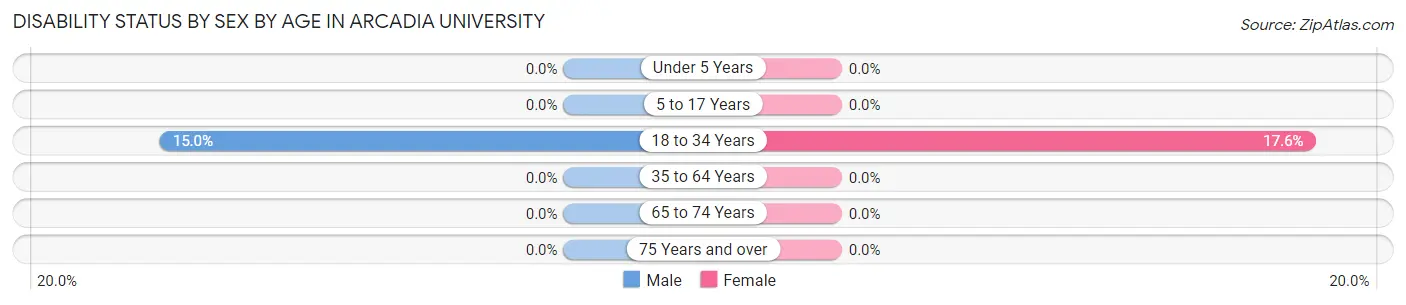
| Age Bracket | Male | Female |
| Under 5 Years | 0 (0.0%) | 0 (0.0%) |
| 5 to 17 Years | 0 (0.0%) | 0 (0.0%) |
| 18 to 34 Years | 34 (15.0%) | 77 (17.6%) |
| 35 to 64 Years | 0 (0.0%) | 0 (0.0%) |
| 65 to 74 Years | 0 (0.0%) | 0 (0.0%) |
| 75 Years and over | 0 (0.0%) | 0 (0.0%) |
Disability Class by Sex by Age in Arcadia University
Disability Class: Hearing Difficulty
| Age Bracket | Male | Female |
| Under 5 Years | 0 (0.0%) | 0 (0.0%) |
| 5 to 17 Years | 0 (0.0%) | 0 (0.0%) |
| 18 to 34 Years | 0 (0.0%) | 0 (0.0%) |
| 35 to 64 Years | 0 (0.0%) | 0 (0.0%) |
| 65 to 74 Years | 0 (0.0%) | 0 (0.0%) |
| 75 Years and over | 0 (0.0%) | 0 (0.0%) |
Disability Class: Vision Difficulty
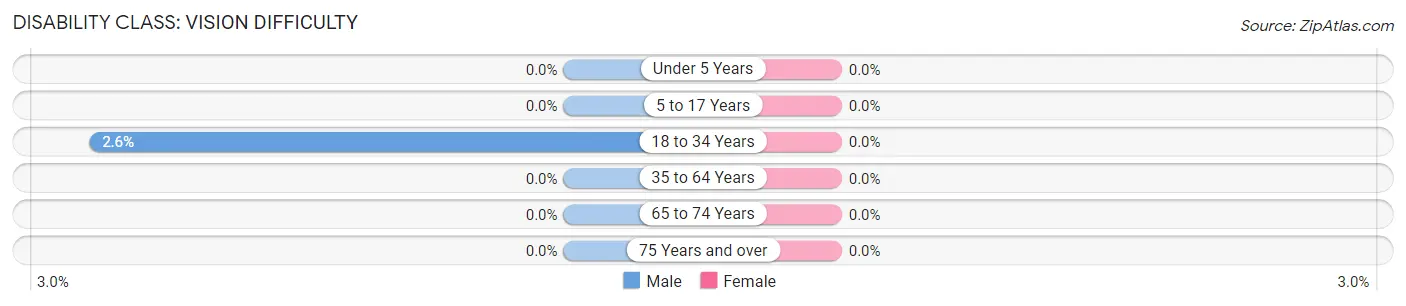
| Age Bracket | Male | Female |
| Under 5 Years | 0 (0.0%) | 0 (0.0%) |
| 5 to 17 Years | 0 (0.0%) | 0 (0.0%) |
| 18 to 34 Years | 6 (2.6%) | 0 (0.0%) |
| 35 to 64 Years | 0 (0.0%) | 0 (0.0%) |
| 65 to 74 Years | 0 (0.0%) | 0 (0.0%) |
| 75 Years and over | 0 (0.0%) | 0 (0.0%) |
Disability Class: Cognitive Difficulty
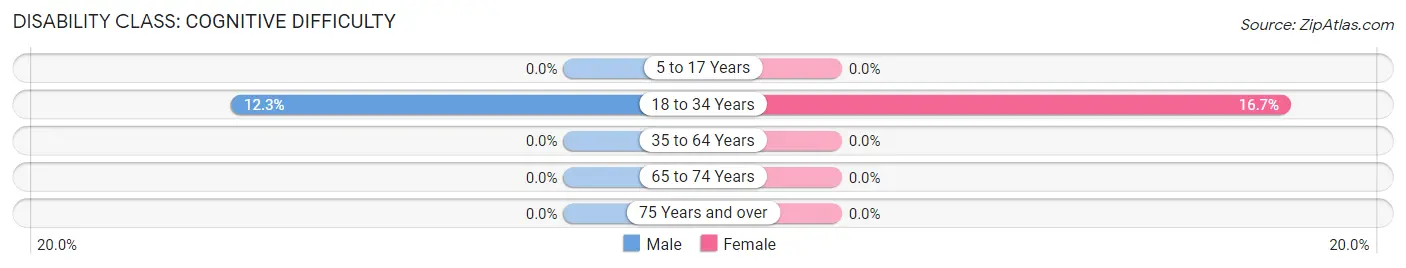
| Age Bracket | Male | Female |
| 5 to 17 Years | 0 (0.0%) | 0 (0.0%) |
| 18 to 34 Years | 28 (12.3%) | 73 (16.7%) |
| 35 to 64 Years | 0 (0.0%) | 0 (0.0%) |
| 65 to 74 Years | 0 (0.0%) | 0 (0.0%) |
| 75 Years and over | 0 (0.0%) | 0 (0.0%) |
Disability Class: Ambulatory Difficulty

| Age Bracket | Male | Female |
| 5 to 17 Years | 0 (0.0%) | 0 (0.0%) |
| 18 to 34 Years | 0 (0.0%) | 4 (0.9%) |
| 35 to 64 Years | 0 (0.0%) | 0 (0.0%) |
| 65 to 74 Years | 0 (0.0%) | 0 (0.0%) |
| 75 Years and over | 0 (0.0%) | 0 (0.0%) |
Disability Class: Self-Care Difficulty
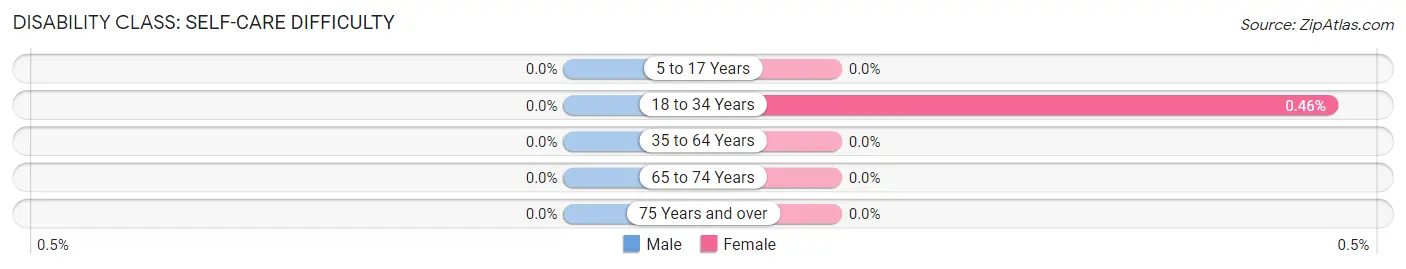
| Age Bracket | Male | Female |
| 5 to 17 Years | 0 (0.0%) | 0 (0.0%) |
| 18 to 34 Years | 0 (0.0%) | 2 (0.5%) |
| 35 to 64 Years | 0 (0.0%) | 0 (0.0%) |
| 65 to 74 Years | 0 (0.0%) | 0 (0.0%) |
| 75 Years and over | 0 (0.0%) | 0 (0.0%) |
Technology Access in Arcadia University
Computing Device Access in Arcadia University
| Device Type | # Households | % Households |
| Desktop or Laptop | 0 | 0.0% |
| Smartphone | 0 | 0.0% |
| Tablet | 0 | 0.0% |
| No Computing Device | 0 | 0.0% |
| Total | 0 | 0.0% |
Internet Access in Arcadia University
| Internet Type | # Households | % Households |
| Dial-Up Internet | 0 | 0.0% |
| Broadband Home | 0 | 0.0% |
| Cellular Data Only | 0 | 0.0% |
| Satellite Internet | 0 | 0.0% |
| No Internet | 0 | 0.0% |
| Total | 0 | 0.0% |
Arcadia University Summary
Arcadia University is a private university located in Glenside, Pennsylvania. It was founded in 1853 as Beaver Female Seminary and is one of the oldest universities in the United States. The university offers a wide range of undergraduate and graduate programs in the arts and sciences, business, education, and health sciences. Arcadia University is known for its commitment to global education, with study abroad programs in more than 40 countries.
History
Arcadia University was founded in 1853 as Beaver Female Seminary by the Reverend John Moore and his wife, Rebecca Moore. The school was established to provide a quality education for young women in the area. The school was originally located in Beaver, Pennsylvania, but moved to Glenside in 1927. In 1945, the school was renamed Beaver College and began offering coeducational classes. In 2001, the school was renamed Arcadia University.
Geography
Arcadia University is located in Glenside, Pennsylvania, a suburb of Philadelphia. The university is situated on a 72-acre campus in the heart of Montgomery County. The campus is surrounded by a variety of shops, restaurants, and other attractions. The university is easily accessible by public transportation, with the Glenside train station located just a few blocks away.
Economy
Arcadia University is a major economic force in the Glenside area. The university employs more than 1,000 faculty and staff members, and its students contribute to the local economy through their spending. The university also has a significant impact on the local real estate market, as many students and faculty members choose to live in the area.
Demographics
As of 2020, Arcadia University had a total enrollment of 4,845 students. The student body is composed of students from all 50 states and more than 60 countries. The university is majority white, with 57% of students identifying as such. The remaining students are composed of African American (14%), Asian (13%), Hispanic (7%), and other (9%) students.
Arcadia University is committed to providing a diverse and inclusive learning environment. The university has a variety of student organizations and clubs that promote diversity and inclusion. The university also offers a variety of cultural events and activities throughout the year.
Common Questions
What is Per Capita Income in Arcadia University?
Per Capita income in Arcadia University is $2,563.
What is Income or Wage Gap in Arcadia University?
Income or Wage Gap in Arcadia University is 1.3%.
Women in Arcadia University earn 98.7 cents for every dollar earned by a man.
What is the Total Population of Arcadia University?
Total Population of Arcadia University is 672.
What is the Total Male Population of Arcadia University?
Total Male Population of Arcadia University is 234.
What is the Total Female Population of Arcadia University?
Total Female Population of Arcadia University is 438.
What is the Ratio of Males per 100 Females in Arcadia University?
There are 53.42 Males per 100 Females in Arcadia University.
What is the Ratio of Females per 100 Males in Arcadia University?
There are 187.18 Females per 100 Males in Arcadia University.
What is the Median Population Age in Arcadia University?
Median Population Age in Arcadia University is 19.6 Years.
How Large is the Labor Force in Arcadia University?
There are 299 People in the Labor Forcein in Arcadia University.
What is the Percentage of People in the Labor Force in Arcadia University?
44.5% of People are in the Labor Force in Arcadia University.
What is the Unemployment Rate in Arcadia University?
Unemployment Rate in Arcadia University is 2.7%.