Zip Codes with the Highest Percentage of Population Employed in Food Preparation & Serving in West Chester, PA
RELATED REPORTS & OPTIONS
Food Preparation & Serving
West Chester
Compare Zip Codes
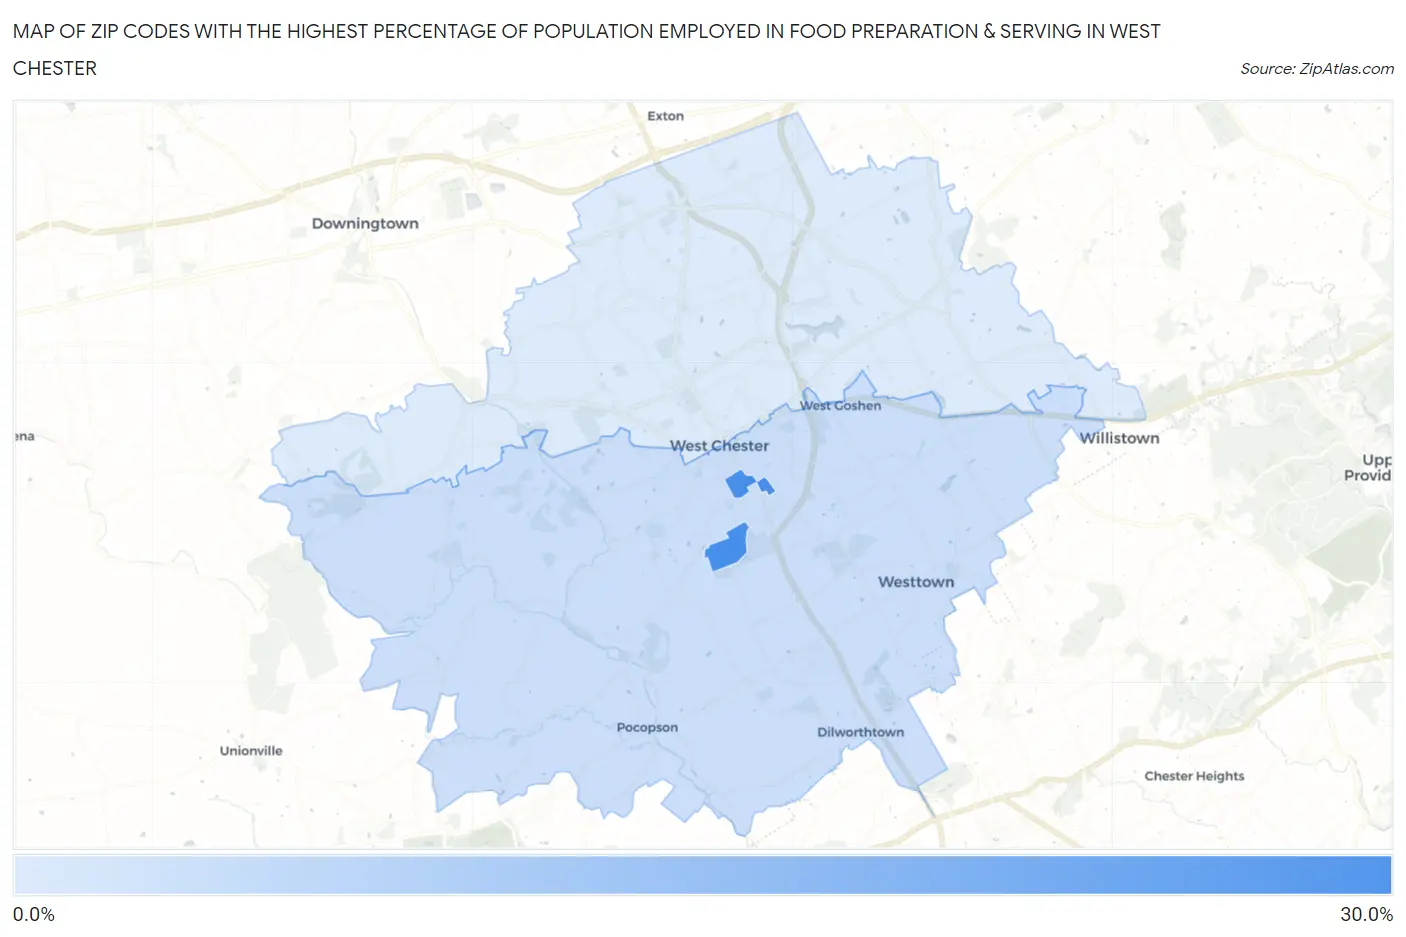
Map of Zip Codes with the Highest Percentage of Population Employed in Food Preparation & Serving in West Chester
2.4%
26.2%
Zip Codes with the Highest Percentage of Population Employed in Food Preparation & Serving in West Chester, PA
| Zip Code | % Employed | vs State | vs National | |
| 1. | 19383 | 26.2% | 5.0%(+21.2)#26 | 5.3%(+20.9)#281 |
| 2. | 19382 | 4.9% | 5.0%(-0.143)#756 | 5.3%(-0.385)#13,340 |
| 3. | 19380 | 2.4% | 5.0%(-2.67)#1,330 | 5.3%(-2.91)#23,538 |
1
Common Questions
What are the Top Zip Codes with the Highest Percentage of Population Employed in Food Preparation & Serving in West Chester, PA?
Top Zip Codes with the Highest Percentage of Population Employed in Food Preparation & Serving in West Chester, PA are:
What zip code has the Highest Percentage of Population Employed in Food Preparation & Serving in West Chester, PA?
19383 has the Highest Percentage of Population Employed in Food Preparation & Serving in West Chester, PA with 26.2%.
What is the Percentage of Population Employed in Food Preparation & Serving in Pennsylvania?
Percentage of Population Employed in Food Preparation & Serving in Pennsylvania is 5.0%.
What is the Percentage of Population Employed in Food Preparation & Serving in the United States?
Percentage of Population Employed in Food Preparation & Serving in the United States is 5.3%.