Cities with the Highest Percentage of Immigrants from Eastern Africa in Pennsylvania
RELATED REPORTS & OPTIONS
Eastern Africa
Pennsylvania
Compare Cities
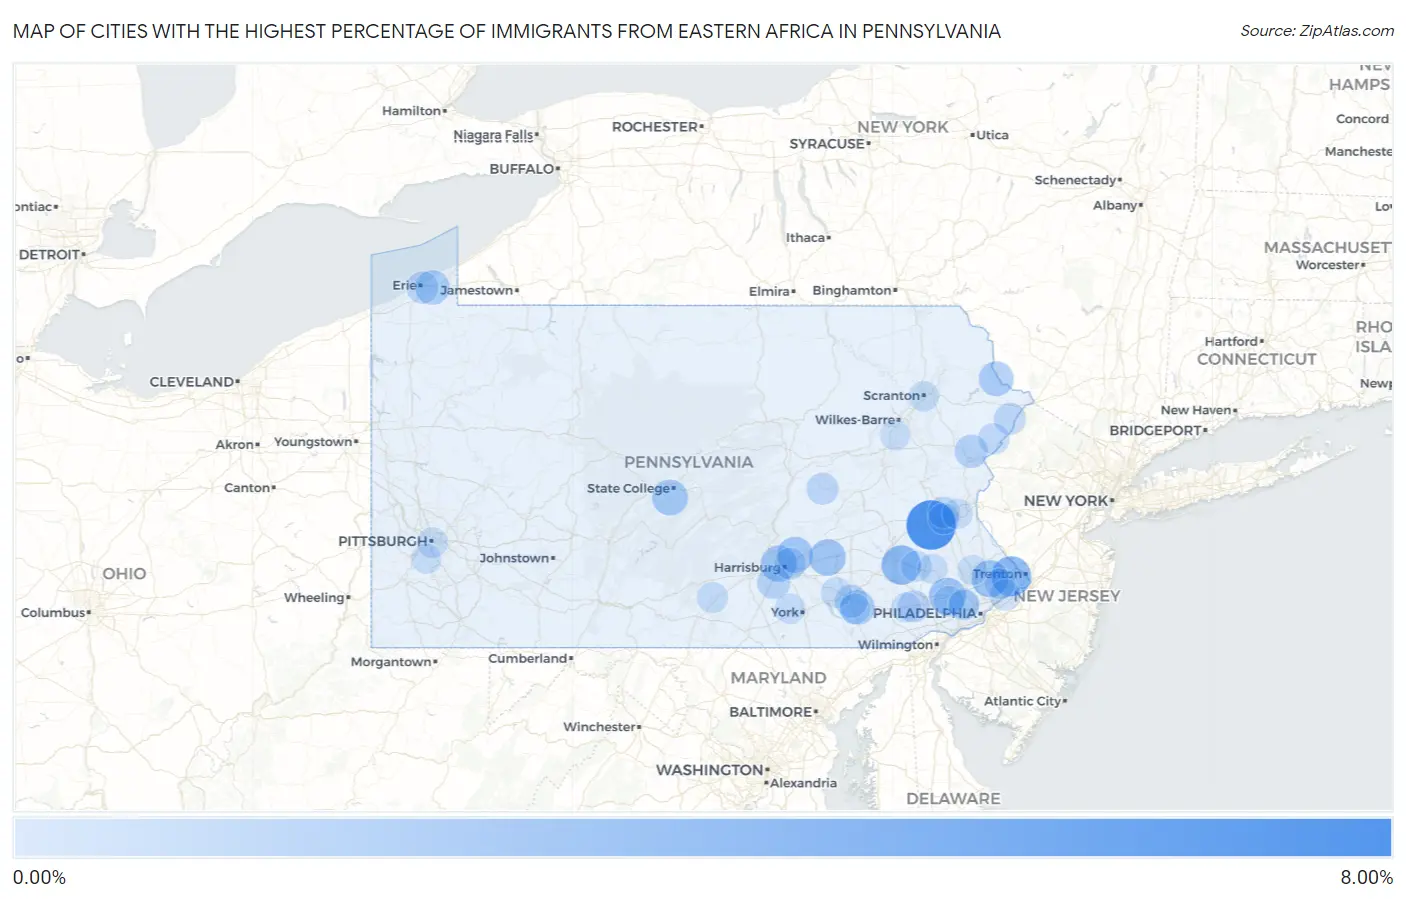
Map of Cities with the Highest Percentage of Immigrants from Eastern Africa in Pennsylvania
0.00%
8.00%
Cities with the Highest Percentage of Immigrants from Eastern Africa in Pennsylvania
| City | Eastern Africa | vs State | vs National | |
| 1. | Trexlertown | 6.74% | 0.12%(+6.62)#-1 | 0.23%(+6.51)#0 |
| 2. | Millbourne Borough | 6.32% | 0.12%(+6.19)#0 | 0.23%(+6.09)#1 |
| 3. | Schwenksville Borough | 5.42% | 0.12%(+5.29)#1 | 0.23%(+5.19)#2 |
| 4. | Woodbourne | 3.46% | 0.12%(+3.34)#2 | 0.23%(+3.24)#3 |
| 5. | Gibraltar | 3.24% | 0.12%(+3.12)#3 | 0.23%(+3.01)#4 |
| 6. | Chalfont Borough | 3.03% | 0.12%(+2.91)#4 | 0.23%(+2.80)#5 |
| 7. | Penbrook Borough | 2.58% | 0.12%(+2.46)#5 | 0.23%(+2.35)#6 |
| 8. | Mount Gretna Borough | 2.54% | 0.12%(+2.42)#6 | 0.23%(+2.31)#7 |
| 9. | Chesterbrook | 2.45% | 0.12%(+2.33)#7 | 0.23%(+2.22)#8 |
| 10. | Warminster Heights | 2.45% | 0.12%(+2.32)#8 | 0.23%(+2.22)#9 |
| 11. | Annville | 2.28% | 0.12%(+2.16)#9 | 0.23%(+2.05)#10 |
| 12. | Hayti | 2.27% | 0.12%(+2.15)#10 | 0.23%(+2.04)#11 |
| 13. | New Britain Borough | 2.18% | 0.12%(+2.06)#11 | 0.23%(+1.95)#12 |
| 14. | Enola | 2.17% | 0.12%(+2.05)#12 | 0.23%(+1.94)#13 |
| 15. | Linglestown | 2.17% | 0.12%(+2.04)#13 | 0.23%(+1.94)#14 |
| 16. | East Lansdowne Borough | 2.07% | 0.12%(+1.95)#14 | 0.23%(+1.84)#15 |
| 17. | Crafton Borough | 2.07% | 0.12%(+1.95)#15 | 0.23%(+1.84)#16 |
| 18. | Pine Grove Mills | 2.06% | 0.12%(+1.93)#16 | 0.23%(+1.83)#17 |
| 19. | Elizabethtown Borough | 1.88% | 0.12%(+1.76)#17 | 0.23%(+1.65)#18 |
| 20. | Lampeter | 1.70% | 0.12%(+1.58)#18 | 0.23%(+1.48)#19 |
| 21. | Masthope | 1.68% | 0.12%(+1.55)#19 | 0.23%(+1.45)#20 |
| 22. | Penn State Erie Behrend | 1.56% | 0.12%(+1.43)#20 | 0.23%(+1.33)#21 |
| 23. | Edwardsville Borough | 1.52% | 0.12%(+1.40)#21 | 0.23%(+1.30)#22 |
| 24. | Dover Borough | 1.51% | 0.12%(+1.39)#22 | 0.23%(+1.28)#23 |
| 25. | Folcroft Borough | 1.26% | 0.12%(+1.14)#23 | 0.23%(+1.03)#24 |
| 26. | Glenmoore | 1.20% | 0.12%(+1.08)#24 | 0.23%(+0.974)#25 |
| 27. | Penn Estates | 1.19% | 0.12%(+1.07)#25 | 0.23%(+0.966)#26 |
| 28. | Adamstown Borough | 1.18% | 0.12%(+1.06)#26 | 0.23%(+0.952)#27 |
| 29. | Messiah College | 1.16% | 0.12%(+1.04)#27 | 0.23%(+0.930)#28 |
| 30. | Ambler Borough | 1.11% | 0.12%(+0.985)#28 | 0.23%(+0.880)#29 |
| 31. | Lancaster | 1.07% | 0.12%(+0.945)#29 | 0.23%(+0.841)#30 |
| 32. | Castle Shannon Borough | 0.97% | 0.12%(+0.844)#30 | 0.23%(+0.739)#31 |
| 33. | Export Borough | 0.94% | 0.12%(+0.818)#31 | 0.23%(+0.713)#32 |
| 34. | Mount Pocono Borough | 0.90% | 0.12%(+0.781)#32 | 0.23%(+0.677)#33 |
| 35. | Thorndale | 0.87% | 0.12%(+0.751)#33 | 0.23%(+0.646)#34 |
| 36. | Shiremanstown Borough | 0.86% | 0.12%(+0.734)#34 | 0.23%(+0.629)#35 |
| 37. | Erie | 0.84% | 0.12%(+0.714)#35 | 0.23%(+0.609)#36 |
| 38. | Yeadon Borough | 0.81% | 0.12%(+0.685)#36 | 0.23%(+0.580)#37 |
| 39. | South Coatesville Borough | 0.80% | 0.12%(+0.677)#37 | 0.23%(+0.572)#38 |
| 40. | Glendon Borough | 0.78% | 0.12%(+0.659)#38 | 0.23%(+0.554)#39 |
| 41. | Newburg Borough Cumberland County | 0.78% | 0.12%(+0.655)#39 | 0.23%(+0.550)#40 |
| 42. | Mont Clare | 0.77% | 0.12%(+0.653)#40 | 0.23%(+0.548)#41 |
| 43. | Langhorne Manor Borough | 0.77% | 0.12%(+0.645)#41 | 0.23%(+0.541)#42 |
| 44. | Shamokin | 0.77% | 0.12%(+0.644)#42 | 0.23%(+0.539)#43 |
| 45. | Birchwood Lakes | 0.73% | 0.12%(+0.611)#43 | 0.23%(+0.506)#44 |
| 46. | Norristown Borough | 0.72% | 0.12%(+0.595)#44 | 0.23%(+0.490)#45 |
| 47. | Bowmanstown Borough | 0.70% | 0.12%(+0.579)#45 | 0.23%(+0.475)#46 |
| 48. | Progress | 0.70% | 0.12%(+0.573)#46 | 0.23%(+0.468)#47 |
| 49. | Fullerton | 0.67% | 0.12%(+0.550)#47 | 0.23%(+0.445)#48 |
| 50. | Shenandoah Borough | 0.65% | 0.12%(+0.531)#48 | 0.23%(+0.426)#49 |
| 51. | Athens Borough | 0.64% | 0.12%(+0.520)#49 | 0.23%(+0.415)#50 |
| 52. | Red Lion Borough | 0.62% | 0.12%(+0.493)#50 | 0.23%(+0.388)#51 |
| 53. | Lansdowne Borough | 0.62% | 0.12%(+0.493)#51 | 0.23%(+0.388)#52 |
| 54. | Sayre Borough | 0.60% | 0.12%(+0.482)#52 | 0.23%(+0.377)#53 |
| 55. | Cornwells Heights | 0.60% | 0.12%(+0.475)#53 | 0.23%(+0.370)#54 |
| 56. | Saw Creek | 0.59% | 0.12%(+0.467)#54 | 0.23%(+0.362)#55 |
| 57. | Wyomissing Borough | 0.57% | 0.12%(+0.447)#55 | 0.23%(+0.342)#56 |
| 58. | Gettysburg Borough | 0.56% | 0.12%(+0.435)#56 | 0.23%(+0.331)#57 |
| 59. | Carlisle Borough | 0.54% | 0.12%(+0.420)#57 | 0.23%(+0.315)#58 |
| 60. | East Prospect Borough | 0.51% | 0.12%(+0.389)#58 | 0.23%(+0.284)#59 |
| 61. | Mount Wolf Borough | 0.50% | 0.12%(+0.379)#59 | 0.23%(+0.274)#60 |
| 62. | Allentown | 0.50% | 0.12%(+0.378)#60 | 0.23%(+0.273)#61 |
| 63. | Darby Borough | 0.50% | 0.12%(+0.374)#61 | 0.23%(+0.269)#62 |
| 64. | Shillington Borough | 0.48% | 0.12%(+0.354)#62 | 0.23%(+0.249)#63 |
| 65. | Amity Gardens | 0.48% | 0.12%(+0.353)#63 | 0.23%(+0.249)#64 |
| 66. | Shippensburg University | 0.47% | 0.12%(+0.345)#64 | 0.23%(+0.241)#65 |
| 67. | Brackenridge Borough | 0.47% | 0.12%(+0.344)#65 | 0.23%(+0.239)#66 |
| 68. | Emlenton Borough | 0.46% | 0.12%(+0.339)#66 | 0.23%(+0.234)#67 |
| 69. | Mount Joy Borough | 0.46% | 0.12%(+0.337)#67 | 0.23%(+0.232)#68 |
| 70. | Jenkintown Borough | 0.43% | 0.12%(+0.303)#68 | 0.23%(+0.198)#69 |
| 71. | Bryn Mawr | 0.42% | 0.12%(+0.295)#69 | 0.23%(+0.190)#70 |
| 72. | Berwyn | 0.41% | 0.12%(+0.283)#70 | 0.23%(+0.178)#71 |
| 73. | Feasterville | 0.41% | 0.12%(+0.283)#71 | 0.23%(+0.178)#72 |
| 74. | Chestnut Hill | 0.40% | 0.12%(+0.278)#72 | 0.23%(+0.173)#73 |
| 75. | Salunga | 0.39% | 0.12%(+0.263)#73 | 0.23%(+0.158)#74 |
| 76. | Willow Street | 0.37% | 0.12%(+0.251)#74 | 0.23%(+0.146)#75 |
| 77. | Downingtown Borough | 0.36% | 0.12%(+0.236)#75 | 0.23%(+0.131)#76 |
| 78. | Weigelstown | 0.35% | 0.12%(+0.225)#76 | 0.23%(+0.120)#77 |
| 79. | Pittsburgh | 0.34% | 0.12%(+0.223)#77 | 0.23%(+0.118)#78 |
| 80. | Haverford College | 0.34% | 0.12%(+0.219)#78 | 0.23%(+0.115)#79 |
| 81. | Rose Valley Borough | 0.34% | 0.12%(+0.215)#79 | 0.23%(+0.110)#80 |
| 82. | Scranton | 0.32% | 0.12%(+0.197)#80 | 0.23%(+0.092)#81 |
| 83. | Rosemont | 0.31% | 0.12%(+0.188)#81 | 0.23%(+0.084)#82 |
| 84. | Baden Borough | 0.31% | 0.12%(+0.186)#82 | 0.23%(+0.081)#83 |
| 85. | Baldwin Borough | 0.28% | 0.12%(+0.155)#83 | 0.23%(+0.050)#84 |
| 86. | Mountain Top | 0.25% | 0.12%(+0.132)#84 | 0.23%(+0.027)#85 |
| 87. | Deer Lake Borough | 0.25% | 0.12%(+0.129)#85 | 0.23%(+0.024)#86 |
| 88. | St. Davids | 0.25% | 0.12%(+0.125)#86 | 0.23%(+0.020)#87 |
| 89. | Bethlehem | 0.25% | 0.12%(+0.125)#87 | 0.23%(+0.020)#88 |
| 90. | Brentwood Borough | 0.24% | 0.12%(+0.118)#88 | 0.23%(+0.013)#89 |
| 91. | Pleasant Hills Borough | 0.24% | 0.12%(+0.114)#89 | 0.23%(+0.009)#90 |
| 92. | Plum Borough | 0.22% | 0.12%(+0.096)#90 | 0.23%(-0.009)#91 |
| 93. | Bethel Park | 0.21% | 0.12%(+0.091)#91 | 0.23%(-0.014)#92 |
| 94. | Coatesville | 0.20% | 0.12%(+0.080)#92 | 0.23%(-0.024)#93 |
| 95. | Montgomeryville | 0.20% | 0.12%(+0.078)#93 | 0.23%(-0.027)#94 |
| 96. | Emsworth Borough | 0.20% | 0.12%(+0.076)#94 | 0.23%(-0.029)#95 |
| 97. | Sanatoga | 0.19% | 0.12%(+0.070)#95 | 0.23%(-0.035)#96 |
| 98. | Langhorne Borough | 0.19% | 0.12%(+0.068)#96 | 0.23%(-0.037)#97 |
| 99. | East Washington Borough | 0.18% | 0.12%(+0.054)#97 | 0.23%(-0.051)#98 |
| 100. | Williamstown Borough | 0.17% | 0.12%(+0.050)#98 | 0.23%(-0.055)#99 |
Common Questions
What are the Top 10 Cities with the Highest Percentage of Immigrants from Eastern Africa in Pennsylvania?
Top 10 Cities with the Highest Percentage of Immigrants from Eastern Africa in Pennsylvania are:
#1
6.74%
#2
3.46%
#3
3.24%
#4
2.45%
#5
2.45%
#6
2.28%
#7
2.17%
#8
2.17%
#9
2.06%
#10
1.70%
What city has the Highest Percentage of Immigrants from Eastern Africa in Pennsylvania?
Trexlertown has the Highest Percentage of Immigrants from Eastern Africa in Pennsylvania with 6.74%.
What is the Percentage of Immigrants from Eastern Africa in the State of Pennsylvania?
Percentage of Immigrants from Eastern Africa in Pennsylvania is 0.12%.
What is the Percentage of Immigrants from Eastern Africa in the United States?
Percentage of Immigrants from Eastern Africa in the United States is 0.23%.