Penn State Erie Behrend, PA Map & Demographics
Penn State Erie Behrend Map
Penn State Erie Behrend Overview
$4,326
PER CAPITA INCOME
28.0%
WAGE / INCOME GAP [ % ]
72.0¢/ $1
WAGE / INCOME GAP [ $ ]
1,543
TOTAL POPULATION
866
MALE POPULATION
677
FEMALE POPULATION
127.92
MALES / 100 FEMALES
78.18
FEMALES / 100 MALES
19.6
MEDIAN AGE
580
LABOR FORCE [ PEOPLE ]
37.6%
PERCENT IN LABOR FORCE
14.7%
UNEMPLOYMENT RATE
Income in Penn State Erie Behrend
Income Overview in Penn State Erie Behrend
| Characteristic | Number | Measure |
| Per Capita Income | 1,543 | $4,326 |
| Median Family Income | 0 | $0 |
| Mean Family Income | 0 | $0 |
| Median Household Income | 0 | $0 |
| Mean Household Income | 0 | $0 |
| Income Deficit | 0 | $0 |
| Wage / Income Gap (%) | 1,543 | 27.96% |
| Wage / Income Gap ($) | 1,543 | 72.04¢ per $1 |
| Gini / Inequality Index | 1,543 | 0.00 |
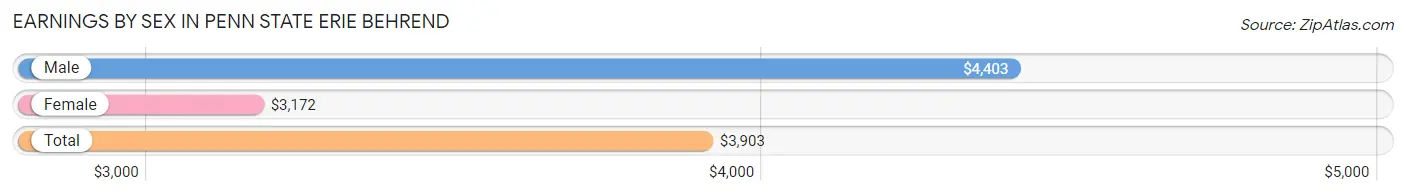
Earnings by Sex in Penn State Erie Behrend
Average Earnings in Penn State Erie Behrend are $3,903, $4,403 for men and $3,172 for women, a difference of 28.0%.
| Sex | Number | Average Earnings |
| Male | 546 (53.5%) | $4,403 |
| Female | 475 (46.5%) | $3,172 |
| Total | 1,021 (100.0%) | $3,903 |
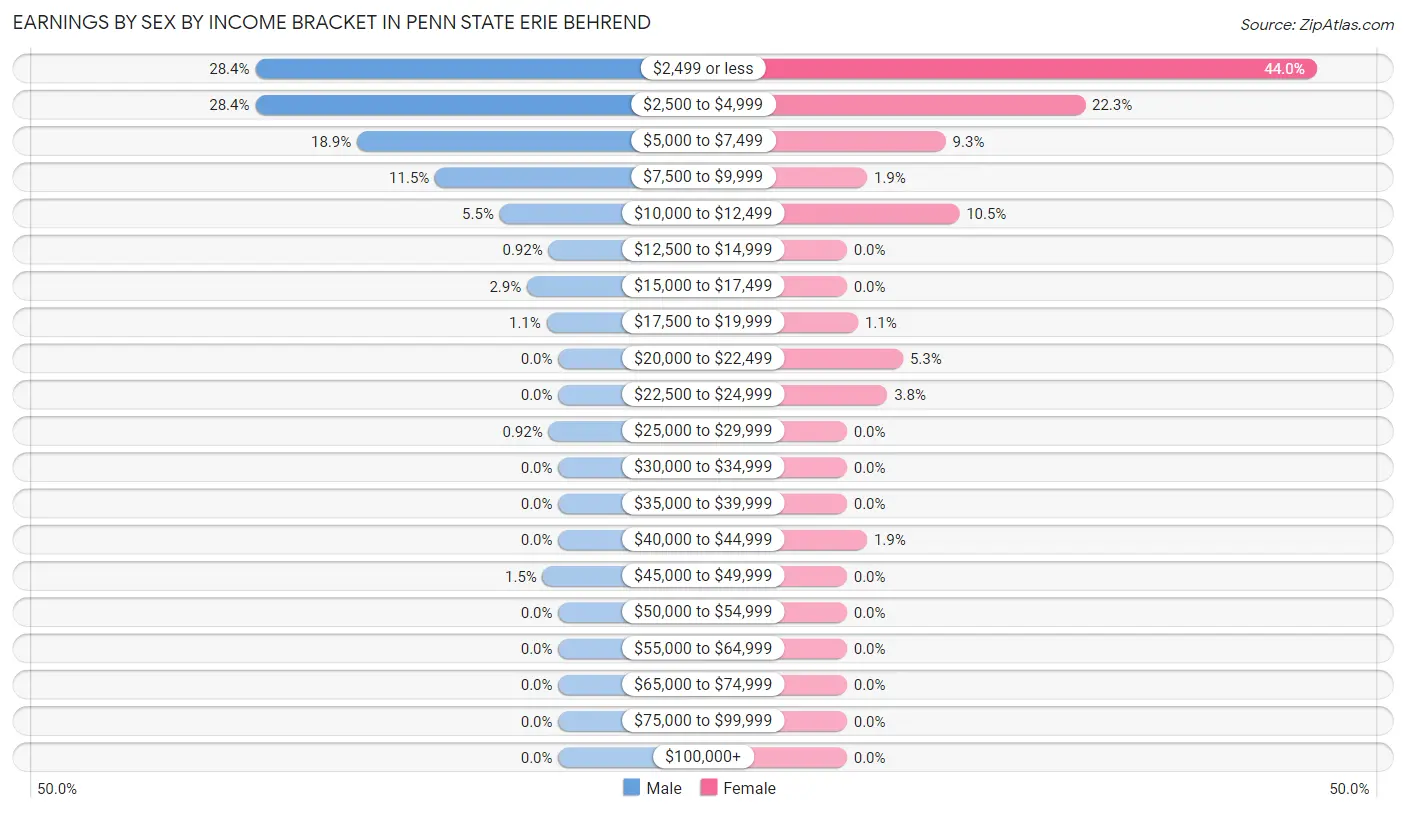
Earnings by Sex by Income Bracket in Penn State Erie Behrend
The most common earnings brackets in Penn State Erie Behrend are $2,499 or less for men (155 | 28.4%) and $2,499 or less for women (209 | 44.0%).
| Income | Male | Female |
| $2,499 or less | 155 (28.4%) | 209 (44.0%) |
| $2,500 to $4,999 | 155 (28.4%) | 106 (22.3%) |
| $5,000 to $7,499 | 103 (18.9%) | 44 (9.3%) |
| $7,500 to $9,999 | 63 (11.5%) | 9 (1.9%) |
| $10,000 to $12,499 | 30 (5.5%) | 50 (10.5%) |
| $12,500 to $14,999 | 5 (0.9%) | 0 (0.0%) |
| $15,000 to $17,499 | 16 (2.9%) | 0 (0.0%) |
| $17,500 to $19,999 | 6 (1.1%) | 5 (1.1%) |
| $20,000 to $22,499 | 0 (0.0%) | 25 (5.3%) |
| $22,500 to $24,999 | 0 (0.0%) | 18 (3.8%) |
| $25,000 to $29,999 | 5 (0.9%) | 0 (0.0%) |
| $30,000 to $34,999 | 0 (0.0%) | 0 (0.0%) |
| $35,000 to $39,999 | 0 (0.0%) | 0 (0.0%) |
| $40,000 to $44,999 | 0 (0.0%) | 9 (1.9%) |
| $45,000 to $49,999 | 8 (1.5%) | 0 (0.0%) |
| $50,000 to $54,999 | 0 (0.0%) | 0 (0.0%) |
| $55,000 to $64,999 | 0 (0.0%) | 0 (0.0%) |
| $65,000 to $74,999 | 0 (0.0%) | 0 (0.0%) |
| $75,000 to $99,999 | 0 (0.0%) | 0 (0.0%) |
| $100,000+ | 0 (0.0%) | 0 (0.0%) |
| Total | 546 (100.0%) | 475 (100.0%) |
Earnings by Sex by Educational Attainment in Penn State Erie Behrend
| Educational Attainment | Male Income | Female Income |
| Less than High School | - | - |
| High School Diploma | - | - |
| College or Associate's Degree | - | - |
| Bachelor's Degree | - | - |
| Graduate Degree | - | - |
| Total | - | - |
Family Income in Penn State Erie Behrend
Family Income Brackets in Penn State Erie Behrend
| Income Bracket | # Families | % Families |
| Less than $10,000 | 0 | 0.0% |
| $10,000 to $14,999 | 0 | 0.0% |
| $15,000 to $24,999 | 0 | 0.0% |
| $25,000 to $34,999 | 0 | 0.0% |
| $35,000 to $49,999 | 0 | 0.0% |
| $50,000 to $74,999 | 0 | 0.0% |
| $75,000 to $99,999 | 0 | 0.0% |
| $100,000 to $149,999 | 0 | 0.0% |
| $150,000 to $199,999 | 0 | 0.0% |
| $200,000+ | 0 | 0.0% |
Family Income by Famaliy Size in Penn State Erie Behrend
| Income Bracket | # Families | Median Income |
| 2-Person Families | 0 (0.0%) | $0 |
| 3-Person Families | 0 (0.0%) | $0 |
| 4-Person Families | 0 (0.0%) | $0 |
| 5-Person Families | 0 (0.0%) | $0 |
| 6-Person Families | 0 (0.0%) | $0 |
| 7+ Person Families | 0 (0.0%) | $0 |
| Total | 0 (0.0%) | $0 |
Family Income by Number of Earners in Penn State Erie Behrend
| Number of Earners | # Families | Median Income |
| No Earners | 0 (0.0%) | $0 |
| 1 Earner | 0 (0.0%) | $0 |
| 2 Earners | 0 (0.0%) | $0 |
| 3+ Earners | 0 (0.0%) | $0 |
| Total | 0 (0.0%) | $0 |
Household Income in Penn State Erie Behrend
Household Income Brackets in Penn State Erie Behrend
| Income Bracket | # Households | % Households |
| Less than $10,000 | 0 | 0.0% |
| $10,000 to $14,999 | 0 | 0.0% |
| $15,000 to $24,999 | 0 | 0.0% |
| $25,000 to $34,999 | 0 | 0.0% |
| $35,000 to $49,999 | 0 | 0.0% |
| $50,000 to $74,999 | 0 | 0.0% |
| $75,000 to $99,999 | 0 | 0.0% |
| $100,000 to $149,999 | 0 | 0.0% |
| $150,000 to $199,999 | 0 | 0.0% |
| $200,000+ | 0 | 0.0% |
Household Income by Householder Age in Penn State Erie Behrend
| Income Bracket | # Households | Median Income |
| 15 to 24 Years | 0 (0.0%) | $0 |
| 25 to 44 Years | 0 (0.0%) | $0 |
| 45 to 64 Years | 0 (0.0%) | $0 |
| 65+ Years | 0 (0.0%) | $0 |
| Total | 0 (0.0%) | $0 |
Poverty in Penn State Erie Behrend
Income Below Poverty by Sex and Age in Penn State Erie Behrend
| Age Bracket | Male | Female |
| Under 5 Years | 0 (0.0%) | 0 (0.0%) |
| 5 Years | 0 (0.0%) | 0 (0.0%) |
| 6 to 11 Years | 0 (0.0%) | 0 (0.0%) |
| 12 to 14 Years | 0 (0.0%) | 0 (0.0%) |
| 15 Years | 0 (0.0%) | 0 (0.0%) |
| 16 and 17 Years | 0 (0.0%) | 0 (0.0%) |
| 18 to 24 Years | 0 (0.0%) | 0 (0.0%) |
| 25 to 34 Years | 0 (0.0%) | 0 (0.0%) |
| 35 to 44 Years | 0 (0.0%) | 0 (0.0%) |
| 45 to 54 Years | 0 (0.0%) | 0 (0.0%) |
| 55 to 64 Years | 0 (0.0%) | 0 (0.0%) |
| 65 to 74 Years | 0 (0.0%) | 0 (0.0%) |
| 75 Years and over | 0 (0.0%) | 0 (0.0%) |
| Total | 0 (0.0%) | 0 (0.0%) |
Income Above Poverty by Sex and Age in Penn State Erie Behrend
| Age Bracket | Male | Female |
| Under 5 Years | 0 (0.0%) | 0 (0.0%) |
| 5 Years | 0 (0.0%) | 0 (0.0%) |
| 6 to 11 Years | 0 (0.0%) | 0 (0.0%) |
| 12 to 14 Years | 0 (0.0%) | 0 (0.0%) |
| 15 Years | 0 (0.0%) | 0 (0.0%) |
| 16 and 17 Years | 0 (0.0%) | 0 (0.0%) |
| 18 to 24 Years | 0 (0.0%) | 0 (0.0%) |
| 25 to 34 Years | 0 (0.0%) | 0 (0.0%) |
| 35 to 44 Years | 0 (0.0%) | 0 (0.0%) |
| 45 to 54 Years | 0 (0.0%) | 0 (0.0%) |
| 55 to 64 Years | 0 (0.0%) | 0 (0.0%) |
| 65 to 74 Years | 0 (0.0%) | 0 (0.0%) |
| 75 Years and over | 0 (0.0%) | 0 (0.0%) |
| Total | 0 (0.0%) | 0 (0.0%) |
Income Below Poverty Among Married-Couple Families in Penn State Erie Behrend
| Children | Above Poverty | Below Poverty |
| No Children | 0 (0.0%) | 0 (0.0%) |
| 1 or 2 Children | 0 (0.0%) | 0 (0.0%) |
| 3 or 4 Children | 0 (0.0%) | 0 (0.0%) |
| 5 or more Children | 0 (0.0%) | 0 (0.0%) |
| Total | 0 (0.0%) | 0 (0.0%) |
Income Below Poverty Among Single-Parent Households in Penn State Erie Behrend
| Children | Single Father | Single Mother |
| No Children | 0 (0.0%) | 0 (0.0%) |
| 1 or 2 Children | 0 (0.0%) | 0 (0.0%) |
| 3 or 4 Children | 0 (0.0%) | 0 (0.0%) |
| 5 or more Children | 0 (0.0%) | 0 (0.0%) |
| Total | 0 (0.0%) | 0 (0.0%) |
Income Below Poverty Among Married-Couple vs Single-Parent Households in Penn State Erie Behrend
| Children | Married-Couple Families | Single-Parent Households |
| No Children | 0 (0.0%) | 0 (0.0%) |
| 1 or 2 Children | 0 (0.0%) | 0 (0.0%) |
| 3 or 4 Children | 0 (0.0%) | 0 (0.0%) |
| 5 or more Children | 0 (0.0%) | 0 (0.0%) |
| Total | 0 (0.0%) | 0 (0.0%) |
Race in Penn State Erie Behrend
The most populous races in Penn State Erie Behrend are White / Caucasian (1,207 | 78.2%), Asian (171 | 11.1%), and Black / African American (111 | 7.2%).
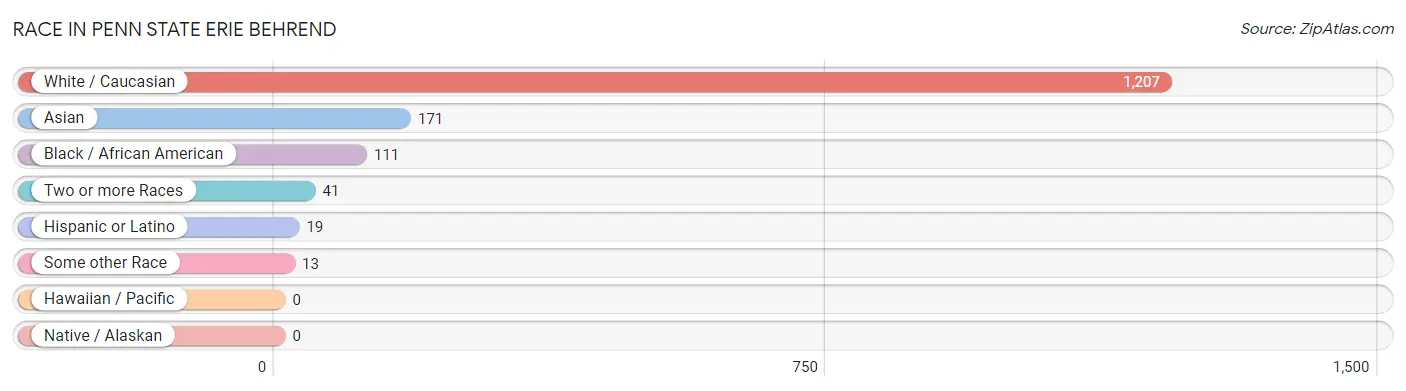
| Race | # Population | % Population |
| Asian | 171 | 11.1% |
| Black / African American | 111 | 7.2% |
| Hawaiian / Pacific | 0 | 0.0% |
| Hispanic or Latino | 19 | 1.2% |
| Native / Alaskan | 0 | 0.0% |
| White / Caucasian | 1,207 | 78.2% |
| Two or more Races | 41 | 2.7% |
| Some other Race | 13 | 0.8% |
| Total | 1,543 | 100.0% |
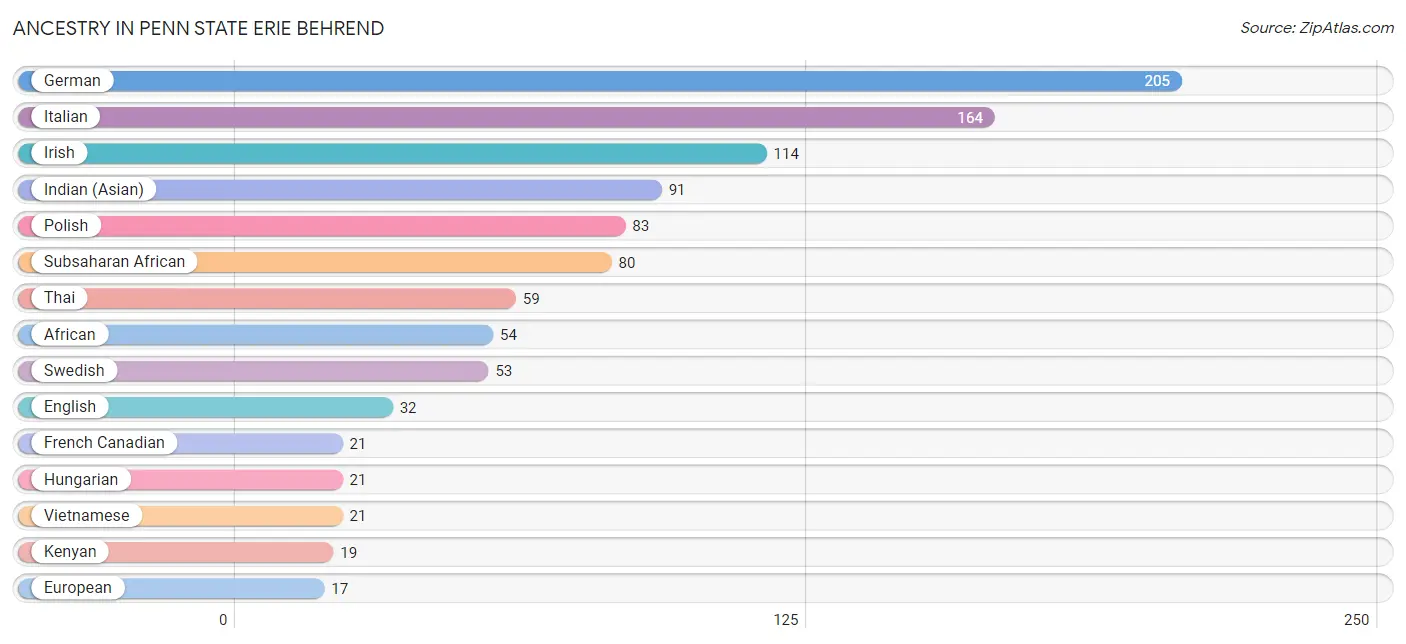
Ancestry in Penn State Erie Behrend
The most populous ancestries reported in Penn State Erie Behrend are German (205 | 13.3%), Italian (164 | 10.6%), Irish (114 | 7.4%), Indian (Asian) (91 | 5.9%), and Polish (83 | 5.4%), together accounting for 42.6% of all Penn State Erie Behrend residents.
| Ancestry | # Population | % Population |
| African | 54 | 3.5% |
| American | 14 | 0.9% |
| Arab | 12 | 0.8% |
| Bhutanese | 3 | 0.2% |
| Brazilian | 8 | 0.5% |
| British | 10 | 0.6% |
| Canadian | 5 | 0.3% |
| Central American Indian | 3 | 0.2% |
| Czechoslovakian | 7 | 0.4% |
| Eastern European | 2 | 0.1% |
| English | 32 | 2.1% |
| European | 17 | 1.1% |
| Filipino | 2 | 0.1% |
| French | 2 | 0.1% |
| French Canadian | 21 | 1.4% |
| German | 205 | 13.3% |
| Guamanian / Chamorro | 4 | 0.3% |
| Hungarian | 21 | 1.4% |
| Indian (Asian) | 91 | 5.9% |
| Irish | 114 | 7.4% |
| Italian | 164 | 10.6% |
| Kenyan | 19 | 1.2% |
| Korean | 6 | 0.4% |
| Lebanese | 12 | 0.8% |
| Macedonian | 5 | 0.3% |
| Mexican | 3 | 0.2% |
| Mongolian | 2 | 0.1% |
| Nigerian | 7 | 0.4% |
| Polish | 83 | 5.4% |
| Puerto Rican | 6 | 0.4% |
| Russian | 12 | 0.8% |
| Scandinavian | 10 | 0.6% |
| Slovak | 4 | 0.3% |
| Sri Lankan | 8 | 0.5% |
| Subsaharan African | 80 | 5.2% |
| Swedish | 53 | 3.4% |
| Swiss | 2 | 0.1% |
| Thai | 59 | 3.8% |
| U.S. Virgin Islander | 11 | 0.7% |
| Ukrainian | 9 | 0.6% |
| Vietnamese | 21 | 1.4% |
| Welsh | 12 | 0.8% | View All 42 Rows |
Immigrants in Penn State Erie Behrend
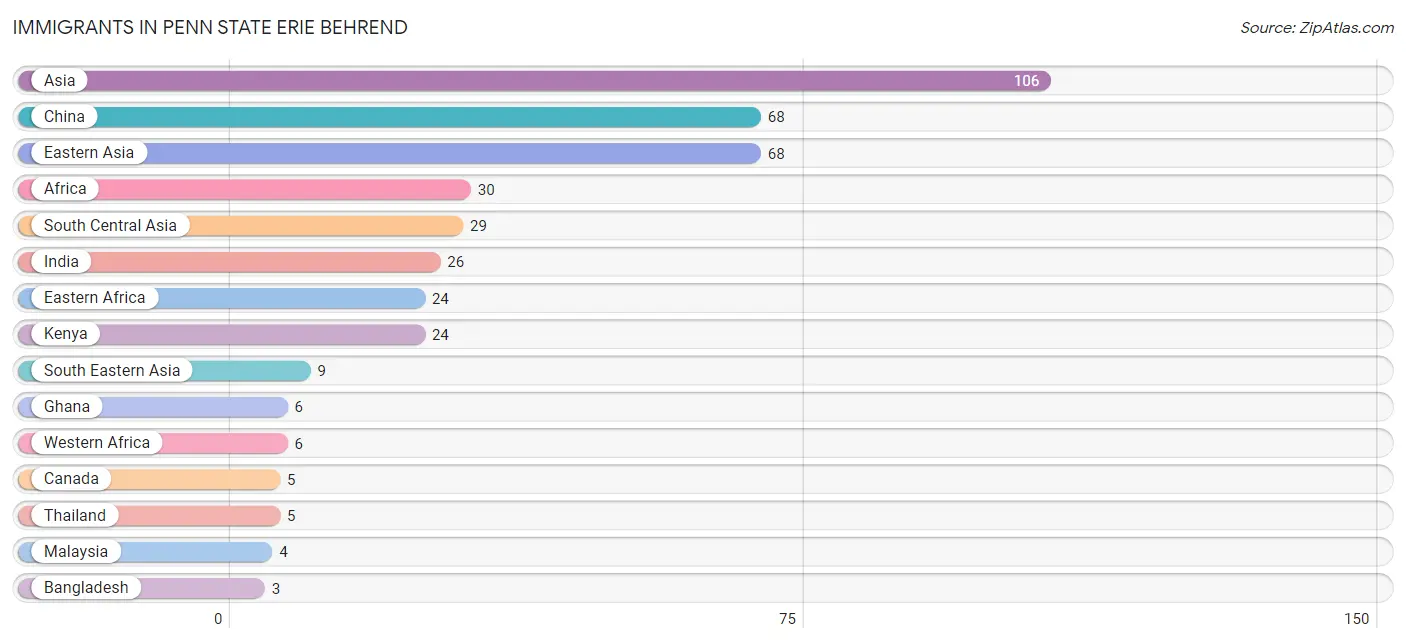
The most numerous immigrant groups reported in Penn State Erie Behrend came from Asia (106 | 6.9%), China (68 | 4.4%), Eastern Asia (68 | 4.4%), Africa (30 | 1.9%), and South Central Asia (29 | 1.9%), together accounting for 19.5% of all Penn State Erie Behrend residents.
| Immigration Origin | # Population | % Population |
| Africa | 30 | 1.9% |
| Asia | 106 | 6.9% |
| Bangladesh | 3 | 0.2% |
| Canada | 5 | 0.3% |
| China | 68 | 4.4% |
| Eastern Africa | 24 | 1.6% |
| Eastern Asia | 68 | 4.4% |
| Ghana | 6 | 0.4% |
| India | 26 | 1.7% |
| Kenya | 24 | 1.6% |
| Malaysia | 4 | 0.3% |
| South Central Asia | 29 | 1.9% |
| South Eastern Asia | 9 | 0.6% |
| Thailand | 5 | 0.3% |
| Western Africa | 6 | 0.4% | View All 15 Rows |
Sex and Age in Penn State Erie Behrend
Sex and Age in Penn State Erie Behrend
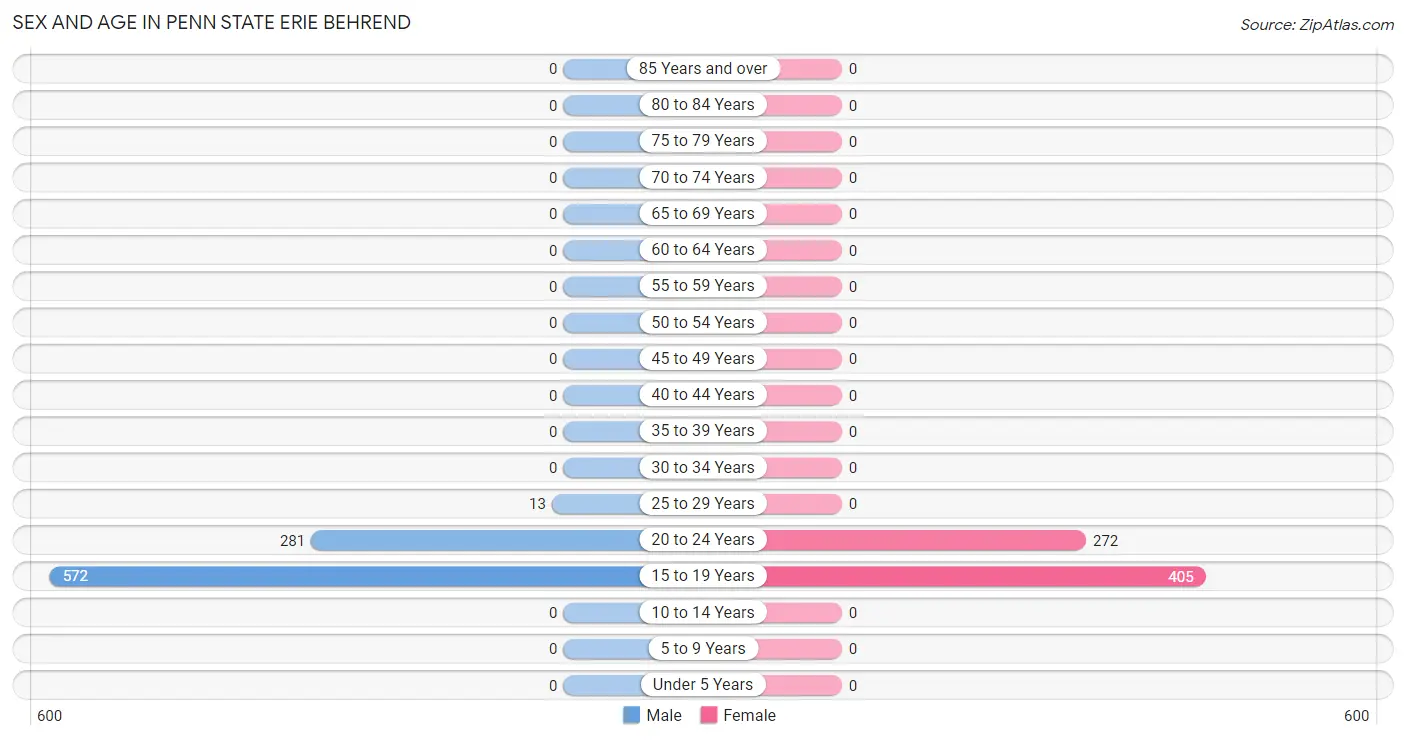
The most populous age groups in Penn State Erie Behrend are 15 to 19 Years (572 | 66.0%) for men and 15 to 19 Years (405 | 59.8%) for women.
| Age Bracket | Male | Female |
| Under 5 Years | 0 (0.0%) | 0 (0.0%) |
| 5 to 9 Years | 0 (0.0%) | 0 (0.0%) |
| 10 to 14 Years | 0 (0.0%) | 0 (0.0%) |
| 15 to 19 Years | 572 (66.0%) | 405 (59.8%) |
| 20 to 24 Years | 281 (32.5%) | 272 (40.2%) |
| 25 to 29 Years | 13 (1.5%) | 0 (0.0%) |
| 30 to 34 Years | 0 (0.0%) | 0 (0.0%) |
| 35 to 39 Years | 0 (0.0%) | 0 (0.0%) |
| 40 to 44 Years | 0 (0.0%) | 0 (0.0%) |
| 45 to 49 Years | 0 (0.0%) | 0 (0.0%) |
| 50 to 54 Years | 0 (0.0%) | 0 (0.0%) |
| 55 to 59 Years | 0 (0.0%) | 0 (0.0%) |
| 60 to 64 Years | 0 (0.0%) | 0 (0.0%) |
| 65 to 69 Years | 0 (0.0%) | 0 (0.0%) |
| 70 to 74 Years | 0 (0.0%) | 0 (0.0%) |
| 75 to 79 Years | 0 (0.0%) | 0 (0.0%) |
| 80 to 84 Years | 0 (0.0%) | 0 (0.0%) |
| 85 Years and over | 0 (0.0%) | 0 (0.0%) |
| Total | 866 (100.0%) | 677 (100.0%) |
Families and Households in Penn State Erie Behrend
Median Family Size in Penn State Erie Behrend
| Family Type | # Families | Family Size |
| Married-Couple | 0 (0.0%) | - |
| Single Male/Father | 0 (0.0%) | - |
| Single Female/Mother | 0 (0.0%) | - |
| Total Families | 0 (0.0%) | - |
Median Household Size in Penn State Erie Behrend
| Household Type | # Households | Household Size |
| Married-Couple | 0 (0.0%) | - |
| Single Male/Father | 0 (0.0%) | - |
| Single Female/Mother | 0 (0.0%) | - |
| Non-family | 0 (0.0%) | - |
| Total Households | 0 (0.0%) | - |
Household Size by Marriage Status in Penn State Erie Behrend
| Household Size | Family Households | Nonfamily Households |
| 1-Person Households | - | 0 (0.0%) |
| 2-Person Households | 0 (0.0%) | 0 (0.0%) |
| 3-Person Households | 0 (0.0%) | 0 (0.0%) |
| 4-Person Households | 0 (0.0%) | 0 (0.0%) |
| 5-Person Households | 0 (0.0%) | 0 (0.0%) |
| 6-Person Households | 0 (0.0%) | 0 (0.0%) |
| 7+ Person Households | 0 (0.0%) | 0 (0.0%) |
| Total | 0 (0.0%) | 0 (0.0%) |
Female Fertility in Penn State Erie Behrend
Fertility by Age in Penn State Erie Behrend
| Age Bracket | Women with Births | Births / 1,000 Women |
| 15 to 19 years | 0 (0.0%) | 0.0 |
| 20 to 34 years | 0 (0.0%) | 0.0 |
| 35 to 50 years | 0 (0.0%) | 0.0 |
| Total | 0 (0.0%) | 0.0 |
Fertility by Age by Marriage Status in Penn State Erie Behrend
| Age Bracket | Married | Unmarried |
| 15 to 19 years | 0 (0.0%) | 0 (0.0%) |
| 20 to 34 years | 0 (0.0%) | 0 (0.0%) |
| 35 to 50 years | 0 (0.0%) | 0 (0.0%) |
| Total | 0 (0.0%) | 0 (0.0%) |
Fertility by Education in Penn State Erie Behrend
| Educational Attainment | Women with Births | Births / 1,000 Women |
| Less than High School | 0 (0.0%) | 0.0 |
| High School Diploma | 0 (0.0%) | 0.0 |
| College or Associate's Degree | 0 (0.0%) | 0.0 |
| Bachelor's Degree | 0 (0.0%) | 0.0 |
| Graduate Degree | 0 (0.0%) | 0.0 |
| Total | 0 (0.0%) | 0.0 |
Fertility by Education by Marriage Status in Penn State Erie Behrend
| Educational Attainment | Married | Unmarried |
| Less than High School | 0 (0.0%) | 0 (0.0%) |
| High School Diploma | 0 (0.0%) | 0 (0.0%) |
| College or Associate's Degree | 0 (0.0%) | 0 (0.0%) |
| Bachelor's Degree | 0 (0.0%) | 0 (0.0%) |
| Graduate Degree | 0 (0.0%) | 0 (0.0%) |
| Total | 0 (0.0%) | 0 (0.0%) |
Employment Characteristics in Penn State Erie Behrend
Employment by Class of Employer in Penn State Erie Behrend
Among the 421 employed individuals in Penn State Erie Behrend, private company employees (292 | 69.4%), not-for-profit organizations (39 | 9.3%), and state government employees (37 | 8.8%) make up the most common classes of employment.
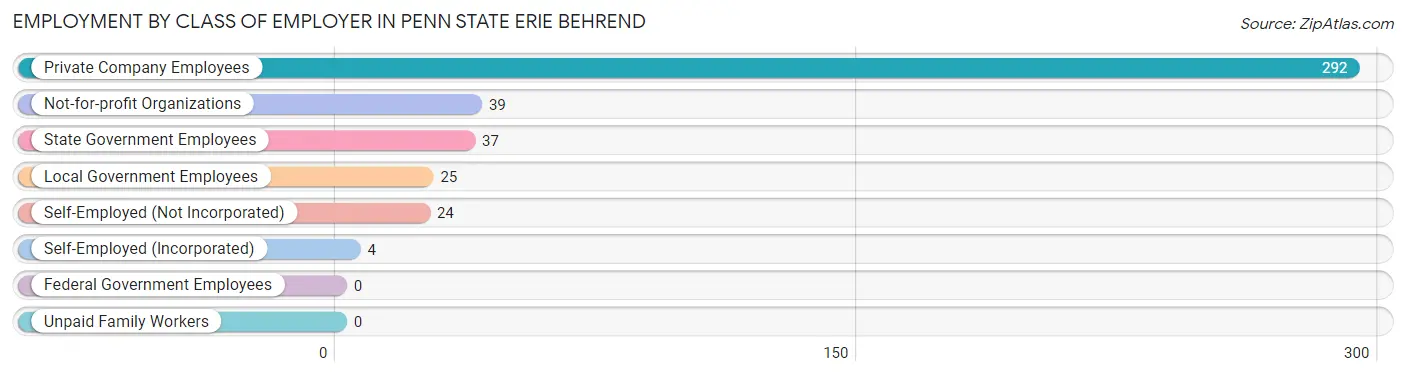
| Employer Class | # Employees | % Employees |
| Private Company Employees | 292 | 69.4% |
| Self-Employed (Incorporated) | 4 | 0.9% |
| Self-Employed (Not Incorporated) | 24 | 5.7% |
| Not-for-profit Organizations | 39 | 9.3% |
| Local Government Employees | 25 | 5.9% |
| State Government Employees | 37 | 8.8% |
| Federal Government Employees | 0 | 0.0% |
| Unpaid Family Workers | 0 | 0.0% |
| Total | 421 | 100.0% |
Employment Status by Age in Penn State Erie Behrend
According to the labor force statistics for Penn State Erie Behrend, out of the total population over 16 years of age (1,543), 37.6% or 580 individuals are in the labor force, with 14.7% or 85 of them unemployed. The age group with the highest labor force participation rate is 25 to 29 years, with 100.0% or 13 individuals in the labor force. Within the labor force, the 16 to 19 years age range has the highest percentage of unemployed individuals, with 15.2% or 43 of them being unemployed.
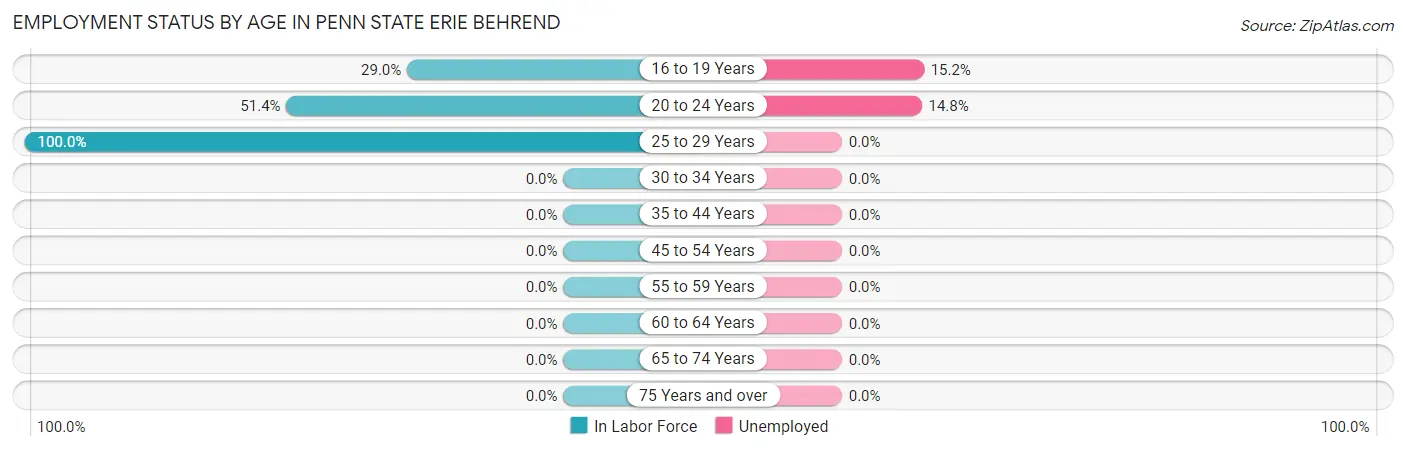
| Age Bracket | In Labor Force | Unemployed |
| 16 to 19 Years | 283 (29.0%) | 43 (15.2%) |
| 20 to 24 Years | 284 (51.4%) | 42 (14.8%) |
| 25 to 29 Years | 13 (100.0%) | 0 (0.0%) |
| 30 to 34 Years | 0 (0.0%) | 0 (0.0%) |
| 35 to 44 Years | 0 (0.0%) | 0 (0.0%) |
| 45 to 54 Years | 0 (0.0%) | 0 (0.0%) |
| 55 to 59 Years | 0 (0.0%) | 0 (0.0%) |
| 60 to 64 Years | 0 (0.0%) | 0 (0.0%) |
| 65 to 74 Years | 0 (0.0%) | 0 (0.0%) |
| 75 Years and over | 0 (0.0%) | 0 (0.0%) |
| Total | 580 (37.6%) | 85 (14.7%) |
Employment Status by Educational Attainment in Penn State Erie Behrend
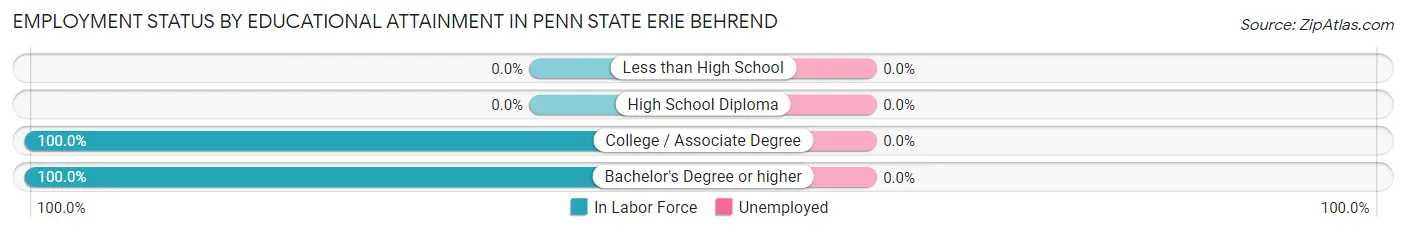
| Educational Attainment | In Labor Force | Unemployed |
| Less than High School | 0 (0.0%) | 0 (0.0%) |
| High School Diploma | 0 (0.0%) | 0 (0.0%) |
| College / Associate Degree | 5 (100.0%) | 0 (0.0%) |
| Bachelor's Degree or higher | 8 (100.0%) | 0 (0.0%) |
| Total | 13 (100.0%) | 0 (0.0%) |
Employment Occupations by Sex in Penn State Erie Behrend
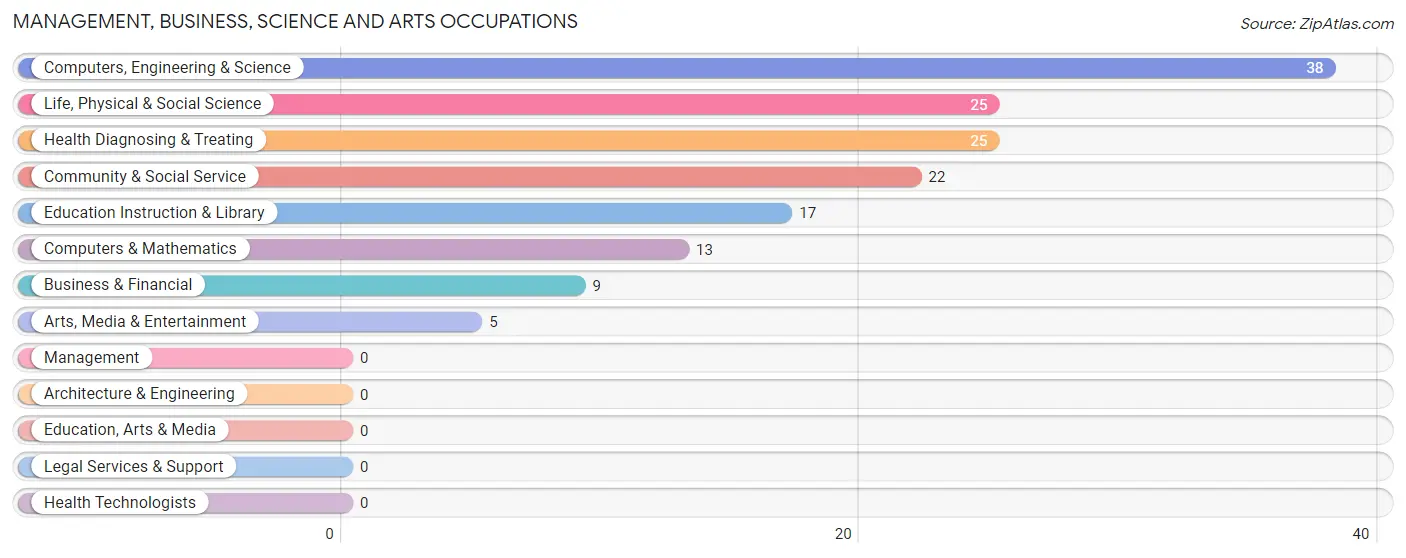
Management, Business, Science and Arts Occupations
The most common Management, Business, Science and Arts occupations in Penn State Erie Behrend are Computers, Engineering & Science (38 | 7.7%), Life, Physical & Social Science (25 | 5.1%), Health Diagnosing & Treating (25 | 5.1%), Community & Social Service (22 | 4.4%), and Education Instruction & Library (17 | 3.4%).
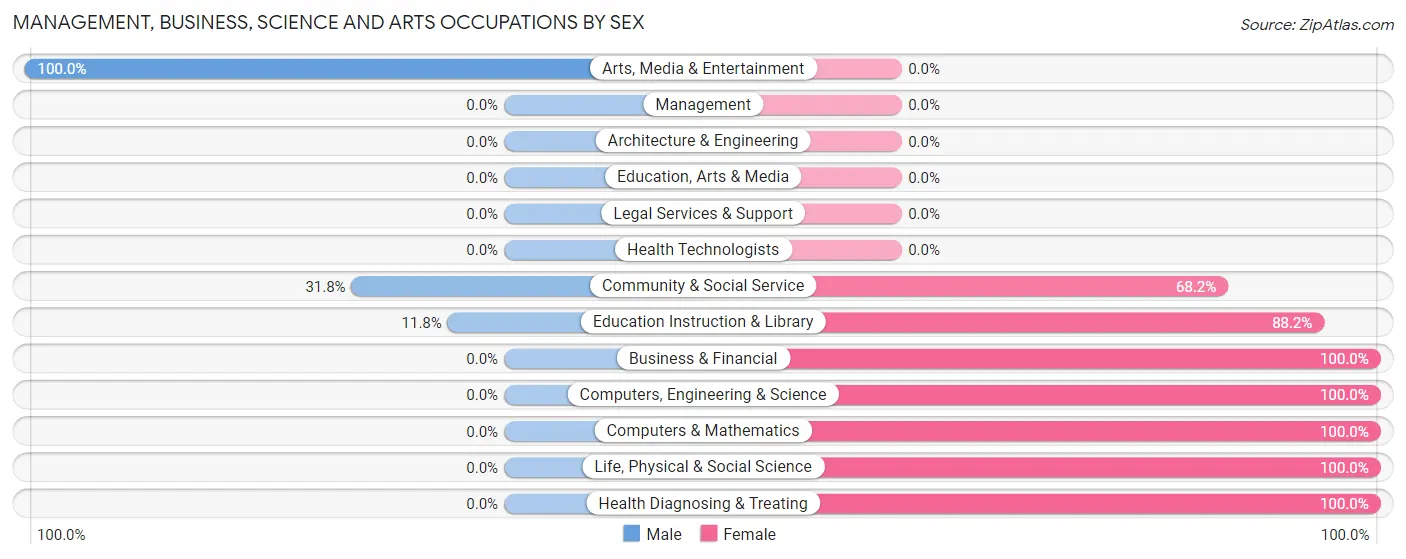
Management, Business, Science and Arts Occupations by Sex
Within the Management, Business, Science and Arts occupations in Penn State Erie Behrend, the most male-oriented occupations are Arts, Media & Entertainment (100.0%), Community & Social Service (31.8%), and Education Instruction & Library (11.8%), while the most female-oriented occupations are Business & Financial (100.0%), Computers, Engineering & Science (100.0%), and Computers & Mathematics (100.0%).
| Occupation | Male | Female |
| Management | 0 (0.0%) | 0 (0.0%) |
| Business & Financial | 0 (0.0%) | 9 (100.0%) |
| Computers, Engineering & Science | 0 (0.0%) | 38 (100.0%) |
| Computers & Mathematics | 0 (0.0%) | 13 (100.0%) |
| Architecture & Engineering | 0 (0.0%) | 0 (0.0%) |
| Life, Physical & Social Science | 0 (0.0%) | 25 (100.0%) |
| Community & Social Service | 7 (31.8%) | 15 (68.2%) |
| Education, Arts & Media | 0 (0.0%) | 0 (0.0%) |
| Legal Services & Support | 0 (0.0%) | 0 (0.0%) |
| Education Instruction & Library | 2 (11.8%) | 15 (88.2%) |
| Arts, Media & Entertainment | 5 (100.0%) | 0 (0.0%) |
| Health Diagnosing & Treating | 0 (0.0%) | 25 (100.0%) |
| Health Technologists | 0 (0.0%) | 0 (0.0%) |
| Total (Category) | 7 (7.4%) | 87 (92.5%) |
| Total (Overall) | 191 (38.6%) | 304 (61.4%) |
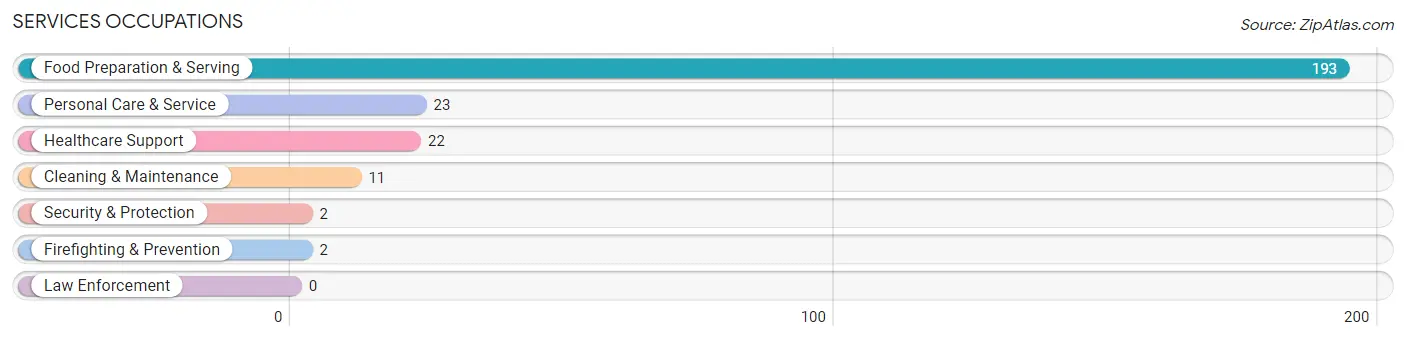
Services Occupations
The most common Services occupations in Penn State Erie Behrend are Food Preparation & Serving (193 | 39.0%), Personal Care & Service (23 | 4.6%), Healthcare Support (22 | 4.4%), Cleaning & Maintenance (11 | 2.2%), and Security & Protection (2 | 0.4%).
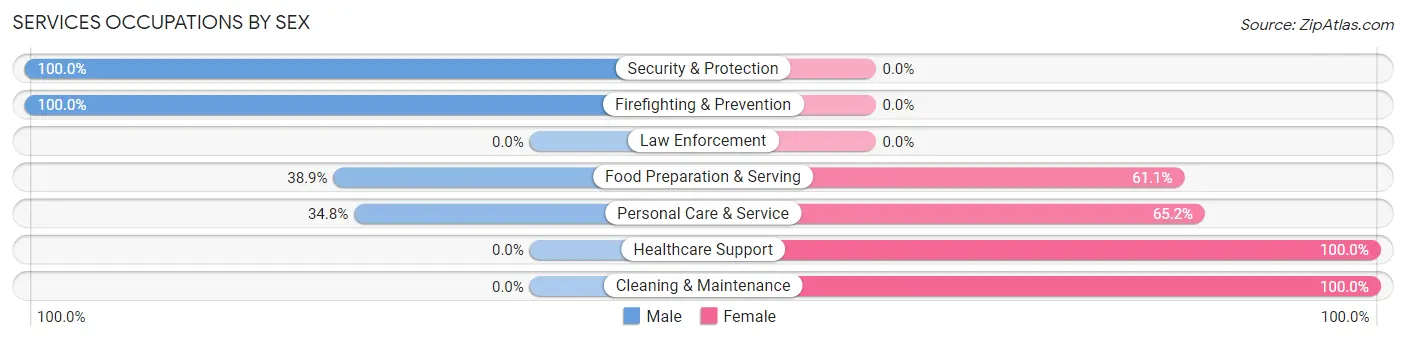
Services Occupations by Sex
Within the Services occupations in Penn State Erie Behrend, the most male-oriented occupations are Security & Protection (100.0%), Firefighting & Prevention (100.0%), and Food Preparation & Serving (38.9%), while the most female-oriented occupations are Healthcare Support (100.0%), Cleaning & Maintenance (100.0%), and Personal Care & Service (65.2%).
| Occupation | Male | Female |
| Healthcare Support | 0 (0.0%) | 22 (100.0%) |
| Security & Protection | 2 (100.0%) | 0 (0.0%) |
| Firefighting & Prevention | 2 (100.0%) | 0 (0.0%) |
| Law Enforcement | 0 (0.0%) | 0 (0.0%) |
| Food Preparation & Serving | 75 (38.9%) | 118 (61.1%) |
| Cleaning & Maintenance | 0 (0.0%) | 11 (100.0%) |
| Personal Care & Service | 8 (34.8%) | 15 (65.2%) |
| Total (Category) | 85 (33.9%) | 166 (66.1%) |
| Total (Overall) | 191 (38.6%) | 304 (61.4%) |
Sales and Office Occupations
The most common Sales and Office occupations in Penn State Erie Behrend are Sales & Related (57 | 11.5%), and Office & Administration (45 | 9.1%).

Sales and Office Occupations by Sex
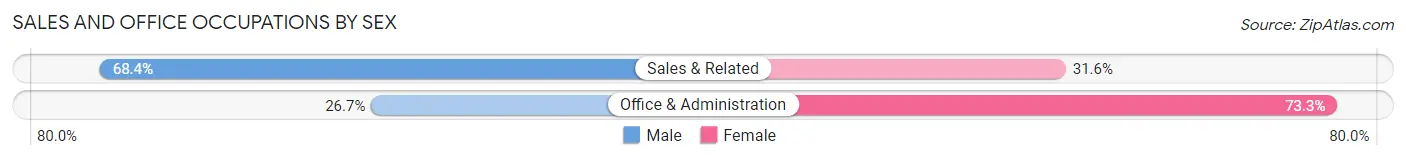
| Occupation | Male | Female |
| Sales & Related | 39 (68.4%) | 18 (31.6%) |
| Office & Administration | 12 (26.7%) | 33 (73.3%) |
| Total (Category) | 51 (50.0%) | 51 (50.0%) |
| Total (Overall) | 191 (38.6%) | 304 (61.4%) |
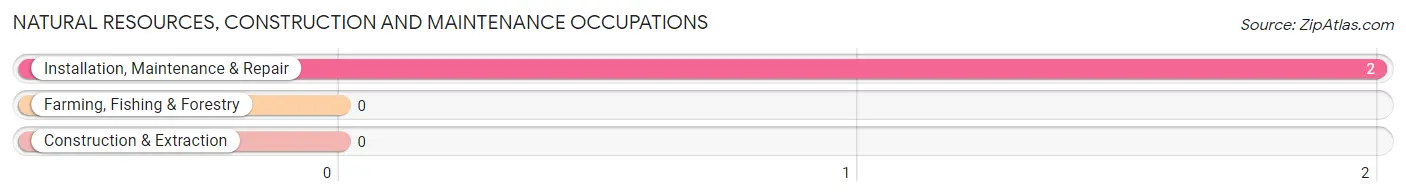
Natural Resources, Construction and Maintenance Occupations
The most common Natural Resources, Construction and Maintenance occupations in Penn State Erie Behrend are , and Installation, Maintenance & Repair (2 | 0.4%).
Natural Resources, Construction and Maintenance Occupations by Sex
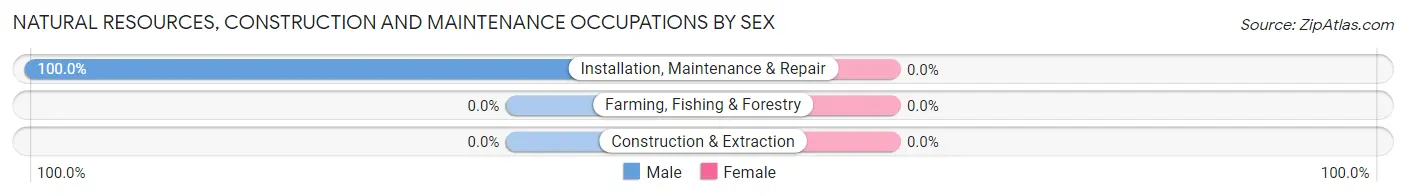
| Occupation | Male | Female |
| Farming, Fishing & Forestry | 0 (0.0%) | 0 (0.0%) |
| Construction & Extraction | 0 (0.0%) | 0 (0.0%) |
| Installation, Maintenance & Repair | 2 (100.0%) | 0 (0.0%) |
| Total (Category) | 2 (100.0%) | 0 (0.0%) |
| Total (Overall) | 191 (38.6%) | 304 (61.4%) |
Production, Transportation and Moving Occupations
The most common Production, Transportation and Moving occupations in Penn State Erie Behrend are Material Moving (33 | 6.7%), Production (9 | 1.8%), and Transportation (4 | 0.8%).
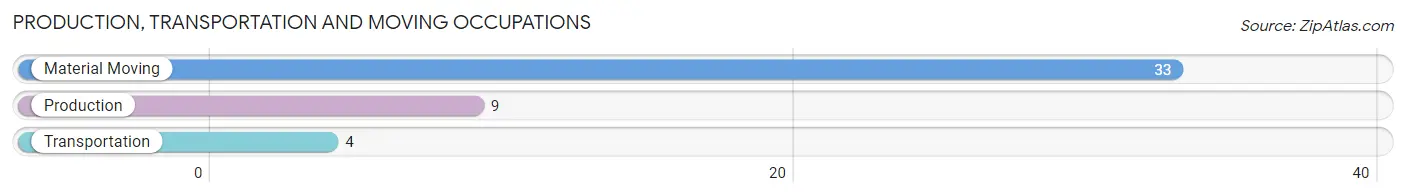
Production, Transportation and Moving Occupations by Sex
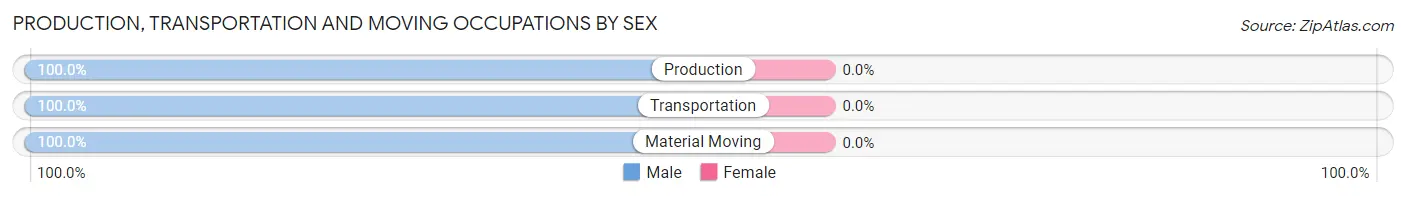
| Occupation | Male | Female |
| Production | 9 (100.0%) | 0 (0.0%) |
| Transportation | 4 (100.0%) | 0 (0.0%) |
| Material Moving | 33 (100.0%) | 0 (0.0%) |
| Total (Category) | 46 (100.0%) | 0 (0.0%) |
| Total (Overall) | 191 (38.6%) | 304 (61.4%) |
Employment Industries by Sex in Penn State Erie Behrend
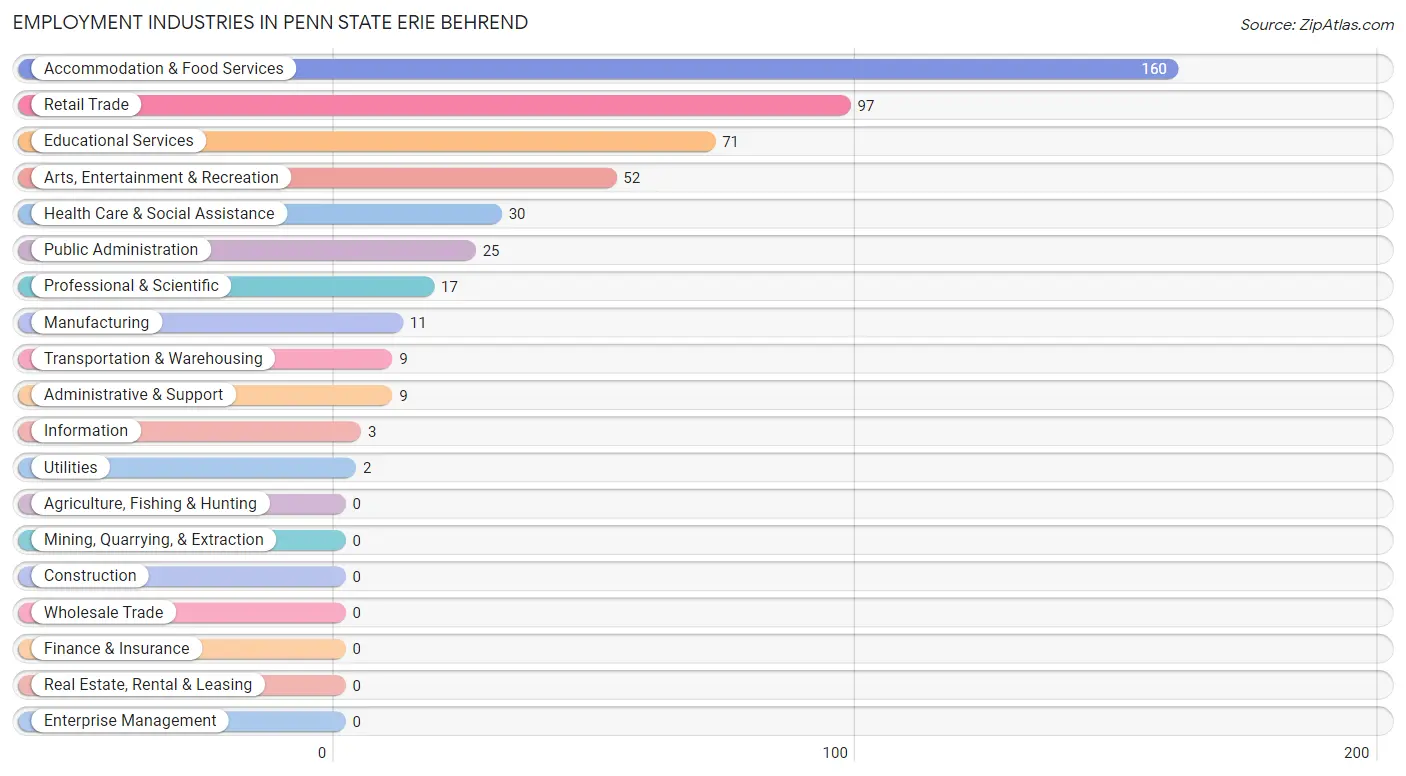
Employment Industries in Penn State Erie Behrend
The major employment industries in Penn State Erie Behrend include Accommodation & Food Services (160 | 32.3%), Retail Trade (97 | 19.6%), Educational Services (71 | 14.3%), Arts, Entertainment & Recreation (52 | 10.5%), and Health Care & Social Assistance (30 | 6.1%).
Employment Industries by Sex in Penn State Erie Behrend
The Penn State Erie Behrend industries that see more men than women are Manufacturing (100.0%), Transportation & Warehousing (100.0%), and Utilities (100.0%), whereas the industries that tend to have a higher number of women are Administrative & Support (100.0%), Public Administration (100.0%), and Arts, Entertainment & Recreation (96.2%).
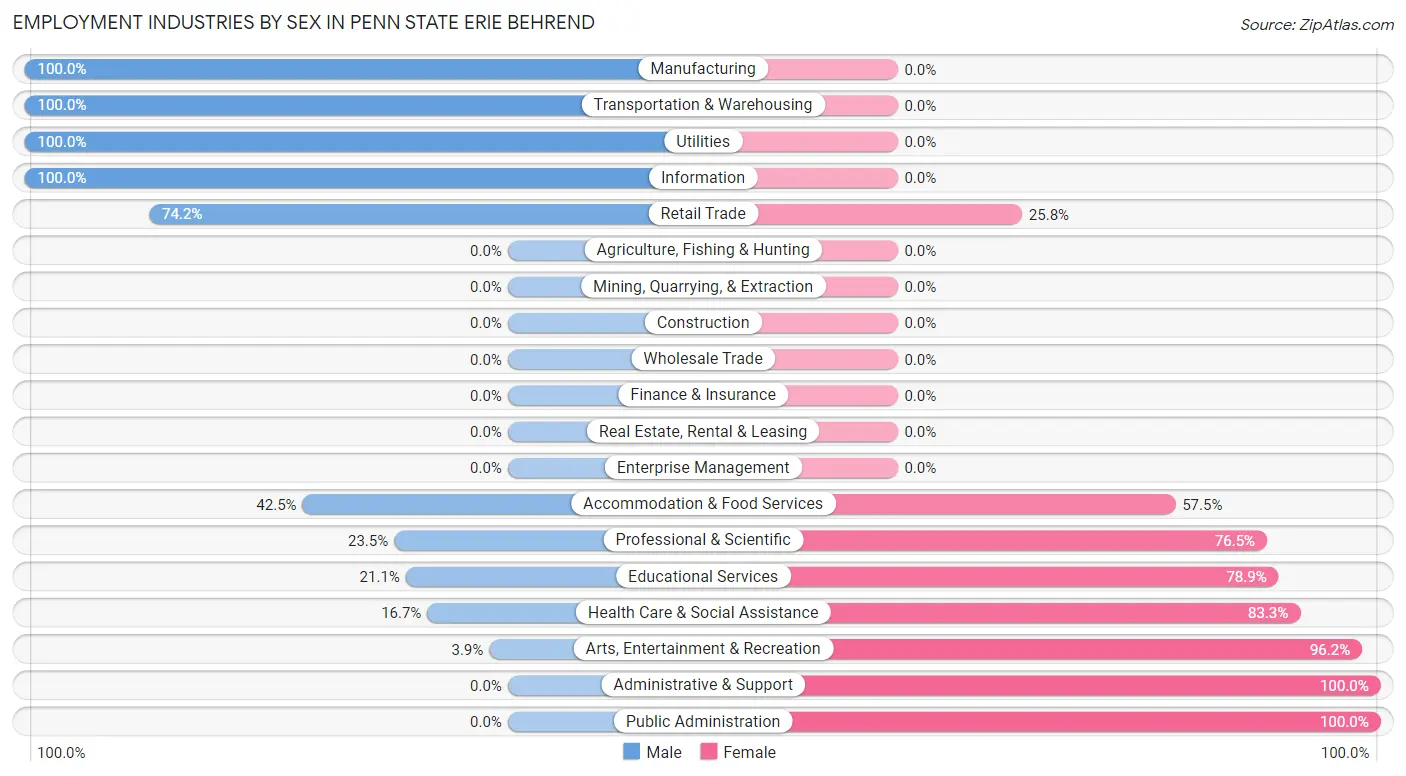
| Industry | Male | Female |
| Agriculture, Fishing & Hunting | 0 (0.0%) | 0 (0.0%) |
| Mining, Quarrying, & Extraction | 0 (0.0%) | 0 (0.0%) |
| Construction | 0 (0.0%) | 0 (0.0%) |
| Manufacturing | 11 (100.0%) | 0 (0.0%) |
| Wholesale Trade | 0 (0.0%) | 0 (0.0%) |
| Retail Trade | 72 (74.2%) | 25 (25.8%) |
| Transportation & Warehousing | 9 (100.0%) | 0 (0.0%) |
| Utilities | 2 (100.0%) | 0 (0.0%) |
| Information | 3 (100.0%) | 0 (0.0%) |
| Finance & Insurance | 0 (0.0%) | 0 (0.0%) |
| Real Estate, Rental & Leasing | 0 (0.0%) | 0 (0.0%) |
| Professional & Scientific | 4 (23.5%) | 13 (76.5%) |
| Enterprise Management | 0 (0.0%) | 0 (0.0%) |
| Administrative & Support | 0 (0.0%) | 9 (100.0%) |
| Educational Services | 15 (21.1%) | 56 (78.9%) |
| Health Care & Social Assistance | 5 (16.7%) | 25 (83.3%) |
| Arts, Entertainment & Recreation | 2 (3.8%) | 50 (96.2%) |
| Accommodation & Food Services | 68 (42.5%) | 92 (57.5%) |
| Public Administration | 0 (0.0%) | 25 (100.0%) |
| Total | 191 (38.6%) | 304 (61.4%) |
Education in Penn State Erie Behrend
School Enrollment in Penn State Erie Behrend
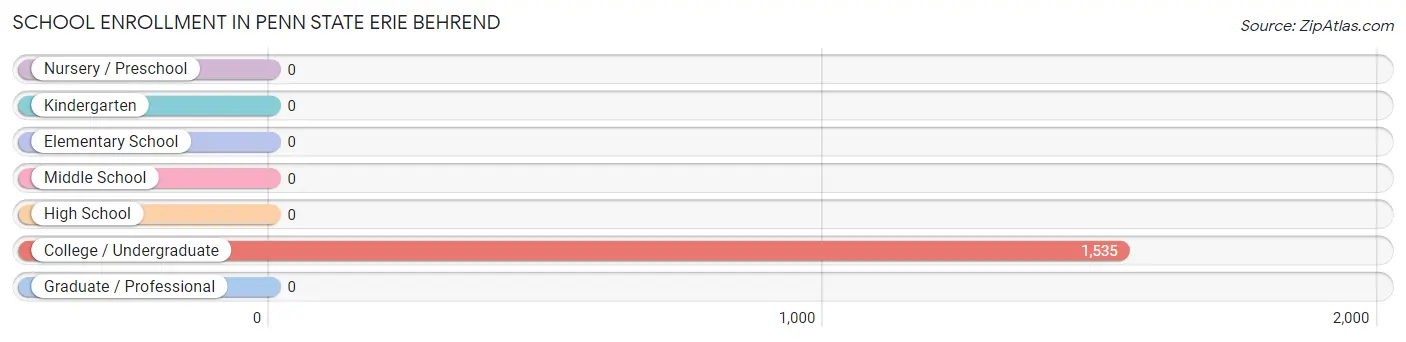
| School Level | # Students | % Students |
| Nursery / Preschool | 0 | 0.0% |
| Kindergarten | 0 | 0.0% |
| Elementary School | 0 | 0.0% |
| Middle School | 0 | 0.0% |
| High School | 0 | 0.0% |
| College / Undergraduate | 1,535 | 100.0% |
| Graduate / Professional | 0 | 0.0% |
| Total | 1,535 | 100.0% |
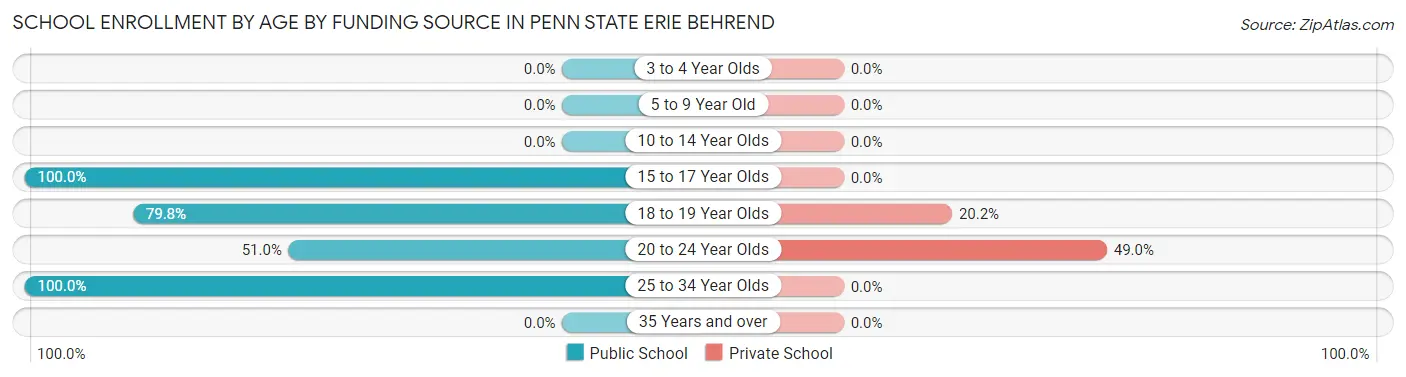
School Enrollment by Age by Funding Source in Penn State Erie Behrend
Out of a total of 1,535 students who are enrolled in schools in Penn State Erie Behrend, 467 (30.4%) attend a private institution, while the remaining 1,068 (69.6%) are enrolled in public schools. The age group of 20 to 24 year olds has the highest likelihood of being enrolled in private schools, with 271 (49.0% in the age bracket) enrolled. Conversely, the age group of 15 to 17 year olds has the lowest likelihood of being enrolled in a private school, with 10 (100.0% in the age bracket) attending a public institution.
| Age Bracket | Public School | Private School |
| 3 to 4 Year Olds | 0 (0.0%) | 0 (0.0%) |
| 5 to 9 Year Old | 0 (0.0%) | 0 (0.0%) |
| 10 to 14 Year Olds | 0 (0.0%) | 0 (0.0%) |
| 15 to 17 Year Olds | 10 (100.0%) | 0 (0.0%) |
| 18 to 19 Year Olds | 772 (79.8%) | 195 (20.2%) |
| 20 to 24 Year Olds | 282 (51.0%) | 271 (49.0%) |
| 25 to 34 Year Olds | 5 (100.0%) | 0 (0.0%) |
| 35 Years and over | 0 (0.0%) | 0 (0.0%) |
| Total | 1,068 (69.6%) | 467 (30.4%) |
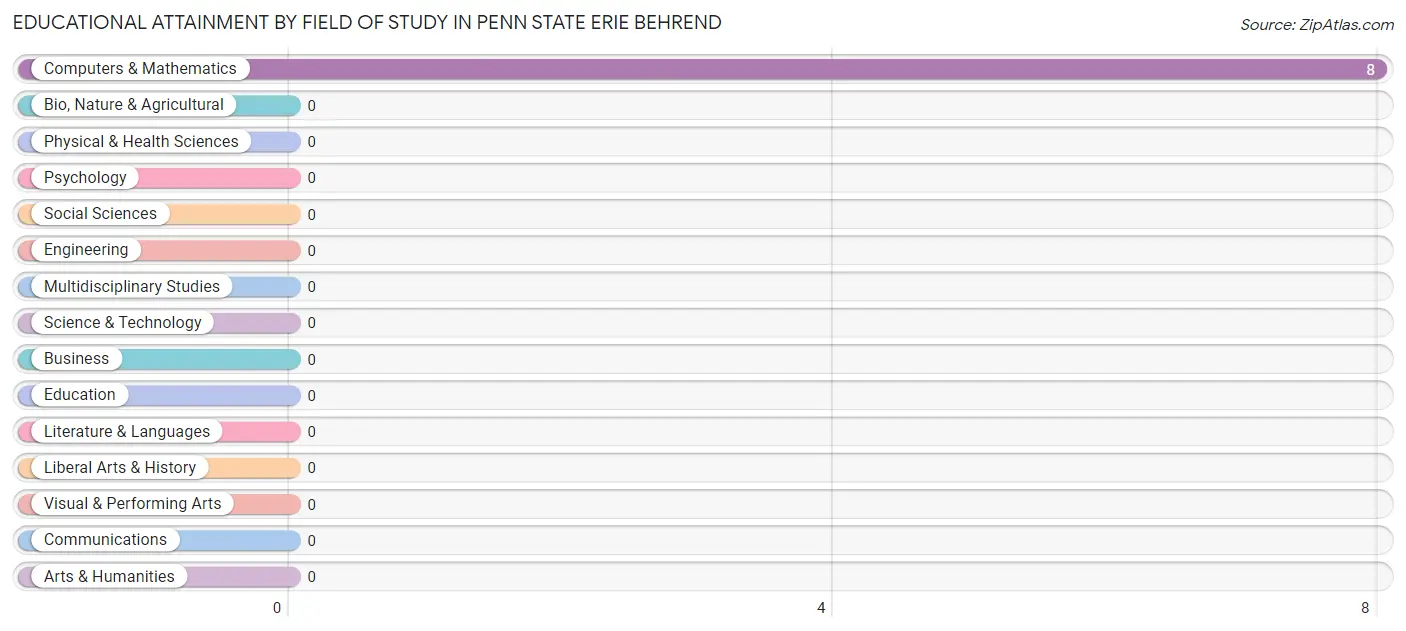
Educational Attainment by Field of Study in Penn State Erie Behrend
, and computers & mathematics (8 | 100.0%) are the most common fields of study among 8 individuals in Penn State Erie Behrend who have obtained a bachelor's degree or higher.
| Field of Study | # Graduates | % Graduates |
| Computers & Mathematics | 8 | 100.0% |
| Bio, Nature & Agricultural | 0 | 0.0% |
| Physical & Health Sciences | 0 | 0.0% |
| Psychology | 0 | 0.0% |
| Social Sciences | 0 | 0.0% |
| Engineering | 0 | 0.0% |
| Multidisciplinary Studies | 0 | 0.0% |
| Science & Technology | 0 | 0.0% |
| Business | 0 | 0.0% |
| Education | 0 | 0.0% |
| Literature & Languages | 0 | 0.0% |
| Liberal Arts & History | 0 | 0.0% |
| Visual & Performing Arts | 0 | 0.0% |
| Communications | 0 | 0.0% |
| Arts & Humanities | 0 | 0.0% |
| Total | 8 | 100.0% |
Transportation & Commute in Penn State Erie Behrend
Vehicle Availability by Sex in Penn State Erie Behrend
| Vehicles Available | Male | Female |
| No Vehicle | 0 (0.0%) | 0 (0.0%) |
| 1 Vehicle | 0 (0.0%) | 0 (0.0%) |
| 2 Vehicles | 0 (0.0%) | 0 (0.0%) |
| 3 Vehicles | 0 (0.0%) | 0 (0.0%) |
| 4 Vehicles | 0 (0.0%) | 0 (0.0%) |
| 5 or more Vehicles | 0 (0.0%) | 0 (0.0%) |
| Total | 0 (0.0%) | 0 (0.0%) |
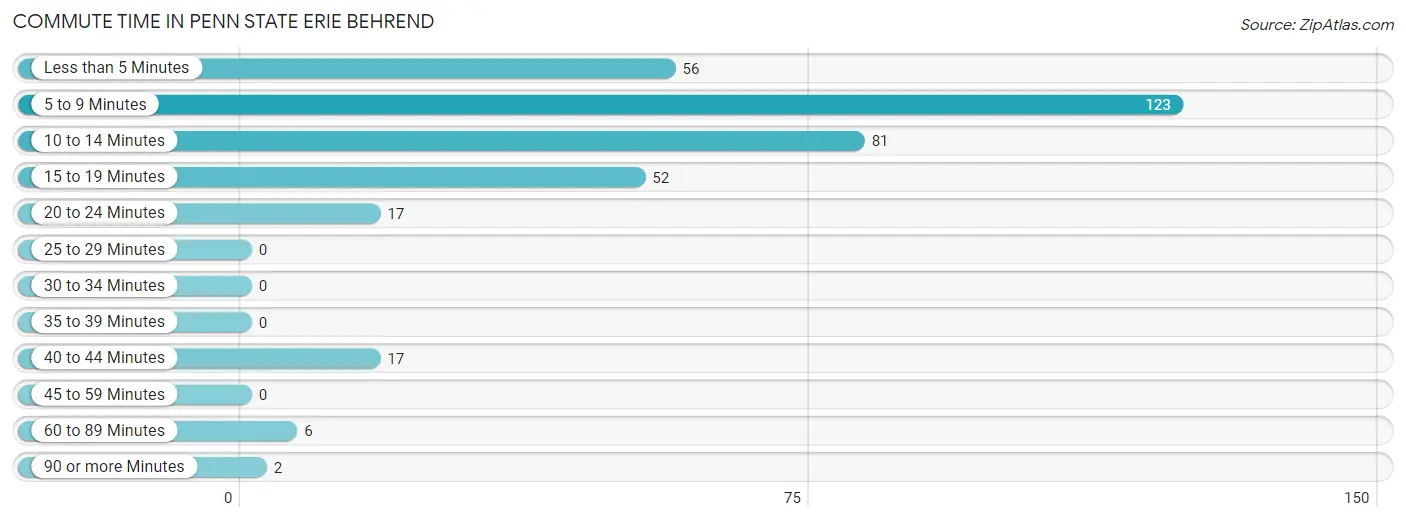
Commute Time in Penn State Erie Behrend
The most frequently occuring commute durations in Penn State Erie Behrend are 5 to 9 minutes (123 commuters, 34.7%), 10 to 14 minutes (81 commuters, 22.9%), and less than 5 minutes (56 commuters, 15.8%).
| Commute Time | # Commuters | % Commuters |
| Less than 5 Minutes | 56 | 15.8% |
| 5 to 9 Minutes | 123 | 34.7% |
| 10 to 14 Minutes | 81 | 22.9% |
| 15 to 19 Minutes | 52 | 14.7% |
| 20 to 24 Minutes | 17 | 4.8% |
| 25 to 29 Minutes | 0 | 0.0% |
| 30 to 34 Minutes | 0 | 0.0% |
| 35 to 39 Minutes | 0 | 0.0% |
| 40 to 44 Minutes | 17 | 4.8% |
| 45 to 59 Minutes | 0 | 0.0% |
| 60 to 89 Minutes | 6 | 1.7% |
| 90 or more Minutes | 2 | 0.6% |
Commute Time by Sex in Penn State Erie Behrend
The most common commute times in Penn State Erie Behrend are less than 5 minutes (32 commuters, 33.0%) for males and 5 to 9 minutes (104 commuters, 40.5%) for females.
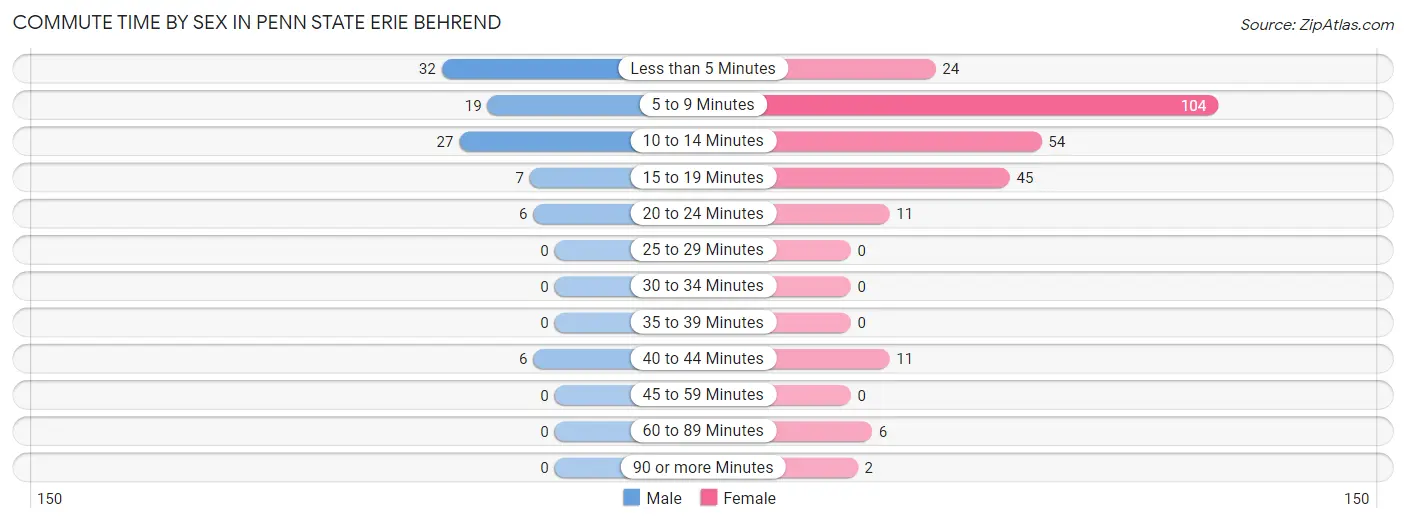
| Commute Time | Male | Female |
| Less than 5 Minutes | 32 (33.0%) | 24 (9.3%) |
| 5 to 9 Minutes | 19 (19.6%) | 104 (40.5%) |
| 10 to 14 Minutes | 27 (27.8%) | 54 (21.0%) |
| 15 to 19 Minutes | 7 (7.2%) | 45 (17.5%) |
| 20 to 24 Minutes | 6 (6.2%) | 11 (4.3%) |
| 25 to 29 Minutes | 0 (0.0%) | 0 (0.0%) |
| 30 to 34 Minutes | 0 (0.0%) | 0 (0.0%) |
| 35 to 39 Minutes | 0 (0.0%) | 0 (0.0%) |
| 40 to 44 Minutes | 6 (6.2%) | 11 (4.3%) |
| 45 to 59 Minutes | 0 (0.0%) | 0 (0.0%) |
| 60 to 89 Minutes | 0 (0.0%) | 6 (2.3%) |
| 90 or more Minutes | 0 (0.0%) | 2 (0.8%) |
Time of Departure to Work by Sex in Penn State Erie Behrend
The most frequent times of departure to work in Penn State Erie Behrend are 4:00 PM to 11:59 PM (31, 32.0%) for males and 12:00 PM to 3:59 PM (119, 46.3%) for females.
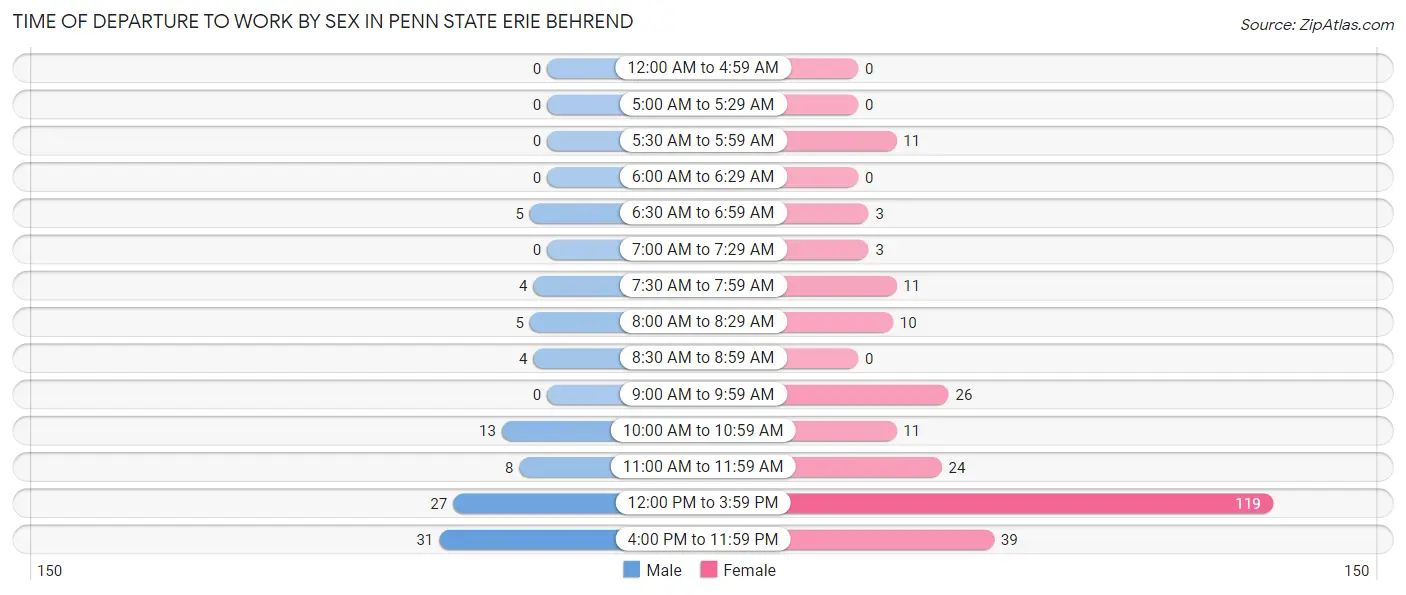
| Time of Departure | Male | Female |
| 12:00 AM to 4:59 AM | 0 (0.0%) | 0 (0.0%) |
| 5:00 AM to 5:29 AM | 0 (0.0%) | 0 (0.0%) |
| 5:30 AM to 5:59 AM | 0 (0.0%) | 11 (4.3%) |
| 6:00 AM to 6:29 AM | 0 (0.0%) | 0 (0.0%) |
| 6:30 AM to 6:59 AM | 5 (5.1%) | 3 (1.2%) |
| 7:00 AM to 7:29 AM | 0 (0.0%) | 3 (1.2%) |
| 7:30 AM to 7:59 AM | 4 (4.1%) | 11 (4.3%) |
| 8:00 AM to 8:29 AM | 5 (5.1%) | 10 (3.9%) |
| 8:30 AM to 8:59 AM | 4 (4.1%) | 0 (0.0%) |
| 9:00 AM to 9:59 AM | 0 (0.0%) | 26 (10.1%) |
| 10:00 AM to 10:59 AM | 13 (13.4%) | 11 (4.3%) |
| 11:00 AM to 11:59 AM | 8 (8.3%) | 24 (9.3%) |
| 12:00 PM to 3:59 PM | 27 (27.8%) | 119 (46.3%) |
| 4:00 PM to 11:59 PM | 31 (32.0%) | 39 (15.2%) |
| Total | 97 (100.0%) | 257 (100.0%) |
Housing Occupancy in Penn State Erie Behrend
Occupancy by Ownership in Penn State Erie Behrend
| Occupancy | # Housing Units | % Housing Units |
| Owner Occupied Housing Units | 0 | 0.0% |
| Renter-Occupied Housing Units | 0 | 0.0% |
| Total Occupied Housing Units | 0 | 0.0% |
Occupancy by Household Size in Penn State Erie Behrend
| Household Size | # Housing Units | % Housing Units |
| 1-Person Household | 0 | 0.0% |
| 2-Person Household | 0 | 0.0% |
| 3-Person Household | 0 | 0.0% |
| 4+ Person Household | 0 | 0.0% |
| Total Housing Units | 0 | 0.0% |
Occupancy by Ownership by Household Size in Penn State Erie Behrend
| Household Size | Owner-occupied | Renter-occupied |
| 1-Person Household | 0 (0.0%) | 0 (0.0%) |
| 2-Person Household | 0 (0.0%) | 0 (0.0%) |
| 3-Person Household | 0 (0.0%) | 0 (0.0%) |
| 4+ Person Household | 0 (0.0%) | 0 (0.0%) |
| Total Housing Units | 0 (0.0%) | 0 (0.0%) |
Occupancy by Educational Attainment in Penn State Erie Behrend
| Household Size | Owner-occupied | Renter-occupied |
| Less than High School | 0 (0.0%) | 0 (0.0%) |
| High School Diploma | 0 (0.0%) | 0 (0.0%) |
| College/Associate Degree | 0 (0.0%) | 0 (0.0%) |
| Bachelor's Degree or higher | 0 (0.0%) | 0 (0.0%) |
Occupancy by Age of Householder in Penn State Erie Behrend
| Age Bracket | # Households | % Households |
| Under 35 Years | 0 | 0.0% |
| 35 to 44 Years | 0 | 0.0% |
| 45 to 54 Years | 0 | 0.0% |
| 55 to 64 Years | 0 | 0.0% |
| 65 to 74 Years | 0 | 0.0% |
| 75 to 84 Years | 0 | 0.0% |
| 85 Years and Over | 0 | 0.0% |
| Total | 0 | 0.0% |
Housing Finances in Penn State Erie Behrend
Median Income by Occupancy in Penn State Erie Behrend
| Occupancy Type | # Households | Median Income |
| Owner-Occupied | 0 (0.0%) | $0 |
| Renter-Occupied | 0 (0.0%) | $0 |
| Average | 0 (0.0%) | $0 |
Occupancy by Householder Income Bracket in Penn State Erie Behrend
| Income Bracket | Owner-occupied | Renter-occupied |
| Less than $5,000 | 0 (0.0%) | 0 (0.0%) |
| $5,000 to $9,999 | 0 (0.0%) | 0 (0.0%) |
| $10,000 to $14,999 | 0 (0.0%) | 0 (0.0%) |
| $15,000 to $19,999 | 0 (0.0%) | 0 (0.0%) |
| $20,000 to $24,999 | 0 (0.0%) | 0 (0.0%) |
| $25,000 to $34,999 | 0 (0.0%) | 0 (0.0%) |
| $35,000 to $49,999 | 0 (0.0%) | 0 (0.0%) |
| $50,000 to $74,999 | 0 (0.0%) | 0 (0.0%) |
| $75,000 to $99,999 | 0 (0.0%) | 0 (0.0%) |
| $100,000 to $149,999 | 0 (0.0%) | 0 (0.0%) |
| $150,000 or more | 0 (0.0%) | 0 (0.0%) |
| Total | 0 (0.0%) | 0 (0.0%) |
Monthly Housing Cost Tiers in Penn State Erie Behrend
| Monthly Cost | Owner-occupied | Renter-occupied |
| Less than $300 | 0 (0.0%) | 0 (0.0%) |
| $300 to $499 | 0 (0.0%) | 0 (0.0%) |
| $500 to $799 | 0 (0.0%) | 0 (0.0%) |
| $800 to $999 | 0 (0.0%) | 0 (0.0%) |
| $1,000 to $1,499 | 0 (0.0%) | 0 (0.0%) |
| $1,500 to $1,999 | 0 (0.0%) | 0 (0.0%) |
| $2,000 to $2,499 | 0 (0.0%) | 0 (0.0%) |
| $2,500 to $2,999 | 0 (0.0%) | 0 (0.0%) |
| $3,000 or more | 0 (0.0%) | 0 (0.0%) |
| Total | 0 (0.0%) | 0 (0.0%) |
Physical Housing Characteristics in Penn State Erie Behrend
Housing Structures in Penn State Erie Behrend
| Structure Type | # Housing Units | % Housing Units |
| Single Unit, Detached | 0 | 0.0% |
| Single Unit, Attached | 0 | 0.0% |
| 2 Unit Apartments | 0 | 0.0% |
| 3 or 4 Unit Apartments | 0 | 0.0% |
| 5 to 9 Unit Apartments | 0 | 0.0% |
| 10 or more Apartments | 0 | 0.0% |
| Mobile Home / Other | 0 | 0.0% |
| Total | 0 | 0.0% |
Housing Structures by Occupancy in Penn State Erie Behrend
| Structure Type | Owner-occupied | Renter-occupied |
| Single Unit, Detached | 0 (0.0%) | 0 (0.0%) |
| Single Unit, Attached | 0 (0.0%) | 0 (0.0%) |
| 2 Unit Apartments | 0 (0.0%) | 0 (0.0%) |
| 3 or 4 Unit Apartments | 0 (0.0%) | 0 (0.0%) |
| 5 to 9 Unit Apartments | 0 (0.0%) | 0 (0.0%) |
| 10 or more Apartments | 0 (0.0%) | 0 (0.0%) |
| Mobile Home / Other | 0 (0.0%) | 0 (0.0%) |
| Total | 0 (0.0%) | 0 (0.0%) |
Housing Structures by Number of Rooms in Penn State Erie Behrend
| Number of Rooms | Owner-occupied | Renter-occupied |
| 1 Room | 0 (0.0%) | 0 (0.0%) |
| 2 or 3 Rooms | 0 (0.0%) | 0 (0.0%) |
| 4 or 5 Rooms | 0 (0.0%) | 0 (0.0%) |
| 6 or 7 Rooms | 0 (0.0%) | 0 (0.0%) |
| 8 or more Rooms | 0 (0.0%) | 0 (0.0%) |
| Total | 0 (0.0%) | 0 (0.0%) |
Housing Structure by Heating Type in Penn State Erie Behrend
| Heating Type | Owner-occupied | Renter-occupied |
| Utility Gas | 0 (0.0%) | 0 (0.0%) |
| Bottled, Tank, or LP Gas | 0 (0.0%) | 0 (0.0%) |
| Electricity | 0 (0.0%) | 0 (0.0%) |
| Fuel Oil or Kerosene | 0 (0.0%) | 0 (0.0%) |
| Coal or Coke | 0 (0.0%) | 0 (0.0%) |
| All other Fuels | 0 (0.0%) | 0 (0.0%) |
| No Fuel Used | 0 (0.0%) | 0 (0.0%) |
| Total | 0 (0.0%) | 0 (0.0%) |
Household Vehicle Usage in Penn State Erie Behrend
| Vehicles per Household | Owner-occupied | Renter-occupied |
| No Vehicle | 0 (0.0%) | 0 (0.0%) |
| 1 Vehicle | 0 (0.0%) | 0 (0.0%) |
| 2 Vehicles | 0 (0.0%) | 0 (0.0%) |
| 3 or more Vehicles | 0 (0.0%) | 0 (0.0%) |
| Total | 0 (0.0%) | 0 (0.0%) |
Real Estate & Mortgages in Penn State Erie Behrend
Real Estate and Mortgage Overview in Penn State Erie Behrend
| Characteristic | Without Mortgage | With Mortgage |
| Housing Units | 0 | 0 |
| Median Property Value | - | - |
| Median Household Income | - | - |
| Monthly Housing Costs | - | - |
| Real Estate Taxes | - | - |
Property Value by Mortgage Status in Penn State Erie Behrend
| Property Value | Without Mortgage | With Mortgage |
| Less than $50,000 | 0 (0.0%) | 0 (0.0%) |
| $50,000 to $99,999 | 0 (0.0%) | 0 (0.0%) |
| $100,000 to $299,999 | 0 (0.0%) | 0 (0.0%) |
| $300,000 to $499,999 | 0 (0.0%) | 0 (0.0%) |
| $500,000 to $749,999 | 0 (0.0%) | 0 (0.0%) |
| $750,000 to $999,999 | 0 (0.0%) | 0 (0.0%) |
| $1,000,000 or more | 0 (0.0%) | 0 (0.0%) |
| Total | 0 (0.0%) | 0 (0.0%) |
Household Income by Mortgage Status in Penn State Erie Behrend
| Household Income | Without Mortgage | With Mortgage |
| Less than $10,000 | 0 (0.0%) | 0 (0.0%) |
| $10,000 to $24,999 | 0 (0.0%) | 0 (0.0%) |
| $25,000 to $34,999 | 0 (0.0%) | 0 (0.0%) |
| $35,000 to $49,999 | 0 (0.0%) | 0 (0.0%) |
| $50,000 to $74,999 | 0 (0.0%) | 0 (0.0%) |
| $75,000 to $99,999 | 0 (0.0%) | 0 (0.0%) |
| $100,000 to $149,999 | 0 (0.0%) | 0 (0.0%) |
| $150,000 or more | 0 (0.0%) | 0 (0.0%) |
| Total | 0 (0.0%) | 0 (0.0%) |
Property Value to Household Income Ratio in Penn State Erie Behrend
| Value-to-Income Ratio | Without Mortgage | With Mortgage |
| Less than 2.0x | 0 (0.0%) | 0 (0.0%) |
| 2.0x to 2.9x | 0 (0.0%) | 0 (0.0%) |
| 3.0x to 3.9x | 0 (0.0%) | 0 (0.0%) |
| 4.0x or more | 0 (0.0%) | 0 (0.0%) |
| Total | 0 (0.0%) | 0 (0.0%) |
Real Estate Taxes by Mortgage Status in Penn State Erie Behrend
| Property Taxes | Without Mortgage | With Mortgage |
| Less than $800 | 0 (0.0%) | 0 (0.0%) |
| $800 to $1,499 | 0 (0.0%) | 0 (0.0%) |
| $800 to $1,499 | 0 (0.0%) | 0 (0.0%) |
| Total | 0 (0.0%) | 0 (0.0%) |
Health & Disability in Penn State Erie Behrend
Health Insurance Coverage by Age in Penn State Erie Behrend
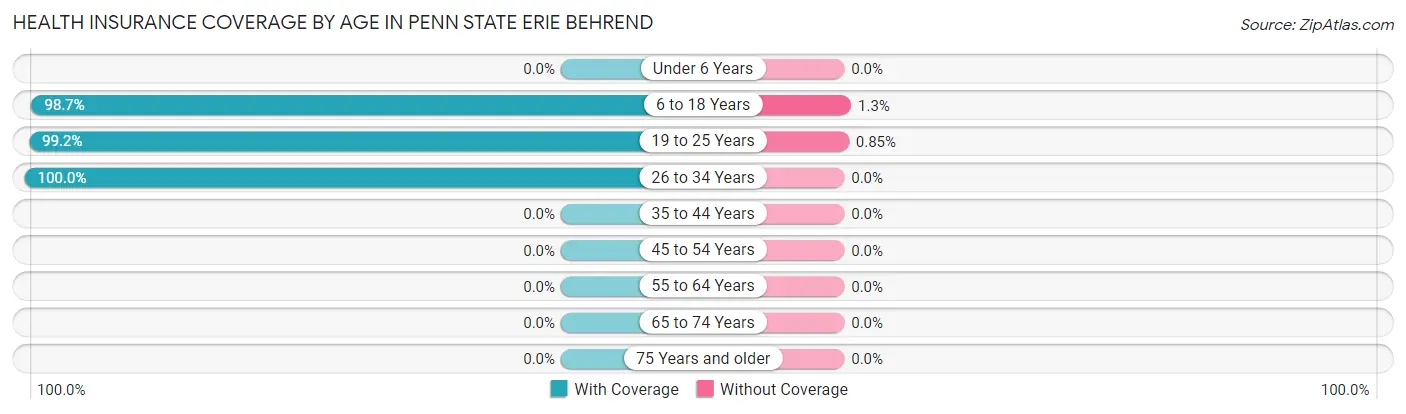
| Age Bracket | With Coverage | Without Coverage |
| Under 6 Years | 0 (0.0%) | 0 (0.0%) |
| 6 to 18 Years | 467 (98.7%) | 6 (1.3%) |
| 19 to 25 Years | 1,053 (99.2%) | 9 (0.9%) |
| 26 to 34 Years | 8 (100.0%) | 0 (0.0%) |
| 35 to 44 Years | 0 (0.0%) | 0 (0.0%) |
| 45 to 54 Years | 0 (0.0%) | 0 (0.0%) |
| 55 to 64 Years | 0 (0.0%) | 0 (0.0%) |
| 65 to 74 Years | 0 (0.0%) | 0 (0.0%) |
| 75 Years and older | 0 (0.0%) | 0 (0.0%) |
| Total | 1,528 (99.0%) | 15 (1.0%) |
Health Insurance Coverage by Citizenship Status in Penn State Erie Behrend
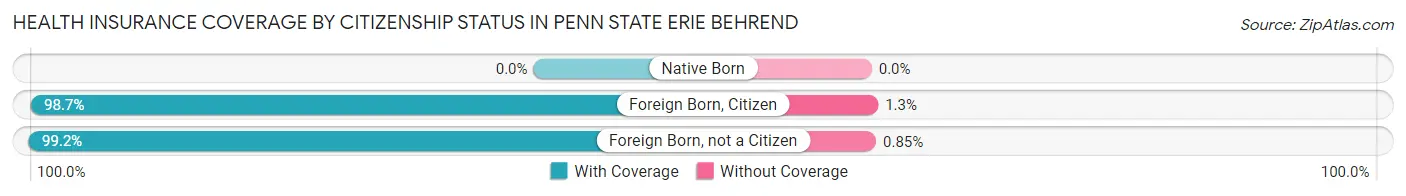
| Citizenship Status | With Coverage | Without Coverage |
| Native Born | 0 (0.0%) | 0 (0.0%) |
| Foreign Born, Citizen | 467 (98.7%) | 6 (1.3%) |
| Foreign Born, not a Citizen | 1,053 (99.2%) | 9 (0.9%) |
Health Insurance Coverage by Household Income in Penn State Erie Behrend
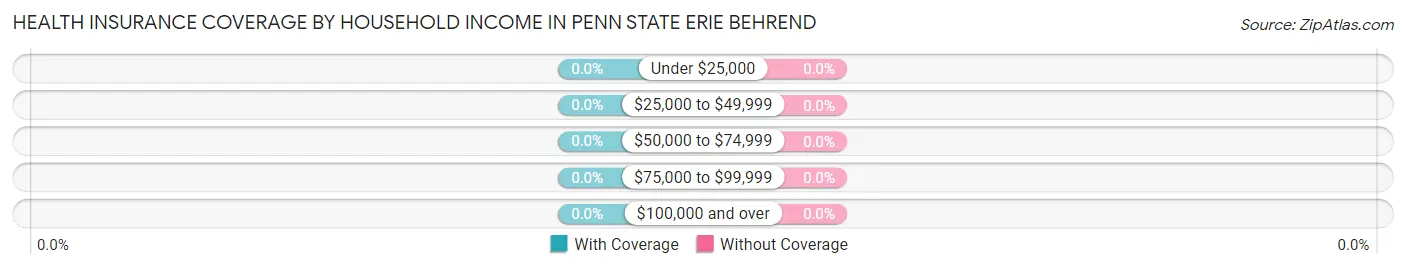
| Household Income | With Coverage | Without Coverage |
| Under $25,000 | 0 (0.0%) | 0 (0.0%) |
| $25,000 to $49,999 | 0 (0.0%) | 0 (0.0%) |
| $50,000 to $74,999 | 0 (0.0%) | 0 (0.0%) |
| $75,000 to $99,999 | 0 (0.0%) | 0 (0.0%) |
| $100,000 and over | 0 (0.0%) | 0 (0.0%) |
Public vs Private Health Insurance Coverage by Age in Penn State Erie Behrend
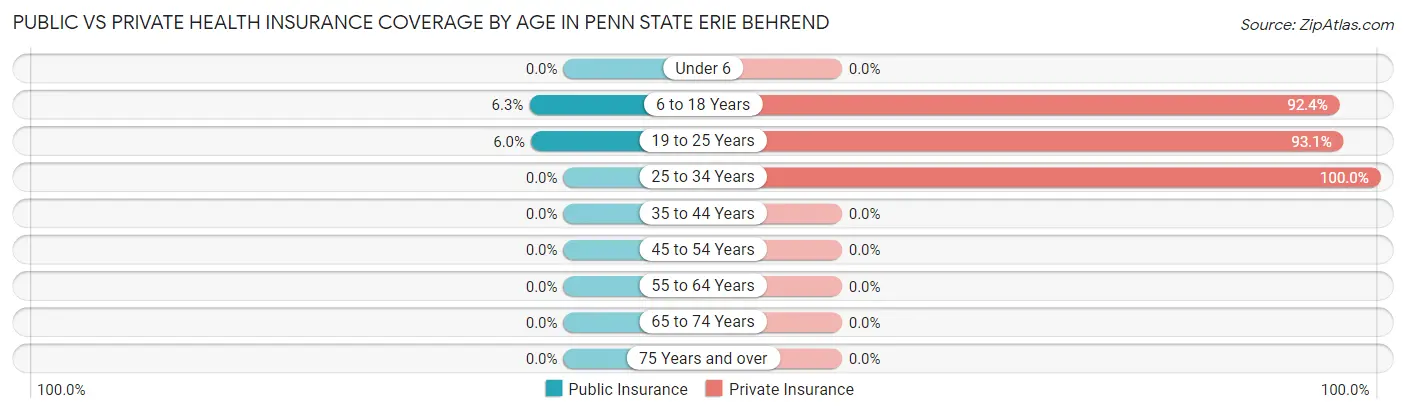
| Age Bracket | Public Insurance | Private Insurance |
| Under 6 | 0 (0.0%) | 0 (0.0%) |
| 6 to 18 Years | 30 (6.3%) | 437 (92.4%) |
| 19 to 25 Years | 64 (6.0%) | 989 (93.1%) |
| 25 to 34 Years | 0 (0.0%) | 8 (100.0%) |
| 35 to 44 Years | 0 (0.0%) | 0 (0.0%) |
| 45 to 54 Years | 0 (0.0%) | 0 (0.0%) |
| 55 to 64 Years | 0 (0.0%) | 0 (0.0%) |
| 65 to 74 Years | 0 (0.0%) | 0 (0.0%) |
| 75 Years and over | 0 (0.0%) | 0 (0.0%) |
| Total | 94 (6.1%) | 1,434 (92.9%) |
Disability Status by Sex by Age in Penn State Erie Behrend
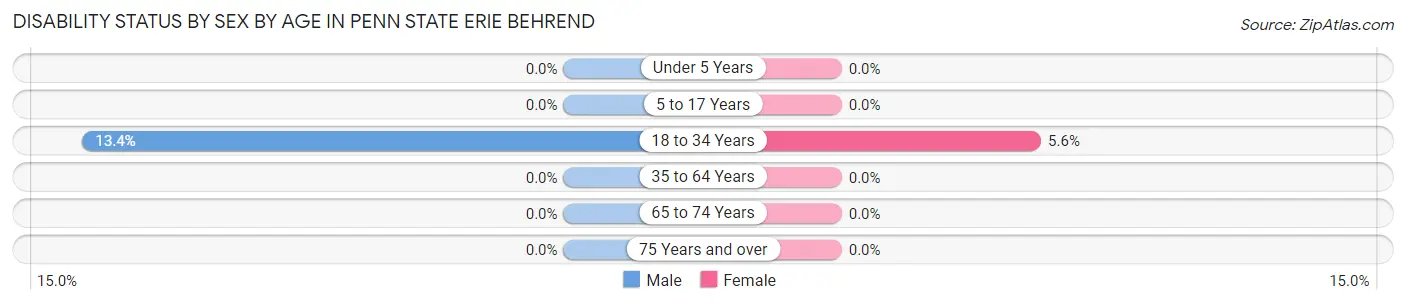
| Age Bracket | Male | Female |
| Under 5 Years | 0 (0.0%) | 0 (0.0%) |
| 5 to 17 Years | 0 (0.0%) | 0 (0.0%) |
| 18 to 34 Years | 116 (13.4%) | 37 (5.6%) |
| 35 to 64 Years | 0 (0.0%) | 0 (0.0%) |
| 65 to 74 Years | 0 (0.0%) | 0 (0.0%) |
| 75 Years and over | 0 (0.0%) | 0 (0.0%) |
Disability Class by Sex by Age in Penn State Erie Behrend
Disability Class: Hearing Difficulty
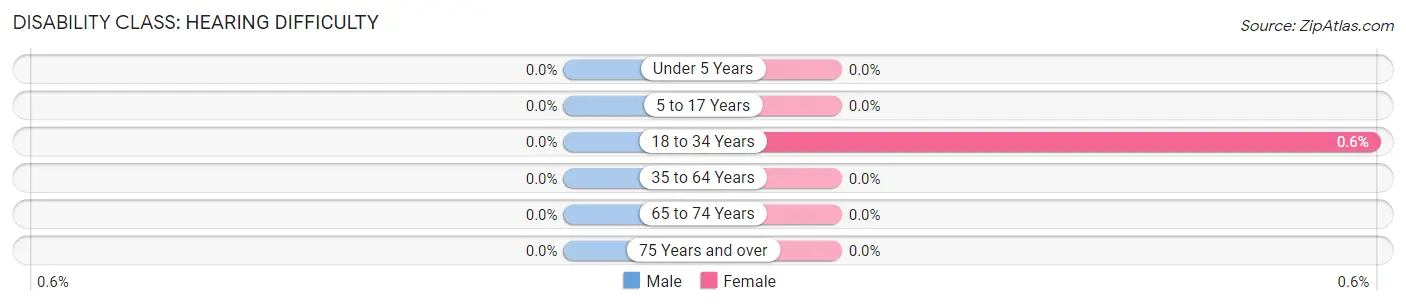
| Age Bracket | Male | Female |
| Under 5 Years | 0 (0.0%) | 0 (0.0%) |
| 5 to 17 Years | 0 (0.0%) | 0 (0.0%) |
| 18 to 34 Years | 0 (0.0%) | 4 (0.6%) |
| 35 to 64 Years | 0 (0.0%) | 0 (0.0%) |
| 65 to 74 Years | 0 (0.0%) | 0 (0.0%) |
| 75 Years and over | 0 (0.0%) | 0 (0.0%) |
Disability Class: Vision Difficulty
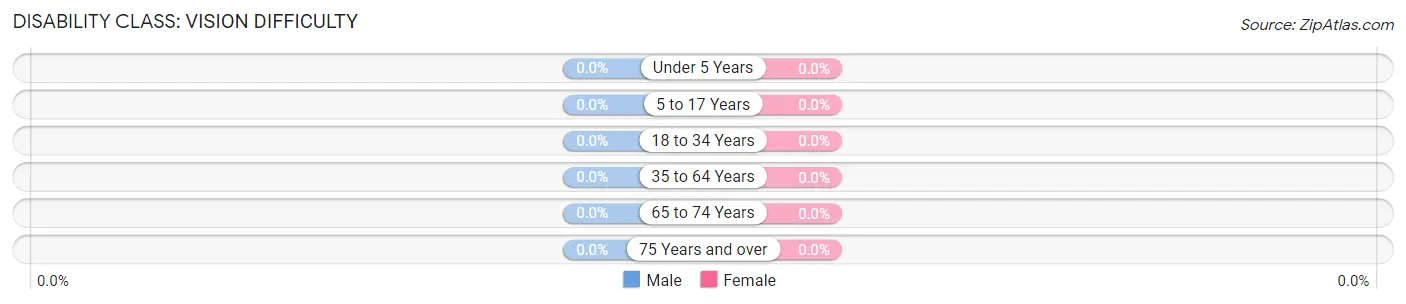
| Age Bracket | Male | Female |
| Under 5 Years | 0 (0.0%) | 0 (0.0%) |
| 5 to 17 Years | 0 (0.0%) | 0 (0.0%) |
| 18 to 34 Years | 0 (0.0%) | 0 (0.0%) |
| 35 to 64 Years | 0 (0.0%) | 0 (0.0%) |
| 65 to 74 Years | 0 (0.0%) | 0 (0.0%) |
| 75 Years and over | 0 (0.0%) | 0 (0.0%) |
Disability Class: Cognitive Difficulty
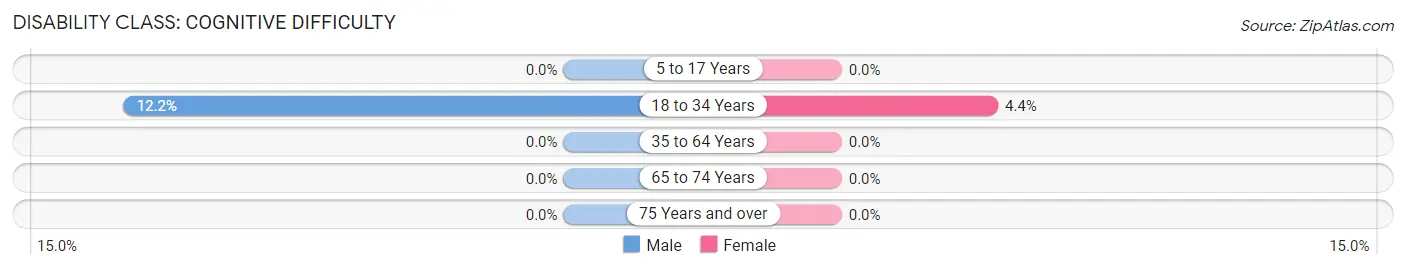
| Age Bracket | Male | Female |
| 5 to 17 Years | 0 (0.0%) | 0 (0.0%) |
| 18 to 34 Years | 106 (12.2%) | 29 (4.3%) |
| 35 to 64 Years | 0 (0.0%) | 0 (0.0%) |
| 65 to 74 Years | 0 (0.0%) | 0 (0.0%) |
| 75 Years and over | 0 (0.0%) | 0 (0.0%) |
Disability Class: Ambulatory Difficulty
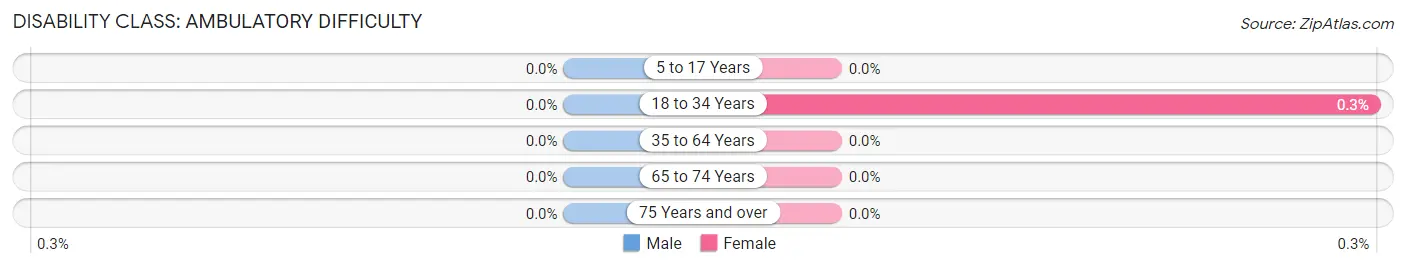
| Age Bracket | Male | Female |
| 5 to 17 Years | 0 (0.0%) | 0 (0.0%) |
| 18 to 34 Years | 0 (0.0%) | 2 (0.3%) |
| 35 to 64 Years | 0 (0.0%) | 0 (0.0%) |
| 65 to 74 Years | 0 (0.0%) | 0 (0.0%) |
| 75 Years and over | 0 (0.0%) | 0 (0.0%) |
Disability Class: Self-Care Difficulty
| Age Bracket | Male | Female |
| 5 to 17 Years | 0 (0.0%) | 0 (0.0%) |
| 18 to 34 Years | 0 (0.0%) | 0 (0.0%) |
| 35 to 64 Years | 0 (0.0%) | 0 (0.0%) |
| 65 to 74 Years | 0 (0.0%) | 0 (0.0%) |
| 75 Years and over | 0 (0.0%) | 0 (0.0%) |
Technology Access in Penn State Erie Behrend
Computing Device Access in Penn State Erie Behrend
| Device Type | # Households | % Households |
| Desktop or Laptop | 0 | 0.0% |
| Smartphone | 0 | 0.0% |
| Tablet | 0 | 0.0% |
| No Computing Device | 0 | 0.0% |
| Total | 0 | 0.0% |
Internet Access in Penn State Erie Behrend
| Internet Type | # Households | % Households |
| Dial-Up Internet | 0 | 0.0% |
| Broadband Home | 0 | 0.0% |
| Cellular Data Only | 0 | 0.0% |
| Satellite Internet | 0 | 0.0% |
| No Internet | 0 | 0.0% |
| Total | 0 | 0.0% |
Penn State Erie Behrend Summary
Penn State Erie, The Behrend College, is a public college located in Erie, Pennsylvania. It is part of the Pennsylvania State University system and is the largest college in the system. The college was founded in 1948 and is located on a 500-acre campus. It offers more than 80 undergraduate and graduate degree programs.
History
Penn State Erie, The Behrend College, was founded in 1948 as the Erie Extension Center of the Pennsylvania State University. The college was established to provide educational opportunities to the residents of Erie and the surrounding areas. The college was initially housed in the former Erie High School building, which was located in downtown Erie. In 1953, the college moved to its current location on the 500-acre campus.
The college was renamed Penn State Erie, The Behrend College, in 1966 in honor of Dr. Paul A. Behrend, who served as the college’s first director. In the following years, the college continued to grow and expand its academic offerings. In the late 1990s, the college began offering online courses and degree programs.
Geography
Penn State Erie, The Behrend College, is located in Erie, Pennsylvania. The city of Erie is located in the northwestern corner of the state, on the shores of Lake Erie. The city is situated at the mouth of the Niagara River, which connects Lake Erie to Lake Ontario. The city is also located near the Pennsylvania-New York border.
The college is located on a 500-acre campus, which includes a variety of buildings, including academic buildings, residence halls, and athletic facilities. The campus is also home to a variety of outdoor recreational areas, including a lake, a golf course, and a nature preserve.
Economy
The economy of Erie is largely driven by manufacturing, healthcare, and education. The city is home to a number of manufacturing companies, including GE Transportation, which produces locomotives and other transportation equipment. The city is also home to a number of healthcare facilities, including UPMC Hamot, Saint Vincent Hospital, and the Erie VA Medical Center.
Penn State Erie, The Behrend College, is a major economic driver in the region. The college employs more than 1,000 faculty and staff members and has an annual economic impact of more than $400 million. The college also provides educational opportunities to more than 4,000 students each year.
Demographics
As of the 2010 census, the population of Erie was 101,786. The city has a diverse population, with a majority of the population being white (78.2%), followed by African American (14.2%), Hispanic (4.2%), and Asian (2.2%). The median household income in the city is $37,845, and the median age is 38.7 years.
Conclusion
Penn State Erie, The Behrend College, is a public college located in Erie, Pennsylvania. It is part of the Pennsylvania State University system and is the largest college in the system. The college was founded in 1948 and is located on a 500-acre campus. It offers more than 80 undergraduate and graduate degree programs. The college is a major economic driver in the region, employing more than 1,000 faculty and staff members and providing educational opportunities to more than 4,000 students each year. The city of Erie has a diverse population, with a majority of the population being white, followed by African American, Hispanic, and Asian. The median household income in the city is $37,845, and the median age is 38.7 years.
Common Questions
What is Per Capita Income in Penn State Erie Behrend?
Per Capita income in Penn State Erie Behrend is $4,326.
What is Income or Wage Gap in Penn State Erie Behrend?
Income or Wage Gap in Penn State Erie Behrend is 28.0%.
Women in Penn State Erie Behrend earn 72.0 cents for every dollar earned by a man.
What is the Total Population of Penn State Erie Behrend?
Total Population of Penn State Erie Behrend is 1,543.
What is the Total Male Population of Penn State Erie Behrend?
Total Male Population of Penn State Erie Behrend is 866.
What is the Total Female Population of Penn State Erie Behrend?
Total Female Population of Penn State Erie Behrend is 677.
What is the Ratio of Males per 100 Females in Penn State Erie Behrend?
There are 127.92 Males per 100 Females in Penn State Erie Behrend.
What is the Ratio of Females per 100 Males in Penn State Erie Behrend?
There are 78.18 Females per 100 Males in Penn State Erie Behrend.
What is the Median Population Age in Penn State Erie Behrend?
Median Population Age in Penn State Erie Behrend is 19.6 Years.
How Large is the Labor Force in Penn State Erie Behrend?
There are 580 People in the Labor Forcein in Penn State Erie Behrend.
What is the Percentage of People in the Labor Force in Penn State Erie Behrend?
37.6% of People are in the Labor Force in Penn State Erie Behrend.
What is the Unemployment Rate in Penn State Erie Behrend?
Unemployment Rate in Penn State Erie Behrend is 14.7%.