Cities with the Highest Percentage of Yugoslavian Population in Pennsylvania
RELATED REPORTS & OPTIONS
Yugoslavian
Pennsylvania
Compare Cities
Map of Cities with the Highest Percentage of Yugoslavian Population in Pennsylvania
0.00%
15.00%
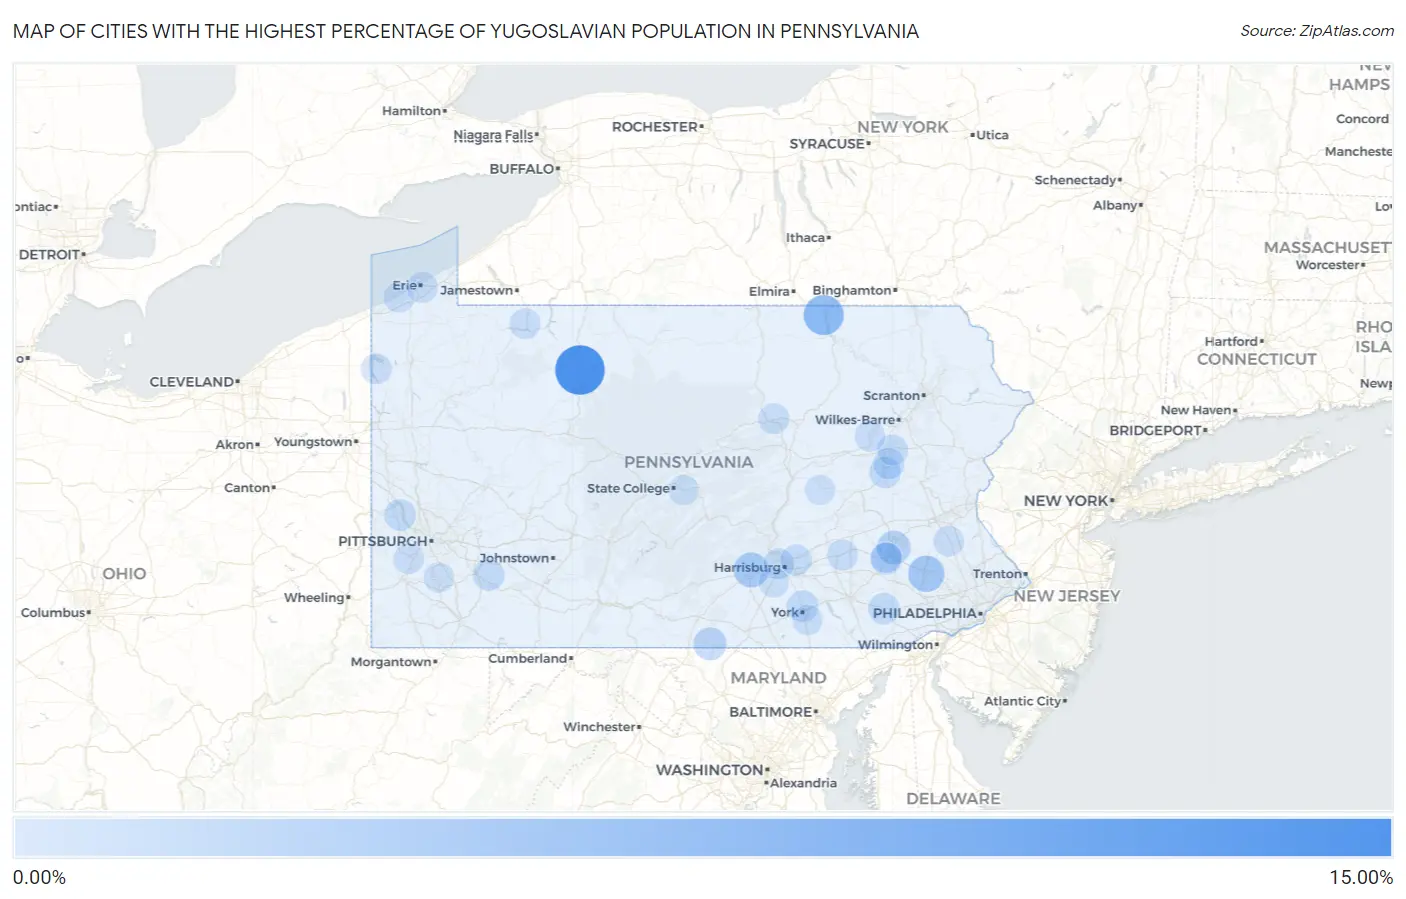
Cities with the Highest Percentage of Yugoslavian Population in Pennsylvania
| City | Yugoslavian | vs State | vs National | |
| 1. | Wilcox | 10.40% | 0.074% (+10.3)#1 | 0.067% (+10.3)#13 |
| 2. | Greens Landing | 5.35% | 0.074% (+5.27)#2 | 0.067% (+5.28)#35 |
| 3. | Kenilworth | 3.37% | 0.074% (+3.30)#3 | 0.067% (+3.31)#64 |
| 4. | Schlusser | 2.74% | 0.074% (+2.67)#4 | 0.067% (+2.68)#80 |
| 5. | Ehrenfeld Borough | 2.72% | 0.074% (+2.64)#5 | 0.067% (+2.65)#81 |
| 6. | Dillsburg Borough | 2.51% | 0.074% (+2.44)#6 | 0.067% (+2.44)#94 |
| 7. | Wilson Borough | 2.17% | 0.074% (+2.09)#7 | 0.067% (+2.10)#106 |
| 8. | New Eagle Borough | 2.13% | 0.074% (+2.05)#8 | 0.067% (+2.06)#107 |
| 9. | South Temple | 2.03% | 0.074% (+1.95)#9 | 0.067% (+1.96)#120 |
| 10. | Vandling Borough | 2.02% | 0.074% (+1.94)#10 | 0.067% (+1.95)#121 |
| 11. | Carlisle Borough | 1.99% | 0.074% (+1.92)#11 | 0.067% (+1.92)#123 |
| 12. | North Wales Borough | 1.93% | 0.074% (+1.86)#12 | 0.067% (+1.87)#134 |
| 13. | Centerport Borough | 1.76% | 0.074% (+1.69)#13 | 0.067% (+1.69)#154 |
| 14. | Green Tree Borough | 1.70% | 0.074% (+1.63)#14 | 0.067% (+1.64)#158 |
| 15. | Wayne Heights | 1.59% | 0.074% (+1.52)#15 | 0.067% (+1.52)#173 |
| 16. | Lemoyne Borough | 1.35% | 0.074% (+1.28)#16 | 0.067% (+1.28)#193 |
| 17. | Shiremanstown Borough | 1.26% | 0.074% (+1.18)#17 | 0.067% (+1.19)#215 |
| 18. | Mount Holly Springs Borough | 1.25% | 0.074% (+1.17)#18 | 0.067% (+1.18)#218 |
| 19. | West Wyomissing | 1.16% | 0.074% (+1.09)#19 | 0.067% (+1.10)#232 |
| 20. | Smithfield Borough | 1.15% | 0.074% (+1.08)#20 | 0.067% (+1.09)#237 |
| 21. | Slatington Borough | 1.10% | 0.074% (+1.02)#21 | 0.067% (+1.03)#254 |
| 22. | Emigsville | 0.99% | 0.074% (+0.914)#22 | 0.067% (+0.922)#289 |
| 23. | Youngwood Borough | 0.98% | 0.074% (+0.908)#23 | 0.067% (+0.915)#292 |
| 24. | Selinsgrove Borough | 0.98% | 0.074% (+0.907)#24 | 0.067% (+0.914)#293 |
| 25. | Aliquippa | 0.98% | 0.074% (+0.905)#25 | 0.067% (+0.912)#295 |
| 26. | Conyngham Borough | 0.98% | 0.074% (+0.904)#26 | 0.067% (+0.911)#296 |
| 27. | Glen Rock Borough | 0.97% | 0.074% (+0.899)#27 | 0.067% (+0.906)#298 |
| 28. | Ben Avon Heights Borough | 0.96% | 0.074% (+0.888)#28 | 0.067% (+0.895)#300 |
| 29. | Jamestown Borough | 0.92% | 0.074% (+0.849)#29 | 0.067% (+0.857)#313 |
| 30. | Calumet | 0.91% | 0.074% (+0.835)#30 | 0.067% (+0.842)#320 |
| 31. | Gap | 0.90% | 0.074% (+0.830)#31 | 0.067% (+0.837)#324 |
| 32. | Kelayres | 0.86% | 0.074% (+0.787)#32 | 0.067% (+0.794)#343 |
| 33. | West Brownsville Borough | 0.82% | 0.074% (+0.751)#33 | 0.067% (+0.758)#359 |
| 34. | Plum Borough | 0.81% | 0.074% (+0.737)#34 | 0.067% (+0.744)#370 |
| 35. | Leetsdale Borough | 0.80% | 0.074% (+0.726)#35 | 0.067% (+0.733)#380 |
| 36. | Heidelberg Borough | 0.80% | 0.074% (+0.724)#36 | 0.067% (+0.731)#384 |
| 37. | Ligonier Borough | 0.79% | 0.074% (+0.721)#37 | 0.067% (+0.728)#385 |
| 38. | Tower City Borough | 0.75% | 0.074% (+0.679)#38 | 0.067% (+0.686)#408 |
| 39. | White Oak Borough | 0.75% | 0.074% (+0.678)#39 | 0.067% (+0.685)#409 |
| 40. | Hazleton | 0.75% | 0.074% (+0.675)#40 | 0.067% (+0.682)#411 |
| 41. | Duncannon Borough | 0.73% | 0.074% (+0.661)#41 | 0.067% (+0.668)#417 |
| 42. | Paxtonia | 0.73% | 0.074% (+0.656)#42 | 0.067% (+0.663)#420 |
| 43. | Castle Shannon Borough | 0.70% | 0.074% (+0.627)#43 | 0.067% (+0.634)#435 |
| 44. | Freedom Borough | 0.68% | 0.074% (+0.603)#44 | 0.067% (+0.610)#449 |
| 45. | Mill Village Borough | 0.66% | 0.074% (+0.584)#45 | 0.067% (+0.591)#462 |
| 46. | Sewickley Heights Borough | 0.66% | 0.074% (+0.583)#46 | 0.067% (+0.590)#464 |
| 47. | Avon | 0.64% | 0.074% (+0.569)#47 | 0.067% (+0.576)#475 |
| 48. | Faxon | 0.64% | 0.074% (+0.562)#48 | 0.067% (+0.569)#485 |
| 49. | Avoca Borough | 0.63% | 0.074% (+0.560)#49 | 0.067% (+0.567)#489 |
| 50. | North Warren | 0.62% | 0.074% (+0.551)#50 | 0.067% (+0.558)#495 |
| 51. | Beech Mountain Lakes | 0.62% | 0.074% (+0.545)#51 | 0.067% (+0.552)#500 |
| 52. | Enon Valley Borough | 0.61% | 0.074% (+0.540)#52 | 0.067% (+0.547)#506 |
| 53. | Enola | 0.57% | 0.074% (+0.494)#53 | 0.067% (+0.501)#546 |
| 54. | Big Beaver Borough | 0.56% | 0.074% (+0.483)#54 | 0.067% (+0.490)#555 |
| 55. | Erie | 0.56% | 0.074% (+0.482)#55 | 0.067% (+0.489)#556 |
| 56. | Sayre Borough | 0.55% | 0.074% (+0.476)#56 | 0.067% (+0.483)#562 |
| 57. | Parryville Borough | 0.54% | 0.074% (+0.467)#57 | 0.067% (+0.474)#573 |
| 58. | West Lawn | 0.54% | 0.074% (+0.467)#58 | 0.067% (+0.474)#575 |
| 59. | West Newton Borough | 0.53% | 0.074% (+0.454)#59 | 0.067% (+0.461)#587 |
| 60. | Pymatuning Central | 0.52% | 0.074% (+0.442)#60 | 0.067% (+0.450)#602 |
| 61. | Spinnerstown | 0.51% | 0.074% (+0.435)#61 | 0.067% (+0.442)#612 |
| 62. | Economy Borough | 0.50% | 0.074% (+0.423)#62 | 0.067% (+0.430)#625 |
| 63. | Mocanaqua | 0.49% | 0.074% (+0.417)#63 | 0.067% (+0.424)#630 |
| 64. | Garrett Borough | 0.49% | 0.074% (+0.415)#64 | 0.067% (+0.422)#633 |
| 65. | Mcsherrystown Borough | 0.49% | 0.074% (+0.412)#65 | 0.067% (+0.419)#635 |
| 66. | Cecil Bishop | 0.48% | 0.074% (+0.411)#66 | 0.067% (+0.418)#638 |
| 67. | Duboistown Borough | 0.45% | 0.074% (+0.380)#67 | 0.067% (+0.387)#676 |
| 68. | Denver Borough | 0.45% | 0.074% (+0.375)#68 | 0.067% (+0.382)#684 |
| 69. | Ellwood City Borough | 0.44% | 0.074% (+0.369)#69 | 0.067% (+0.376)#690 |
| 70. | Baldwin Borough | 0.44% | 0.074% (+0.368)#70 | 0.067% (+0.375)#692 |
| 71. | Ben Avon Borough | 0.43% | 0.074% (+0.352)#71 | 0.067% (+0.359)#715 |
| 72. | South Connellsville Borough | 0.42% | 0.074% (+0.351)#72 | 0.067% (+0.358)#717 |
| 73. | Pleasant Hills Borough | 0.41% | 0.074% (+0.340)#73 | 0.067% (+0.347)#738 |
| 74. | Valencia Borough | 0.40% | 0.074% (+0.325)#74 | 0.067% (+0.332)#765 |
| 75. | Mckees Rocks Borough | 0.39% | 0.074% (+0.317)#75 | 0.067% (+0.324)#781 |
| 76. | Ingram Borough | 0.39% | 0.074% (+0.314)#76 | 0.067% (+0.321)#787 |
| 77. | Spry | 0.38% | 0.074% (+0.305)#77 | 0.067% (+0.312)#800 |
| 78. | Boalsburg | 0.37% | 0.074% (+0.299)#78 | 0.067% (+0.306)#813 |
| 79. | Avonia | 0.37% | 0.074% (+0.297)#79 | 0.067% (+0.304)#818 |
| 80. | Yoe Borough | 0.36% | 0.074% (+0.291)#80 | 0.067% (+0.298)#828 |
| 81. | Ridley Park Borough | 0.35% | 0.074% (+0.276)#81 | 0.067% (+0.283)#863 |
| 82. | South Coatesville Borough | 0.34% | 0.074% (+0.269)#82 | 0.067% (+0.276)#878 |
| 83. | Monongahela | 0.34% | 0.074% (+0.264)#83 | 0.067% (+0.271)#891 |
| 84. | Greencastle Borough | 0.33% | 0.074% (+0.257)#84 | 0.067% (+0.264)#905 |
| 85. | Fairview Ferndale | 0.33% | 0.074% (+0.253)#85 | 0.067% (+0.260)#912 |
| 86. | Southmont Borough | 0.32% | 0.074% (+0.245)#86 | 0.067% (+0.252)#929 |
| 87. | Jefferson Hills Borough | 0.32% | 0.074% (+0.244)#87 | 0.067% (+0.251)#934 |
| 88. | Plymouth Borough | 0.31% | 0.074% (+0.238)#88 | 0.067% (+0.245)#950 |
| 89. | Mahanoy City Borough | 0.31% | 0.074% (+0.236)#89 | 0.067% (+0.244)#956 |
| 90. | Bell Acres Borough | 0.31% | 0.074% (+0.236)#90 | 0.067% (+0.243)#957 |
| 91. | Cambridge Springs Borough | 0.30% | 0.074% (+0.231)#91 | 0.067% (+0.238)#965 |
| 92. | Southwest Greensburg Borough | 0.30% | 0.074% (+0.225)#92 | 0.067% (+0.232)#981 |
| 93. | Burnham Borough | 0.30% | 0.074% (+0.223)#93 | 0.067% (+0.230)#988 |
| 94. | Hummelstown Borough | 0.29% | 0.074% (+0.213)#94 | 0.067% (+0.220)#1,022 |
| 95. | White Haven Borough | 0.28% | 0.074% (+0.207)#95 | 0.067% (+0.214)#1,038 |
| 96. | New Wilmington Borough | 0.28% | 0.074% (+0.205)#96 | 0.067% (+0.212)#1,044 |
| 97. | Kane Borough | 0.28% | 0.074% (+0.204)#97 | 0.067% (+0.211)#1,047 |
| 98. | Hawley Borough | 0.27% | 0.074% (+0.197)#98 | 0.067% (+0.204)#1,059 |
| 99. | Messiah College | 0.27% | 0.074% (+0.194)#99 | 0.067% (+0.201)#1,070 |
| 100. | Delmont Borough | 0.27% | 0.074% (+0.193)#100 | 0.067% (+0.201)#1,071 |
Common Questions
What are the Top 10 Cities with the Highest Percentage of Yugoslavian Population in Pennsylvania?
Top 10 Cities with the Highest Percentage of Yugoslavian Population in Pennsylvania are:
#1
10.40%
#2
5.35%
#3
3.37%
#4
2.74%
#5
2.03%
#6
1.59%
#7
1.16%
#8
0.99%
#9
0.98%
#10
0.91%
What city has the Highest Percentage of Yugoslavian Population in Pennsylvania?
Wilcox has the Highest Percentage of Yugoslavian Population in Pennsylvania with 10.40%.
What is the Percentage of Yugoslavian Population in the State of Pennsylvania?
Percentage of Yugoslavian Population in Pennsylvania is 0.074%.
What is the Percentage of Yugoslavian Population in the United States?
Percentage of Yugoslavian Population in the United States is 0.067%.