Cities with the Most Immigrants from Western Africa in Pennsylvania
RELATED REPORTS & OPTIONS
Western Africa
Pennsylvania
Compare Cities
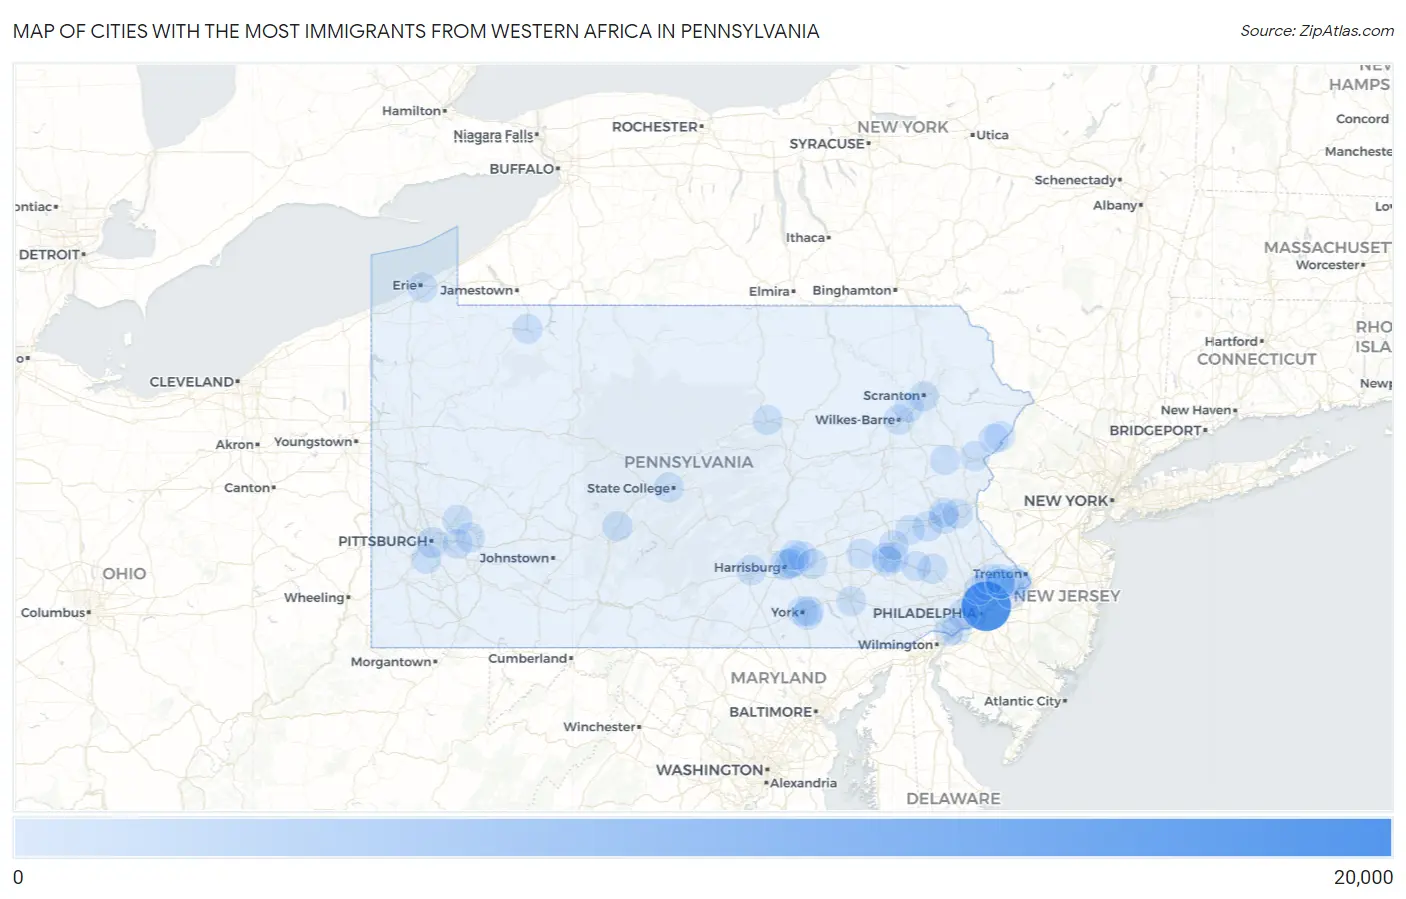
Map of Cities with the Most Immigrants from Western Africa in Pennsylvania
0
20,000
Cities with the Most Immigrants from Western Africa in Pennsylvania
| City | Western Africa | vs State | vs National | |
| 1. | Philadelphia | 15,751 | 40,910(38.50%)#1 | 985,560(1.60%)#3 |
| 2. | Darby Borough | 1,186 | 40,910(2.90%)#2 | 985,560(0.12%)#110 |
| 3. | Pittsburgh | 864 | 40,910(2.11%)#3 | 985,560(0.09%)#160 |
| 4. | Harrisburg | 740 | 40,910(1.81%)#4 | 985,560(0.08%)#180 |
| 5. | Lansdowne Borough | 690 | 40,910(1.69%)#5 | 985,560(0.07%)#198 |
| 6. | Colwyn Borough | 632 | 40,910(1.54%)#6 | 985,560(0.06%)#225 |
| 7. | Yeadon Borough | 618 | 40,910(1.51%)#7 | 985,560(0.06%)#232 |
| 8. | Drexel Hill | 591 | 40,910(1.44%)#8 | 985,560(0.06%)#241 |
| 9. | Sharon Hill Borough | 548 | 40,910(1.34%)#9 | 985,560(0.06%)#258 |
| 10. | Folcroft Borough | 401 | 40,910(0.98%)#10 | 985,560(0.04%)#355 |
| 11. | Allentown | 356 | 40,910(0.87%)#11 | 985,560(0.04%)#390 |
| 12. | Colonial Park | 325 | 40,910(0.79%)#12 | 985,560(0.03%)#428 |
| 13. | Collingdale Borough | 320 | 40,910(0.78%)#13 | 985,560(0.03%)#434 |
| 14. | Schlusser | 247 | 40,910(0.60%)#14 | 985,560(0.03%)#563 |
| 15. | Clifton Heights Borough | 238 | 40,910(0.58%)#15 | 985,560(0.02%)#577 |
| 16. | Reading | 232 | 40,910(0.57%)#16 | 985,560(0.02%)#587 |
| 17. | Brentwood Borough | 208 | 40,910(0.51%)#17 | 985,560(0.02%)#627 |
| 18. | Chester | 200 | 40,910(0.49%)#18 | 985,560(0.02%)#654 |
| 19. | Greenwood | 191 | 40,910(0.47%)#19 | 985,560(0.02%)#674 |
| 20. | Pine Ridge | 171 | 40,910(0.42%)#20 | 985,560(0.02%)#738 |
| 21. | State College Borough | 158 | 40,910(0.39%)#21 | 985,560(0.02%)#788 |
| 22. | Scranton | 154 | 40,910(0.38%)#22 | 985,560(0.02%)#814 |
| 23. | Aldan Borough | 154 | 40,910(0.38%)#23 | 985,560(0.02%)#818 |
| 24. | Breinigsville | 145 | 40,910(0.35%)#24 | 985,560(0.01%)#851 |
| 25. | Baldwin Borough | 132 | 40,910(0.32%)#25 | 985,560(0.01%)#917 |
| 26. | South Coatesville Borough | 132 | 40,910(0.32%)#26 | 985,560(0.01%)#920 |
| 27. | Newmanstown | 123 | 40,910(0.30%)#27 | 985,560(0.01%)#957 |
| 28. | East Stroudsburg Borough | 120 | 40,910(0.29%)#28 | 985,560(0.01%)#973 |
| 29. | York | 114 | 40,910(0.28%)#29 | 985,560(0.01%)#1,008 |
| 30. | Millbourne Borough | 101 | 40,910(0.25%)#30 | 985,560(0.01%)#1,077 |
| 31. | Bristol Borough | 99 | 40,910(0.24%)#31 | 985,560(0.01%)#1,092 |
| 32. | Sanatoga | 99 | 40,910(0.24%)#32 | 985,560(0.01%)#1,094 |
| 33. | Bethlehem | 97 | 40,910(0.24%)#33 | 985,560(0.01%)#1,107 |
| 34. | Pottstown Borough | 96 | 40,910(0.23%)#34 | 985,560(0.01%)#1,119 |
| 35. | Croydon | 96 | 40,910(0.23%)#35 | 985,560(0.01%)#1,123 |
| 36. | Erie | 95 | 40,910(0.23%)#36 | 985,560(0.01%)#1,126 |
| 37. | Levittown | 94 | 40,910(0.23%)#37 | 985,560(0.01%)#1,131 |
| 38. | Fairless Hills | 92 | 40,910(0.22%)#38 | 985,560(0.01%)#1,147 |
| 39. | Skyline View | 92 | 40,910(0.22%)#39 | 985,560(0.01%)#1,150 |
| 40. | Swarthmore Borough | 89 | 40,910(0.22%)#40 | 985,560(0.01%)#1,178 |
| 41. | Arlington Heights | 85 | 40,910(0.21%)#41 | 985,560(0.01%)#1,215 |
| 42. | Saw Creek | 83 | 40,910(0.20%)#42 | 985,560(0.01%)#1,236 |
| 43. | Prospect Park Borough | 82 | 40,910(0.20%)#43 | 985,560(0.01%)#1,240 |
| 44. | Bellefonte Borough | 82 | 40,910(0.20%)#44 | 985,560(0.01%)#1,241 |
| 45. | Whitehall Borough | 80 | 40,910(0.20%)#45 | 985,560(0.01%)#1,259 |
| 46. | West Lawn | 73 | 40,910(0.18%)#46 | 985,560(0.01%)#1,329 |
| 47. | Glenolden Borough | 72 | 40,910(0.18%)#47 | 985,560(0.01%)#1,343 |
| 48. | Sun Valley | 72 | 40,910(0.18%)#48 | 985,560(0.01%)#1,344 |
| 49. | Murrysville | 70 | 40,910(0.17%)#49 | 985,560(0.01%)#1,359 |
| 50. | Norristown Borough | 69 | 40,910(0.17%)#50 | 985,560(0.01%)#1,371 |
| 51. | Arnold | 67 | 40,910(0.16%)#51 | 985,560(0.01%)#1,406 |
| 52. | Willow Grove | 66 | 40,910(0.16%)#52 | 985,560(0.01%)#1,418 |
| 53. | Progress | 64 | 40,910(0.16%)#53 | 985,560(0.01%)#1,443 |
| 54. | Hamburg Borough | 60 | 40,910(0.15%)#54 | 985,560(0.01%)#1,503 |
| 55. | East Lansdowne Borough | 59 | 40,910(0.14%)#55 | 985,560(0.01%)#1,517 |
| 56. | Oreland | 58 | 40,910(0.14%)#56 | 985,560(0.01%)#1,530 |
| 57. | Amity Gardens | 58 | 40,910(0.14%)#57 | 985,560(0.01%)#1,531 |
| 58. | Warminster Heights | 58 | 40,910(0.14%)#58 | 985,560(0.01%)#1,532 |
| 59. | Monroeville | 57 | 40,910(0.14%)#59 | 985,560(0.01%)#1,537 |
| 60. | Warren | 56 | 40,910(0.14%)#60 | 985,560(0.01%)#1,554 |
| 61. | Trevose | 56 | 40,910(0.14%)#61 | 985,560(0.01%)#1,560 |
| 62. | Linglestown | 54 | 40,910(0.13%)#62 | 985,560(0.01%)#1,588 |
| 63. | Wilkes Barre | 53 | 40,910(0.13%)#63 | 985,560(0.01%)#1,592 |
| 64. | Park Forest Village | 52 | 40,910(0.13%)#64 | 985,560(0.01%)#1,614 |
| 65. | Bethel Park | 48 | 40,910(0.12%)#65 | 985,560(0.00%)#1,679 |
| 66. | Fullerton | 48 | 40,910(0.12%)#66 | 985,560(0.00%)#1,684 |
| 67. | Sinking Spring Borough | 47 | 40,910(0.11%)#67 | 985,560(0.00%)#1,700 |
| 68. | Queens Gate | 46 | 40,910(0.11%)#68 | 985,560(0.00%)#1,719 |
| 69. | Freemansburg Borough | 45 | 40,910(0.11%)#69 | 985,560(0.00%)#1,739 |
| 70. | Steelton Borough | 43 | 40,910(0.11%)#70 | 985,560(0.00%)#1,773 |
| 71. | Morton Borough | 43 | 40,910(0.11%)#71 | 985,560(0.00%)#1,776 |
| 72. | Elkins Park | 42 | 40,910(0.10%)#72 | 985,560(0.00%)#1,803 |
| 73. | Rochester Borough | 42 | 40,910(0.10%)#73 | 985,560(0.00%)#1,808 |
| 74. | Red Hill Borough | 42 | 40,910(0.10%)#74 | 985,560(0.00%)#1,809 |
| 75. | Mount Penn Borough | 41 | 40,910(0.10%)#75 | 985,560(0.00%)#1,830 |
| 76. | Eddystone Borough | 41 | 40,910(0.10%)#76 | 985,560(0.00%)#1,831 |
| 77. | Lancaster | 40 | 40,910(0.10%)#77 | 985,560(0.00%)#1,836 |
| 78. | Villanova | 40 | 40,910(0.10%)#78 | 985,560(0.00%)#1,853 |
| 79. | Trainer Borough | 40 | 40,910(0.10%)#79 | 985,560(0.00%)#1,862 |
| 80. | Morrisville Borough | 39 | 40,910(0.10%)#80 | 985,560(0.00%)#1,875 |
| 81. | Pittston | 39 | 40,910(0.10%)#81 | 985,560(0.00%)#1,876 |
| 82. | Wall Borough | 39 | 40,910(0.10%)#82 | 985,560(0.00%)#1,882 |
| 83. | West Chester Borough | 37 | 40,910(0.09%)#83 | 985,560(0.00%)#1,909 |
| 84. | East York | 37 | 40,910(0.09%)#84 | 985,560(0.00%)#1,915 |
| 85. | Charleroi Borough | 37 | 40,910(0.09%)#85 | 985,560(0.00%)#1,921 |
| 86. | Kutztown University | 37 | 40,910(0.09%)#86 | 985,560(0.00%)#1,923 |
| 87. | Churchville | 36 | 40,910(0.09%)#87 | 985,560(0.00%)#1,941 |
| 88. | Montrose Manor | 35 | 40,910(0.09%)#88 | 985,560(0.00%)#1,960 |
| 89. | Williamsport | 34 | 40,910(0.08%)#89 | 985,560(0.00%)#1,966 |
| 90. | Hershey | 34 | 40,910(0.08%)#90 | 985,560(0.00%)#1,971 |
| 91. | Quakertown Borough | 33 | 40,910(0.08%)#91 | 985,560(0.00%)#1,994 |
| 92. | Roslyn | 32 | 40,910(0.08%)#92 | 985,560(0.00%)#2,026 |
| 93. | Boothwyn | 32 | 40,910(0.08%)#93 | 985,560(0.00%)#2,032 |
| 94. | Temple | 31 | 40,910(0.08%)#94 | 985,560(0.00%)#2,063 |
| 95. | Feasterville | 31 | 40,910(0.08%)#95 | 985,560(0.00%)#2,064 |
| 96. | Wilkinsburg Borough | 30 | 40,910(0.07%)#96 | 985,560(0.00%)#2,078 |
| 97. | Penndel Borough | 30 | 40,910(0.07%)#97 | 985,560(0.00%)#2,085 |
| 98. | Wyomissing Borough | 29 | 40,910(0.07%)#98 | 985,560(0.00%)#2,105 |
| 99. | Ephrata Borough | 28 | 40,910(0.07%)#99 | 985,560(0.00%)#2,127 |
| 100. | Chestnut Hill | 27 | 40,910(0.07%)#100 | 985,560(0.00%)#2,156 |
Common Questions
What are the Top 10 Cities with the Most Immigrants from Western Africa in Pennsylvania?
Top 10 Cities with the Most Immigrants from Western Africa in Pennsylvania are:
#1
15,751
#2
864
#3
740
#4
591
#5
356
#6
325
#7
247
#8
232
#9
200
#10
191
What city has the Most Immigrants from Western Africa in Pennsylvania?
Philadelphia has the Most Immigrants from Western Africa in Pennsylvania with 15,751.
What is the Total Immigrants from Western Africa in the State of Pennsylvania?
Total Immigrants from Western Africa in Pennsylvania is 40,910.
What is the Total Immigrants from Western Africa in the United States?
Total Immigrants from Western Africa in the United States is 985,560.