New Market, PA Map & Demographics
New Market Map
New Market Overview
$26,200
PER CAPITA INCOME
$36,645
AVG HOUSEHOLD INCOME
57.2%
WAGE / INCOME GAP [ % ]
42.8¢/ $1
WAGE / INCOME GAP [ $ ]
0.49
INEQUALITY / GINI INDEX
979
TOTAL POPULATION
366
MALE POPULATION
613
FEMALE POPULATION
59.71
MALES / 100 FEMALES
167.49
FEMALES / 100 MALES
36.5
MEDIAN AGE
2.7
AVG FAMILY SIZE
2.1
AVG HOUSEHOLD SIZE
467
LABOR FORCE [ PEOPLE ]
69.0%
PERCENT IN LABOR FORCE
8.1%
UNEMPLOYMENT RATE
Income in New Market
Income Overview in New Market
| Characteristic | Number | Measure |
| Per Capita Income | 979 | $26,200 |
| Median Family Income | 264 | $0 |
| Mean Family Income | 264 | $73,207 |
| Median Household Income | 467 | $36,645 |
| Mean Household Income | 467 | $56,137 |
| Income Deficit | 264 | $0 |
| Wage / Income Gap (%) | 979 | 57.22% |
| Wage / Income Gap ($) | 979 | 42.78¢ per $1 |
| Gini / Inequality Index | 979 | 0.49 |
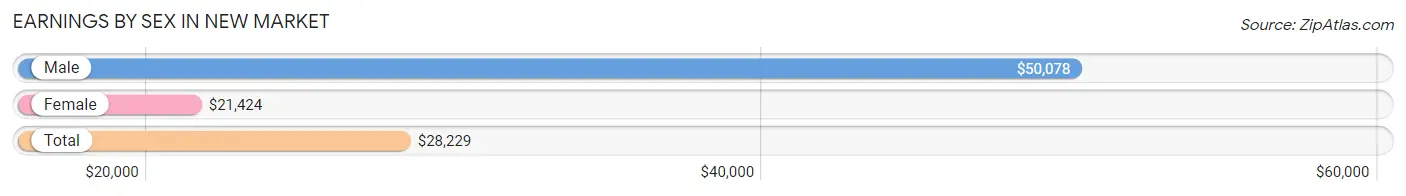
Earnings by Sex in New Market
Average Earnings in New Market are $28,229, $50,078 for men and $21,424 for women, a difference of 57.2%.
| Sex | Number | Average Earnings |
| Male | 219 (45.3%) | $50,078 |
| Female | 264 (54.7%) | $21,424 |
| Total | 483 (100.0%) | $28,229 |
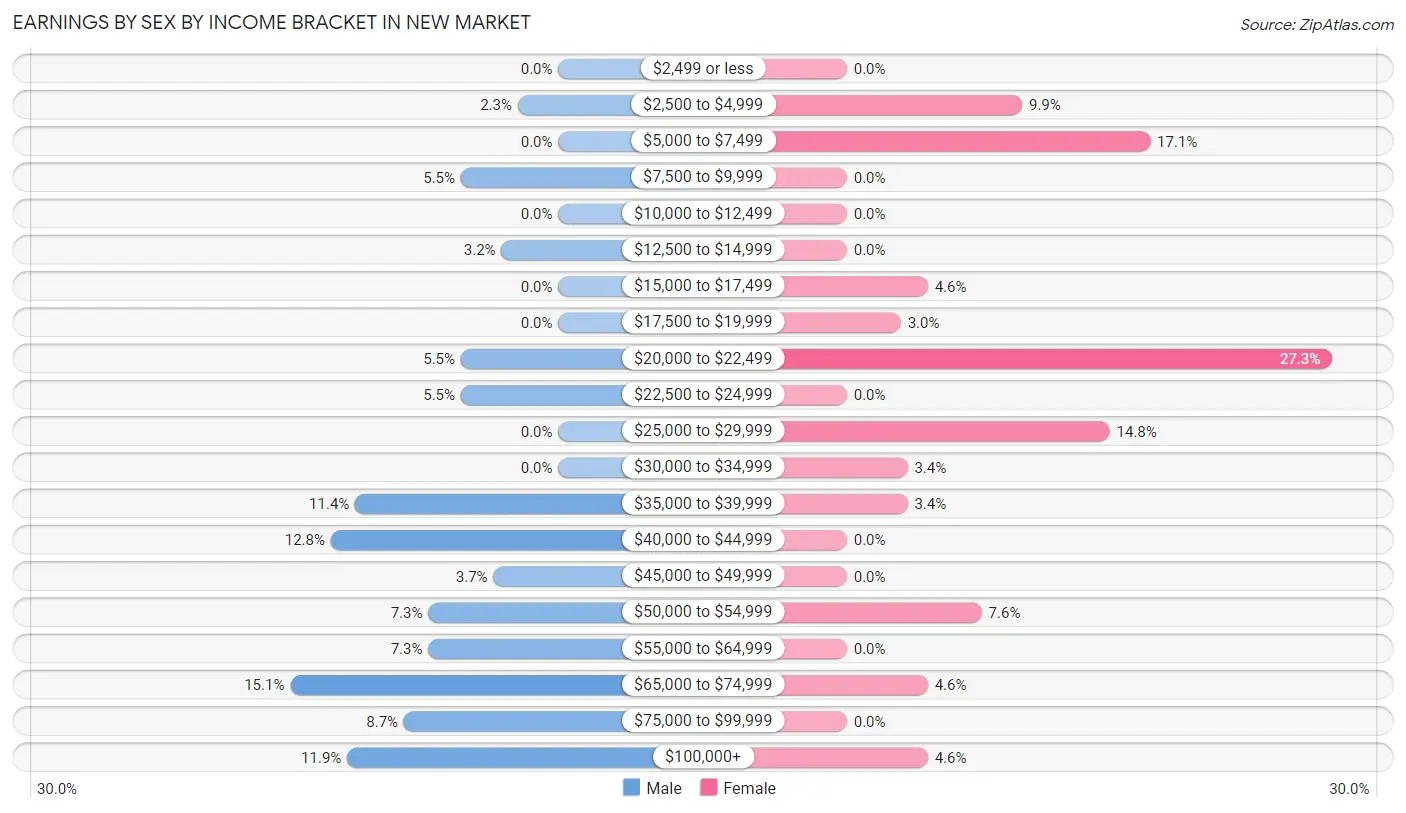
Earnings by Sex by Income Bracket in New Market
The most common earnings brackets in New Market are $65,000 to $74,999 for men (33 | 15.1%) and $20,000 to $22,499 for women (72 | 27.3%).
| Income | Male | Female |
| $2,499 or less | 0 (0.0%) | 0 (0.0%) |
| $2,500 to $4,999 | 5 (2.3%) | 26 (9.9%) |
| $5,000 to $7,499 | 0 (0.0%) | 45 (17.1%) |
| $7,500 to $9,999 | 12 (5.5%) | 0 (0.0%) |
| $10,000 to $12,499 | 0 (0.0%) | 0 (0.0%) |
| $12,500 to $14,999 | 7 (3.2%) | 0 (0.0%) |
| $15,000 to $17,499 | 0 (0.0%) | 12 (4.5%) |
| $17,500 to $19,999 | 0 (0.0%) | 8 (3.0%) |
| $20,000 to $22,499 | 12 (5.5%) | 72 (27.3%) |
| $22,500 to $24,999 | 12 (5.5%) | 0 (0.0%) |
| $25,000 to $29,999 | 0 (0.0%) | 39 (14.8%) |
| $30,000 to $34,999 | 0 (0.0%) | 9 (3.4%) |
| $35,000 to $39,999 | 25 (11.4%) | 9 (3.4%) |
| $40,000 to $44,999 | 28 (12.8%) | 0 (0.0%) |
| $45,000 to $49,999 | 8 (3.6%) | 0 (0.0%) |
| $50,000 to $54,999 | 16 (7.3%) | 20 (7.6%) |
| $55,000 to $64,999 | 16 (7.3%) | 0 (0.0%) |
| $65,000 to $74,999 | 33 (15.1%) | 12 (4.5%) |
| $75,000 to $99,999 | 19 (8.7%) | 0 (0.0%) |
| $100,000+ | 26 (11.9%) | 12 (4.5%) |
| Total | 219 (100.0%) | 264 (100.0%) |
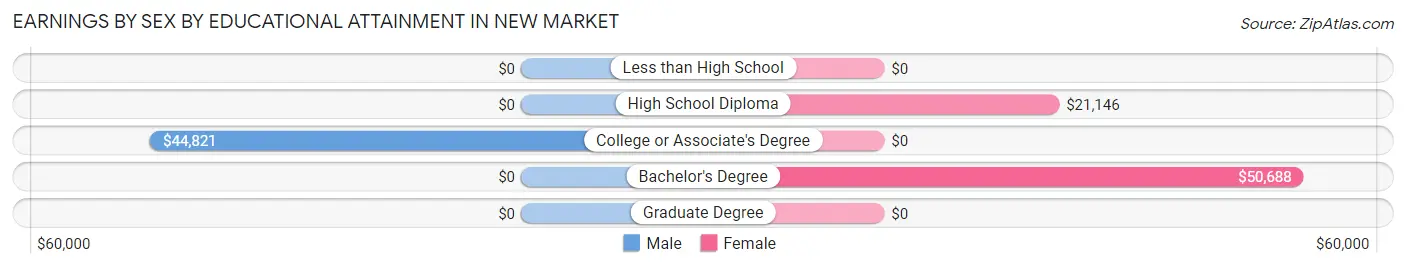
Earnings by Sex by Educational Attainment in New Market
Average earnings in New Market are $50,469 for men and $21,771 for women, a difference of 56.9%. Men with an educational attainment of college or associate's degree enjoy the highest average annual earnings of $44,821, while those with college or associate's degree education earn the least with $44,821. Women with an educational attainment of bachelor's degree earn the most with the average annual earnings of $50,688, while those with high school diploma education have the smallest earnings of $21,146.
| Educational Attainment | Male Income | Female Income |
| Less than High School | - | - |
| High School Diploma | - | - |
| College or Associate's Degree | $44,821 | $0 |
| Bachelor's Degree | - | - |
| Graduate Degree | - | - |
| Total | $50,469 | $21,771 |
Family Income in New Market
Family Income Brackets in New Market
According to the New Market family income data, there are 62 families falling into the $100,000 to $149,999 income range, which is the most common income bracket and makes up 23.5% of all families.
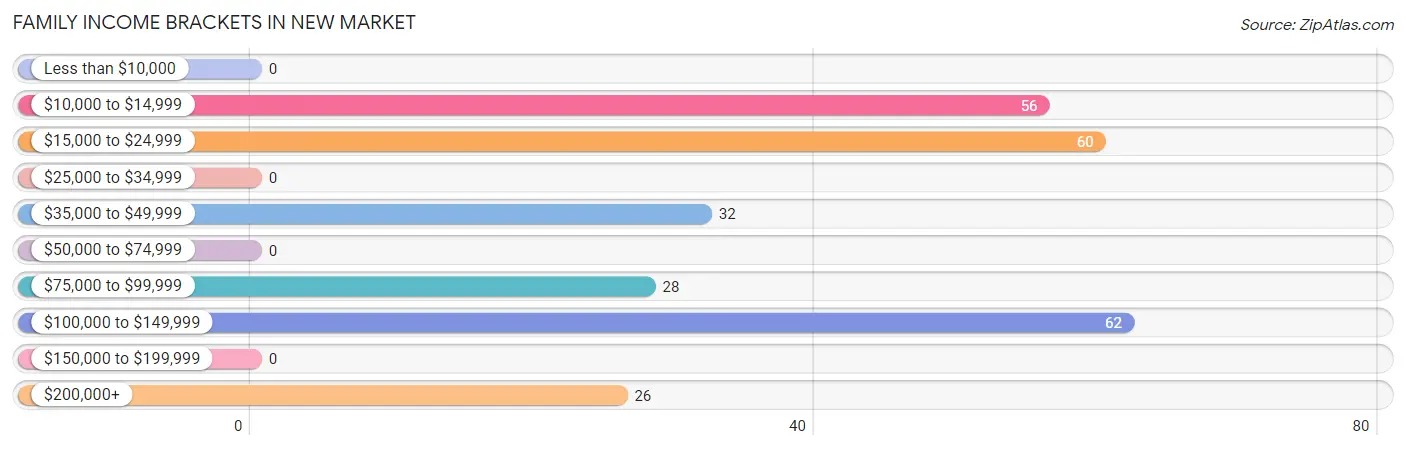
| Income Bracket | # Families | % Families |
| Less than $10,000 | 0 | 0.0% |
| $10,000 to $14,999 | 56 | 21.2% |
| $15,000 to $24,999 | 60 | 22.7% |
| $25,000 to $34,999 | 0 | 0.0% |
| $35,000 to $49,999 | 32 | 12.1% |
| $50,000 to $74,999 | 0 | 0.0% |
| $75,000 to $99,999 | 28 | 10.6% |
| $100,000 to $149,999 | 62 | 23.5% |
| $150,000 to $199,999 | 0 | 0.0% |
| $200,000+ | 26 | 9.8% |
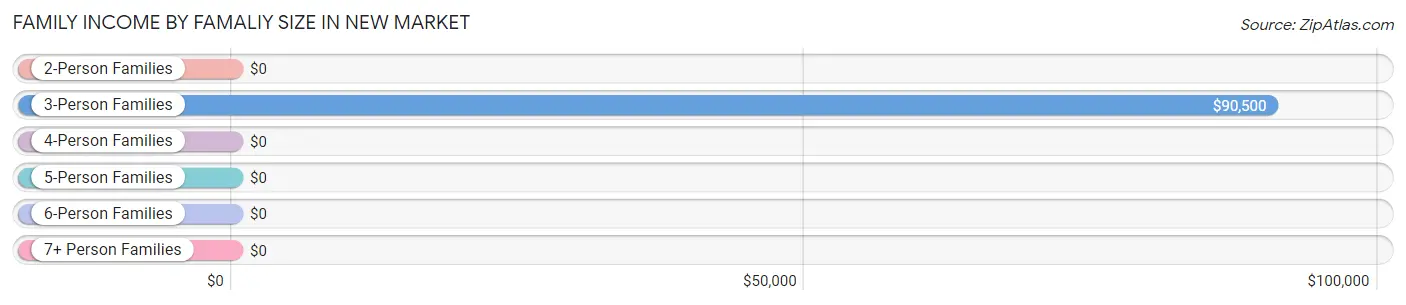
Family Income by Famaliy Size in New Market
3-person families (40 | 15.1%) account for the highest median family income in New Market with $90,500 per family, while 3-person families (40 | 15.1%) have the highest median income of $30,167 per family member.
| Income Bracket | # Families | Median Income |
| 2-Person Families | 144 (54.5%) | $0 |
| 3-Person Families | 40 (15.1%) | $90,500 |
| 4-Person Families | 80 (30.3%) | $0 |
| 5-Person Families | 0 (0.0%) | $0 |
| 6-Person Families | 0 (0.0%) | $0 |
| 7+ Person Families | 0 (0.0%) | $0 |
| Total | 264 (100.0%) | $0 |
Family Income by Number of Earners in New Market
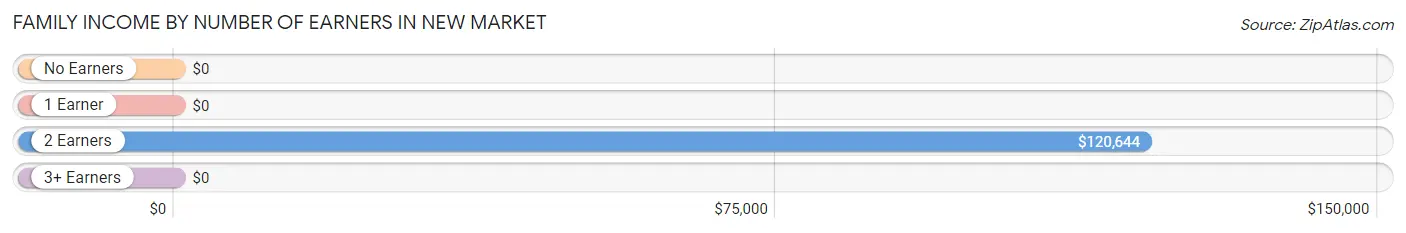
| Number of Earners | # Families | Median Income |
| No Earners | 56 (21.2%) | $0 |
| 1 Earner | 109 (41.3%) | $0 |
| 2 Earners | 91 (34.5%) | $120,644 |
| 3+ Earners | 8 (3.0%) | $0 |
| Total | 264 (100.0%) | $0 |
Household Income in New Market
Household Income Brackets in New Market
With 160 households falling in the category, the $15,000 to $24,999 income range is the most frequent in New Market, accounting for 34.3% of all households.
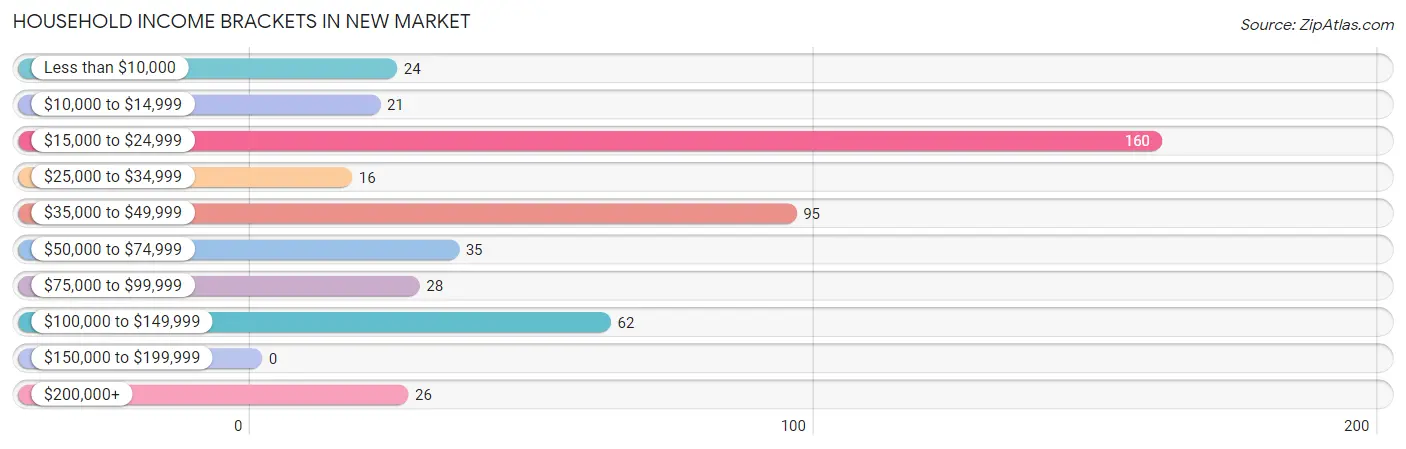
| Income Bracket | # Households | % Households |
| Less than $10,000 | 24 | 5.1% |
| $10,000 to $14,999 | 21 | 4.5% |
| $15,000 to $24,999 | 160 | 34.3% |
| $25,000 to $34,999 | 16 | 3.4% |
| $35,000 to $49,999 | 95 | 20.3% |
| $50,000 to $74,999 | 35 | 7.5% |
| $75,000 to $99,999 | 28 | 6.0% |
| $100,000 to $149,999 | 62 | 13.3% |
| $150,000 to $199,999 | 0 | 0.0% |
| $200,000+ | 26 | 5.6% |
Household Income by Householder Age in New Market
The median household income in New Market is $36,645, with the highest median household income of $43,393 found in the 25 to 44 years age bracket for the primary householder. A total of 212 households (45.4%) fall into this category.
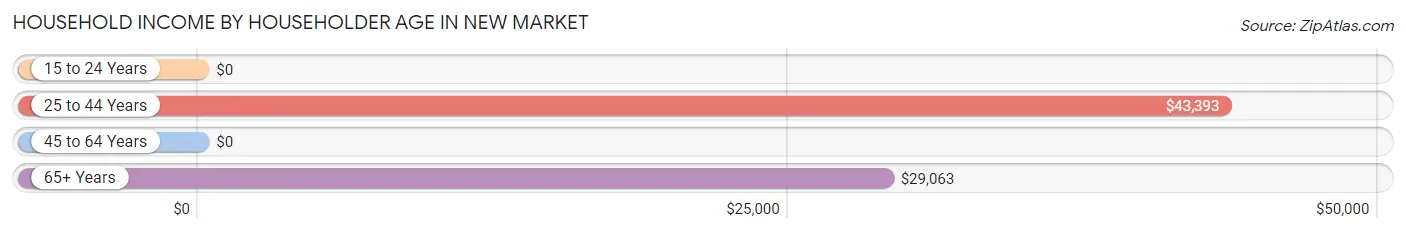
| Income Bracket | # Households | Median Income |
| 15 to 24 Years | 0 (0.0%) | $0 |
| 25 to 44 Years | 212 (45.4%) | $43,393 |
| 45 to 64 Years | 205 (43.9%) | $0 |
| 65+ Years | 50 (10.7%) | $29,063 |
| Total | 467 (100.0%) | $36,645 |
Poverty in New Market
Income Below Poverty by Sex and Age in New Market
With 26.2% poverty level for males and 31.5% for females among the residents of New Market, 5 year old males and 15 year old females are the most vulnerable to poverty, with 10 males (100.0%) and 48 females (64.9%) in their respective age groups living below the poverty level.
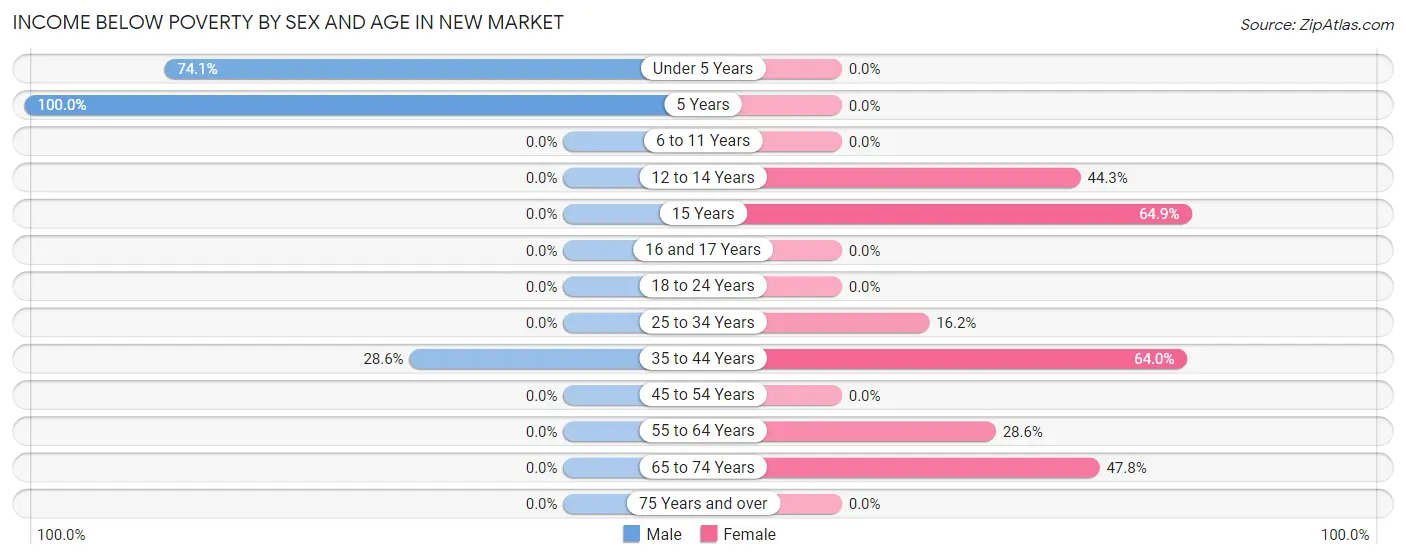
| Age Bracket | Male | Female |
| Under 5 Years | 40 (74.1%) | 0 (0.0%) |
| 5 Years | 10 (100.0%) | 0 (0.0%) |
| 6 to 11 Years | 0 (0.0%) | 0 (0.0%) |
| 12 to 14 Years | 0 (0.0%) | 43 (44.3%) |
| 15 Years | 0 (0.0%) | 48 (64.9%) |
| 16 and 17 Years | 0 (0.0%) | 0 (0.0%) |
| 18 to 24 Years | 0 (0.0%) | 0 (0.0%) |
| 25 to 34 Years | 0 (0.0%) | 12 (16.2%) |
| 35 to 44 Years | 46 (28.6%) | 55 (63.9%) |
| 45 to 54 Years | 0 (0.0%) | 0 (0.0%) |
| 55 to 64 Years | 0 (0.0%) | 24 (28.6%) |
| 65 to 74 Years | 0 (0.0%) | 11 (47.8%) |
| 75 Years and over | 0 (0.0%) | 0 (0.0%) |
| Total | 96 (26.2%) | 193 (31.5%) |
Income Above Poverty by Sex and Age in New Market
According to the poverty statistics in New Market, males aged 16 and 17 years and females aged under 5 years are the age groups that are most secure financially, with 100.0% of males and 100.0% of females in these age groups living above the poverty line.
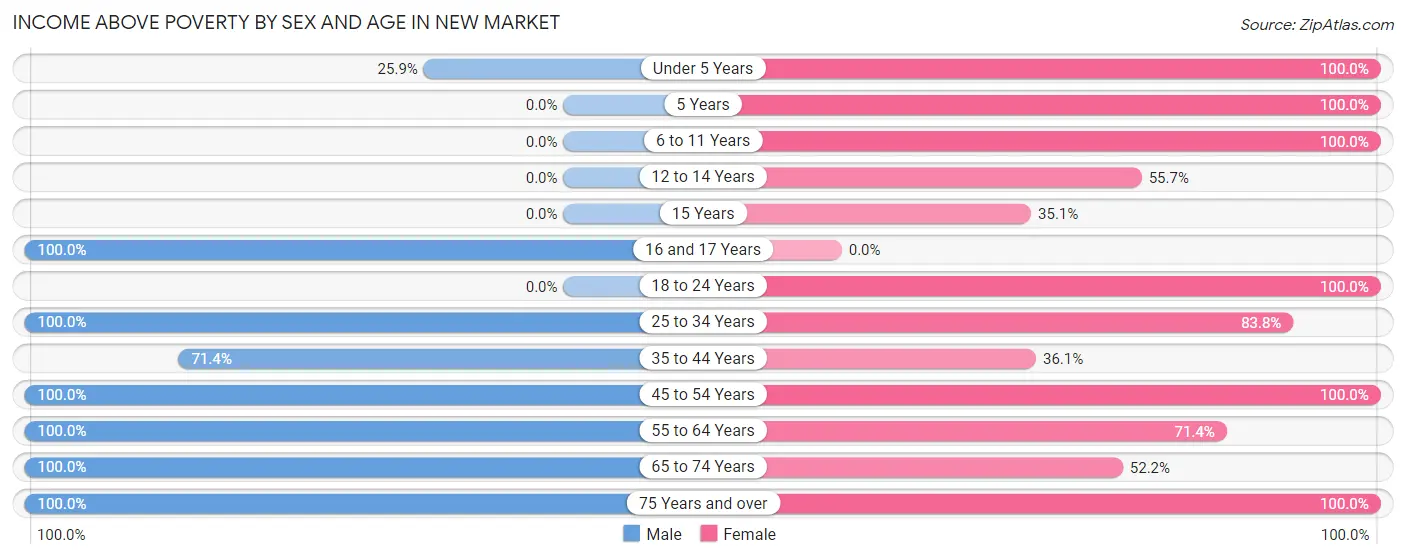
| Age Bracket | Male | Female |
| Under 5 Years | 14 (25.9%) | 10 (100.0%) |
| 5 Years | 0 (0.0%) | 6 (100.0%) |
| 6 to 11 Years | 0 (0.0%) | 51 (100.0%) |
| 12 to 14 Years | 0 (0.0%) | 54 (55.7%) |
| 15 Years | 0 (0.0%) | 26 (35.1%) |
| 16 and 17 Years | 5 (100.0%) | 0 (0.0%) |
| 18 to 24 Years | 0 (0.0%) | 20 (100.0%) |
| 25 to 34 Years | 23 (100.0%) | 62 (83.8%) |
| 35 to 44 Years | 115 (71.4%) | 31 (36.0%) |
| 45 to 54 Years | 26 (100.0%) | 80 (100.0%) |
| 55 to 64 Years | 60 (100.0%) | 60 (71.4%) |
| 65 to 74 Years | 16 (100.0%) | 12 (52.2%) |
| 75 Years and over | 11 (100.0%) | 8 (100.0%) |
| Total | 270 (73.8%) | 420 (68.5%) |
Income Below Poverty Among Married-Couple Families in New Market
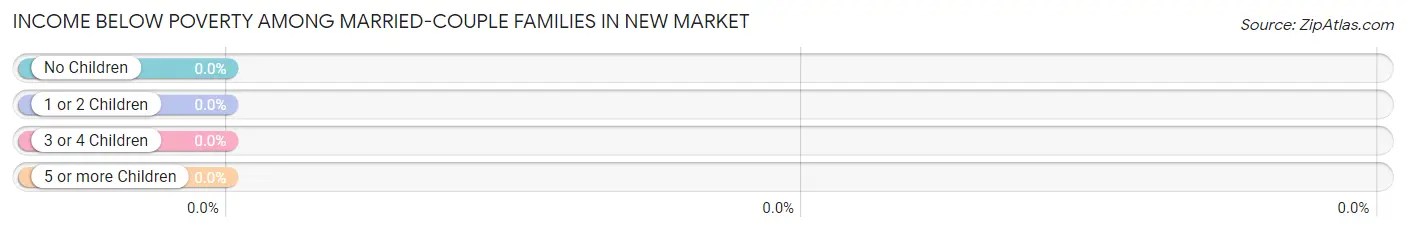
| Children | Above Poverty | Below Poverty |
| No Children | 61 (100.0%) | 0 (0.0%) |
| 1 or 2 Children | 54 (100.0%) | 0 (0.0%) |
| 3 or 4 Children | 0 (0.0%) | 0 (0.0%) |
| 5 or more Children | 0 (0.0%) | 0 (0.0%) |
| Total | 115 (100.0%) | 0 (0.0%) |
Income Below Poverty Among Single-Parent Households in New Market
According to the poverty data in New Market, 76.7% or 46 single-father households and 11.2% or 10 single-mother households are living below the poverty line. Among single-father households, those with 3 or 4 children have the highest poverty rate, with 46 households (100.0%) experiencing poverty. Likewise, among single-mother households, those with 1 or 2 children have the highest poverty rate, with 10 households (11.2%) falling below the poverty line.
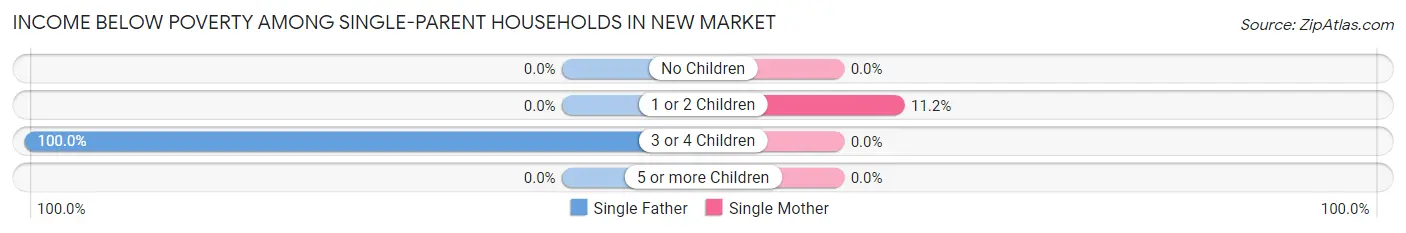
| Children | Single Father | Single Mother |
| No Children | 0 (0.0%) | 0 (0.0%) |
| 1 or 2 Children | 0 (0.0%) | 10 (11.2%) |
| 3 or 4 Children | 46 (100.0%) | 0 (0.0%) |
| 5 or more Children | 0 (0.0%) | 0 (0.0%) |
| Total | 46 (76.7%) | 10 (11.2%) |
Income Below Poverty Among Married-Couple vs Single-Parent Households in New Market
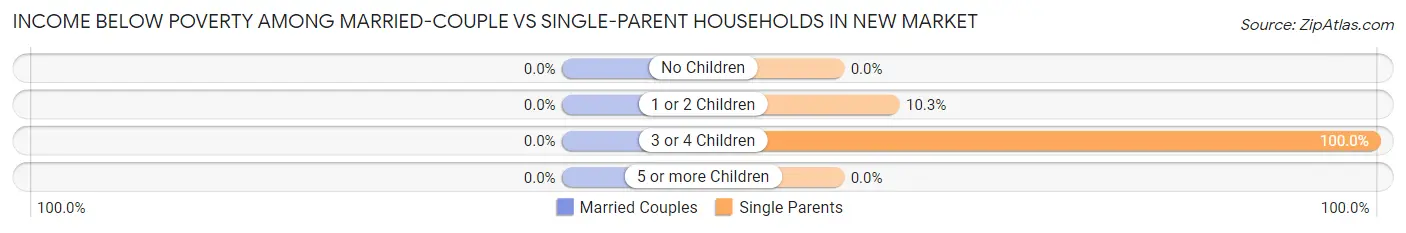
| Children | Married-Couple Families | Single-Parent Households |
| No Children | 0 (0.0%) | 0 (0.0%) |
| 1 or 2 Children | 0 (0.0%) | 10 (10.3%) |
| 3 or 4 Children | 0 (0.0%) | 46 (100.0%) |
| 5 or more Children | 0 (0.0%) | 0 (0.0%) |
| Total | 0 (0.0%) | 56 (37.6%) |
Race in New Market
The most populous races in New Market are White / Caucasian (663 | 67.7%), Black / African American (192 | 19.6%), and Asian (53 | 5.4%).
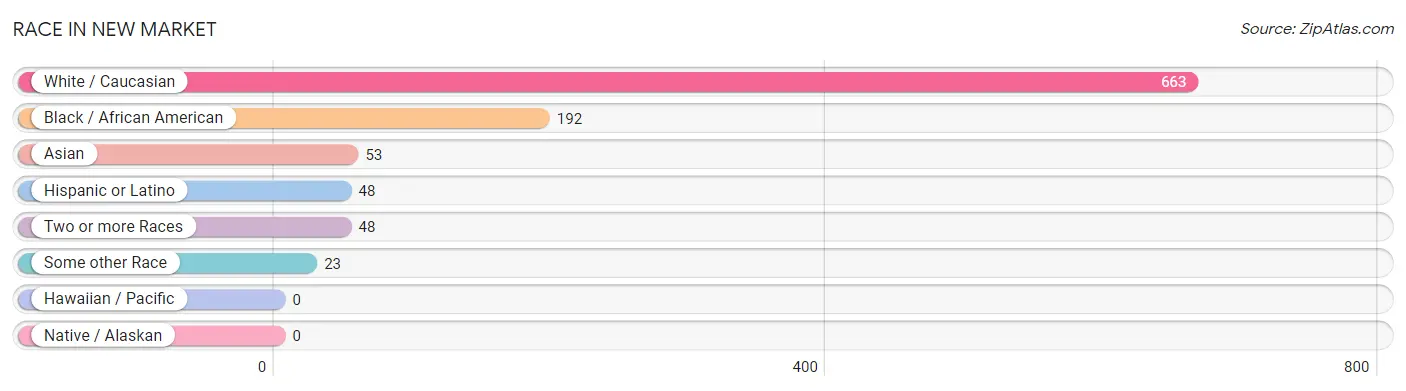
| Race | # Population | % Population |
| Asian | 53 | 5.4% |
| Black / African American | 192 | 19.6% |
| Hawaiian / Pacific | 0 | 0.0% |
| Hispanic or Latino | 48 | 4.9% |
| Native / Alaskan | 0 | 0.0% |
| White / Caucasian | 663 | 67.7% |
| Two or more Races | 48 | 4.9% |
| Some other Race | 23 | 2.4% |
| Total | 979 | 100.0% |
Ancestry in New Market
The most populous ancestries reported in New Market are German (251 | 25.6%), Italian (72 | 7.3%), Sri Lankan (53 | 5.4%), Irish (48 | 4.9%), and Puerto Rican (48 | 4.9%), together accounting for 48.2% of all New Market residents.
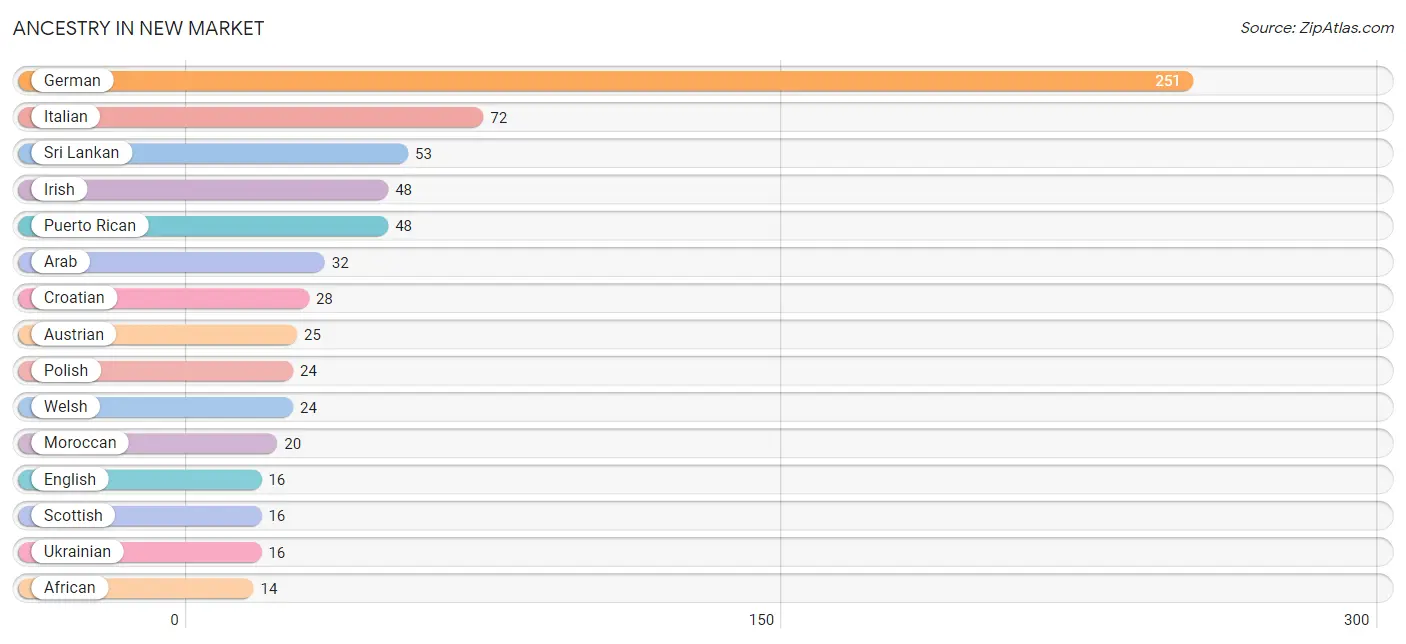
| Ancestry | # Population | % Population |
| African | 14 | 1.4% |
| American | 12 | 1.2% |
| Arab | 32 | 3.3% |
| Austrian | 25 | 2.5% |
| Croatian | 28 | 2.9% |
| Czechoslovakian | 9 | 0.9% |
| English | 16 | 1.6% |
| German | 251 | 25.6% |
| Irish | 48 | 4.9% |
| Italian | 72 | 7.3% |
| Moroccan | 20 | 2.0% |
| Polish | 24 | 2.5% |
| Puerto Rican | 48 | 4.9% |
| Scottish | 16 | 1.6% |
| Sri Lankan | 53 | 5.4% |
| Subsaharan African | 14 | 1.4% |
| Turkish | 14 | 1.4% |
| Ukrainian | 16 | 1.6% |
| Welsh | 24 | 2.5% | View All 19 Rows |
Immigrants in New Market
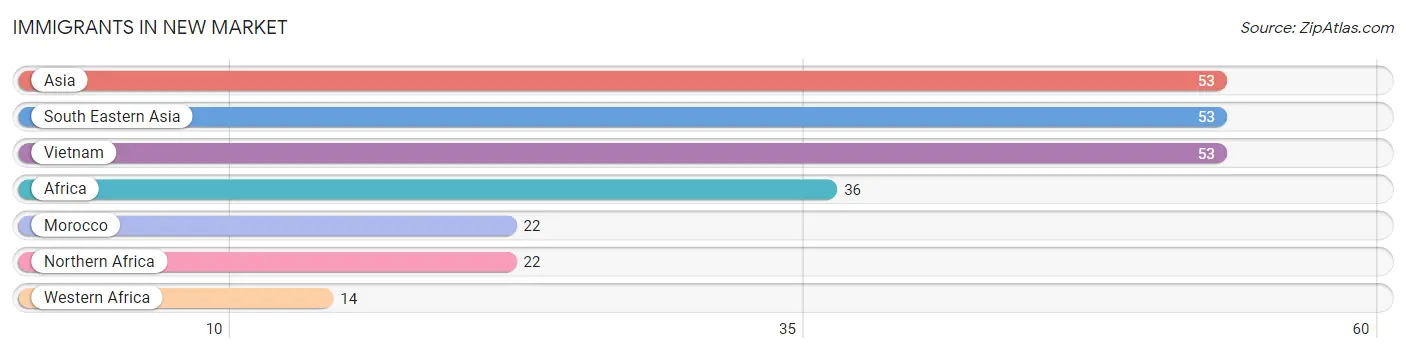
The most numerous immigrant groups reported in New Market came from Asia (53 | 5.4%), South Eastern Asia (53 | 5.4%), Vietnam (53 | 5.4%), Africa (36 | 3.7%), and Morocco (22 | 2.2%), together accounting for 22.2% of all New Market residents.
| Immigration Origin | # Population | % Population |
| Africa | 36 | 3.7% |
| Asia | 53 | 5.4% |
| Morocco | 22 | 2.2% |
| Northern Africa | 22 | 2.2% |
| South Eastern Asia | 53 | 5.4% |
| Vietnam | 53 | 5.4% |
| Western Africa | 14 | 1.4% | View All 7 Rows |
Sex and Age in New Market
Sex and Age in New Market
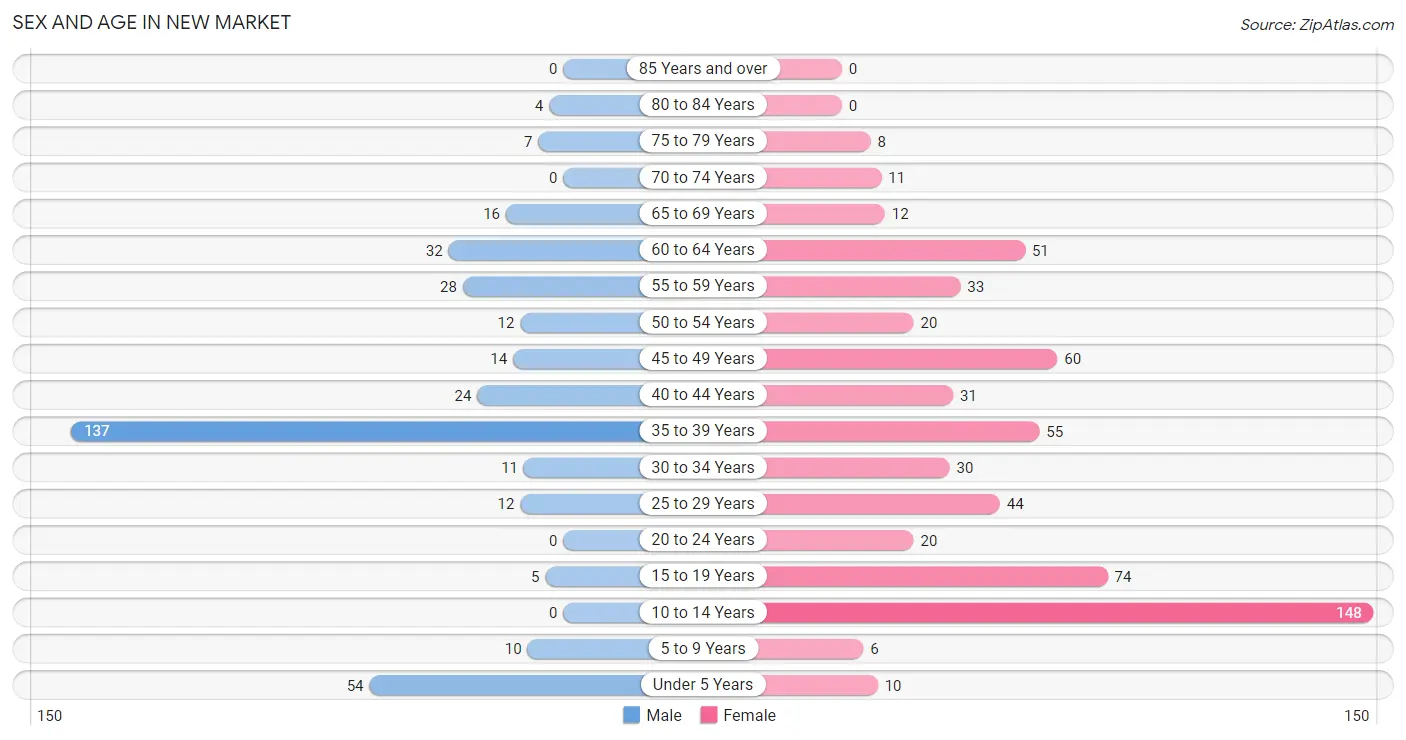
The most populous age groups in New Market are 35 to 39 Years (137 | 37.4%) for men and 10 to 14 Years (148 | 24.1%) for women.
| Age Bracket | Male | Female |
| Under 5 Years | 54 (14.7%) | 10 (1.6%) |
| 5 to 9 Years | 10 (2.7%) | 6 (1.0%) |
| 10 to 14 Years | 0 (0.0%) | 148 (24.1%) |
| 15 to 19 Years | 5 (1.4%) | 74 (12.1%) |
| 20 to 24 Years | 0 (0.0%) | 20 (3.3%) |
| 25 to 29 Years | 12 (3.3%) | 44 (7.2%) |
| 30 to 34 Years | 11 (3.0%) | 30 (4.9%) |
| 35 to 39 Years | 137 (37.4%) | 55 (9.0%) |
| 40 to 44 Years | 24 (6.6%) | 31 (5.1%) |
| 45 to 49 Years | 14 (3.8%) | 60 (9.8%) |
| 50 to 54 Years | 12 (3.3%) | 20 (3.3%) |
| 55 to 59 Years | 28 (7.6%) | 33 (5.4%) |
| 60 to 64 Years | 32 (8.7%) | 51 (8.3%) |
| 65 to 69 Years | 16 (4.4%) | 12 (2.0%) |
| 70 to 74 Years | 0 (0.0%) | 11 (1.8%) |
| 75 to 79 Years | 7 (1.9%) | 8 (1.3%) |
| 80 to 84 Years | 4 (1.1%) | 0 (0.0%) |
| 85 Years and over | 0 (0.0%) | 0 (0.0%) |
| Total | 366 (100.0%) | 613 (100.0%) |
Families and Households in New Market
Median Family Size in New Market
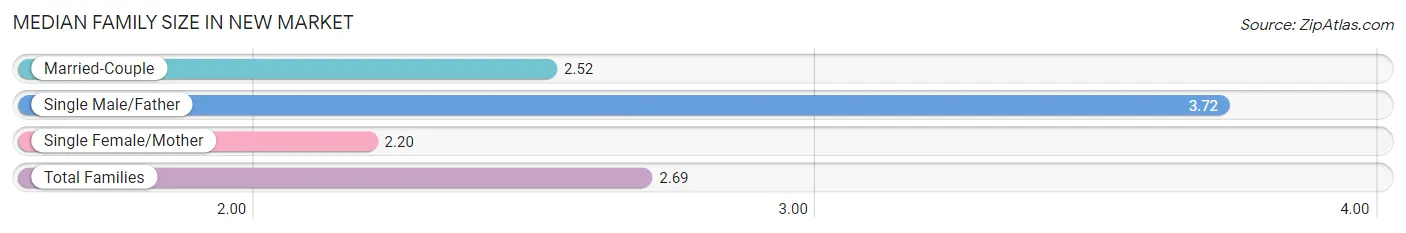
The median family size in New Market is 2.69 persons per family, with single male/father families (60 | 22.7%) accounting for the largest median family size of 3.72 persons per family. On the other hand, single female/mother families (89 | 33.7%) represent the smallest median family size with 2.20 persons per family.
| Family Type | # Families | Family Size |
| Married-Couple | 115 (43.6%) | 2.52 |
| Single Male/Father | 60 (22.7%) | 3.72 |
| Single Female/Mother | 89 (33.7%) | 2.20 |
| Total Families | 264 (100.0%) | 2.69 |
Median Household Size in New Market
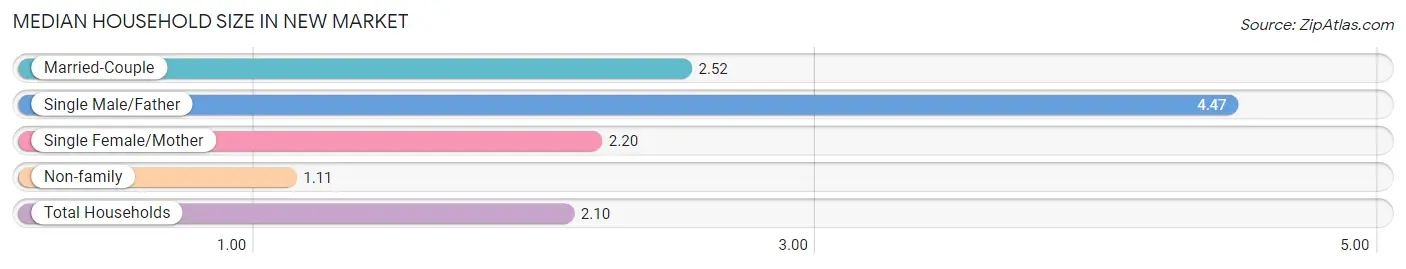
The median household size in New Market is 2.10 persons per household, with single male/father households (60 | 12.9%) accounting for the largest median household size of 4.47 persons per household. non-family households (203 | 43.5%) represent the smallest median household size with 1.11 persons per household.
| Household Type | # Households | Household Size |
| Married-Couple | 115 (24.6%) | 2.52 |
| Single Male/Father | 60 (12.9%) | 4.47 |
| Single Female/Mother | 89 (19.1%) | 2.20 |
| Non-family | 203 (43.5%) | 1.11 |
| Total Households | 467 (100.0%) | 2.10 |
Household Size by Marriage Status in New Market
Out of a total of 467 households in New Market, 264 (56.5%) are family households, while 203 (43.5%) are nonfamily households. The most numerous type of family households are 2-person households, comprising 144, and the most common type of nonfamily households are 1-person households, comprising 180.
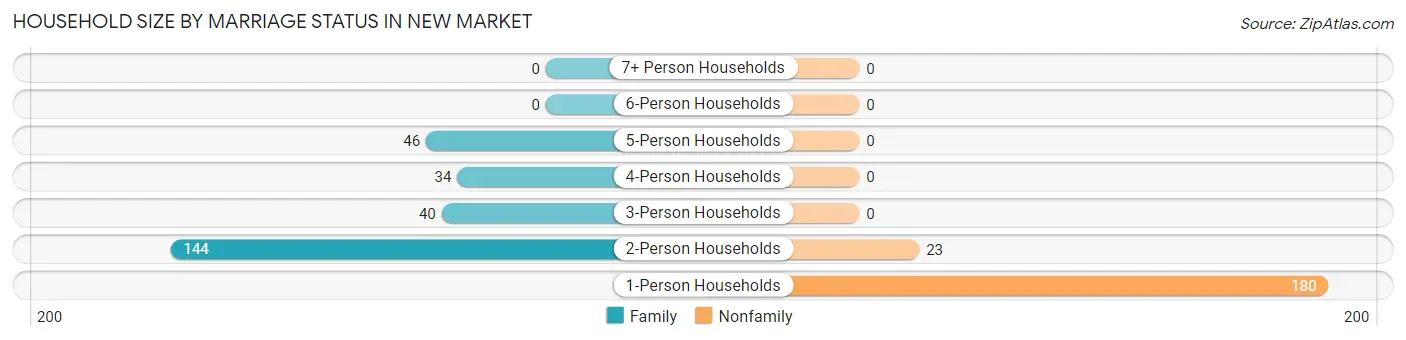
| Household Size | Family Households | Nonfamily Households |
| 1-Person Households | - | 180 (38.5%) |
| 2-Person Households | 144 (30.8%) | 23 (4.9%) |
| 3-Person Households | 40 (8.6%) | 0 (0.0%) |
| 4-Person Households | 34 (7.3%) | 0 (0.0%) |
| 5-Person Households | 46 (9.9%) | 0 (0.0%) |
| 6-Person Households | 0 (0.0%) | 0 (0.0%) |
| 7+ Person Households | 0 (0.0%) | 0 (0.0%) |
| Total | 264 (56.5%) | 203 (43.5%) |
Female Fertility in New Market
Fertility by Age in New Market
| Age Bracket | Women with Births | Births / 1,000 Women |
| 15 to 19 years | 0 (0.0%) | 0.0 |
| 20 to 34 years | 0 (0.0%) | 0.0 |
| 35 to 50 years | 0 (0.0%) | 0.0 |
| Total | 0 (0.0%) | 0.0 |
Fertility by Age by Marriage Status in New Market
| Age Bracket | Married | Unmarried |
| 15 to 19 years | 0 (0.0%) | 0 (0.0%) |
| 20 to 34 years | 0 (0.0%) | 0 (0.0%) |
| 35 to 50 years | 0 (0.0%) | 0 (0.0%) |
| Total | 0 (0.0%) | 0 (0.0%) |
Fertility by Education in New Market
| Educational Attainment | Women with Births | Births / 1,000 Women |
| Less than High School | 0 (0.0%) | 0.0 |
| High School Diploma | 0 (0.0%) | 0.0 |
| College or Associate's Degree | 0 (0.0%) | 0.0 |
| Bachelor's Degree | 0 (0.0%) | 0.0 |
| Graduate Degree | 0 (0.0%) | 0.0 |
| Total | 0 (0.0%) | 0.0 |
Fertility by Education by Marriage Status in New Market
| Educational Attainment | Married | Unmarried |
| Less than High School | 0 (0.0%) | 0 (0.0%) |
| High School Diploma | 0 (0.0%) | 0 (0.0%) |
| College or Associate's Degree | 0 (0.0%) | 0 (0.0%) |
| Bachelor's Degree | 0 (0.0%) | 0 (0.0%) |
| Graduate Degree | 0 (0.0%) | 0 (0.0%) |
| Total | 0 (0.0%) | 0 (0.0%) |
Employment Characteristics in New Market
Employment by Class of Employer in New Market
Among the 422 employed individuals in New Market, private company employees (233 | 55.2%), federal government employees (100 | 23.7%), and self-employed (not incorporated) (89 | 21.1%) make up the most common classes of employment.
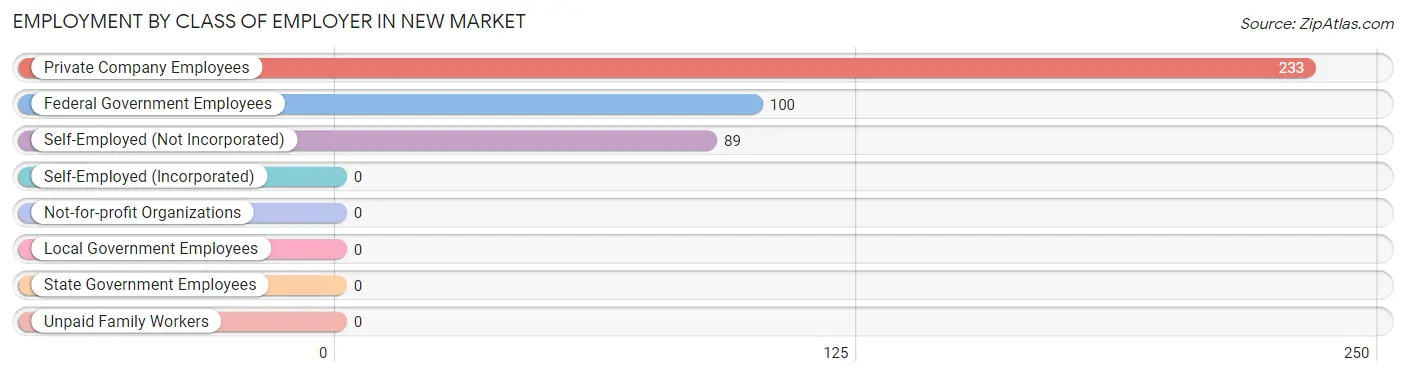
| Employer Class | # Employees | % Employees |
| Private Company Employees | 233 | 55.2% |
| Self-Employed (Incorporated) | 0 | 0.0% |
| Self-Employed (Not Incorporated) | 89 | 21.1% |
| Not-for-profit Organizations | 0 | 0.0% |
| Local Government Employees | 0 | 0.0% |
| State Government Employees | 0 | 0.0% |
| Federal Government Employees | 100 | 23.7% |
| Unpaid Family Workers | 0 | 0.0% |
| Total | 422 | 100.0% |
Employment Status by Age in New Market
According to the labor force statistics for New Market, out of the total population over 16 years of age (677), 69.0% or 467 individuals are in the labor force, with 8.1% or 38 of them unemployed. The age group with the highest labor force participation rate is 25 to 29 years, with 100.0% or 56 individuals in the labor force. Within the labor force, the 60 to 64 years age range has the highest percentage of unemployed individuals, with 50.0% or 26 of them being unemployed.
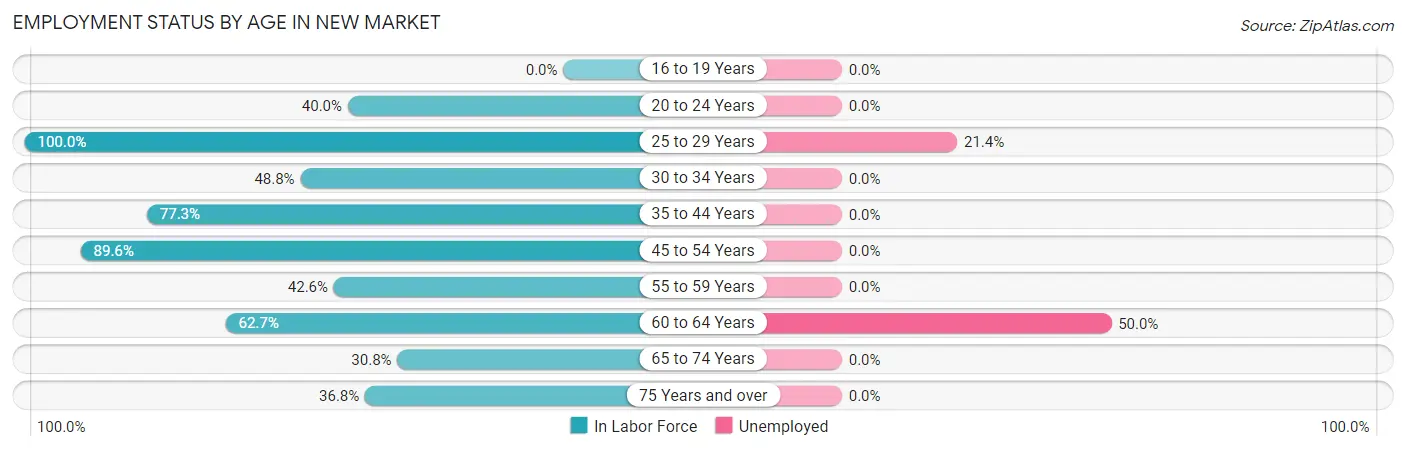
| Age Bracket | In Labor Force | Unemployed |
| 16 to 19 Years | 0 (0.0%) | 0 (0.0%) |
| 20 to 24 Years | 8 (40.0%) | 0 (0.0%) |
| 25 to 29 Years | 56 (100.0%) | 12 (21.4%) |
| 30 to 34 Years | 20 (48.8%) | 0 (0.0%) |
| 35 to 44 Years | 191 (77.3%) | 0 (0.0%) |
| 45 to 54 Years | 95 (89.6%) | 0 (0.0%) |
| 55 to 59 Years | 26 (42.6%) | 0 (0.0%) |
| 60 to 64 Years | 52 (62.7%) | 26 (50.0%) |
| 65 to 74 Years | 12 (30.8%) | 0 (0.0%) |
| 75 Years and over | 7 (36.8%) | 0 (0.0%) |
| Total | 467 (69.0%) | 38 (8.1%) |
Employment Status by Educational Attainment in New Market
According to labor force statistics for New Market, 74.1% of individuals (440) out of the total population between 25 and 64 years of age (594) are in the labor force, with 8.6% or 38 of them being unemployed. The group with the highest labor force participation rate are those with the educational attainment of bachelor's degree or higher, with 100.0% or 83 individuals in the labor force. Within the labor force, individuals with college / associate degree education have the highest percentage of unemployment, with 33.9% or 38 of them being unemployed.
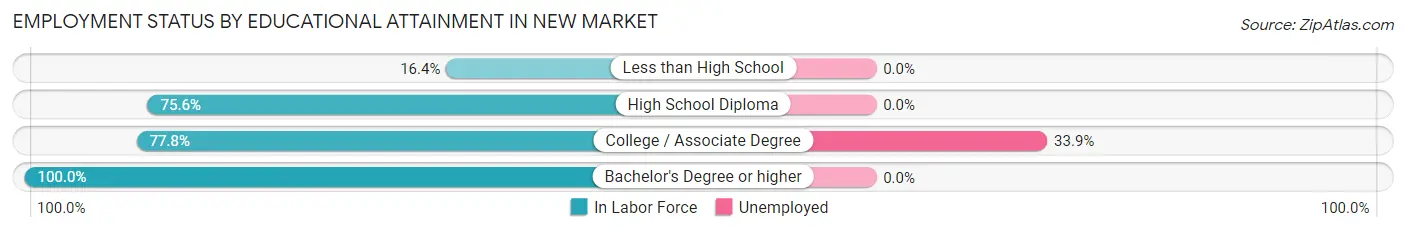
| Educational Attainment | In Labor Force | Unemployed |
| Less than High School | 9 (16.4%) | 0 (0.0%) |
| High School Diploma | 236 (75.6%) | 0 (0.0%) |
| College / Associate Degree | 112 (77.8%) | 49 (33.9%) |
| Bachelor's Degree or higher | 83 (100.0%) | 0 (0.0%) |
| Total | 440 (74.1%) | 51 (8.6%) |
Employment Occupations by Sex in New Market
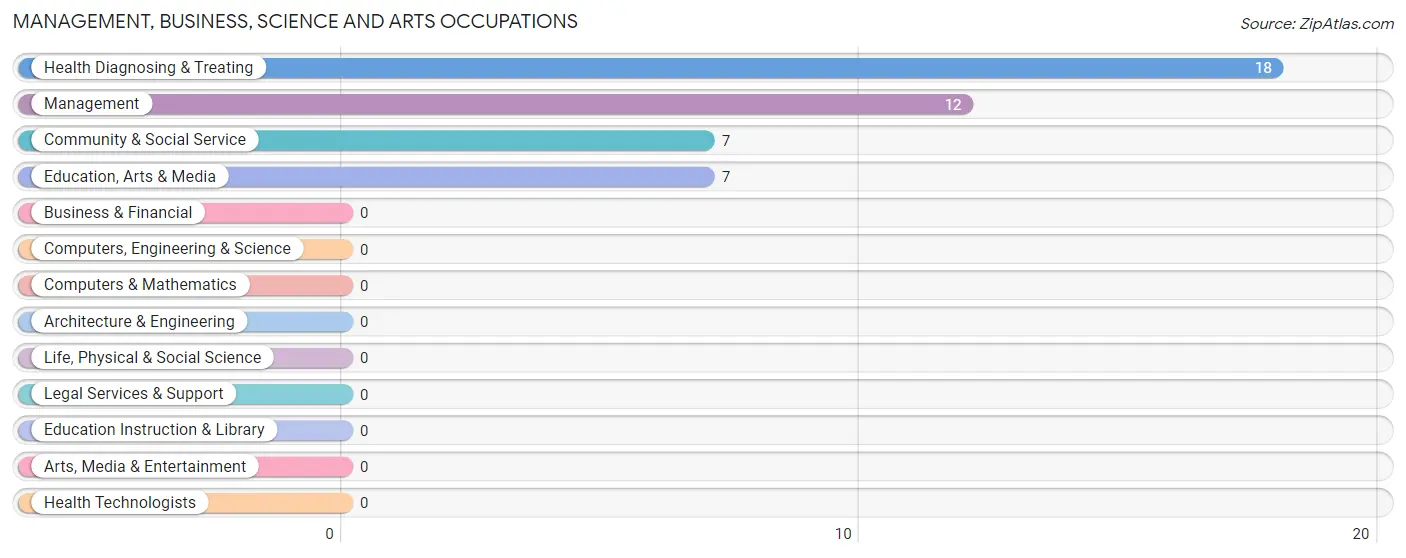
Management, Business, Science and Arts Occupations
The most common Management, Business, Science and Arts occupations in New Market are Health Diagnosing & Treating (18 | 4.2%), Management (12 | 2.8%), Community & Social Service (7 | 1.6%), and Education, Arts & Media (7 | 1.6%).
Management, Business, Science and Arts Occupations by Sex
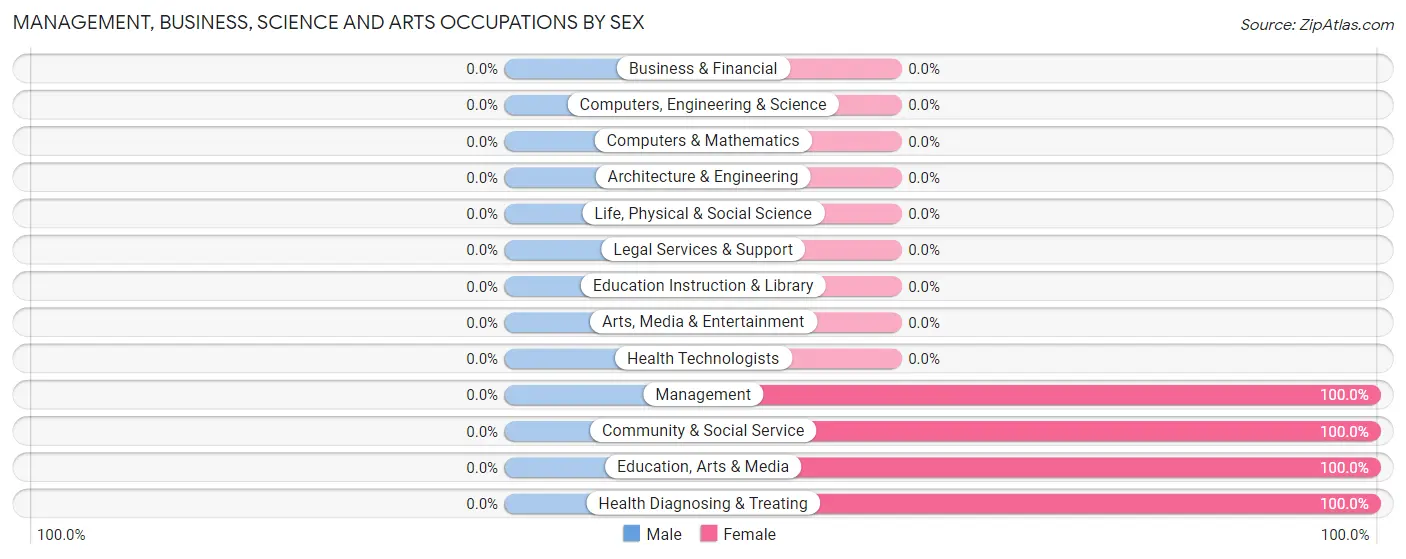
| Occupation | Male | Female |
| Management | 0 (0.0%) | 12 (100.0%) |
| Business & Financial | 0 (0.0%) | 0 (0.0%) |
| Computers, Engineering & Science | 0 (0.0%) | 0 (0.0%) |
| Computers & Mathematics | 0 (0.0%) | 0 (0.0%) |
| Architecture & Engineering | 0 (0.0%) | 0 (0.0%) |
| Life, Physical & Social Science | 0 (0.0%) | 0 (0.0%) |
| Community & Social Service | 0 (0.0%) | 7 (100.0%) |
| Education, Arts & Media | 0 (0.0%) | 7 (100.0%) |
| Legal Services & Support | 0 (0.0%) | 0 (0.0%) |
| Education Instruction & Library | 0 (0.0%) | 0 (0.0%) |
| Arts, Media & Entertainment | 0 (0.0%) | 0 (0.0%) |
| Health Diagnosing & Treating | 0 (0.0%) | 18 (100.0%) |
| Health Technologists | 0 (0.0%) | 0 (0.0%) |
| Total (Category) | 0 (0.0%) | 37 (100.0%) |
| Total (Overall) | 203 (47.3%) | 226 (52.7%) |
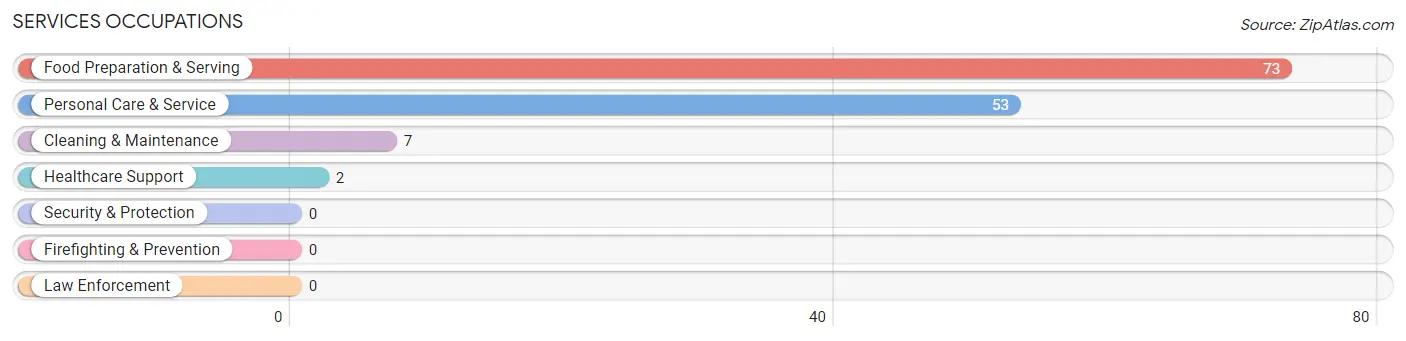
Services Occupations
The most common Services occupations in New Market are Food Preparation & Serving (73 | 17.0%), Personal Care & Service (53 | 12.3%), Cleaning & Maintenance (7 | 1.6%), and Healthcare Support (2 | 0.5%).
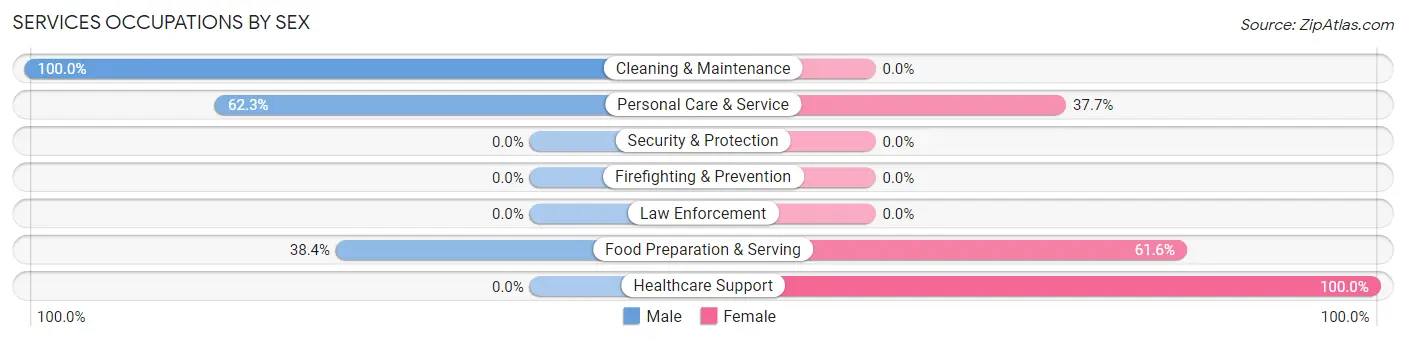
Services Occupations by Sex
Within the Services occupations in New Market, the most male-oriented occupations are Cleaning & Maintenance (100.0%), Personal Care & Service (62.3%), and Food Preparation & Serving (38.4%), while the most female-oriented occupations are Healthcare Support (100.0%), Food Preparation & Serving (61.6%), and Personal Care & Service (37.7%).
| Occupation | Male | Female |
| Healthcare Support | 0 (0.0%) | 2 (100.0%) |
| Security & Protection | 0 (0.0%) | 0 (0.0%) |
| Firefighting & Prevention | 0 (0.0%) | 0 (0.0%) |
| Law Enforcement | 0 (0.0%) | 0 (0.0%) |
| Food Preparation & Serving | 28 (38.4%) | 45 (61.6%) |
| Cleaning & Maintenance | 7 (100.0%) | 0 (0.0%) |
| Personal Care & Service | 33 (62.3%) | 20 (37.7%) |
| Total (Category) | 68 (50.4%) | 67 (49.6%) |
| Total (Overall) | 203 (47.3%) | 226 (52.7%) |
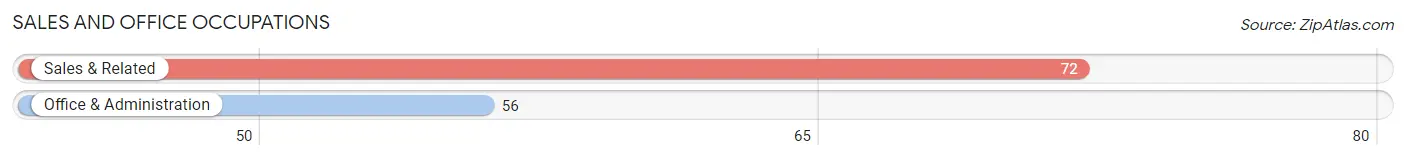
Sales and Office Occupations
The most common Sales and Office occupations in New Market are Sales & Related (72 | 16.8%), and Office & Administration (56 | 13.1%).
Sales and Office Occupations by Sex
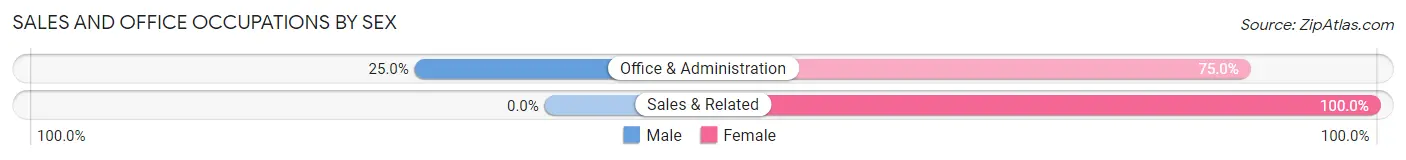
| Occupation | Male | Female |
| Sales & Related | 0 (0.0%) | 72 (100.0%) |
| Office & Administration | 14 (25.0%) | 42 (75.0%) |
| Total (Category) | 14 (10.9%) | 114 (89.1%) |
| Total (Overall) | 203 (47.3%) | 226 (52.7%) |
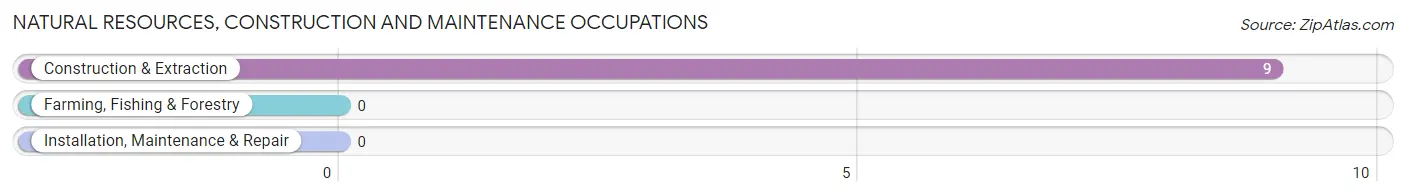
Natural Resources, Construction and Maintenance Occupations
The most common Natural Resources, Construction and Maintenance occupations in New Market are , and Construction & Extraction (9 | 2.1%).
Natural Resources, Construction and Maintenance Occupations by Sex
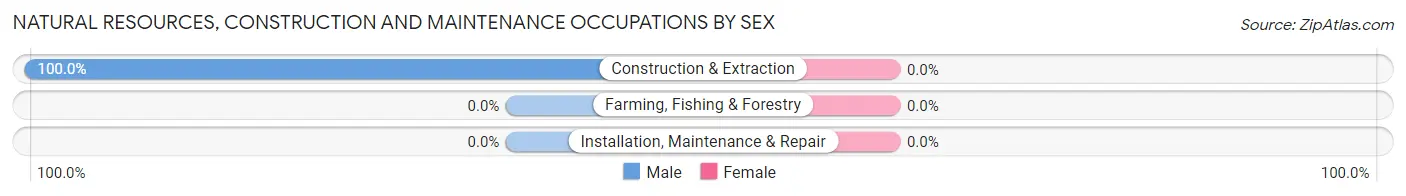
| Occupation | Male | Female |
| Farming, Fishing & Forestry | 0 (0.0%) | 0 (0.0%) |
| Construction & Extraction | 9 (100.0%) | 0 (0.0%) |
| Installation, Maintenance & Repair | 0 (0.0%) | 0 (0.0%) |
| Total (Category) | 9 (100.0%) | 0 (0.0%) |
| Total (Overall) | 203 (47.3%) | 226 (52.7%) |
Production, Transportation and Moving Occupations
The most common Production, Transportation and Moving occupations in New Market are Transportation (56 | 13.1%), Material Moving (34 | 7.9%), and Production (30 | 7.0%).
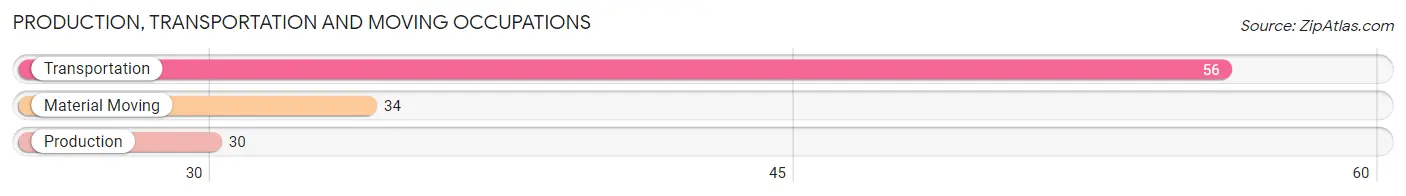
Production, Transportation and Moving Occupations by Sex
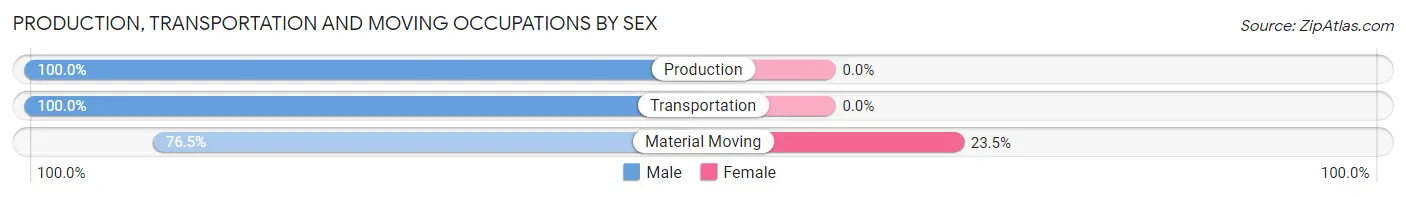
| Occupation | Male | Female |
| Production | 30 (100.0%) | 0 (0.0%) |
| Transportation | 56 (100.0%) | 0 (0.0%) |
| Material Moving | 26 (76.5%) | 8 (23.5%) |
| Total (Category) | 112 (93.3%) | 8 (6.7%) |
| Total (Overall) | 203 (47.3%) | 226 (52.7%) |
Employment Industries by Sex in New Market
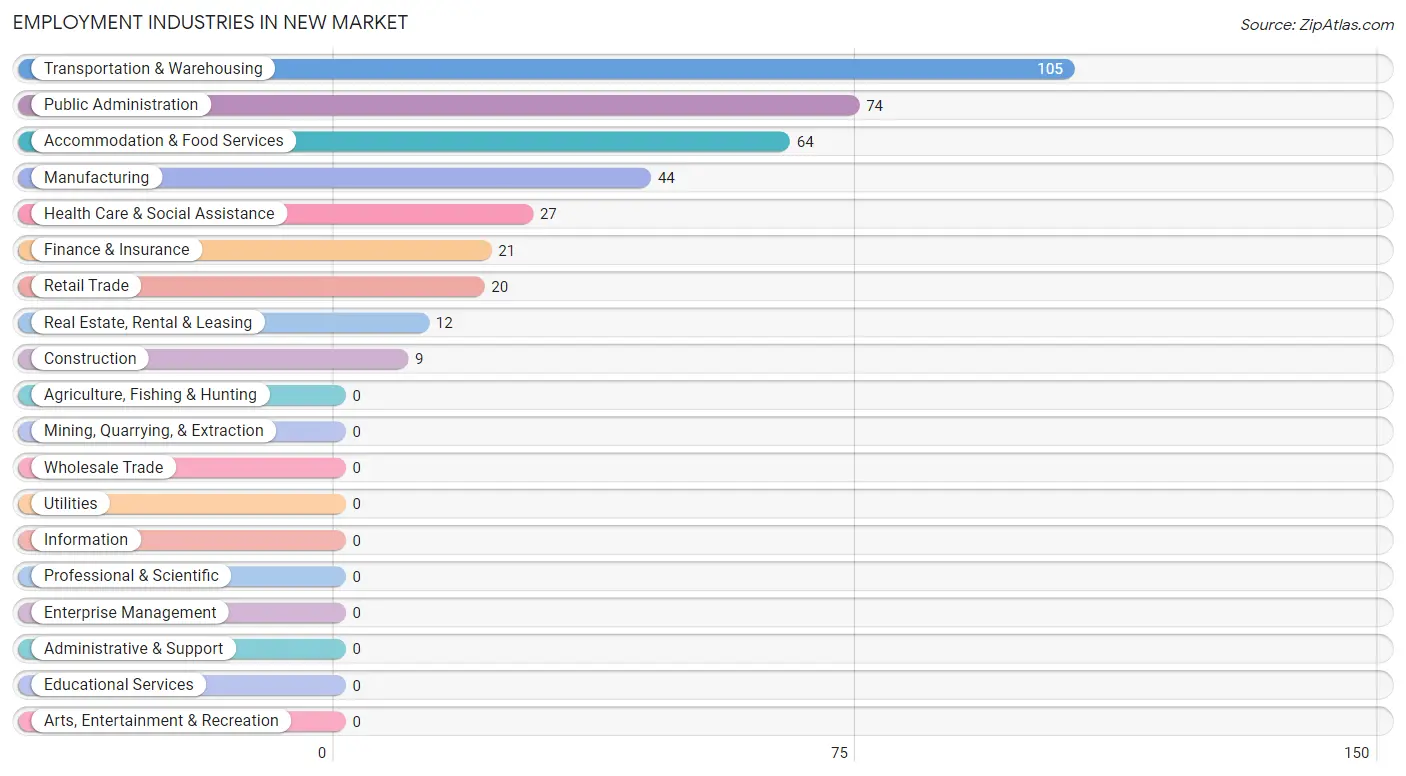
Employment Industries in New Market
The major employment industries in New Market include Transportation & Warehousing (105 | 24.5%), Public Administration (74 | 17.2%), Accommodation & Food Services (64 | 14.9%), Manufacturing (44 | 10.3%), and Health Care & Social Assistance (27 | 6.3%).
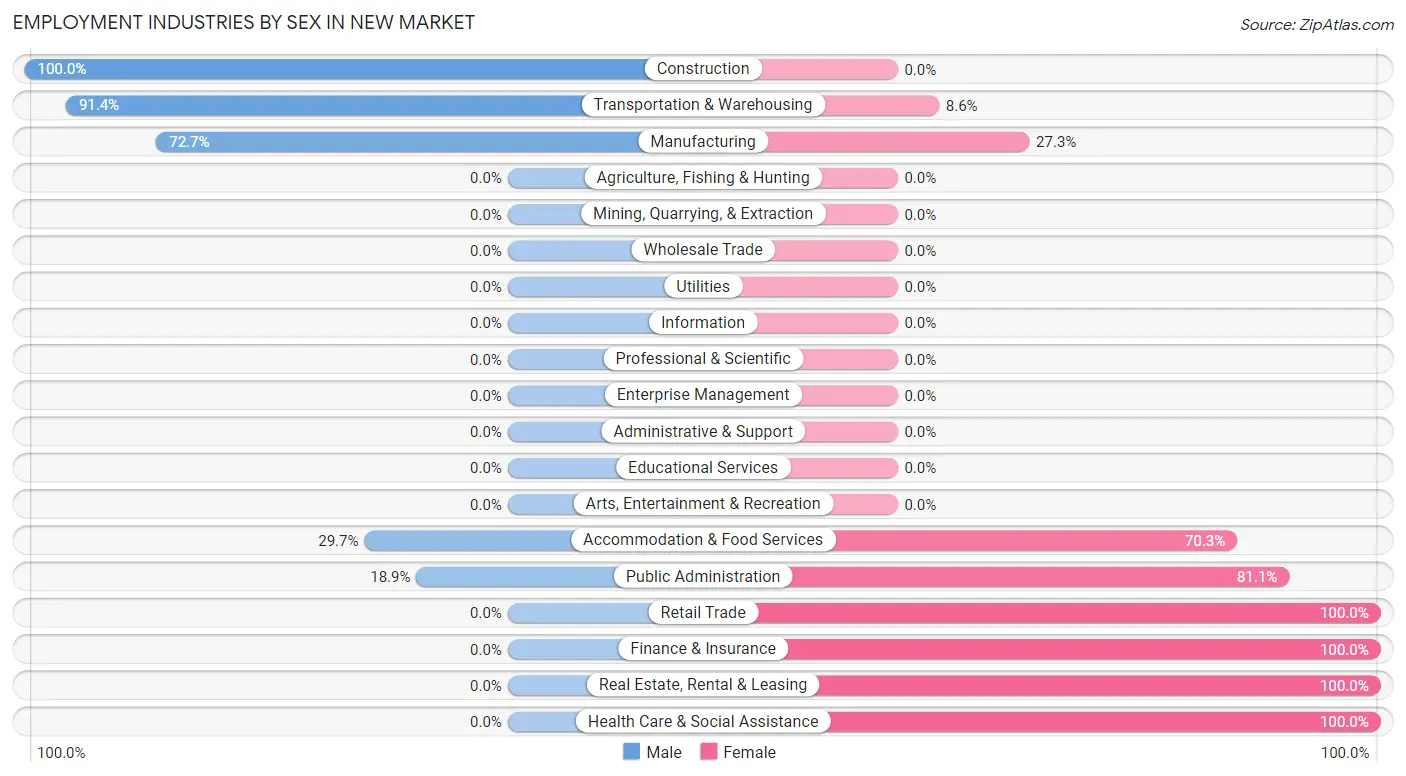
Employment Industries by Sex in New Market
The New Market industries that see more men than women are Construction (100.0%), Transportation & Warehousing (91.4%), and Manufacturing (72.7%), whereas the industries that tend to have a higher number of women are Retail Trade (100.0%), Finance & Insurance (100.0%), and Real Estate, Rental & Leasing (100.0%).
| Industry | Male | Female |
| Agriculture, Fishing & Hunting | 0 (0.0%) | 0 (0.0%) |
| Mining, Quarrying, & Extraction | 0 (0.0%) | 0 (0.0%) |
| Construction | 9 (100.0%) | 0 (0.0%) |
| Manufacturing | 32 (72.7%) | 12 (27.3%) |
| Wholesale Trade | 0 (0.0%) | 0 (0.0%) |
| Retail Trade | 0 (0.0%) | 20 (100.0%) |
| Transportation & Warehousing | 96 (91.4%) | 9 (8.6%) |
| Utilities | 0 (0.0%) | 0 (0.0%) |
| Information | 0 (0.0%) | 0 (0.0%) |
| Finance & Insurance | 0 (0.0%) | 21 (100.0%) |
| Real Estate, Rental & Leasing | 0 (0.0%) | 12 (100.0%) |
| Professional & Scientific | 0 (0.0%) | 0 (0.0%) |
| Enterprise Management | 0 (0.0%) | 0 (0.0%) |
| Administrative & Support | 0 (0.0%) | 0 (0.0%) |
| Educational Services | 0 (0.0%) | 0 (0.0%) |
| Health Care & Social Assistance | 0 (0.0%) | 27 (100.0%) |
| Arts, Entertainment & Recreation | 0 (0.0%) | 0 (0.0%) |
| Accommodation & Food Services | 19 (29.7%) | 45 (70.3%) |
| Public Administration | 14 (18.9%) | 60 (81.1%) |
| Total | 203 (47.3%) | 226 (52.7%) |
Education in New Market
School Enrollment in New Market
The most common levels of schooling among the 255 students in New Market are middle school (97 | 38.0%), high school (79 | 31.0%), and elementary school (51 | 20.0%).
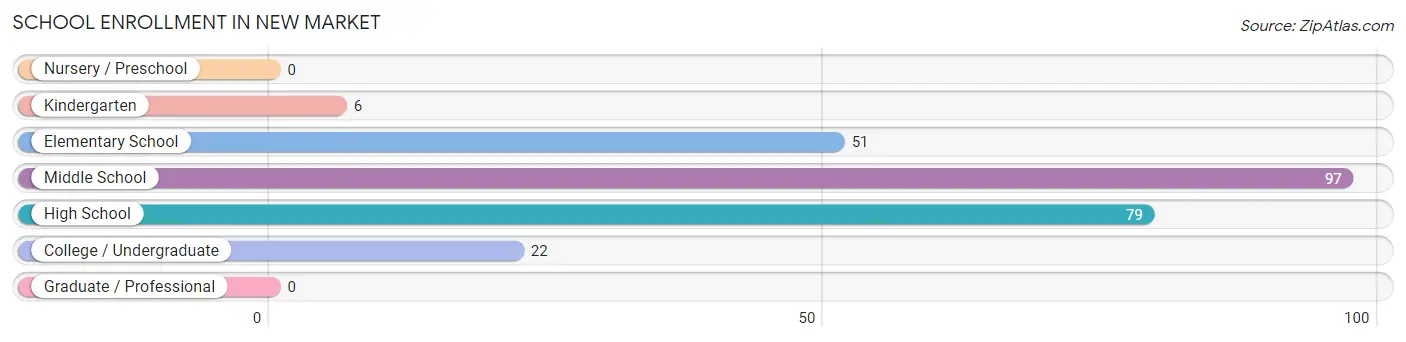
| School Level | # Students | % Students |
| Nursery / Preschool | 0 | 0.0% |
| Kindergarten | 6 | 2.4% |
| Elementary School | 51 | 20.0% |
| Middle School | 97 | 38.0% |
| High School | 79 | 31.0% |
| College / Undergraduate | 22 | 8.6% |
| Graduate / Professional | 0 | 0.0% |
| Total | 255 | 100.0% |
School Enrollment by Age by Funding Source in New Market
Out of a total of 255 students who are enrolled in schools in New Market, 43 (16.9%) attend a private institution, while the remaining 212 (83.1%) are enrolled in public schools. The age group of 10 to 14 year olds has the highest likelihood of being enrolled in private schools, with 43 (29.0% in the age bracket) enrolled. Conversely, the age group of 5 to 9 year old has the lowest likelihood of being enrolled in a private school, with 6 (100.0% in the age bracket) attending a public institution.
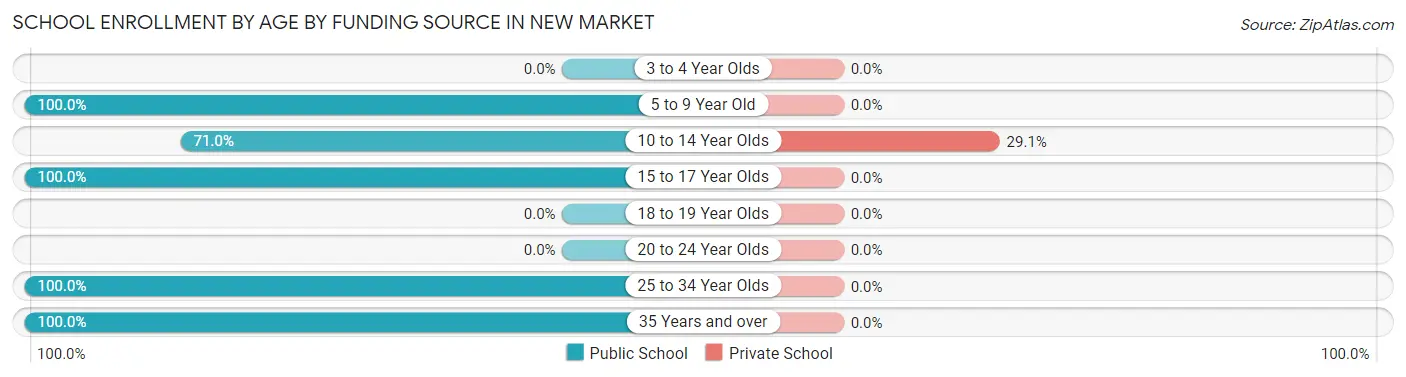
| Age Bracket | Public School | Private School |
| 3 to 4 Year Olds | 0 (0.0%) | 0 (0.0%) |
| 5 to 9 Year Old | 6 (100.0%) | 0 (0.0%) |
| 10 to 14 Year Olds | 105 (71.0%) | 43 (29.0%) |
| 15 to 17 Year Olds | 79 (100.0%) | 0 (0.0%) |
| 18 to 19 Year Olds | 0 (0.0%) | 0 (0.0%) |
| 20 to 24 Year Olds | 0 (0.0%) | 0 (0.0%) |
| 25 to 34 Year Olds | 12 (100.0%) | 0 (0.0%) |
| 35 Years and over | 10 (100.0%) | 0 (0.0%) |
| Total | 212 (83.1%) | 43 (16.9%) |
Educational Attainment by Field of Study in New Market
Social sciences (53 | 63.9%), literature & languages (12 | 14.5%), business (9 | 10.8%), science & technology (7 | 8.4%), and education (2 | 2.4%) are the most common fields of study among 83 individuals in New Market who have obtained a bachelor's degree or higher.
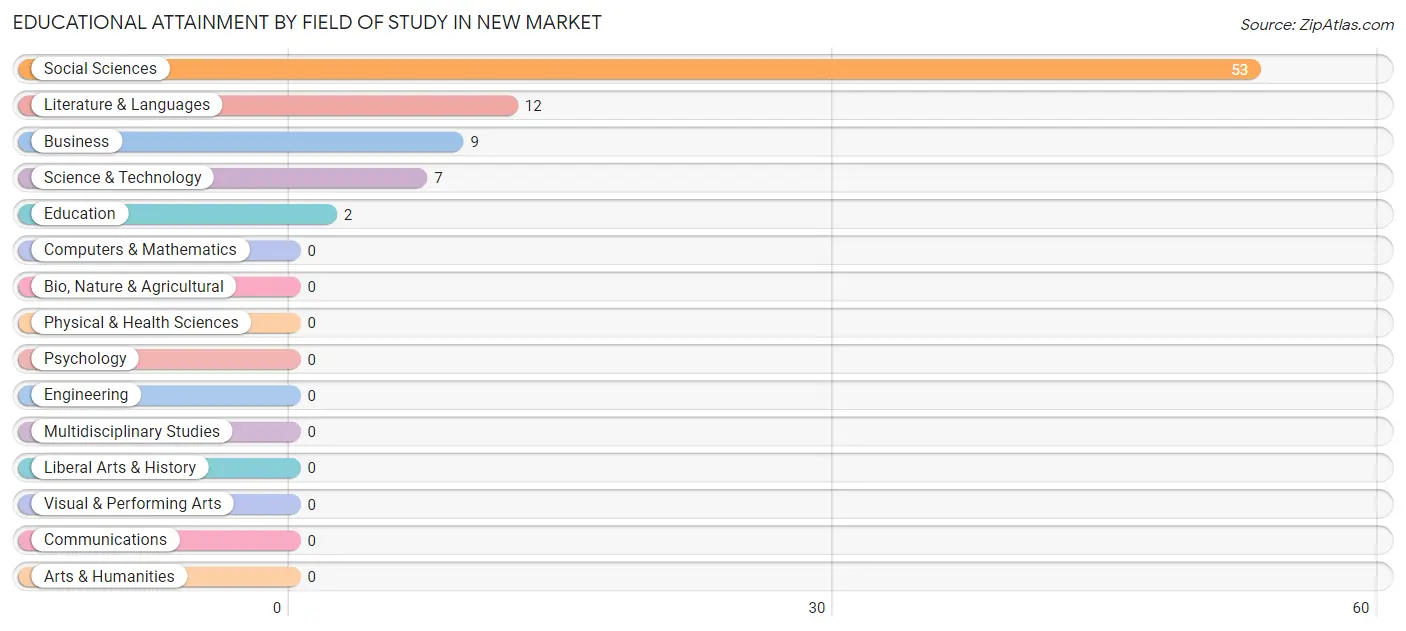
| Field of Study | # Graduates | % Graduates |
| Computers & Mathematics | 0 | 0.0% |
| Bio, Nature & Agricultural | 0 | 0.0% |
| Physical & Health Sciences | 0 | 0.0% |
| Psychology | 0 | 0.0% |
| Social Sciences | 53 | 63.9% |
| Engineering | 0 | 0.0% |
| Multidisciplinary Studies | 0 | 0.0% |
| Science & Technology | 7 | 8.4% |
| Business | 9 | 10.8% |
| Education | 2 | 2.4% |
| Literature & Languages | 12 | 14.5% |
| Liberal Arts & History | 0 | 0.0% |
| Visual & Performing Arts | 0 | 0.0% |
| Communications | 0 | 0.0% |
| Arts & Humanities | 0 | 0.0% |
| Total | 83 | 100.0% |
Transportation & Commute in New Market
Vehicle Availability by Sex in New Market
The most prevalent vehicle ownership categories in New Market are males with 2 vehicles (118, accounting for 58.1%) and females with 2 vehicles (49, making up 53.9%).
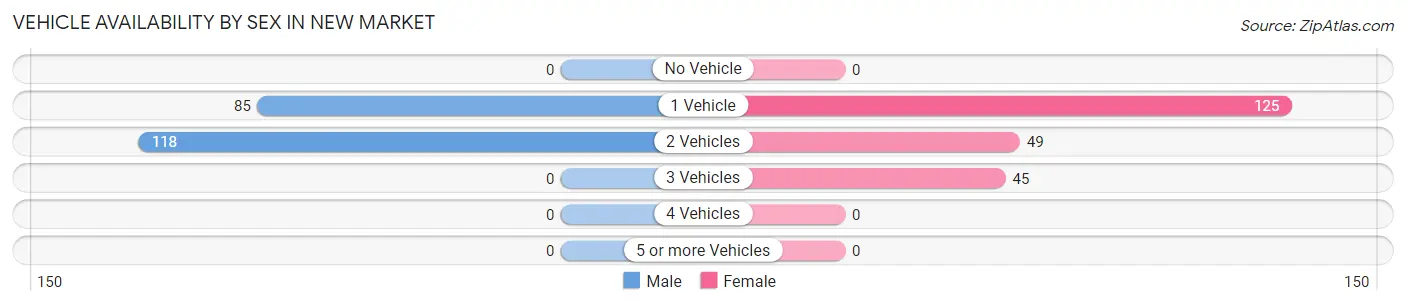
| Vehicles Available | Male | Female |
| No Vehicle | 0 (0.0%) | 0 (0.0%) |
| 1 Vehicle | 85 (41.9%) | 125 (57.1%) |
| 2 Vehicles | 118 (58.1%) | 49 (22.4%) |
| 3 Vehicles | 0 (0.0%) | 45 (20.5%) |
| 4 Vehicles | 0 (0.0%) | 0 (0.0%) |
| 5 or more Vehicles | 0 (0.0%) | 0 (0.0%) |
| Total | 203 (100.0%) | 219 (100.0%) |
Commute Time in New Market
The most frequently occuring commute durations in New Market are 20 to 24 minutes (150 commuters, 36.6%), 35 to 39 minutes (84 commuters, 20.5%), and 5 to 9 minutes (38 commuters, 9.3%).
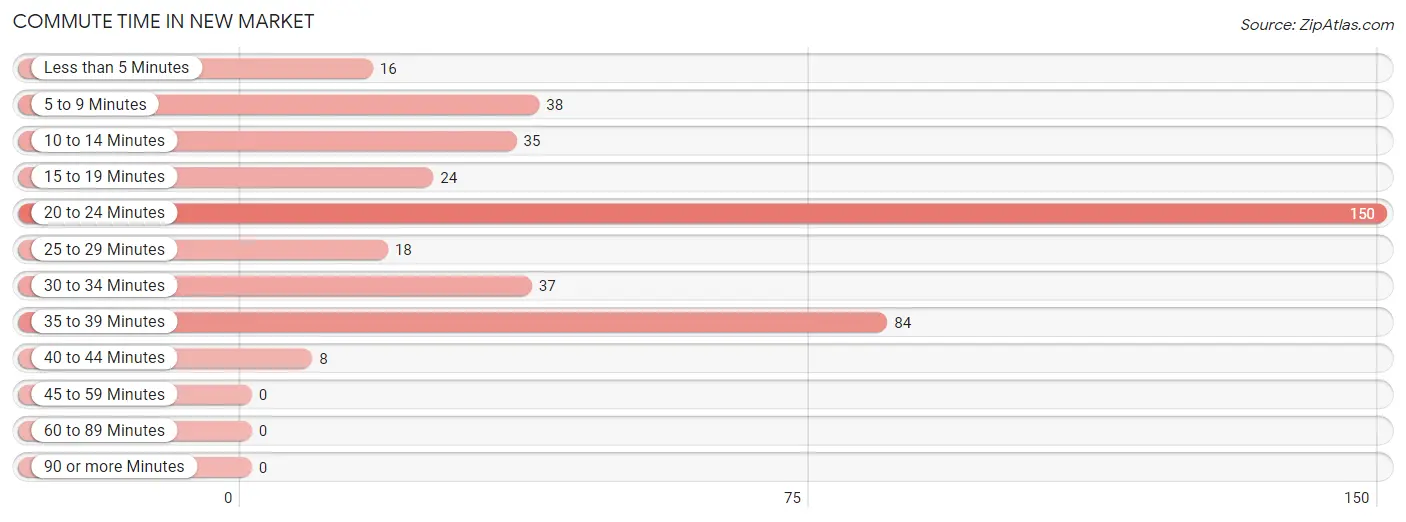
| Commute Time | # Commuters | % Commuters |
| Less than 5 Minutes | 16 | 3.9% |
| 5 to 9 Minutes | 38 | 9.3% |
| 10 to 14 Minutes | 35 | 8.5% |
| 15 to 19 Minutes | 24 | 5.9% |
| 20 to 24 Minutes | 150 | 36.6% |
| 25 to 29 Minutes | 18 | 4.4% |
| 30 to 34 Minutes | 37 | 9.0% |
| 35 to 39 Minutes | 84 | 20.5% |
| 40 to 44 Minutes | 8 | 1.9% |
| 45 to 59 Minutes | 0 | 0.0% |
| 60 to 89 Minutes | 0 | 0.0% |
| 90 or more Minutes | 0 | 0.0% |
Commute Time by Sex in New Market
The most common commute times in New Market are 20 to 24 minutes (45 commuters, 22.2%) for males and 20 to 24 minutes (105 commuters, 50.7%) for females.
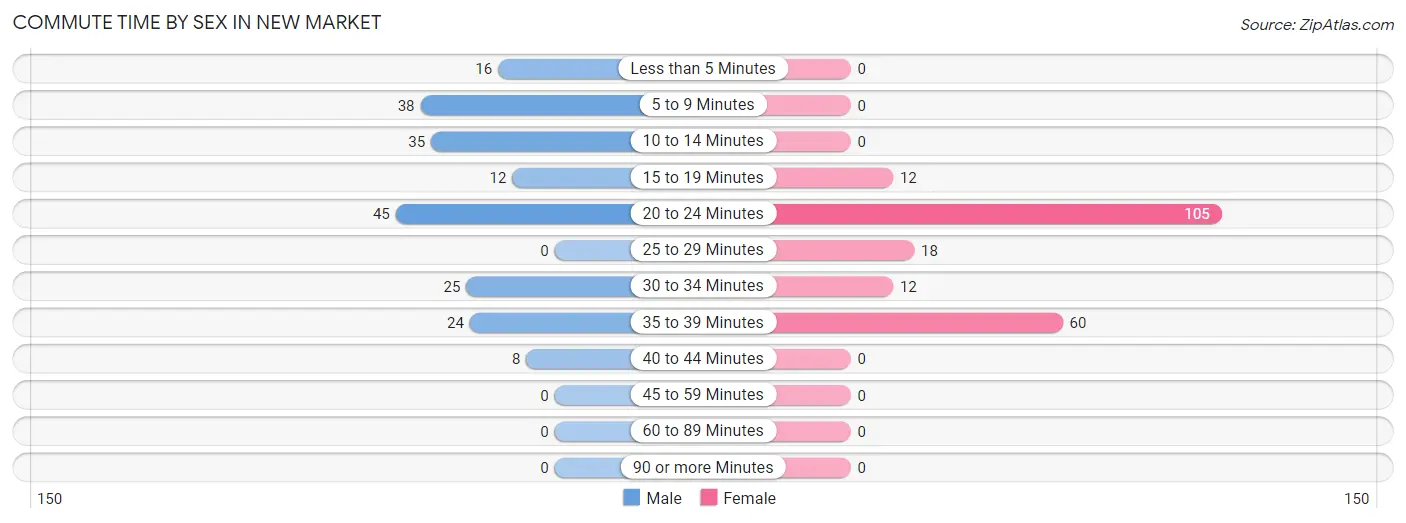
| Commute Time | Male | Female |
| Less than 5 Minutes | 16 (7.9%) | 0 (0.0%) |
| 5 to 9 Minutes | 38 (18.7%) | 0 (0.0%) |
| 10 to 14 Minutes | 35 (17.2%) | 0 (0.0%) |
| 15 to 19 Minutes | 12 (5.9%) | 12 (5.8%) |
| 20 to 24 Minutes | 45 (22.2%) | 105 (50.7%) |
| 25 to 29 Minutes | 0 (0.0%) | 18 (8.7%) |
| 30 to 34 Minutes | 25 (12.3%) | 12 (5.8%) |
| 35 to 39 Minutes | 24 (11.8%) | 60 (29.0%) |
| 40 to 44 Minutes | 8 (3.9%) | 0 (0.0%) |
| 45 to 59 Minutes | 0 (0.0%) | 0 (0.0%) |
| 60 to 89 Minutes | 0 (0.0%) | 0 (0.0%) |
| 90 or more Minutes | 0 (0.0%) | 0 (0.0%) |
Time of Departure to Work by Sex in New Market
The most frequent times of departure to work in New Market are 12:00 PM to 3:59 PM (44, 21.7%) for males and 7:00 AM to 7:29 AM (63, 30.4%) for females.
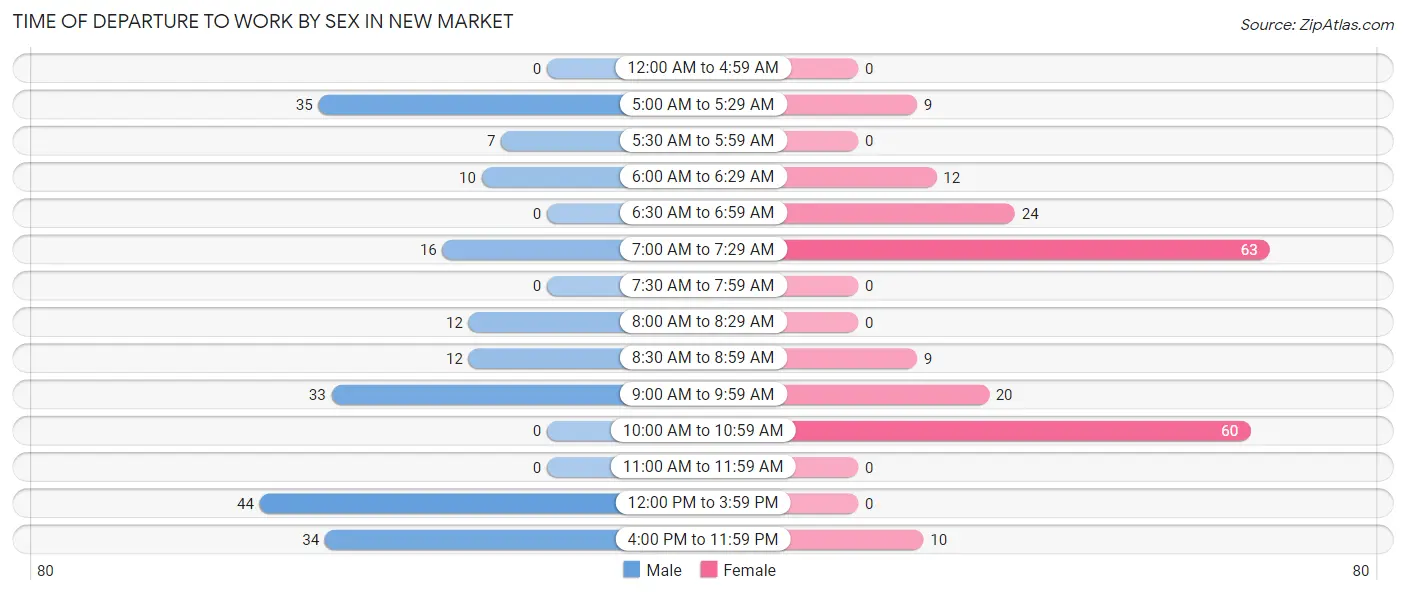
| Time of Departure | Male | Female |
| 12:00 AM to 4:59 AM | 0 (0.0%) | 0 (0.0%) |
| 5:00 AM to 5:29 AM | 35 (17.2%) | 9 (4.3%) |
| 5:30 AM to 5:59 AM | 7 (3.5%) | 0 (0.0%) |
| 6:00 AM to 6:29 AM | 10 (4.9%) | 12 (5.8%) |
| 6:30 AM to 6:59 AM | 0 (0.0%) | 24 (11.6%) |
| 7:00 AM to 7:29 AM | 16 (7.9%) | 63 (30.4%) |
| 7:30 AM to 7:59 AM | 0 (0.0%) | 0 (0.0%) |
| 8:00 AM to 8:29 AM | 12 (5.9%) | 0 (0.0%) |
| 8:30 AM to 8:59 AM | 12 (5.9%) | 9 (4.3%) |
| 9:00 AM to 9:59 AM | 33 (16.3%) | 20 (9.7%) |
| 10:00 AM to 10:59 AM | 0 (0.0%) | 60 (29.0%) |
| 11:00 AM to 11:59 AM | 0 (0.0%) | 0 (0.0%) |
| 12:00 PM to 3:59 PM | 44 (21.7%) | 0 (0.0%) |
| 4:00 PM to 11:59 PM | 34 (16.8%) | 10 (4.8%) |
| Total | 203 (100.0%) | 207 (100.0%) |
Housing Occupancy in New Market
Occupancy by Ownership in New Market
Of the total 467 dwellings in New Market, owner-occupied units account for 96 (20.6%), while renter-occupied units make up 371 (79.4%).
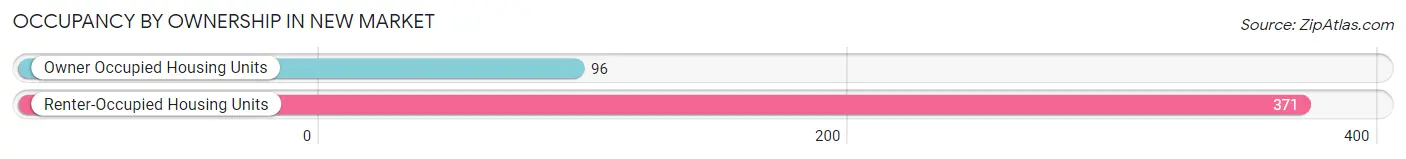
| Occupancy | # Housing Units | % Housing Units |
| Owner Occupied Housing Units | 96 | 20.6% |
| Renter-Occupied Housing Units | 371 | 79.4% |
| Total Occupied Housing Units | 467 | 100.0% |
Occupancy by Household Size in New Market
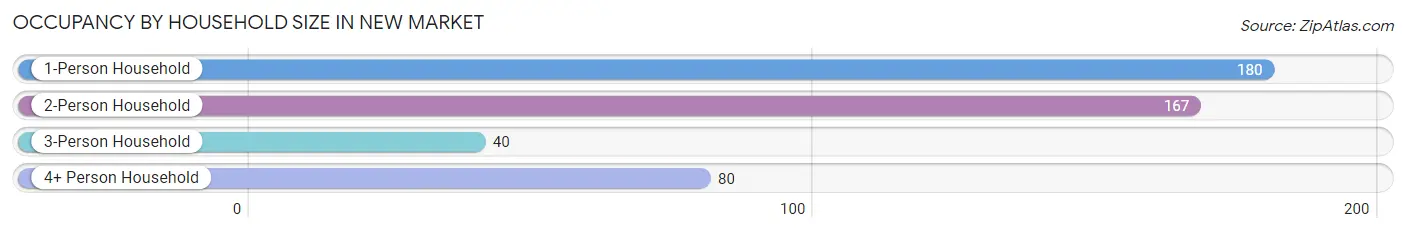
| Household Size | # Housing Units | % Housing Units |
| 1-Person Household | 180 | 38.5% |
| 2-Person Household | 167 | 35.8% |
| 3-Person Household | 40 | 8.6% |
| 4+ Person Household | 80 | 17.1% |
| Total Housing Units | 467 | 100.0% |
Occupancy by Ownership by Household Size in New Market
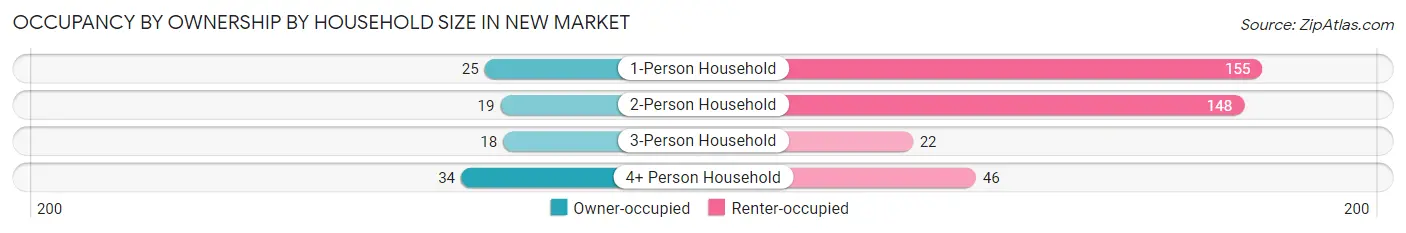
| Household Size | Owner-occupied | Renter-occupied |
| 1-Person Household | 25 (13.9%) | 155 (86.1%) |
| 2-Person Household | 19 (11.4%) | 148 (88.6%) |
| 3-Person Household | 18 (45.0%) | 22 (55.0%) |
| 4+ Person Household | 34 (42.5%) | 46 (57.5%) |
| Total Housing Units | 96 (20.6%) | 371 (79.4%) |
Occupancy by Educational Attainment in New Market
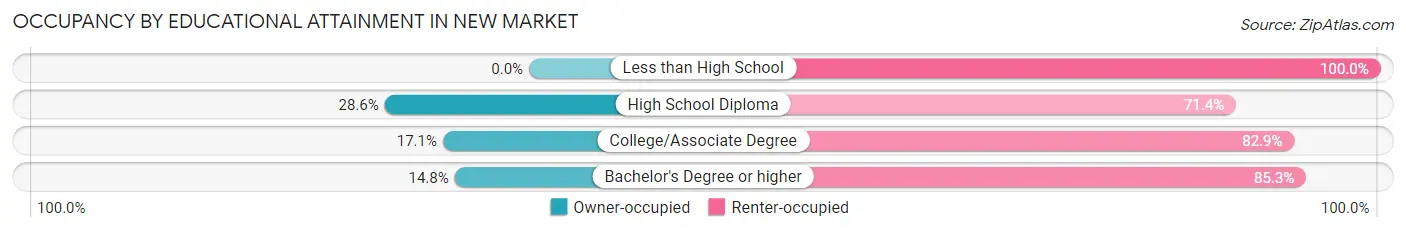
| Household Size | Owner-occupied | Renter-occupied |
| Less than High School | 0 (0.0%) | 55 (100.0%) |
| High School Diploma | 67 (28.6%) | 167 (71.4%) |
| College/Associate Degree | 20 (17.1%) | 97 (82.9%) |
| Bachelor's Degree or higher | 9 (14.7%) | 52 (85.3%) |
Occupancy by Age of Householder in New Market
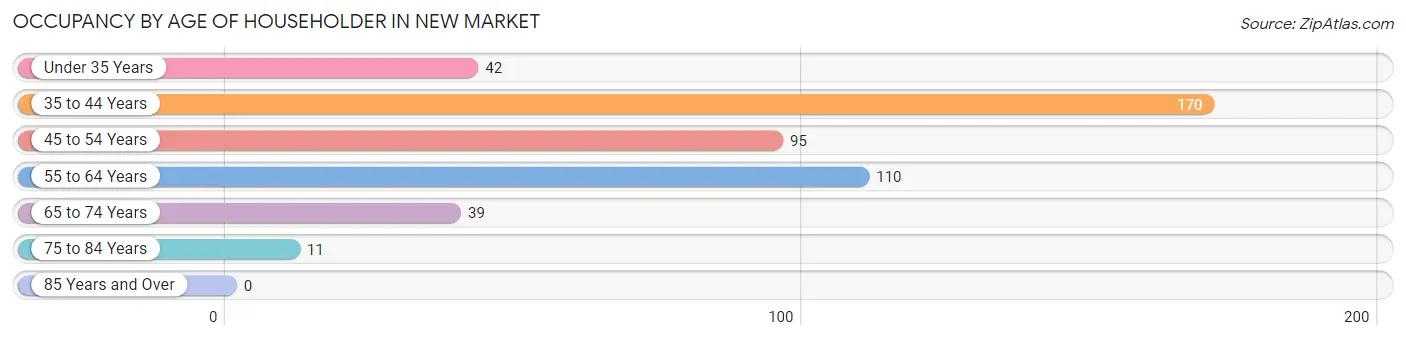
| Age Bracket | # Households | % Households |
| Under 35 Years | 42 | 9.0% |
| 35 to 44 Years | 170 | 36.4% |
| 45 to 54 Years | 95 | 20.3% |
| 55 to 64 Years | 110 | 23.5% |
| 65 to 74 Years | 39 | 8.4% |
| 75 to 84 Years | 11 | 2.4% |
| 85 Years and Over | 0 | 0.0% |
| Total | 467 | 100.0% |
Housing Finances in New Market
Median Income by Occupancy in New Market
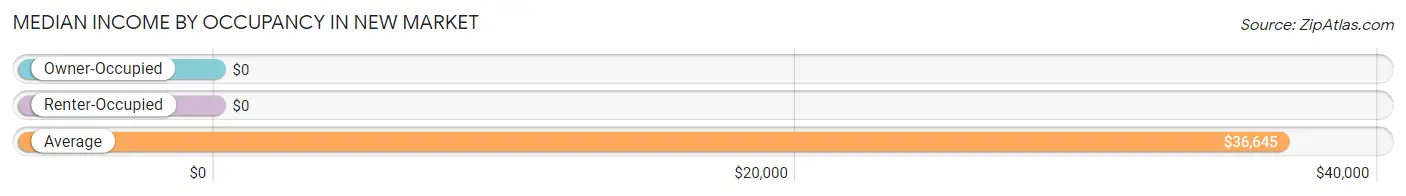
| Occupancy Type | # Households | Median Income |
| Owner-Occupied | 96 (20.6%) | $0 |
| Renter-Occupied | 371 (79.4%) | $0 |
| Average | 467 (100.0%) | $36,645 |
Occupancy by Householder Income Bracket in New Market
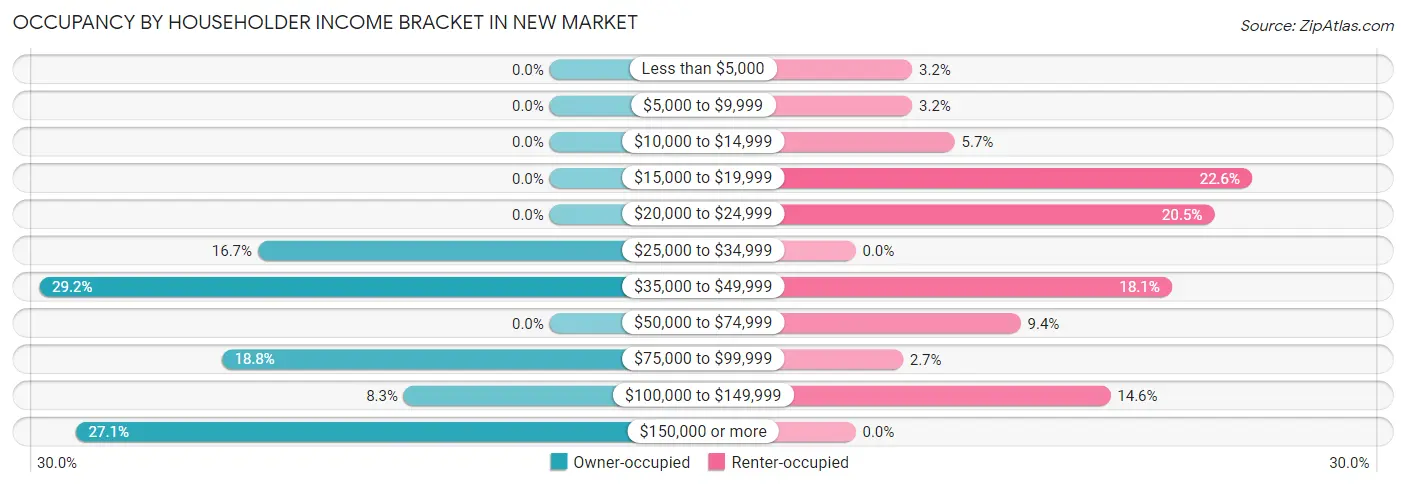
| Income Bracket | Owner-occupied | Renter-occupied |
| Less than $5,000 | 0 (0.0%) | 12 (3.2%) |
| $5,000 to $9,999 | 0 (0.0%) | 12 (3.2%) |
| $10,000 to $14,999 | 0 (0.0%) | 21 (5.7%) |
| $15,000 to $19,999 | 0 (0.0%) | 84 (22.6%) |
| $20,000 to $24,999 | 0 (0.0%) | 76 (20.5%) |
| $25,000 to $34,999 | 16 (16.7%) | 0 (0.0%) |
| $35,000 to $49,999 | 28 (29.2%) | 67 (18.1%) |
| $50,000 to $74,999 | 0 (0.0%) | 35 (9.4%) |
| $75,000 to $99,999 | 18 (18.8%) | 10 (2.7%) |
| $100,000 to $149,999 | 8 (8.3%) | 54 (14.6%) |
| $150,000 or more | 26 (27.1%) | 0 (0.0%) |
| Total | 96 (100.0%) | 371 (100.0%) |
Monthly Housing Cost Tiers in New Market
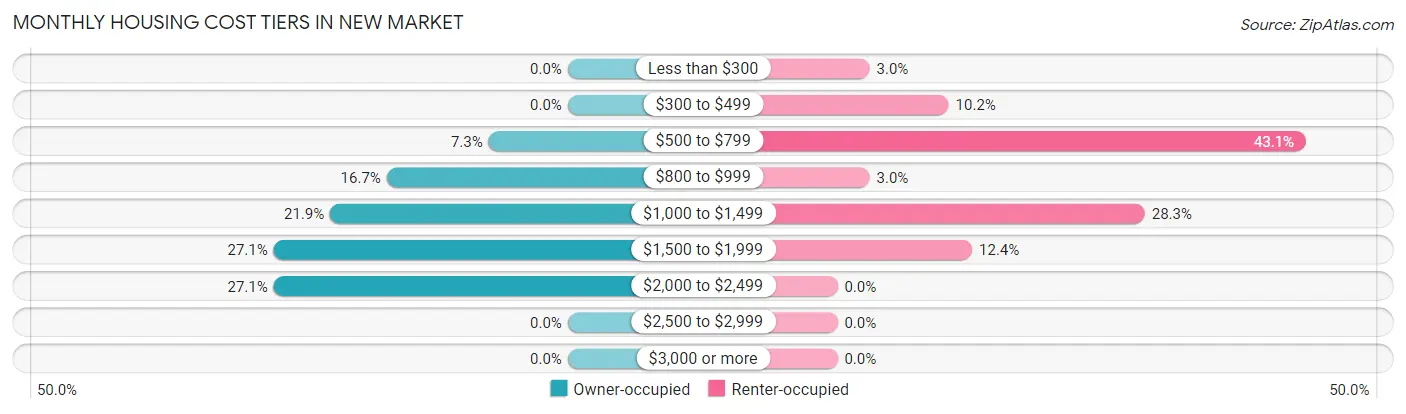
| Monthly Cost | Owner-occupied | Renter-occupied |
| Less than $300 | 0 (0.0%) | 11 (3.0%) |
| $300 to $499 | 0 (0.0%) | 38 (10.2%) |
| $500 to $799 | 7 (7.3%) | 160 (43.1%) |
| $800 to $999 | 16 (16.7%) | 11 (3.0%) |
| $1,000 to $1,499 | 21 (21.9%) | 105 (28.3%) |
| $1,500 to $1,999 | 26 (27.1%) | 46 (12.4%) |
| $2,000 to $2,499 | 26 (27.1%) | 0 (0.0%) |
| $2,500 to $2,999 | 0 (0.0%) | 0 (0.0%) |
| $3,000 or more | 0 (0.0%) | 0 (0.0%) |
| Total | 96 (100.0%) | 371 (100.0%) |
Physical Housing Characteristics in New Market
Housing Structures in New Market
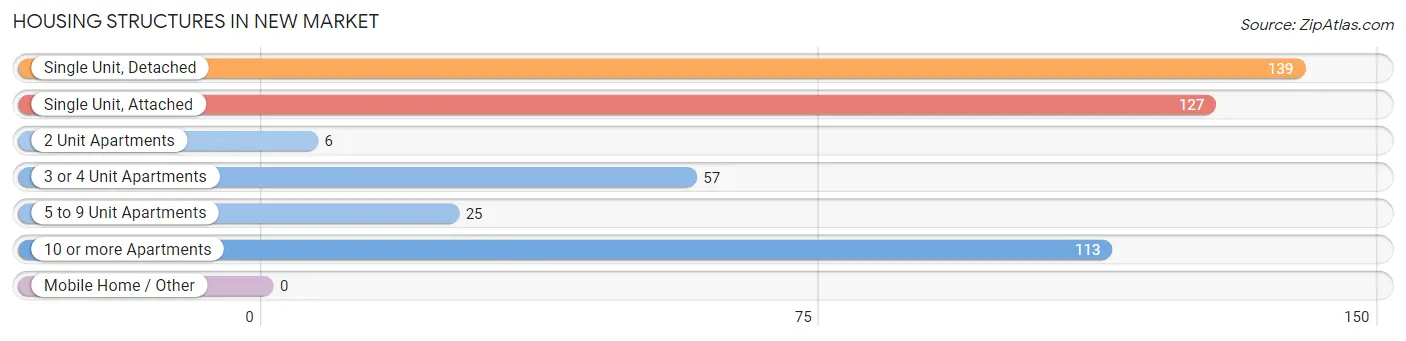
| Structure Type | # Housing Units | % Housing Units |
| Single Unit, Detached | 139 | 29.8% |
| Single Unit, Attached | 127 | 27.2% |
| 2 Unit Apartments | 6 | 1.3% |
| 3 or 4 Unit Apartments | 57 | 12.2% |
| 5 to 9 Unit Apartments | 25 | 5.3% |
| 10 or more Apartments | 113 | 24.2% |
| Mobile Home / Other | 0 | 0.0% |
| Total | 467 | 100.0% |
Housing Structures by Occupancy in New Market
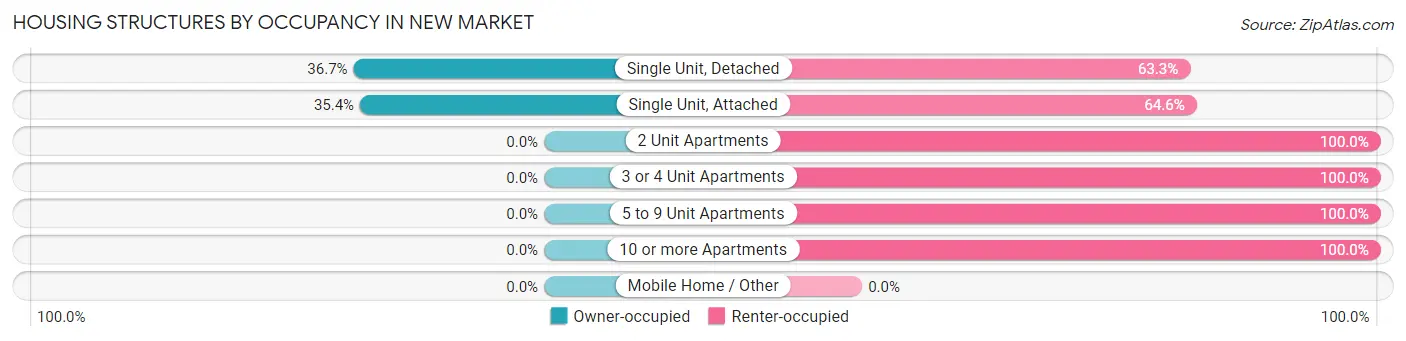
| Structure Type | Owner-occupied | Renter-occupied |
| Single Unit, Detached | 51 (36.7%) | 88 (63.3%) |
| Single Unit, Attached | 45 (35.4%) | 82 (64.6%) |
| 2 Unit Apartments | 0 (0.0%) | 6 (100.0%) |
| 3 or 4 Unit Apartments | 0 (0.0%) | 57 (100.0%) |
| 5 to 9 Unit Apartments | 0 (0.0%) | 25 (100.0%) |
| 10 or more Apartments | 0 (0.0%) | 113 (100.0%) |
| Mobile Home / Other | 0 (0.0%) | 0 (0.0%) |
| Total | 96 (20.6%) | 371 (79.4%) |
Housing Structures by Number of Rooms in New Market
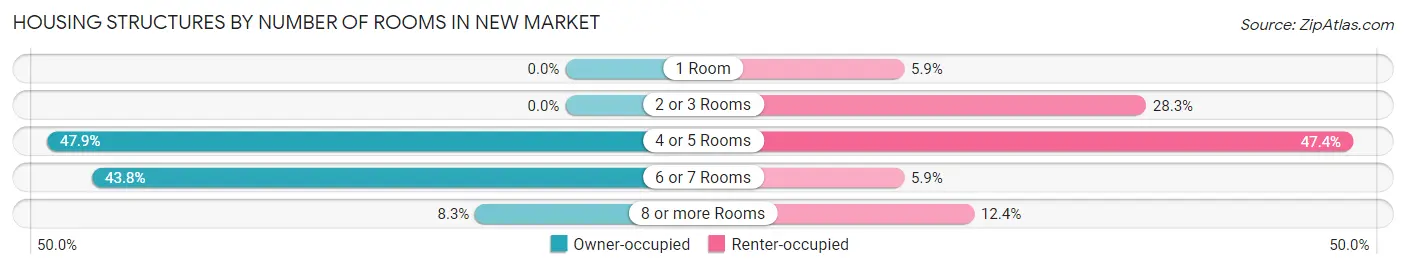
| Number of Rooms | Owner-occupied | Renter-occupied |
| 1 Room | 0 (0.0%) | 22 (5.9%) |
| 2 or 3 Rooms | 0 (0.0%) | 105 (28.3%) |
| 4 or 5 Rooms | 46 (47.9%) | 176 (47.4%) |
| 6 or 7 Rooms | 42 (43.8%) | 22 (5.9%) |
| 8 or more Rooms | 8 (8.3%) | 46 (12.4%) |
| Total | 96 (100.0%) | 371 (100.0%) |
Housing Structure by Heating Type in New Market
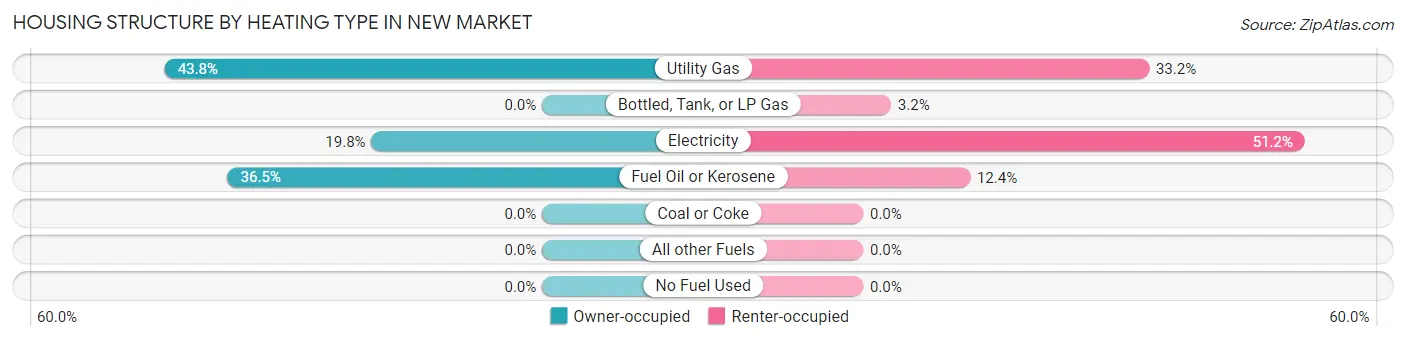
| Heating Type | Owner-occupied | Renter-occupied |
| Utility Gas | 42 (43.8%) | 123 (33.2%) |
| Bottled, Tank, or LP Gas | 0 (0.0%) | 12 (3.2%) |
| Electricity | 19 (19.8%) | 190 (51.2%) |
| Fuel Oil or Kerosene | 35 (36.5%) | 46 (12.4%) |
| Coal or Coke | 0 (0.0%) | 0 (0.0%) |
| All other Fuels | 0 (0.0%) | 0 (0.0%) |
| No Fuel Used | 0 (0.0%) | 0 (0.0%) |
| Total | 96 (100.0%) | 371 (100.0%) |
Household Vehicle Usage in New Market
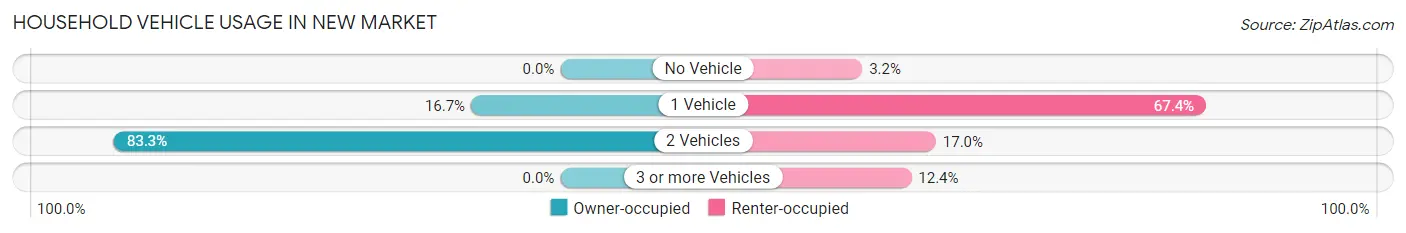
| Vehicles per Household | Owner-occupied | Renter-occupied |
| No Vehicle | 0 (0.0%) | 12 (3.2%) |
| 1 Vehicle | 16 (16.7%) | 250 (67.4%) |
| 2 Vehicles | 80 (83.3%) | 63 (17.0%) |
| 3 or more Vehicles | 0 (0.0%) | 46 (12.4%) |
| Total | 96 (100.0%) | 371 (100.0%) |
Real Estate & Mortgages in New Market
Real Estate and Mortgage Overview in New Market
| Characteristic | Without Mortgage | With Mortgage |
| Housing Units | 7 | 89 |
| Median Property Value | - | - |
| Median Household Income | - | - |
| Monthly Housing Costs | - | - |
| Real Estate Taxes | - | - |
Property Value by Mortgage Status in New Market
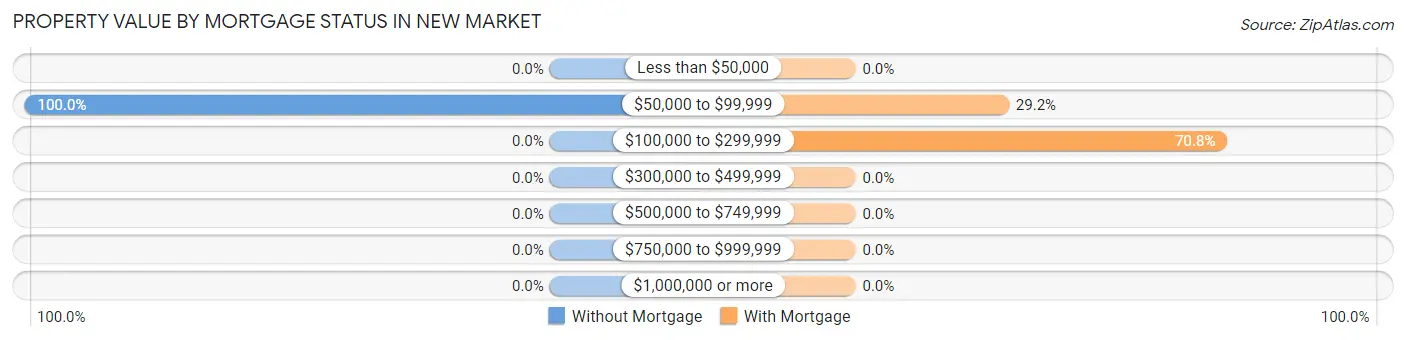
| Property Value | Without Mortgage | With Mortgage |
| Less than $50,000 | 0 (0.0%) | 0 (0.0%) |
| $50,000 to $99,999 | 7 (100.0%) | 26 (29.2%) |
| $100,000 to $299,999 | 0 (0.0%) | 63 (70.8%) |
| $300,000 to $499,999 | 0 (0.0%) | 0 (0.0%) |
| $500,000 to $749,999 | 0 (0.0%) | 0 (0.0%) |
| $750,000 to $999,999 | 0 (0.0%) | 0 (0.0%) |
| $1,000,000 or more | 0 (0.0%) | 0 (0.0%) |
| Total | 7 (100.0%) | 89 (100.0%) |
Household Income by Mortgage Status in New Market
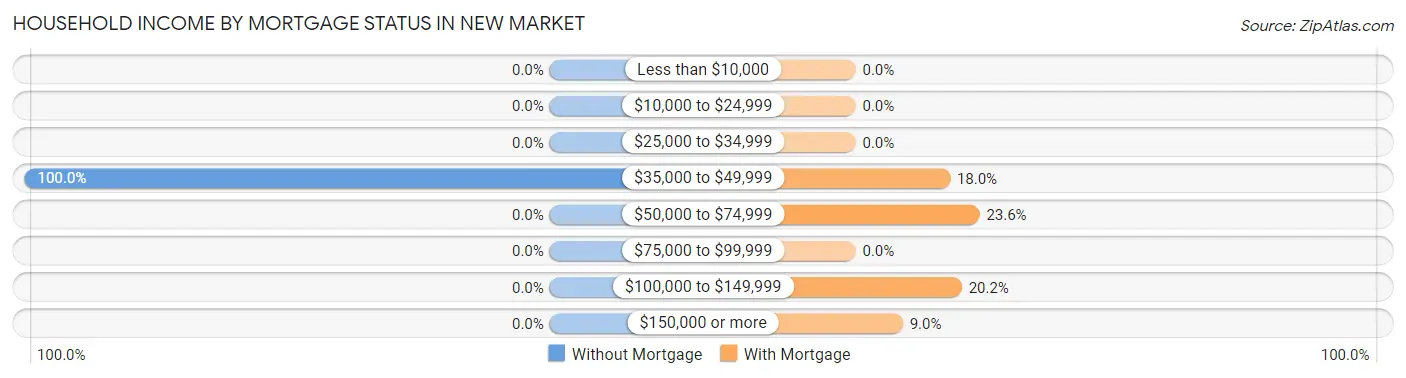
| Household Income | Without Mortgage | With Mortgage |
| Less than $10,000 | 0 (0.0%) | 0 (0.0%) |
| $10,000 to $24,999 | 0 (0.0%) | 0 (0.0%) |
| $25,000 to $34,999 | 0 (0.0%) | 0 (0.0%) |
| $35,000 to $49,999 | 7 (100.0%) | 16 (18.0%) |
| $50,000 to $74,999 | 0 (0.0%) | 21 (23.6%) |
| $75,000 to $99,999 | 0 (0.0%) | 0 (0.0%) |
| $100,000 to $149,999 | 0 (0.0%) | 18 (20.2%) |
| $150,000 or more | 0 (0.0%) | 8 (9.0%) |
| Total | 7 (100.0%) | 89 (100.0%) |
Property Value to Household Income Ratio in New Market
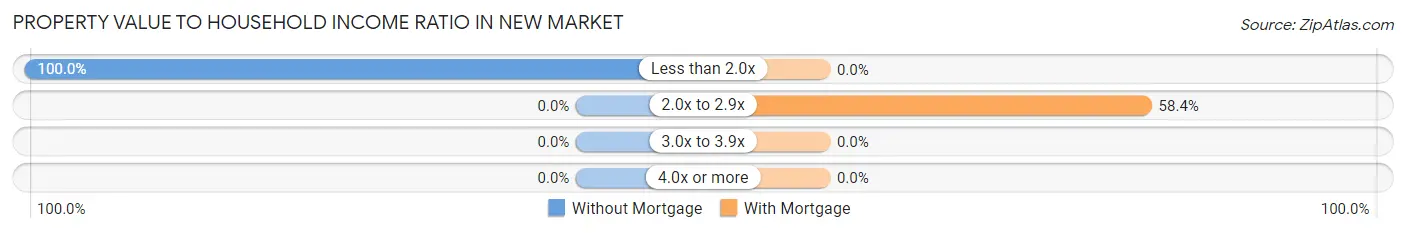
| Value-to-Income Ratio | Without Mortgage | With Mortgage |
| Less than 2.0x | 7 (100.0%) | 0 (0.0%) |
| 2.0x to 2.9x | 0 (0.0%) | 52 (58.4%) |
| 3.0x to 3.9x | 0 (0.0%) | 0 (0.0%) |
| 4.0x or more | 0 (0.0%) | 0 (0.0%) |
| Total | 7 (100.0%) | 89 (100.0%) |
Real Estate Taxes by Mortgage Status in New Market
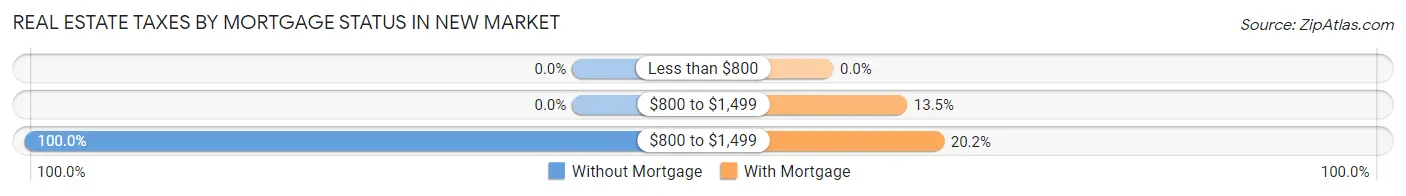
| Property Taxes | Without Mortgage | With Mortgage |
| Less than $800 | 0 (0.0%) | 0 (0.0%) |
| $800 to $1,499 | 0 (0.0%) | 12 (13.5%) |
| $800 to $1,499 | 7 (100.0%) | 18 (20.2%) |
| Total | 7 (100.0%) | 89 (100.0%) |
Health & Disability in New Market
Health Insurance Coverage by Age in New Market
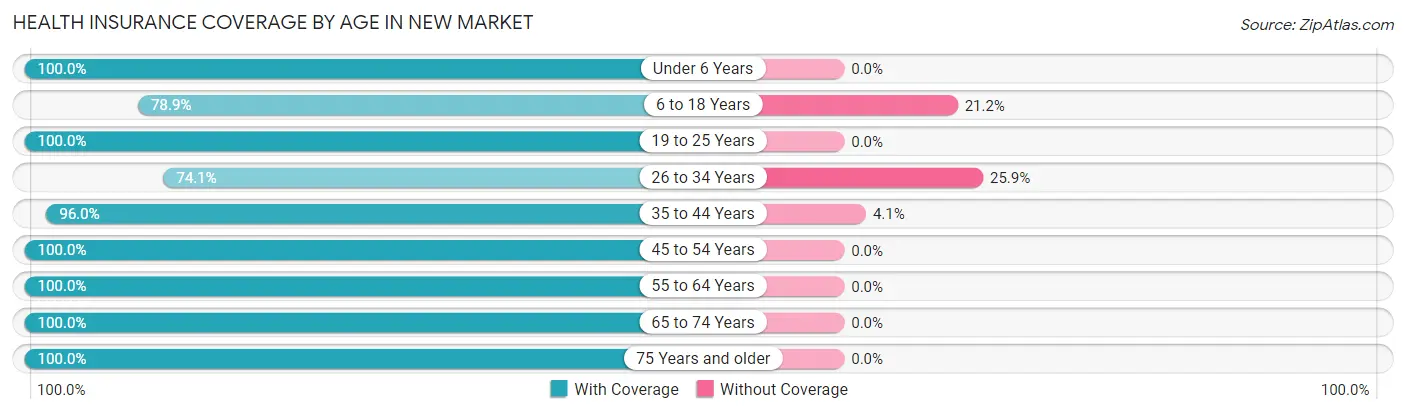
| Age Bracket | With Coverage | Without Coverage |
| Under 6 Years | 80 (100.0%) | 0 (0.0%) |
| 6 to 18 Years | 179 (78.8%) | 48 (21.1%) |
| 19 to 25 Years | 32 (100.0%) | 0 (0.0%) |
| 26 to 34 Years | 63 (74.1%) | 22 (25.9%) |
| 35 to 44 Years | 237 (96.0%) | 10 (4.1%) |
| 45 to 54 Years | 106 (100.0%) | 0 (0.0%) |
| 55 to 64 Years | 144 (100.0%) | 0 (0.0%) |
| 65 to 74 Years | 39 (100.0%) | 0 (0.0%) |
| 75 Years and older | 19 (100.0%) | 0 (0.0%) |
| Total | 899 (91.8%) | 80 (8.2%) |
Health Insurance Coverage by Citizenship Status in New Market
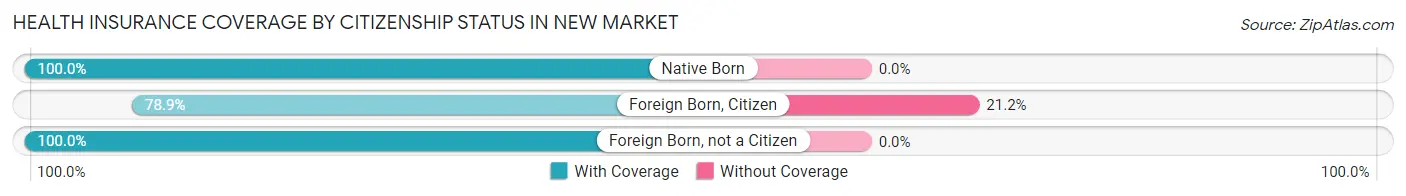
| Citizenship Status | With Coverage | Without Coverage |
| Native Born | 80 (100.0%) | 0 (0.0%) |
| Foreign Born, Citizen | 179 (78.8%) | 48 (21.1%) |
| Foreign Born, not a Citizen | 32 (100.0%) | 0 (0.0%) |
Health Insurance Coverage by Household Income in New Market
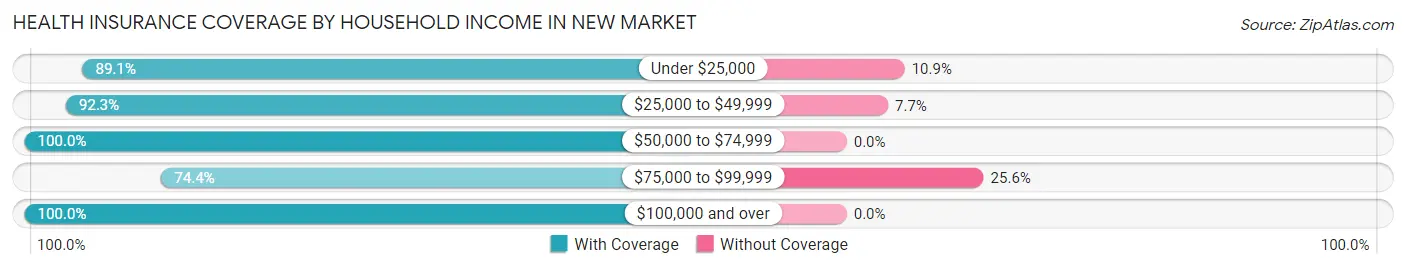
| Household Income | With Coverage | Without Coverage |
| Under $25,000 | 394 (89.1%) | 48 (10.9%) |
| $25,000 to $49,999 | 143 (92.3%) | 12 (7.7%) |
| $50,000 to $74,999 | 46 (100.0%) | 0 (0.0%) |
| $75,000 to $99,999 | 58 (74.4%) | 20 (25.6%) |
| $100,000 and over | 258 (100.0%) | 0 (0.0%) |
Public vs Private Health Insurance Coverage by Age in New Market
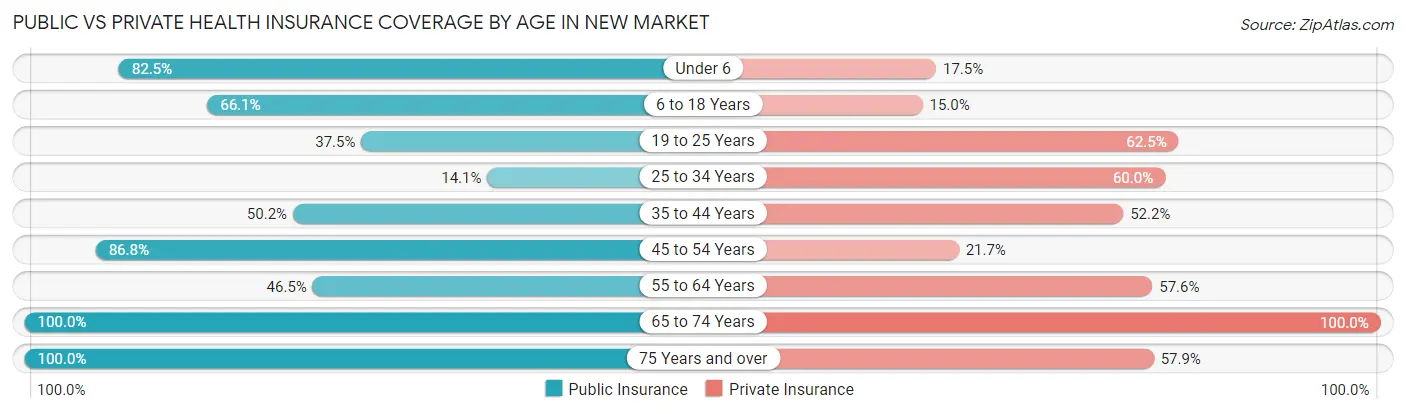
| Age Bracket | Public Insurance | Private Insurance |
| Under 6 | 66 (82.5%) | 14 (17.5%) |
| 6 to 18 Years | 150 (66.1%) | 34 (15.0%) |
| 19 to 25 Years | 12 (37.5%) | 20 (62.5%) |
| 25 to 34 Years | 12 (14.1%) | 51 (60.0%) |
| 35 to 44 Years | 124 (50.2%) | 129 (52.2%) |
| 45 to 54 Years | 92 (86.8%) | 23 (21.7%) |
| 55 to 64 Years | 67 (46.5%) | 83 (57.6%) |
| 65 to 74 Years | 39 (100.0%) | 39 (100.0%) |
| 75 Years and over | 19 (100.0%) | 11 (57.9%) |
| Total | 581 (59.4%) | 404 (41.3%) |
Disability Status by Sex by Age in New Market
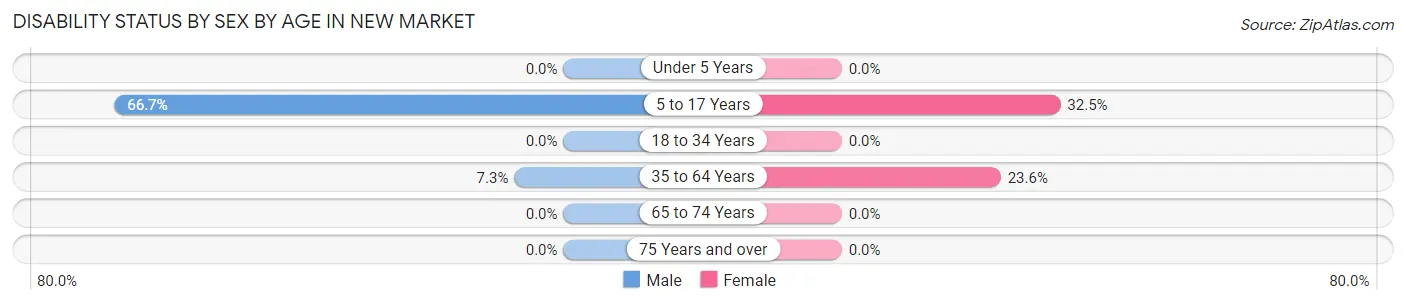
| Age Bracket | Male | Female |
| Under 5 Years | 0 (0.0%) | 0 (0.0%) |
| 5 to 17 Years | 10 (66.7%) | 74 (32.5%) |
| 18 to 34 Years | 0 (0.0%) | 0 (0.0%) |
| 35 to 64 Years | 18 (7.3%) | 59 (23.6%) |
| 65 to 74 Years | 0 (0.0%) | 0 (0.0%) |
| 75 Years and over | 0 (0.0%) | 0 (0.0%) |
Disability Class by Sex by Age in New Market
Disability Class: Hearing Difficulty

| Age Bracket | Male | Female |
| Under 5 Years | 0 (0.0%) | 0 (0.0%) |
| 5 to 17 Years | 0 (0.0%) | 0 (0.0%) |
| 18 to 34 Years | 0 (0.0%) | 0 (0.0%) |
| 35 to 64 Years | 0 (0.0%) | 0 (0.0%) |
| 65 to 74 Years | 0 (0.0%) | 0 (0.0%) |
| 75 Years and over | 0 (0.0%) | 0 (0.0%) |
Disability Class: Vision Difficulty
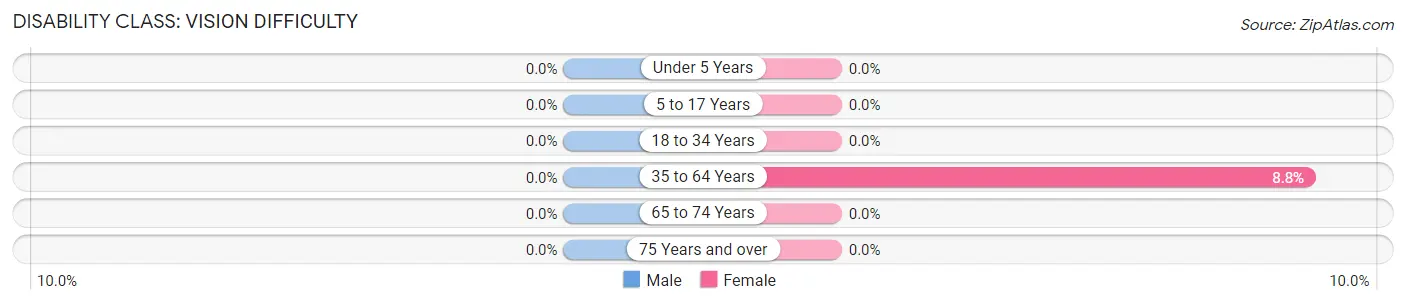
| Age Bracket | Male | Female |
| Under 5 Years | 0 (0.0%) | 0 (0.0%) |
| 5 to 17 Years | 0 (0.0%) | 0 (0.0%) |
| 18 to 34 Years | 0 (0.0%) | 0 (0.0%) |
| 35 to 64 Years | 0 (0.0%) | 22 (8.8%) |
| 65 to 74 Years | 0 (0.0%) | 0 (0.0%) |
| 75 Years and over | 0 (0.0%) | 0 (0.0%) |
Disability Class: Cognitive Difficulty
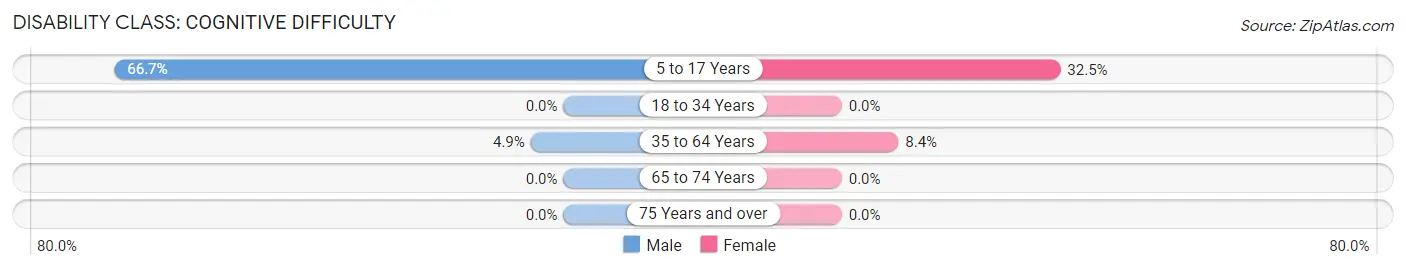
| Age Bracket | Male | Female |
| 5 to 17 Years | 10 (66.7%) | 74 (32.5%) |
| 18 to 34 Years | 0 (0.0%) | 0 (0.0%) |
| 35 to 64 Years | 12 (4.9%) | 21 (8.4%) |
| 65 to 74 Years | 0 (0.0%) | 0 (0.0%) |
| 75 Years and over | 0 (0.0%) | 0 (0.0%) |
Disability Class: Ambulatory Difficulty
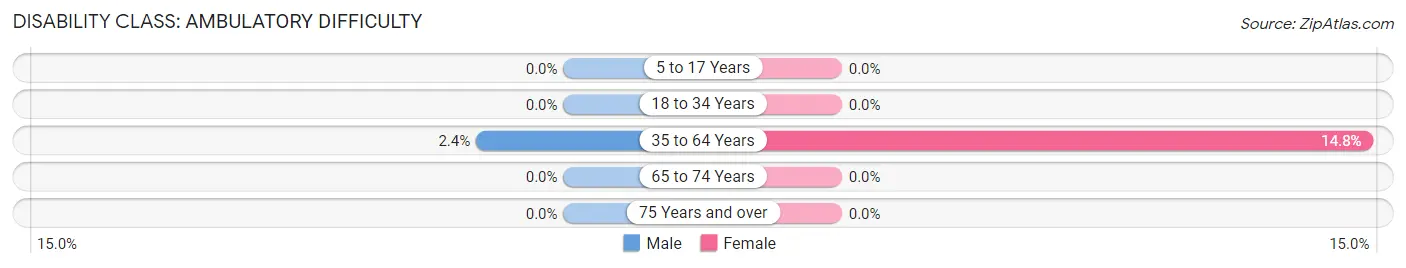
| Age Bracket | Male | Female |
| 5 to 17 Years | 0 (0.0%) | 0 (0.0%) |
| 18 to 34 Years | 0 (0.0%) | 0 (0.0%) |
| 35 to 64 Years | 6 (2.4%) | 37 (14.8%) |
| 65 to 74 Years | 0 (0.0%) | 0 (0.0%) |
| 75 Years and over | 0 (0.0%) | 0 (0.0%) |
Disability Class: Self-Care Difficulty
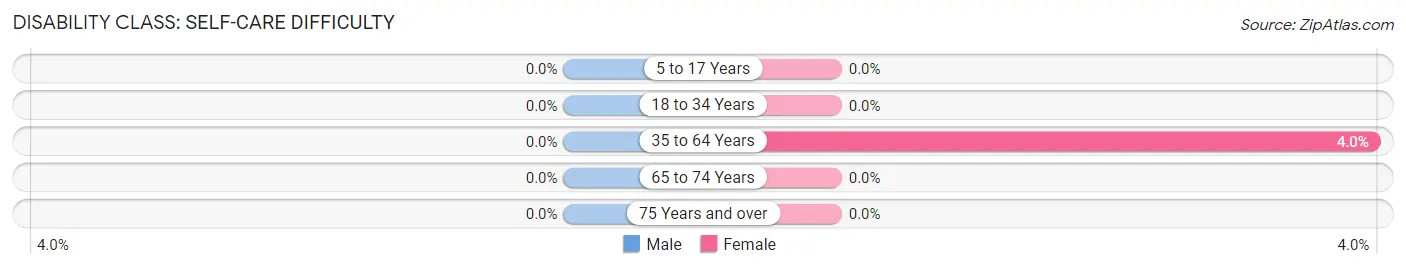
| Age Bracket | Male | Female |
| 5 to 17 Years | 0 (0.0%) | 0 (0.0%) |
| 18 to 34 Years | 0 (0.0%) | 0 (0.0%) |
| 35 to 64 Years | 0 (0.0%) | 10 (4.0%) |
| 65 to 74 Years | 0 (0.0%) | 0 (0.0%) |
| 75 Years and over | 0 (0.0%) | 0 (0.0%) |
Technology Access in New Market
Computing Device Access in New Market
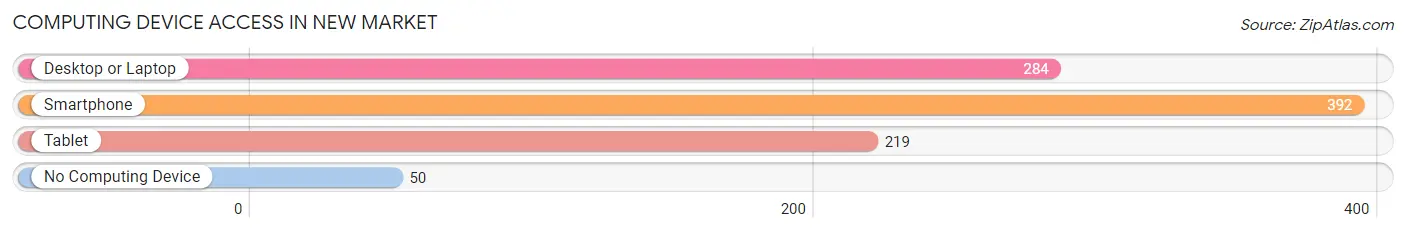
| Device Type | # Households | % Households |
| Desktop or Laptop | 284 | 60.8% |
| Smartphone | 392 | 83.9% |
| Tablet | 219 | 46.9% |
| No Computing Device | 50 | 10.7% |
| Total | 467 | 100.0% |
Internet Access in New Market
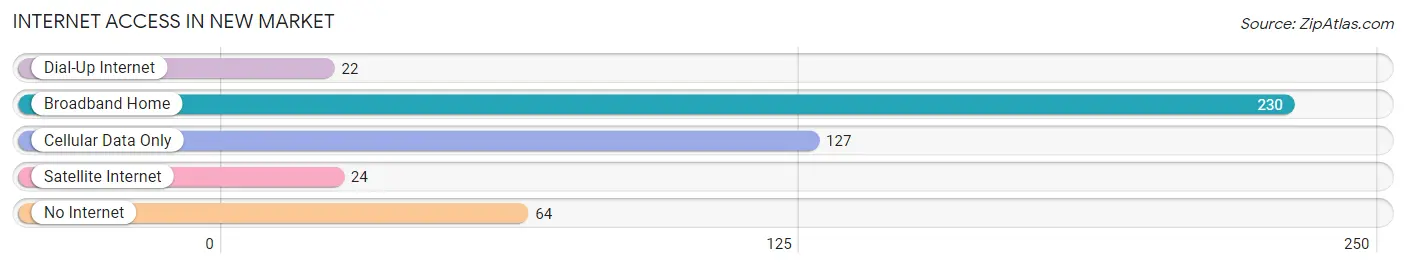
| Internet Type | # Households | % Households |
| Dial-Up Internet | 22 | 4.7% |
| Broadband Home | 230 | 49.2% |
| Cellular Data Only | 127 | 27.2% |
| Satellite Internet | 24 | 5.1% |
| No Internet | 64 | 13.7% |
| Total | 467 | 100.0% |
New Market Summary
New Market is a small borough located in Franklin County, Pennsylvania. It is situated in the south-central part of the state, approximately 10 miles south of Chambersburg and about 90 miles west of Philadelphia. The population of New Market was 1,845 as of the 2010 census.
History
New Market was founded in 1790 by a group of settlers from Maryland. The town was originally known as “New Market Crossroads” and was located at the intersection of two major roads, the Great Conestoga Road and the Old Philadelphia Road. The town was officially incorporated in 1832 and was named after the nearby town of New Market, Maryland.
In the early 19th century, New Market was a thriving agricultural community. The town was home to several mills, including a grist mill, a saw mill, and a woolen mill. The town also had a blacksmith shop, a tannery, and a general store.
In the late 19th century, the town began to experience a period of growth and development. The railroad arrived in 1872, connecting New Market to the larger cities of Harrisburg and Philadelphia. This allowed for increased trade and commerce, and the town began to attract new businesses and industries.
Geography
New Market is located in south-central Pennsylvania, approximately 10 miles south of Chambersburg and 90 miles west of Philadelphia. The town is situated in the Cumberland Valley, which is part of the Ridge and Valley physiographic province of the Appalachian Mountains. The town is located at the intersection of two major roads, the Great Conestoga Road and the Old Philadelphia Road.
The town is situated on a ridge that rises to an elevation of 1,400 feet above sea level. The surrounding area is mostly rural, with rolling hills and farmland. The town is located within the Cumberland Valley School District.
Economy
New Market’s economy is largely based on agriculture and tourism. The town is home to several farms, including dairy farms, beef farms, and vegetable farms. The town is also home to several small businesses, including restaurants, shops, and services.
The town is also a popular tourist destination. The town is home to several historic sites, including the New Market Historic District, which is listed on the National Register of Historic Places. The town also hosts several annual events, including the New Market Days Festival and the New Market Heritage Festival.
Demographics
As of the 2010 census, the population of New Market was 1,845. The racial makeup of the town was 95.3% White, 1.2% African American, 0.3% Native American, 0.7% Asian, 0.1% Pacific Islander, 0.7% from other races, and 1.7% from two or more races. Hispanic or Latino of any race were 2.2% of the population.
The median household income in New Market was $45,938, and the median family income was $51,964. The per capita income was $20,945. About 8.3% of families and 10.2% of the population were below the poverty line, including 14.2% of those under age 18 and 8.2% of those age 65 or over.
Common Questions
What is Per Capita Income in New Market?
Per Capita income in New Market is $26,200.
What is the Median Household income in New Market?
Median Household Income in New Market is $36,645.
What is Income or Wage Gap in New Market?
Income or Wage Gap in New Market is 57.2%.
Women in New Market earn 42.8 cents for every dollar earned by a man.
What is Inequality or Gini Index in New Market?
Inequality or Gini Index in New Market is 0.49.
What is the Total Population of New Market?
Total Population of New Market is 979.
What is the Total Male Population of New Market?
Total Male Population of New Market is 366.
What is the Total Female Population of New Market?
Total Female Population of New Market is 613.
What is the Ratio of Males per 100 Females in New Market?
There are 59.71 Males per 100 Females in New Market.
What is the Ratio of Females per 100 Males in New Market?
There are 167.49 Females per 100 Males in New Market.
What is the Median Population Age in New Market?
Median Population Age in New Market is 36.5 Years.
What is the Average Family Size in New Market
Average Family Size in New Market is 2.7 People.
What is the Average Household Size in New Market
Average Household Size in New Market is 2.1 People.
How Large is the Labor Force in New Market?
There are 467 People in the Labor Forcein in New Market.
What is the Percentage of People in the Labor Force in New Market?
69.0% of People are in the Labor Force in New Market.
What is the Unemployment Rate in New Market?
Unemployment Rate in New Market is 8.1%.