Hawley borough, PA Map & Demographics
Hawley borough Overview
$26,945
PER CAPITA INCOME
$63,409
AVG FAMILY INCOME
$44,662
AVG HOUSEHOLD INCOME
28.9%
WAGE / INCOME GAP [ % ]
71.1¢/ $1
WAGE / INCOME GAP [ $ ]
0.39
INEQUALITY / GINI INDEX
1,110
TOTAL POPULATION
545
MALE POPULATION
565
FEMALE POPULATION
96.46
MALES / 100 FEMALES
103.67
FEMALES / 100 MALES
46.7
MEDIAN AGE
2.8
AVG FAMILY SIZE
2.1
AVG HOUSEHOLD SIZE
555
LABOR FORCE [ PEOPLE ]
54.2%
PERCENT IN LABOR FORCE
7.4%
UNEMPLOYMENT RATE
Income in Hawley borough
Income Overview in Hawley borough
Per Capita Income in Hawley borough is $26,945, while median incomes of families and households are $63,409 and $44,662 respectively.
| Characteristic | Number | Measure |
| Per Capita Income | 1,110 | $26,945 |
| Median Family Income | 270 | $63,409 |
| Mean Family Income | 270 | $68,412 |
| Median Household Income | 532 | $44,662 |
| Mean Household Income | 532 | $53,400 |
| Income Deficit | 270 | $0 |
| Wage / Income Gap (%) | 1,110 | 28.92% |
| Wage / Income Gap ($) | 1,110 | 71.08¢ per $1 |
| Gini / Inequality Index | 1,110 | 0.39 |
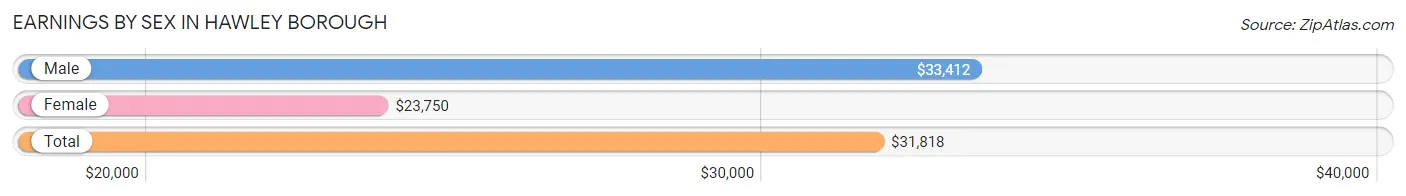
Earnings by Sex in Hawley borough
Average Earnings in Hawley borough are $31,818, $33,412 for men and $23,750 for women, a difference of 28.9%.
| Sex | Number | Average Earnings |
| Male | 341 (58.4%) | $33,412 |
| Female | 243 (41.6%) | $23,750 |
| Total | 584 (100.0%) | $31,818 |
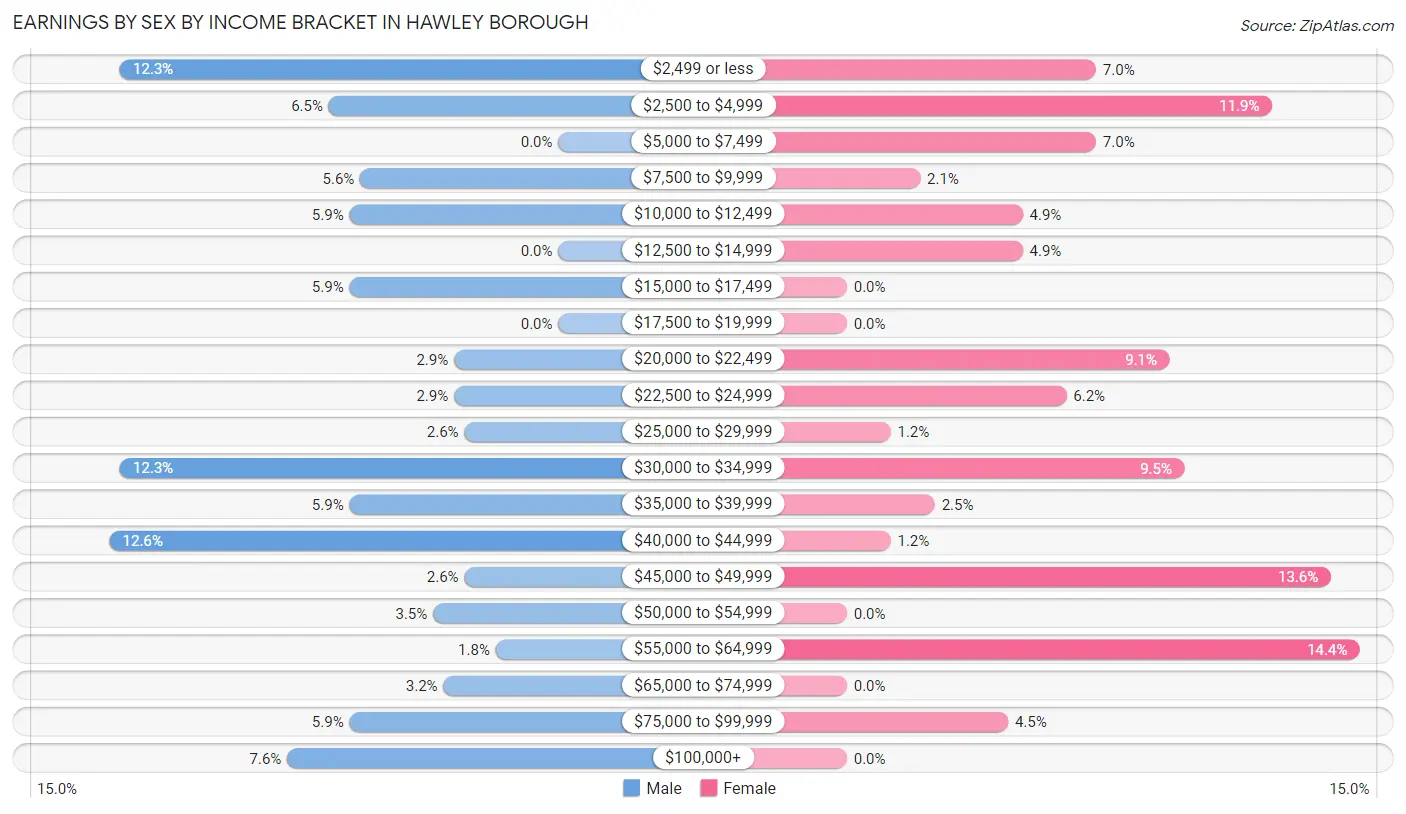
Earnings by Sex by Income Bracket in Hawley borough
The most common earnings brackets in Hawley borough are $40,000 to $44,999 for men (43 | 12.6%) and $55,000 to $64,999 for women (35 | 14.4%).
| Income | Male | Female |
| $2,499 or less | 42 (12.3%) | 17 (7.0%) |
| $2,500 to $4,999 | 22 (6.5%) | 29 (11.9%) |
| $5,000 to $7,499 | 0 (0.0%) | 17 (7.0%) |
| $7,500 to $9,999 | 19 (5.6%) | 5 (2.1%) |
| $10,000 to $12,499 | 20 (5.9%) | 12 (4.9%) |
| $12,500 to $14,999 | 0 (0.0%) | 12 (4.9%) |
| $15,000 to $17,499 | 20 (5.9%) | 0 (0.0%) |
| $17,500 to $19,999 | 0 (0.0%) | 0 (0.0%) |
| $20,000 to $22,499 | 10 (2.9%) | 22 (9.0%) |
| $22,500 to $24,999 | 10 (2.9%) | 15 (6.2%) |
| $25,000 to $29,999 | 9 (2.6%) | 3 (1.2%) |
| $30,000 to $34,999 | 42 (12.3%) | 23 (9.5%) |
| $35,000 to $39,999 | 20 (5.9%) | 6 (2.5%) |
| $40,000 to $44,999 | 43 (12.6%) | 3 (1.2%) |
| $45,000 to $49,999 | 9 (2.6%) | 33 (13.6%) |
| $50,000 to $54,999 | 12 (3.5%) | 0 (0.0%) |
| $55,000 to $64,999 | 6 (1.8%) | 35 (14.4%) |
| $65,000 to $74,999 | 11 (3.2%) | 0 (0.0%) |
| $75,000 to $99,999 | 20 (5.9%) | 11 (4.5%) |
| $100,000+ | 26 (7.6%) | 0 (0.0%) |
| Total | 341 (100.0%) | 243 (100.0%) |
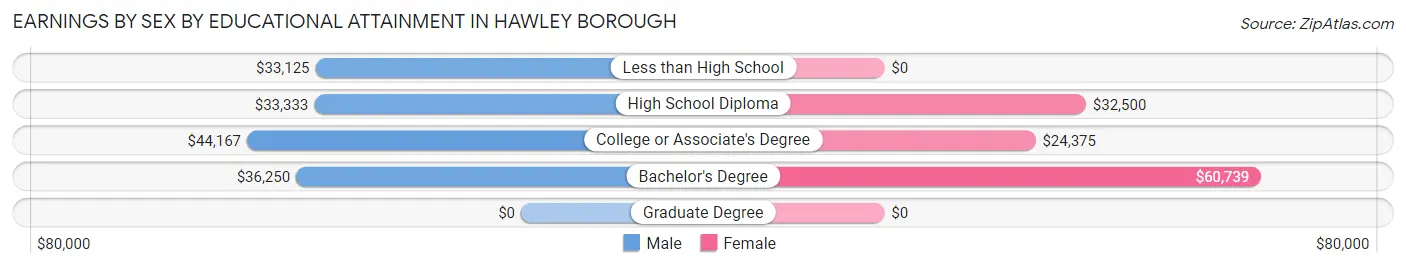
Earnings by Sex by Educational Attainment in Hawley borough
Average earnings in Hawley borough are $35,625 for men and $33,750 for women, a difference of 5.3%. Men with an educational attainment of college or associate's degree enjoy the highest average annual earnings of $44,167, while those with less than high school education earn the least with $33,125. Women with an educational attainment of bachelor's degree earn the most with the average annual earnings of $60,739, while those with college or associate's degree education have the smallest earnings of $24,375.
| Educational Attainment | Male Income | Female Income |
| Less than High School | $33,125 | $0 |
| High School Diploma | $33,333 | $32,500 |
| College or Associate's Degree | $44,167 | $24,375 |
| Bachelor's Degree | $36,250 | $60,739 |
| Graduate Degree | - | - |
| Total | $35,625 | $33,750 |
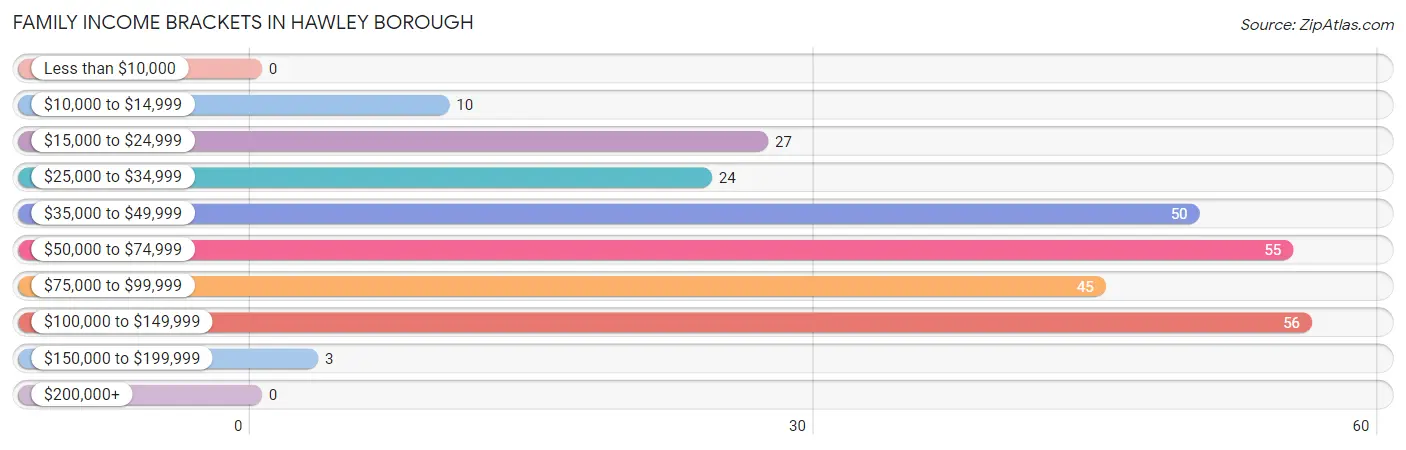
Family Income in Hawley borough
Family Income Brackets in Hawley borough
According to the Hawley borough family income data, there are 56 families falling into the $100,000 to $149,999 income range, which is the most common income bracket and makes up 20.7% of all families.
| Income Bracket | # Families | % Families |
| Less than $10,000 | 0 | 0.0% |
| $10,000 to $14,999 | 10 | 3.7% |
| $15,000 to $24,999 | 27 | 10.0% |
| $25,000 to $34,999 | 24 | 8.9% |
| $35,000 to $49,999 | 50 | 18.5% |
| $50,000 to $74,999 | 55 | 20.4% |
| $75,000 to $99,999 | 45 | 16.7% |
| $100,000 to $149,999 | 56 | 20.7% |
| $150,000 to $199,999 | 3 | 1.1% |
| $200,000+ | 0 | 0.0% |
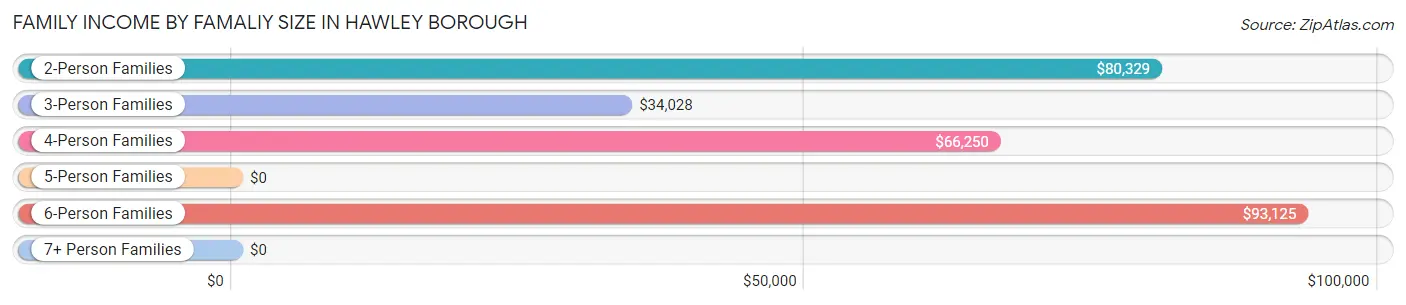
Family Income by Famaliy Size in Hawley borough
6-person families (9 | 3.3%) account for the highest median family income in Hawley borough with $93,125 per family, while 2-person families (155 | 57.4%) have the highest median income of $40,164 per family member.
| Income Bracket | # Families | Median Income |
| 2-Person Families | 155 (57.4%) | $80,329 |
| 3-Person Families | 75 (27.8%) | $34,028 |
| 4-Person Families | 31 (11.5%) | $66,250 |
| 5-Person Families | 0 (0.0%) | $0 |
| 6-Person Families | 9 (3.3%) | $93,125 |
| 7+ Person Families | 0 (0.0%) | $0 |
| Total | 270 (100.0%) | $63,409 |
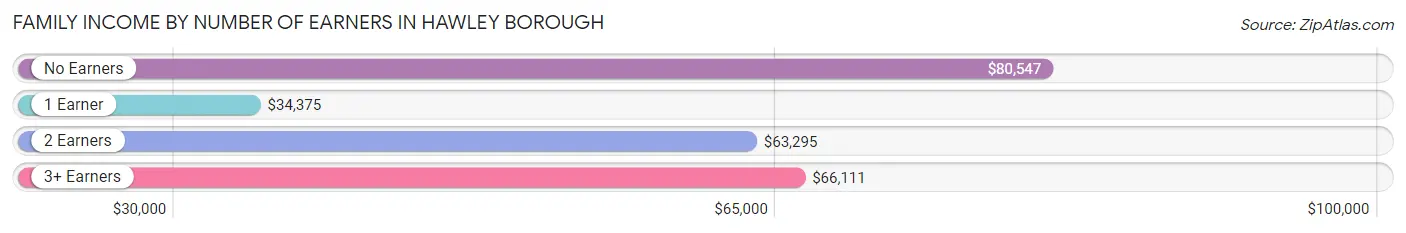
Family Income by Number of Earners in Hawley borough
The median family income in Hawley borough is $63,409, with families comprising no earners (47) having the highest median family income of $80,547, while families with 1 earner (64) have the lowest median family income of $34,375, accounting for 17.4% and 23.7% of families, respectively.
| Number of Earners | # Families | Median Income |
| No Earners | 47 (17.4%) | $80,547 |
| 1 Earner | 64 (23.7%) | $34,375 |
| 2 Earners | 145 (53.7%) | $63,295 |
| 3+ Earners | 14 (5.2%) | $66,111 |
| Total | 270 (100.0%) | $63,409 |
Household Income in Hawley borough
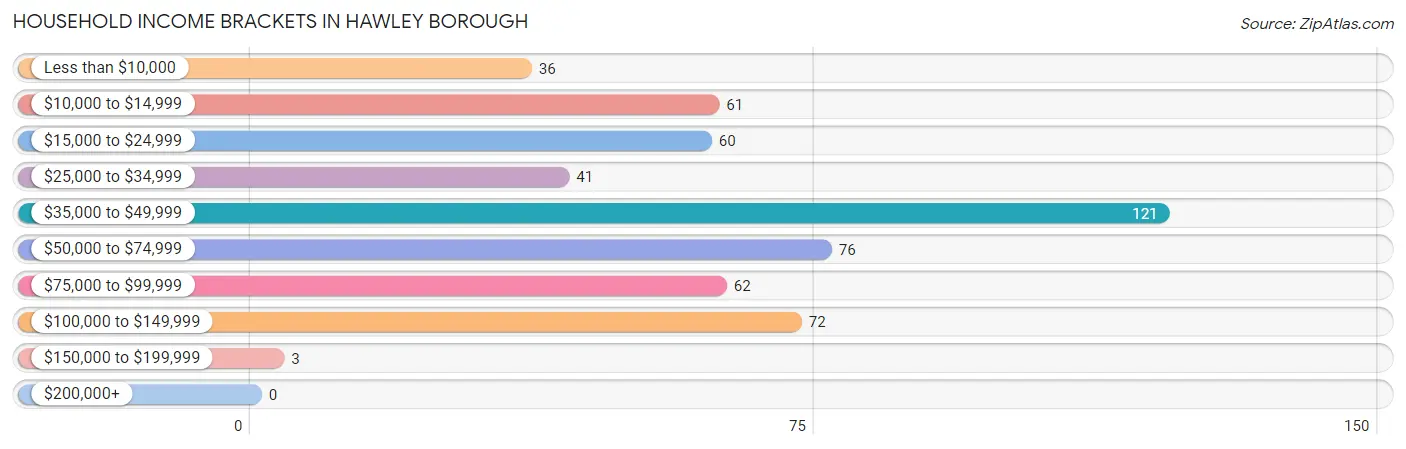
Household Income Brackets in Hawley borough
With 121 households falling in the category, the $35,000 to $49,999 income range is the most frequent in Hawley borough, accounting for 22.7% of all households.
| Income Bracket | # Households | % Households |
| Less than $10,000 | 36 | 6.8% |
| $10,000 to $14,999 | 61 | 11.5% |
| $15,000 to $24,999 | 60 | 11.3% |
| $25,000 to $34,999 | 41 | 7.7% |
| $35,000 to $49,999 | 121 | 22.7% |
| $50,000 to $74,999 | 76 | 14.3% |
| $75,000 to $99,999 | 62 | 11.7% |
| $100,000 to $149,999 | 72 | 13.5% |
| $150,000 to $199,999 | 3 | 0.6% |
| $200,000+ | 0 | 0.0% |
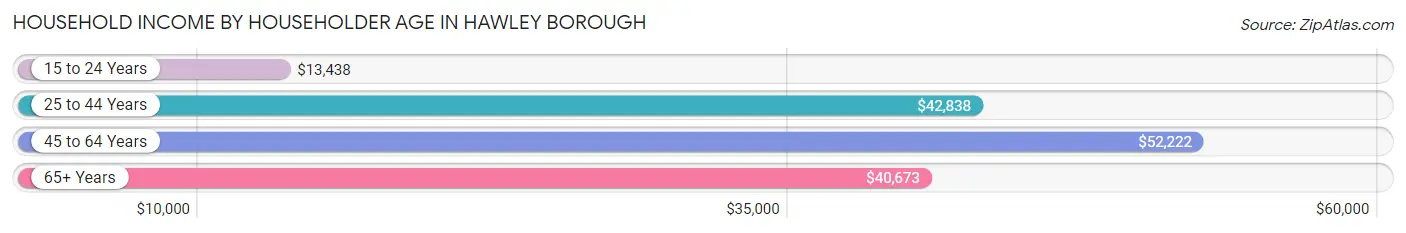
Household Income by Householder Age in Hawley borough
The median household income in Hawley borough is $44,662, with the highest median household income of $52,222 found in the 45 to 64 years age bracket for the primary householder. A total of 214 households (40.2%) fall into this category. Meanwhile, the 15 to 24 years age bracket for the primary householder has the lowest median household income of $13,438, with 27 households (5.1%) in this group.
| Income Bracket | # Households | Median Income |
| 15 to 24 Years | 27 (5.1%) | $13,438 |
| 25 to 44 Years | 142 (26.7%) | $42,838 |
| 45 to 64 Years | 214 (40.2%) | $52,222 |
| 65+ Years | 149 (28.0%) | $40,673 |
| Total | 532 (100.0%) | $44,662 |
Poverty in Hawley borough
Income Below Poverty by Sex and Age in Hawley borough
With 12.8% poverty level for males and 25.1% for females among the residents of Hawley borough, 16 and 17 year old males and 18 to 24 year old females are the most vulnerable to poverty, with 16 males (84.2%) and 61 females (64.2%) in their respective age groups living below the poverty level.
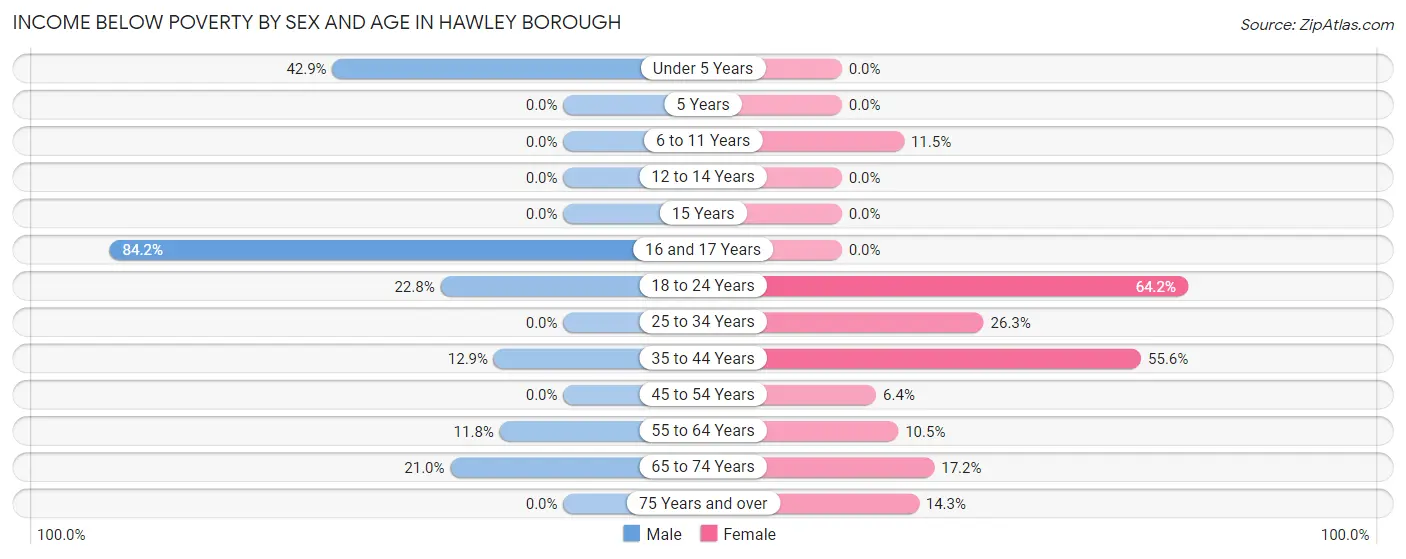
| Age Bracket | Male | Female |
| Under 5 Years | 3 (42.9%) | 0 (0.0%) |
| 5 Years | 0 (0.0%) | 0 (0.0%) |
| 6 to 11 Years | 0 (0.0%) | 3 (11.5%) |
| 12 to 14 Years | 0 (0.0%) | 0 (0.0%) |
| 15 Years | 0 (0.0%) | 0 (0.0%) |
| 16 and 17 Years | 16 (84.2%) | 0 (0.0%) |
| 18 to 24 Years | 13 (22.8%) | 61 (64.2%) |
| 25 to 34 Years | 0 (0.0%) | 10 (26.3%) |
| 35 to 44 Years | 12 (12.9%) | 30 (55.6%) |
| 45 to 54 Years | 0 (0.0%) | 3 (6.4%) |
| 55 to 64 Years | 13 (11.8%) | 13 (10.5%) |
| 65 to 74 Years | 13 (21.0%) | 17 (17.2%) |
| 75 Years and over | 0 (0.0%) | 5 (14.3%) |
| Total | 70 (12.8%) | 142 (25.1%) |
Income Above Poverty by Sex and Age in Hawley borough
According to the poverty statistics in Hawley borough, males aged 6 to 11 years and females aged under 5 years are the age groups that are most secure financially, with 100.0% of males and 100.0% of females in these age groups living above the poverty line.
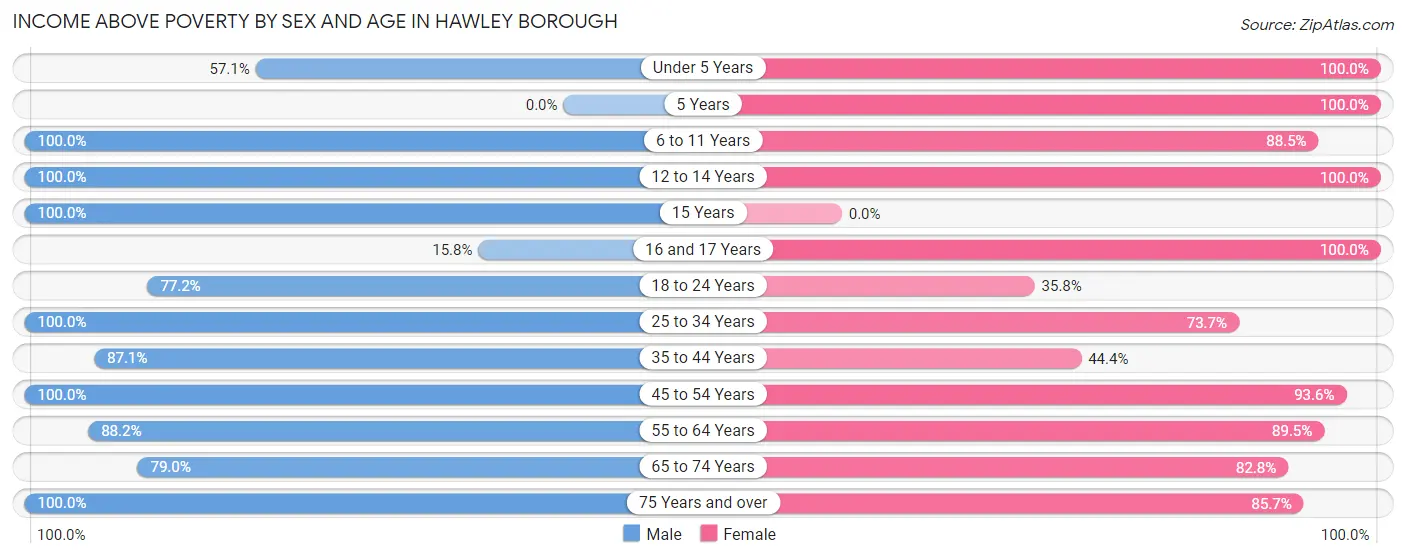
| Age Bracket | Male | Female |
| Under 5 Years | 4 (57.1%) | 6 (100.0%) |
| 5 Years | 0 (0.0%) | 7 (100.0%) |
| 6 to 11 Years | 4 (100.0%) | 23 (88.5%) |
| 12 to 14 Years | 28 (100.0%) | 3 (100.0%) |
| 15 Years | 5 (100.0%) | 0 (0.0%) |
| 16 and 17 Years | 3 (15.8%) | 31 (100.0%) |
| 18 to 24 Years | 44 (77.2%) | 34 (35.8%) |
| 25 to 34 Years | 74 (100.0%) | 28 (73.7%) |
| 35 to 44 Years | 81 (87.1%) | 24 (44.4%) |
| 45 to 54 Years | 41 (100.0%) | 44 (93.6%) |
| 55 to 64 Years | 97 (88.2%) | 111 (89.5%) |
| 65 to 74 Years | 49 (79.0%) | 82 (82.8%) |
| 75 Years and over | 45 (100.0%) | 30 (85.7%) |
| Total | 475 (87.2%) | 423 (74.9%) |
Income Below Poverty Among Married-Couple Families in Hawley borough
The poverty statistics for married-couple families in Hawley borough show that 2.0% or 3 of the total 152 families live below the poverty line. Families with no children have the highest poverty rate of 2.5%, comprising of 3 families. On the other hand, families with 1 or 2 children have the lowest poverty rate of 0.0%, which includes 0 families.
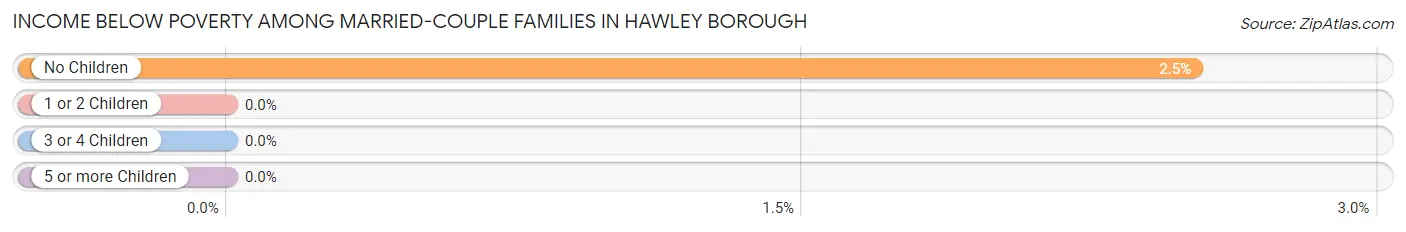
| Children | Above Poverty | Below Poverty |
| No Children | 116 (97.5%) | 3 (2.5%) |
| 1 or 2 Children | 28 (100.0%) | 0 (0.0%) |
| 3 or 4 Children | 5 (100.0%) | 0 (0.0%) |
| 5 or more Children | 0 (0.0%) | 0 (0.0%) |
| Total | 149 (98.0%) | 3 (2.0%) |
Income Below Poverty Among Single-Parent Households in Hawley borough
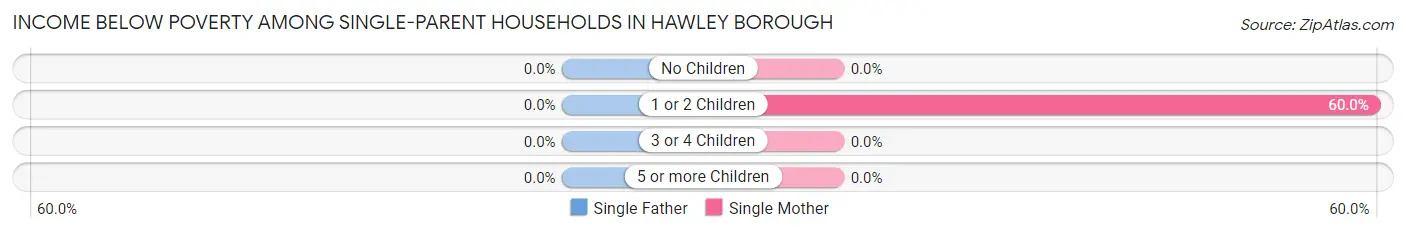
| Children | Single Father | Single Mother |
| No Children | 0 (0.0%) | 0 (0.0%) |
| 1 or 2 Children | 0 (0.0%) | 30 (60.0%) |
| 3 or 4 Children | 0 (0.0%) | 0 (0.0%) |
| 5 or more Children | 0 (0.0%) | 0 (0.0%) |
| Total | 0 (0.0%) | 30 (35.7%) |
Income Below Poverty Among Married-Couple vs Single-Parent Households in Hawley borough
The poverty data for Hawley borough shows that 3 of the married-couple family households (2.0%) and 30 of the single-parent households (25.4%) are living below the poverty level. Within the married-couple family households, those with no children have the highest poverty rate, with 3 households (2.5%) falling below the poverty line. Among the single-parent households, those with 1 or 2 children have the highest poverty rate, with 30 household (43.5%) living below poverty.
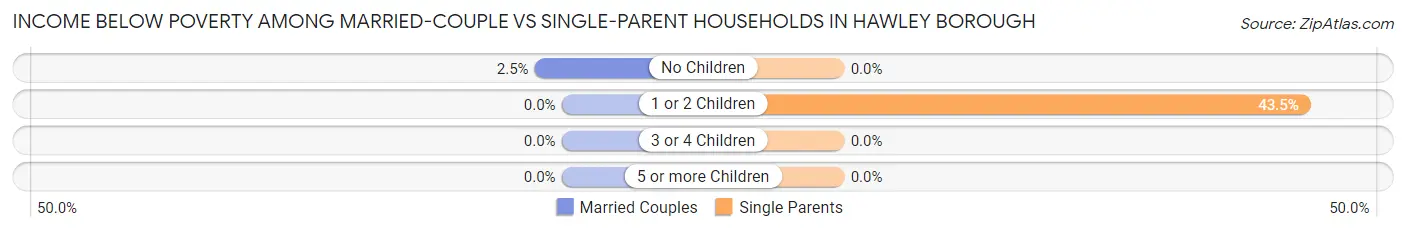
| Children | Married-Couple Families | Single-Parent Households |
| No Children | 3 (2.5%) | 0 (0.0%) |
| 1 or 2 Children | 0 (0.0%) | 30 (43.5%) |
| 3 or 4 Children | 0 (0.0%) | 0 (0.0%) |
| 5 or more Children | 0 (0.0%) | 0 (0.0%) |
| Total | 3 (2.0%) | 30 (25.4%) |
Race in Hawley borough
The most populous races in Hawley borough are White / Caucasian (884 | 79.6%), Hispanic or Latino (240 | 21.6%), and Two or more Races (135 | 12.2%).
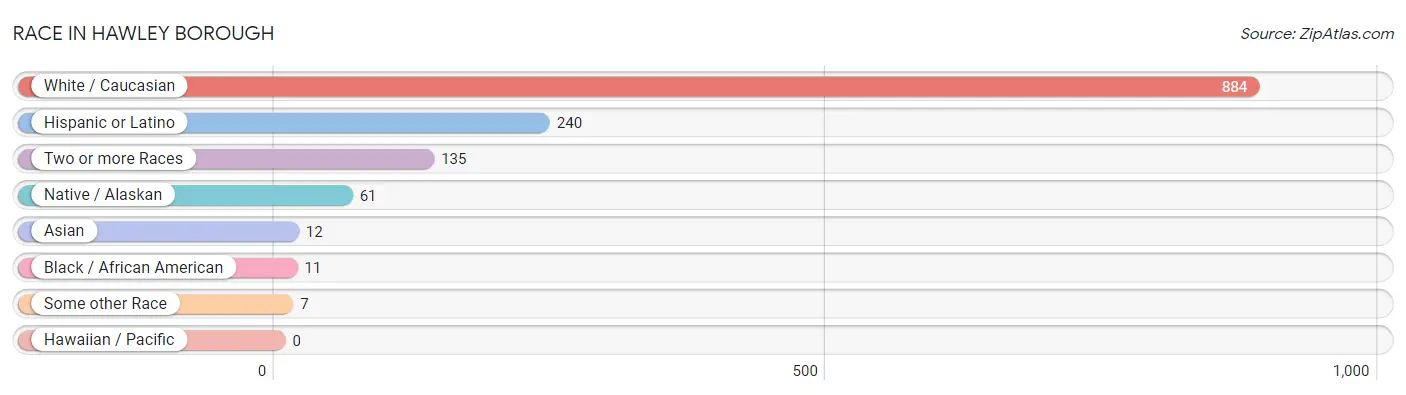
| Race | # Population | % Population |
| Asian | 12 | 1.1% |
| Black / African American | 11 | 1.0% |
| Hawaiian / Pacific | 0 | 0.0% |
| Hispanic or Latino | 240 | 21.6% |
| Native / Alaskan | 61 | 5.5% |
| White / Caucasian | 884 | 79.6% |
| Two or more Races | 135 | 12.2% |
| Some other Race | 7 | 0.6% |
| Total | 1,110 | 100.0% |
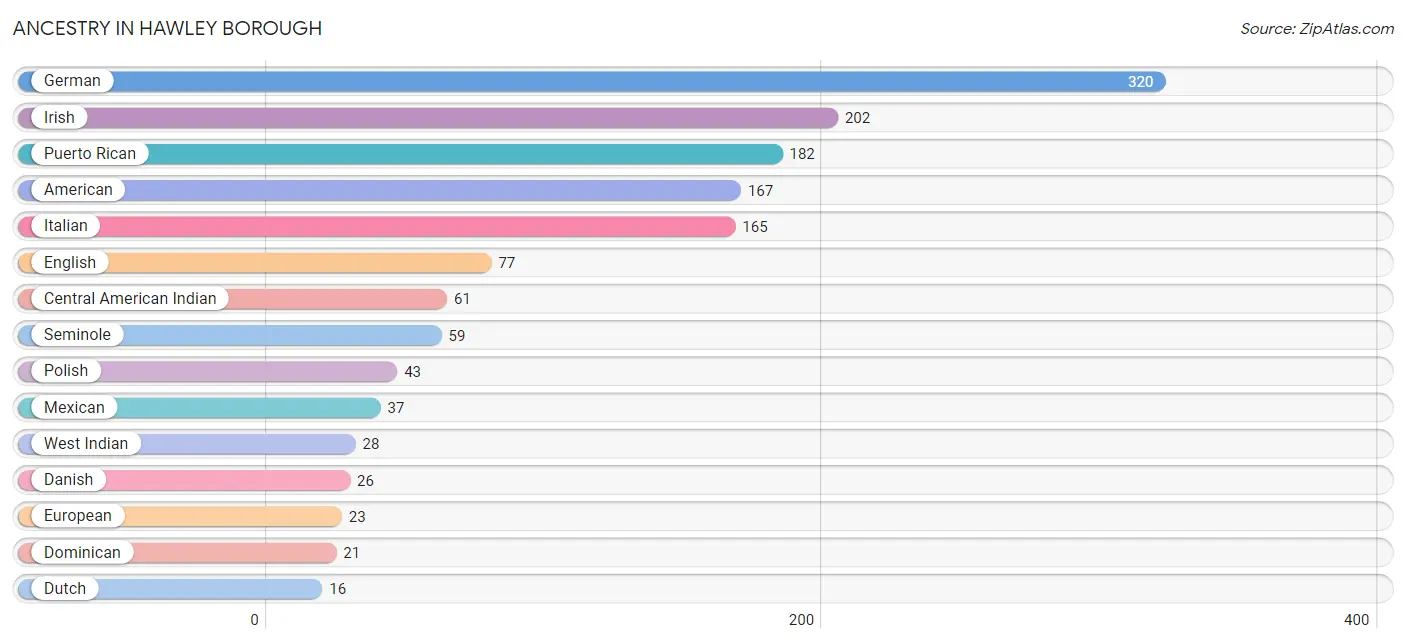
Ancestry in Hawley borough
The most populous ancestries reported in Hawley borough are German (320 | 28.8%), Irish (202 | 18.2%), Puerto Rican (182 | 16.4%), American (167 | 15.0%), and Italian (165 | 14.9%), together accounting for 93.3% of all Hawley borough residents.
| Ancestry | # Population | % Population |
| American | 167 | 15.0% |
| Austrian | 3 | 0.3% |
| British | 4 | 0.4% |
| Canadian | 8 | 0.7% |
| Central American Indian | 61 | 5.5% |
| Czech | 3 | 0.3% |
| Danish | 26 | 2.3% |
| Dominican | 21 | 1.9% |
| Dutch | 16 | 1.4% |
| English | 77 | 6.9% |
| European | 23 | 2.1% |
| French | 8 | 0.7% |
| German | 320 | 28.8% |
| Greek | 9 | 0.8% |
| Hungarian | 3 | 0.3% |
| Irish | 202 | 18.2% |
| Italian | 165 | 14.9% |
| Korean | 12 | 1.1% |
| Lithuanian | 3 | 0.3% |
| Mexican | 37 | 3.3% |
| Norwegian | 14 | 1.3% |
| Polish | 43 | 3.9% |
| Puerto Rican | 182 | 16.4% |
| Scotch-Irish | 3 | 0.3% |
| Scottish | 2 | 0.2% |
| Seminole | 59 | 5.3% |
| Slovene | 3 | 0.3% |
| Swedish | 13 | 1.2% |
| Ukrainian | 7 | 0.6% |
| Welsh | 6 | 0.5% |
| West Indian | 28 | 2.5% |
| Yugoslavian | 3 | 0.3% | View All 32 Rows |
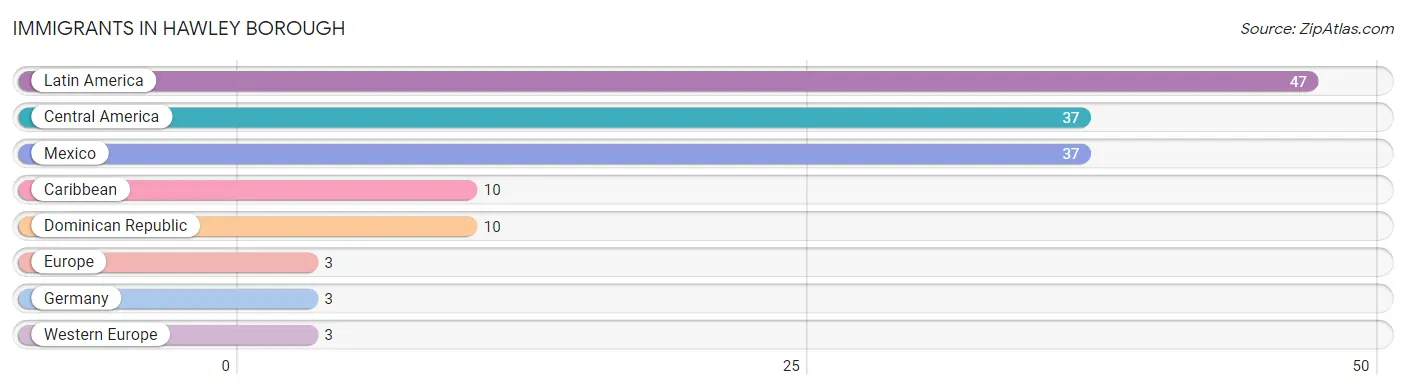
Immigrants in Hawley borough
The most numerous immigrant groups reported in Hawley borough came from Latin America (47 | 4.2%), Central America (37 | 3.3%), Mexico (37 | 3.3%), Caribbean (10 | 0.9%), and Dominican Republic (10 | 0.9%), together accounting for 12.7% of all Hawley borough residents.
| Immigration Origin | # Population | % Population |
| Caribbean | 10 | 0.9% |
| Central America | 37 | 3.3% |
| Dominican Republic | 10 | 0.9% |
| Europe | 3 | 0.3% |
| Germany | 3 | 0.3% |
| Latin America | 47 | 4.2% |
| Mexico | 37 | 3.3% |
| Western Europe | 3 | 0.3% | View All 8 Rows |
Sex and Age in Hawley borough
Sex and Age in Hawley borough
The most populous age groups in Hawley borough are 55 to 59 Years (69 | 12.7%) for men and 65 to 69 Years (85 | 15.0%) for women.
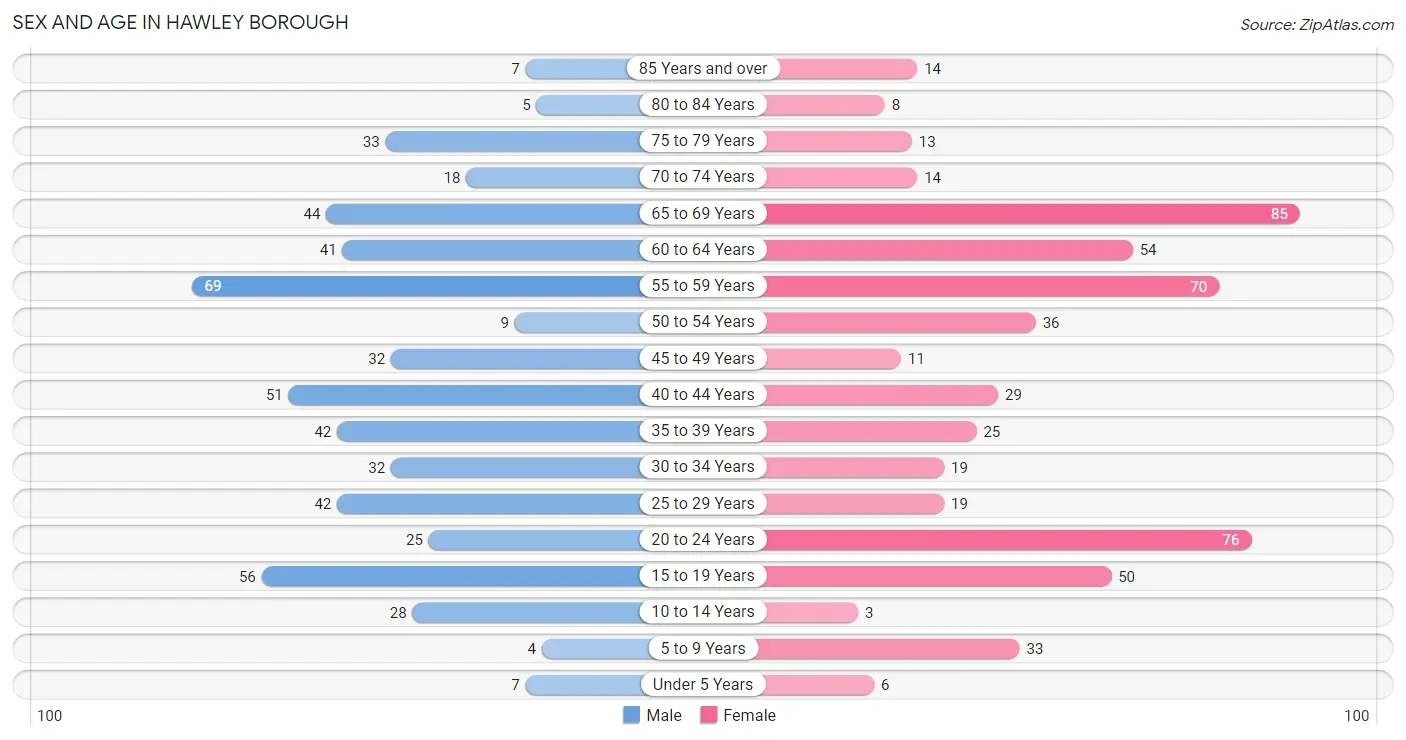
| Age Bracket | Male | Female |
| Under 5 Years | 7 (1.3%) | 6 (1.1%) |
| 5 to 9 Years | 4 (0.7%) | 33 (5.8%) |
| 10 to 14 Years | 28 (5.1%) | 3 (0.5%) |
| 15 to 19 Years | 56 (10.3%) | 50 (8.8%) |
| 20 to 24 Years | 25 (4.6%) | 76 (13.5%) |
| 25 to 29 Years | 42 (7.7%) | 19 (3.4%) |
| 30 to 34 Years | 32 (5.9%) | 19 (3.4%) |
| 35 to 39 Years | 42 (7.7%) | 25 (4.4%) |
| 40 to 44 Years | 51 (9.4%) | 29 (5.1%) |
| 45 to 49 Years | 32 (5.9%) | 11 (1.9%) |
| 50 to 54 Years | 9 (1.7%) | 36 (6.4%) |
| 55 to 59 Years | 69 (12.7%) | 70 (12.4%) |
| 60 to 64 Years | 41 (7.5%) | 54 (9.6%) |
| 65 to 69 Years | 44 (8.1%) | 85 (15.0%) |
| 70 to 74 Years | 18 (3.3%) | 14 (2.5%) |
| 75 to 79 Years | 33 (6.1%) | 13 (2.3%) |
| 80 to 84 Years | 5 (0.9%) | 8 (1.4%) |
| 85 Years and over | 7 (1.3%) | 14 (2.5%) |
| Total | 545 (100.0%) | 565 (100.0%) |
Families and Households in Hawley borough
Median Family Size in Hawley borough
The median family size in Hawley borough is 2.82 persons per family, with single male/father families (34 | 12.6%) accounting for the largest median family size of 3.21 persons per family. On the other hand, married-couple families (152 | 56.3%) represent the smallest median family size with 2.69 persons per family.
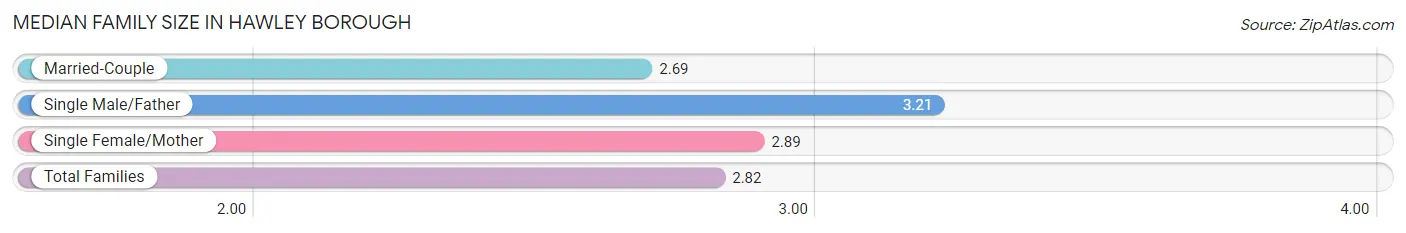
| Family Type | # Families | Family Size |
| Married-Couple | 152 (56.3%) | 2.69 |
| Single Male/Father | 34 (12.6%) | 3.21 |
| Single Female/Mother | 84 (31.1%) | 2.89 |
| Total Families | 270 (100.0%) | 2.82 |
Median Household Size in Hawley borough
The median household size in Hawley borough is 2.06 persons per household, with single male/father households (34 | 6.4%) accounting for the largest median household size of 3.29 persons per household. non-family households (262 | 49.2%) represent the smallest median household size with 1.19 persons per household.
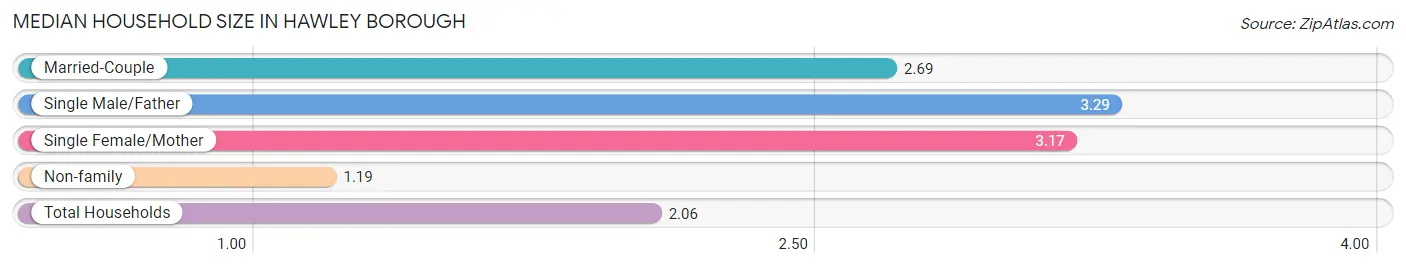
| Household Type | # Households | Household Size |
| Married-Couple | 152 (28.6%) | 2.69 |
| Single Male/Father | 34 (6.4%) | 3.29 |
| Single Female/Mother | 84 (15.8%) | 3.17 |
| Non-family | 262 (49.2%) | 1.19 |
| Total Households | 532 (100.0%) | 2.06 |
Household Size by Marriage Status in Hawley borough
Out of a total of 532 households in Hawley borough, 270 (50.7%) are family households, while 262 (49.2%) are nonfamily households. The most numerous type of family households are 2-person households, comprising 149, and the most common type of nonfamily households are 1-person households, comprising 242.
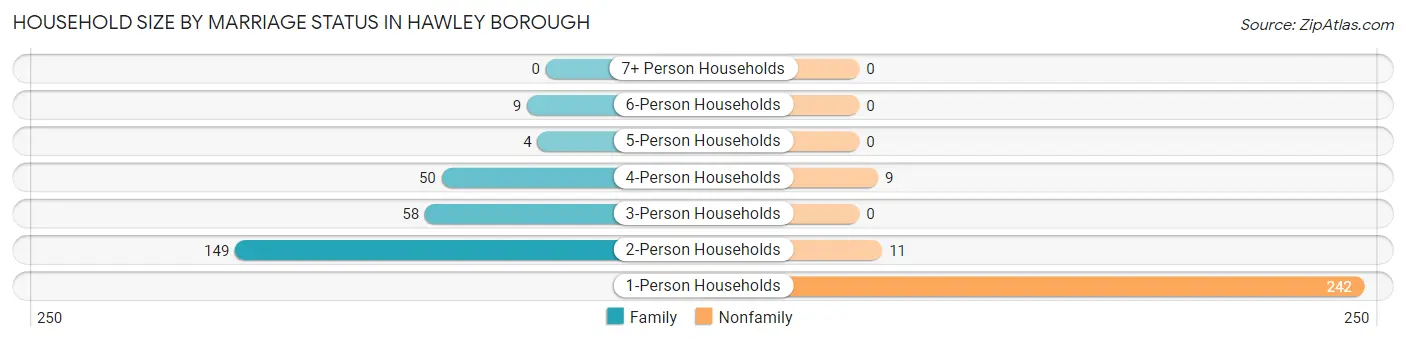
| Household Size | Family Households | Nonfamily Households |
| 1-Person Households | - | 242 (45.5%) |
| 2-Person Households | 149 (28.0%) | 11 (2.1%) |
| 3-Person Households | 58 (10.9%) | 0 (0.0%) |
| 4-Person Households | 50 (9.4%) | 9 (1.7%) |
| 5-Person Households | 4 (0.7%) | 0 (0.0%) |
| 6-Person Households | 9 (1.7%) | 0 (0.0%) |
| 7+ Person Households | 0 (0.0%) | 0 (0.0%) |
| Total | 270 (50.7%) | 262 (49.2%) |
Female Fertility in Hawley borough
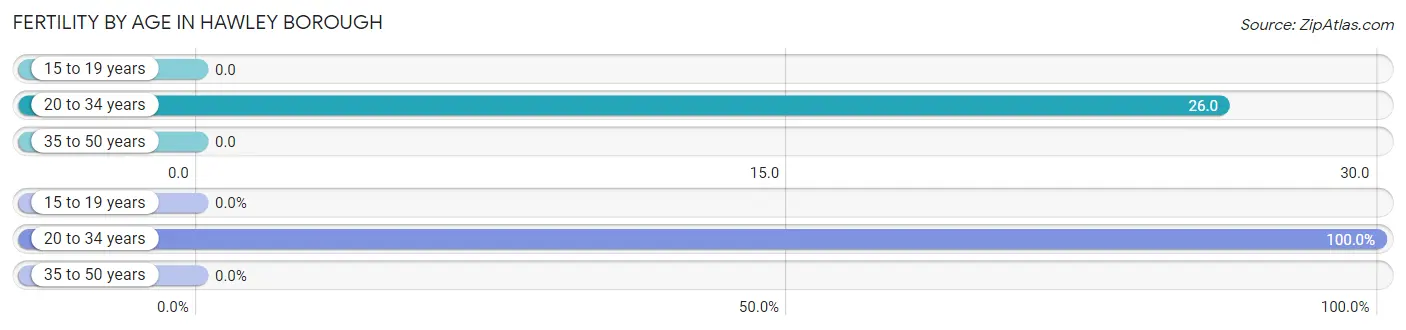
Fertility by Age in Hawley borough
Average fertility rate in Hawley borough is 12.0 births per 1,000 women. Women in the age bracket of 20 to 34 years have the highest fertility rate with 26.0 births per 1,000 women. Women in the age bracket of 20 to 34 years acount for 100.0% of all women with births.
| Age Bracket | Women with Births | Births / 1,000 Women |
| 15 to 19 years | 0 (0.0%) | 0.0 |
| 20 to 34 years | 3 (100.0%) | 26.0 |
| 35 to 50 years | 0 (0.0%) | 0.0 |
| Total | 3 (100.0%) | 12.0 |
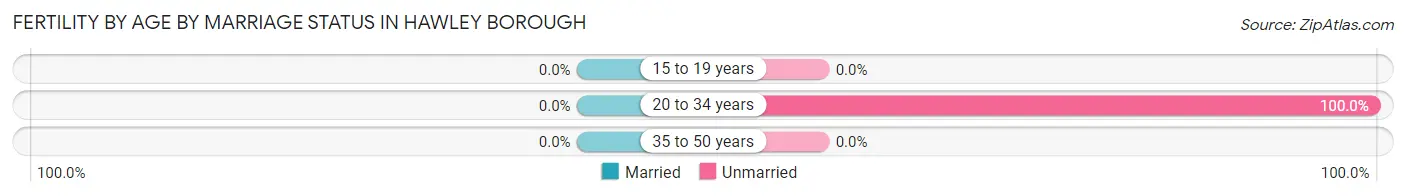
Fertility by Age by Marriage Status in Hawley borough
| Age Bracket | Married | Unmarried |
| 15 to 19 years | 0 (0.0%) | 0 (0.0%) |
| 20 to 34 years | 0 (0.0%) | 3 (100.0%) |
| 35 to 50 years | 0 (0.0%) | 0 (0.0%) |
| Total | 0 (0.0%) | 3 (100.0%) |
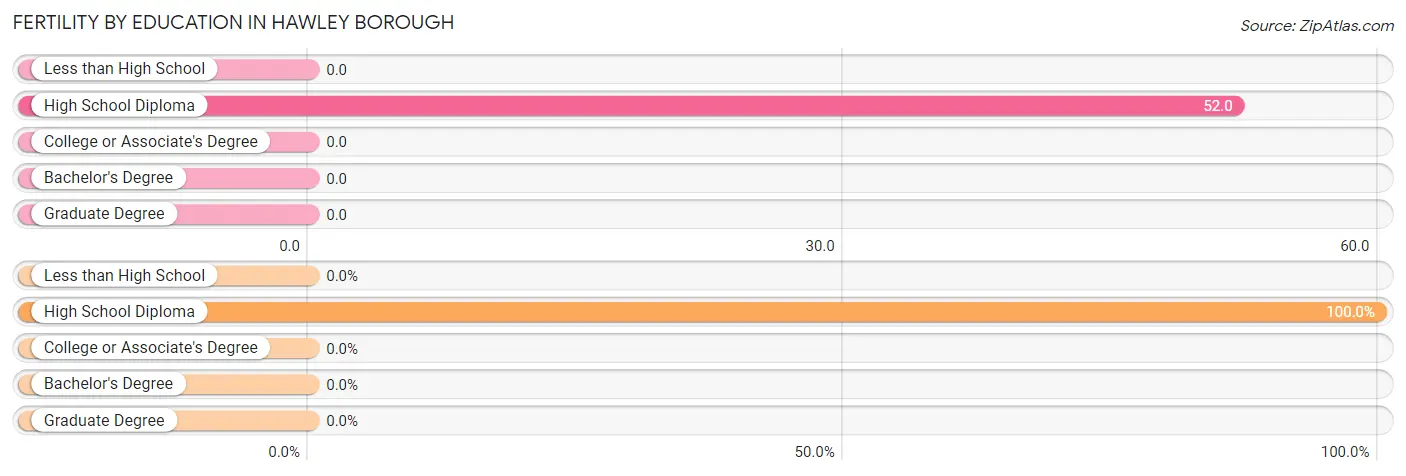
Fertility by Education in Hawley borough
| Educational Attainment | Women with Births | Births / 1,000 Women |
| Less than High School | 0 (0.0%) | 0.0 |
| High School Diploma | 3 (100.0%) | 52.0 |
| College or Associate's Degree | 0 (0.0%) | 0.0 |
| Bachelor's Degree | 0 (0.0%) | 0.0 |
| Graduate Degree | 0 (0.0%) | 0.0 |
| Total | 3 (100.0%) | 12.0 |
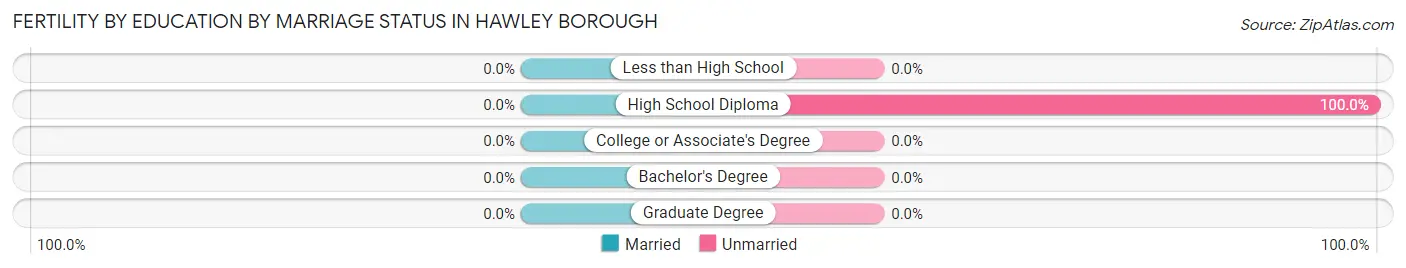
Fertility by Education by Marriage Status in Hawley borough
| Educational Attainment | Married | Unmarried |
| Less than High School | 0 (0.0%) | 0 (0.0%) |
| High School Diploma | 0 (0.0%) | 3 (100.0%) |
| College or Associate's Degree | 0 (0.0%) | 0 (0.0%) |
| Bachelor's Degree | 0 (0.0%) | 0 (0.0%) |
| Graduate Degree | 0 (0.0%) | 0 (0.0%) |
| Total | 0 (0.0%) | 3 (100.0%) |
Employment Characteristics in Hawley borough
Employment by Class of Employer in Hawley borough
Among the 514 employed individuals in Hawley borough, private company employees (348 | 67.7%), self-employed (not incorporated) (57 | 11.1%), and not-for-profit organizations (35 | 6.8%) make up the most common classes of employment.
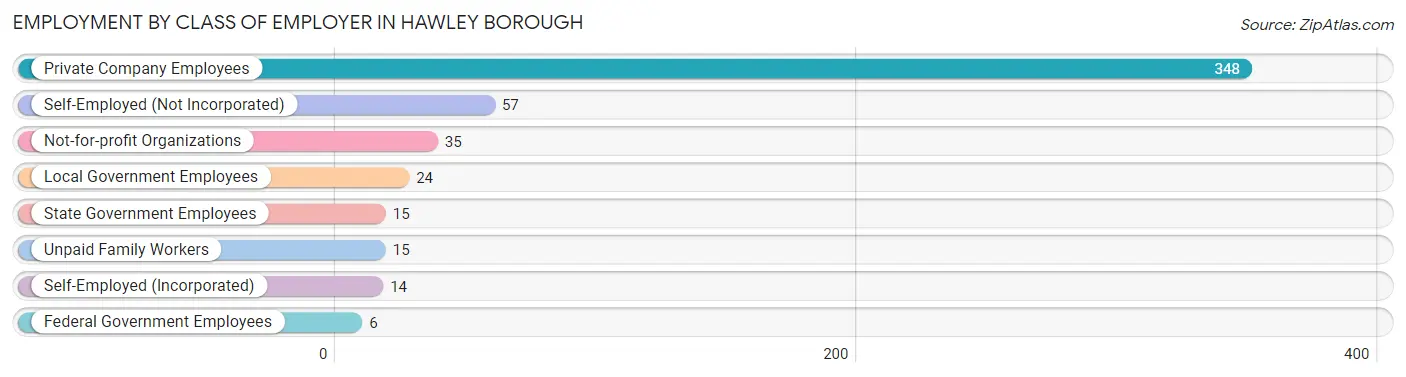
| Employer Class | # Employees | % Employees |
| Private Company Employees | 348 | 67.7% |
| Self-Employed (Incorporated) | 14 | 2.7% |
| Self-Employed (Not Incorporated) | 57 | 11.1% |
| Not-for-profit Organizations | 35 | 6.8% |
| Local Government Employees | 24 | 4.7% |
| State Government Employees | 15 | 2.9% |
| Federal Government Employees | 6 | 1.2% |
| Unpaid Family Workers | 15 | 2.9% |
| Total | 514 | 100.0% |
Employment Status by Age in Hawley borough
According to the labor force statistics for Hawley borough, out of the total population over 16 years of age (1,024), 54.2% or 555 individuals are in the labor force, with 7.4% or 41 of them unemployed. The age group with the highest labor force participation rate is 30 to 34 years, with 100.0% or 51 individuals in the labor force. Within the labor force, the 35 to 44 years age range has the highest percentage of unemployed individuals, with 20.2% or 23 of them being unemployed.
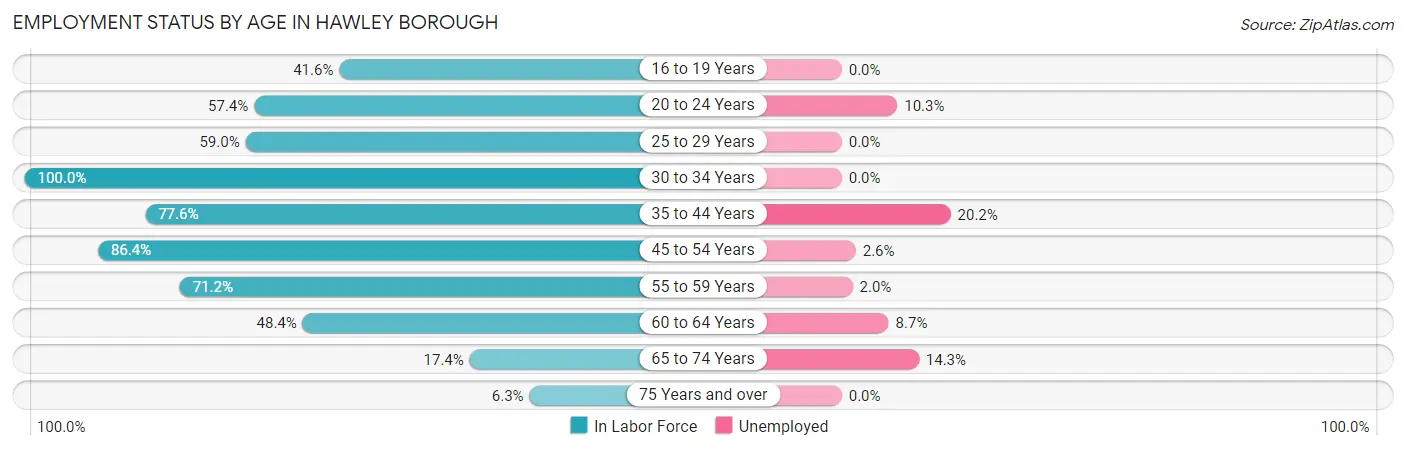
| Age Bracket | In Labor Force | Unemployed |
| 16 to 19 Years | 42 (41.6%) | 0 (0.0%) |
| 20 to 24 Years | 58 (57.4%) | 6 (10.3%) |
| 25 to 29 Years | 36 (59.0%) | 0 (0.0%) |
| 30 to 34 Years | 51 (100.0%) | 0 (0.0%) |
| 35 to 44 Years | 114 (77.6%) | 23 (20.2%) |
| 45 to 54 Years | 76 (86.4%) | 2 (2.6%) |
| 55 to 59 Years | 99 (71.2%) | 2 (2.0%) |
| 60 to 64 Years | 46 (48.4%) | 4 (8.7%) |
| 65 to 74 Years | 28 (17.4%) | 4 (14.3%) |
| 75 Years and over | 5 (6.3%) | 0 (0.0%) |
| Total | 555 (54.2%) | 41 (7.4%) |
Employment Status by Educational Attainment in Hawley borough
According to labor force statistics for Hawley borough, 72.6% of individuals (422) out of the total population between 25 and 64 years of age (581) are in the labor force, with 7.3% or 31 of them being unemployed. The group with the highest labor force participation rate are those with the educational attainment of bachelor's degree or higher, with 96.9% or 62 individuals in the labor force. Within the labor force, individuals with less than high school education have the highest percentage of unemployment, with 18.2% or 4 of them being unemployed.
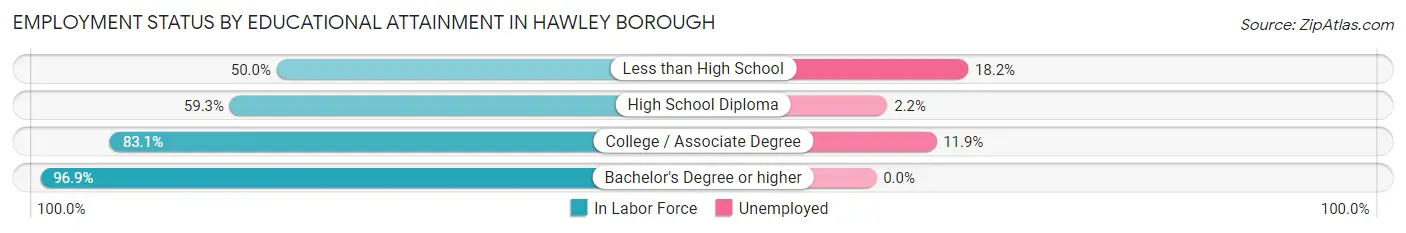
| Educational Attainment | In Labor Force | Unemployed |
| Less than High School | 22 (50.0%) | 8 (18.2%) |
| High School Diploma | 137 (59.3%) | 5 (2.2%) |
| College / Associate Degree | 201 (83.1%) | 29 (11.9%) |
| Bachelor's Degree or higher | 62 (96.9%) | 0 (0.0%) |
| Total | 422 (72.6%) | 42 (7.3%) |
Employment Occupations by Sex in Hawley borough
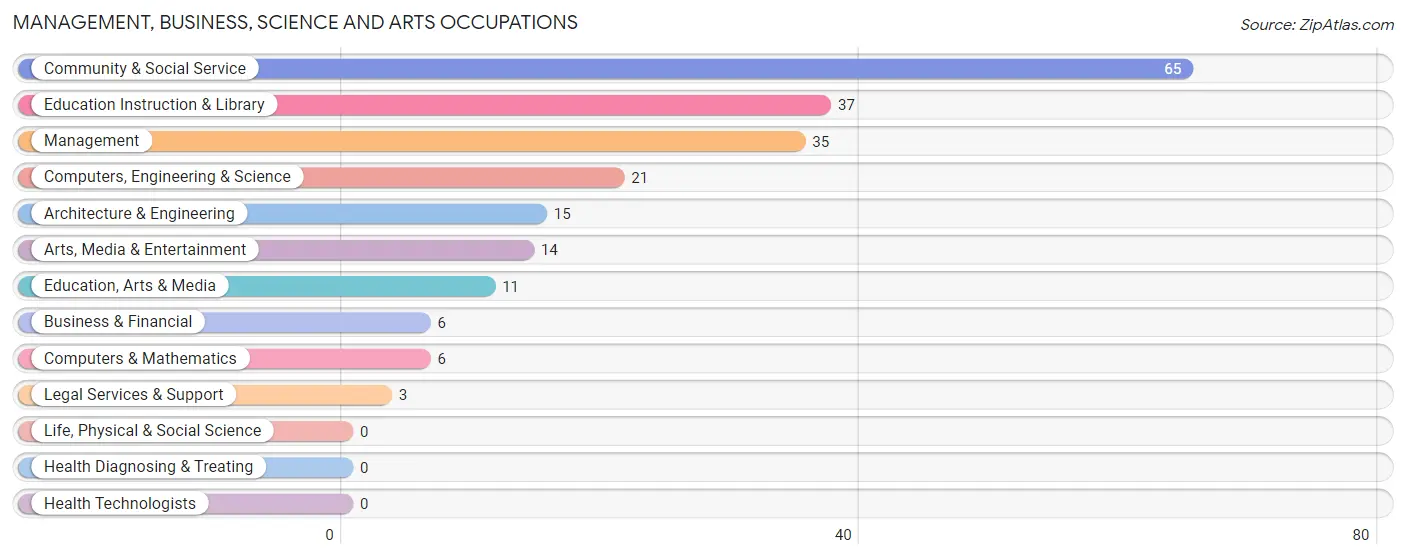
Management, Business, Science and Arts Occupations
The most common Management, Business, Science and Arts occupations in Hawley borough are Community & Social Service (65 | 12.7%), Education Instruction & Library (37 | 7.2%), Management (35 | 6.8%), Computers, Engineering & Science (21 | 4.1%), and Architecture & Engineering (15 | 2.9%).
Management, Business, Science and Arts Occupations by Sex
Within the Management, Business, Science and Arts occupations in Hawley borough, the most male-oriented occupations are Business & Financial (100.0%), Architecture & Engineering (100.0%), and Legal Services & Support (100.0%), while the most female-oriented occupations are Education, Arts & Media (100.0%), Arts, Media & Entertainment (78.6%), and Community & Social Service (63.1%).
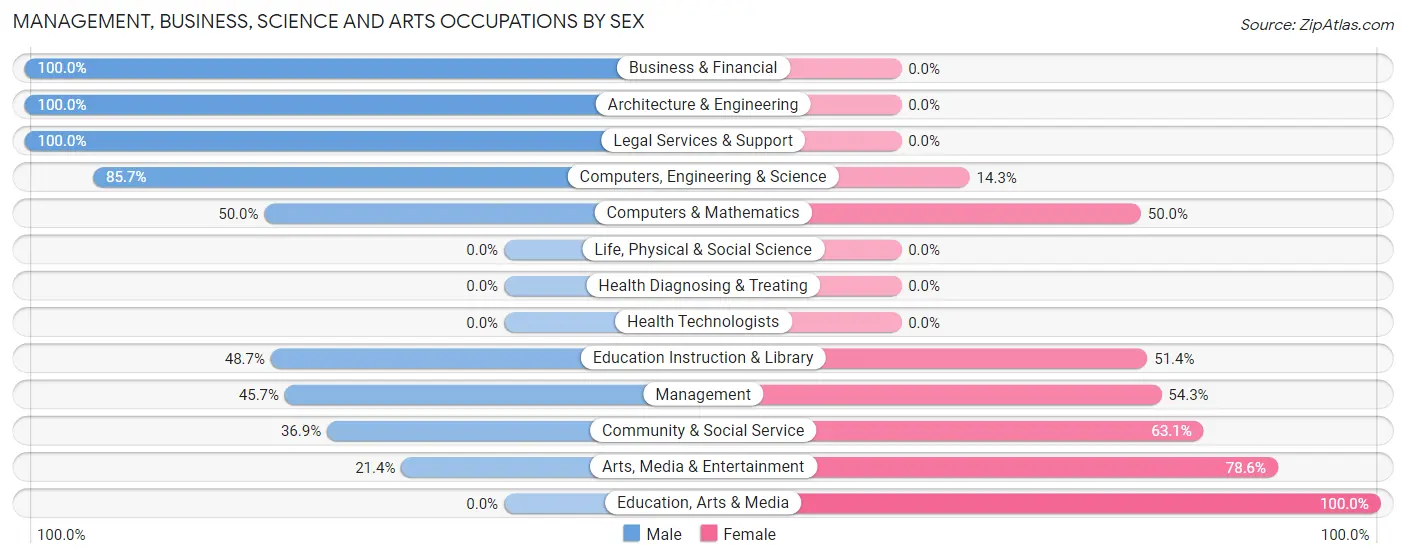
| Occupation | Male | Female |
| Management | 16 (45.7%) | 19 (54.3%) |
| Business & Financial | 6 (100.0%) | 0 (0.0%) |
| Computers, Engineering & Science | 18 (85.7%) | 3 (14.3%) |
| Computers & Mathematics | 3 (50.0%) | 3 (50.0%) |
| Architecture & Engineering | 15 (100.0%) | 0 (0.0%) |
| Life, Physical & Social Science | 0 (0.0%) | 0 (0.0%) |
| Community & Social Service | 24 (36.9%) | 41 (63.1%) |
| Education, Arts & Media | 0 (0.0%) | 11 (100.0%) |
| Legal Services & Support | 3 (100.0%) | 0 (0.0%) |
| Education Instruction & Library | 18 (48.6%) | 19 (51.3%) |
| Arts, Media & Entertainment | 3 (21.4%) | 11 (78.6%) |
| Health Diagnosing & Treating | 0 (0.0%) | 0 (0.0%) |
| Health Technologists | 0 (0.0%) | 0 (0.0%) |
| Total (Category) | 64 (50.4%) | 63 (49.6%) |
| Total (Overall) | 305 (59.3%) | 209 (40.7%) |
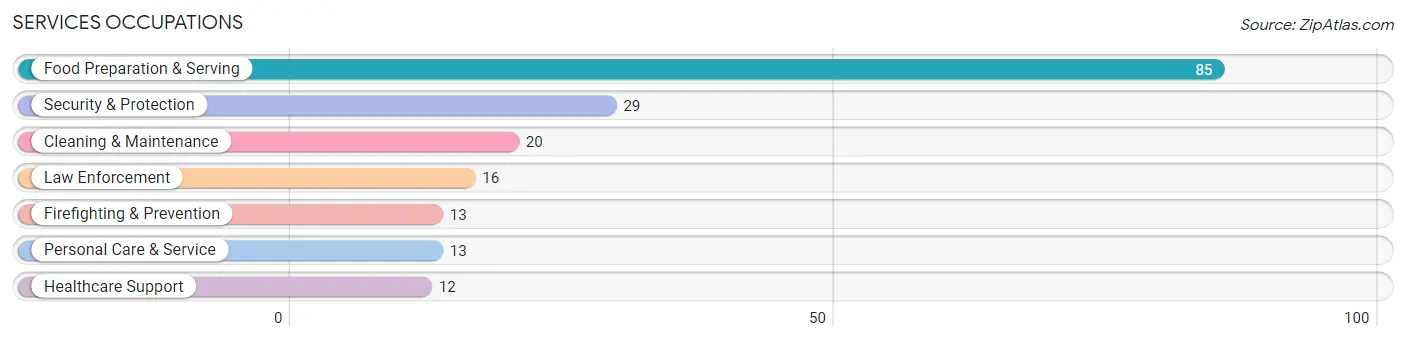
Services Occupations
The most common Services occupations in Hawley borough are Food Preparation & Serving (85 | 16.5%), Security & Protection (29 | 5.6%), Cleaning & Maintenance (20 | 3.9%), Law Enforcement (16 | 3.1%), and Firefighting & Prevention (13 | 2.5%).
Services Occupations by Sex
Within the Services occupations in Hawley borough, the most male-oriented occupations are Security & Protection (100.0%), Firefighting & Prevention (100.0%), and Law Enforcement (100.0%), while the most female-oriented occupations are Healthcare Support (100.0%), Personal Care & Service (84.6%), and Cleaning & Maintenance (50.0%).
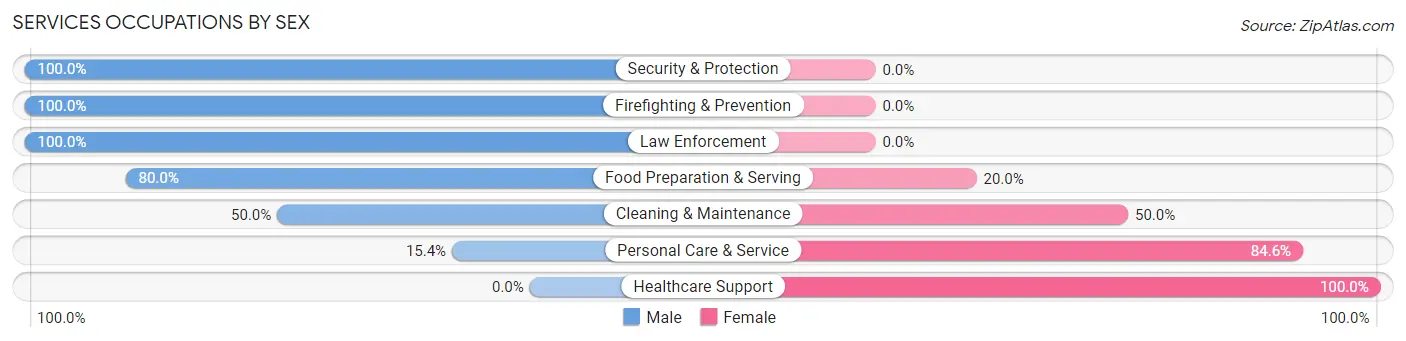
| Occupation | Male | Female |
| Healthcare Support | 0 (0.0%) | 12 (100.0%) |
| Security & Protection | 29 (100.0%) | 0 (0.0%) |
| Firefighting & Prevention | 13 (100.0%) | 0 (0.0%) |
| Law Enforcement | 16 (100.0%) | 0 (0.0%) |
| Food Preparation & Serving | 68 (80.0%) | 17 (20.0%) |
| Cleaning & Maintenance | 10 (50.0%) | 10 (50.0%) |
| Personal Care & Service | 2 (15.4%) | 11 (84.6%) |
| Total (Category) | 109 (68.5%) | 50 (31.5%) |
| Total (Overall) | 305 (59.3%) | 209 (40.7%) |
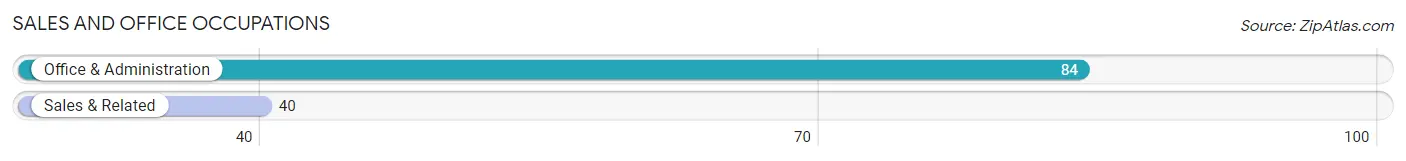
Sales and Office Occupations
The most common Sales and Office occupations in Hawley borough are Office & Administration (84 | 16.3%), and Sales & Related (40 | 7.8%).
Sales and Office Occupations by Sex
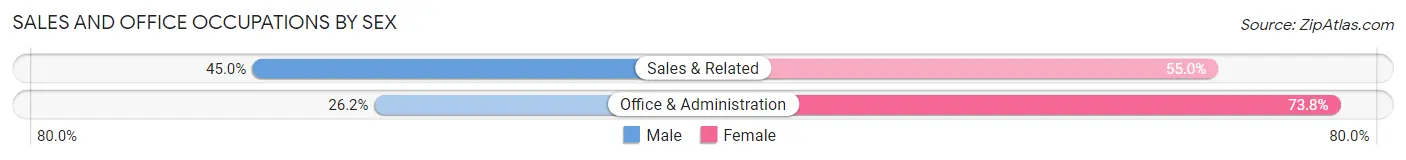
| Occupation | Male | Female |
| Sales & Related | 18 (45.0%) | 22 (55.0%) |
| Office & Administration | 22 (26.2%) | 62 (73.8%) |
| Total (Category) | 40 (32.3%) | 84 (67.7%) |
| Total (Overall) | 305 (59.3%) | 209 (40.7%) |
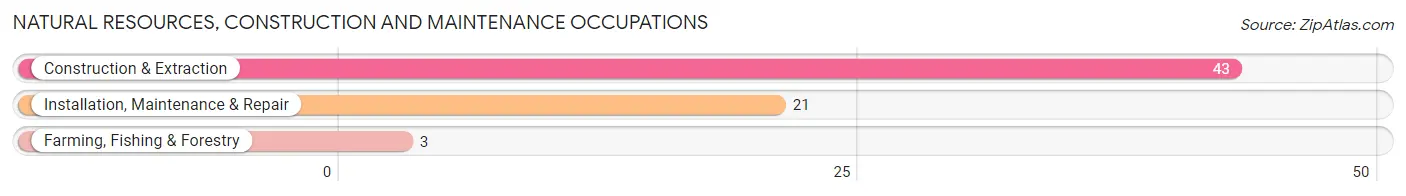
Natural Resources, Construction and Maintenance Occupations
The most common Natural Resources, Construction and Maintenance occupations in Hawley borough are Construction & Extraction (43 | 8.4%), Installation, Maintenance & Repair (21 | 4.1%), and Farming, Fishing & Forestry (3 | 0.6%).
Natural Resources, Construction and Maintenance Occupations by Sex
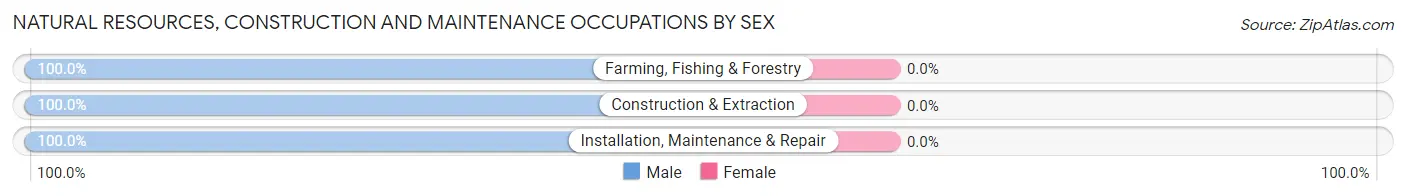
| Occupation | Male | Female |
| Farming, Fishing & Forestry | 3 (100.0%) | 0 (0.0%) |
| Construction & Extraction | 43 (100.0%) | 0 (0.0%) |
| Installation, Maintenance & Repair | 21 (100.0%) | 0 (0.0%) |
| Total (Category) | 67 (100.0%) | 0 (0.0%) |
| Total (Overall) | 305 (59.3%) | 209 (40.7%) |
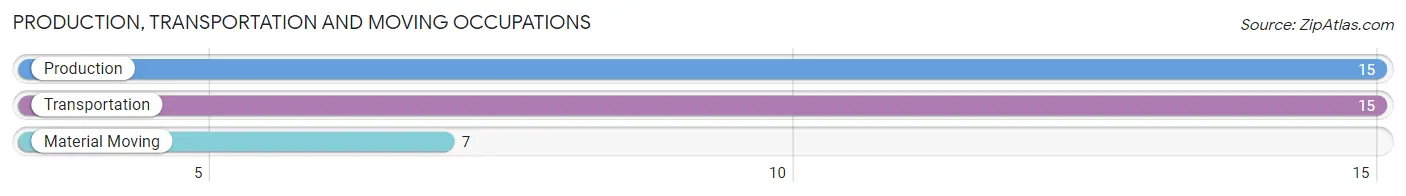
Production, Transportation and Moving Occupations
The most common Production, Transportation and Moving occupations in Hawley borough are Production (15 | 2.9%), Transportation (15 | 2.9%), and Material Moving (7 | 1.4%).
Production, Transportation and Moving Occupations by Sex
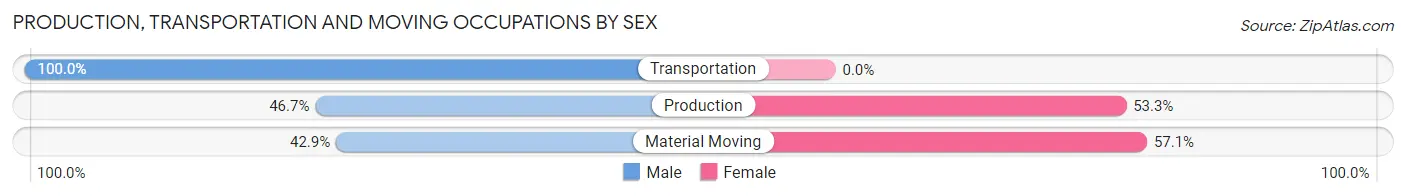
| Occupation | Male | Female |
| Production | 7 (46.7%) | 8 (53.3%) |
| Transportation | 15 (100.0%) | 0 (0.0%) |
| Material Moving | 3 (42.9%) | 4 (57.1%) |
| Total (Category) | 25 (67.6%) | 12 (32.4%) |
| Total (Overall) | 305 (59.3%) | 209 (40.7%) |
Employment Industries by Sex in Hawley borough
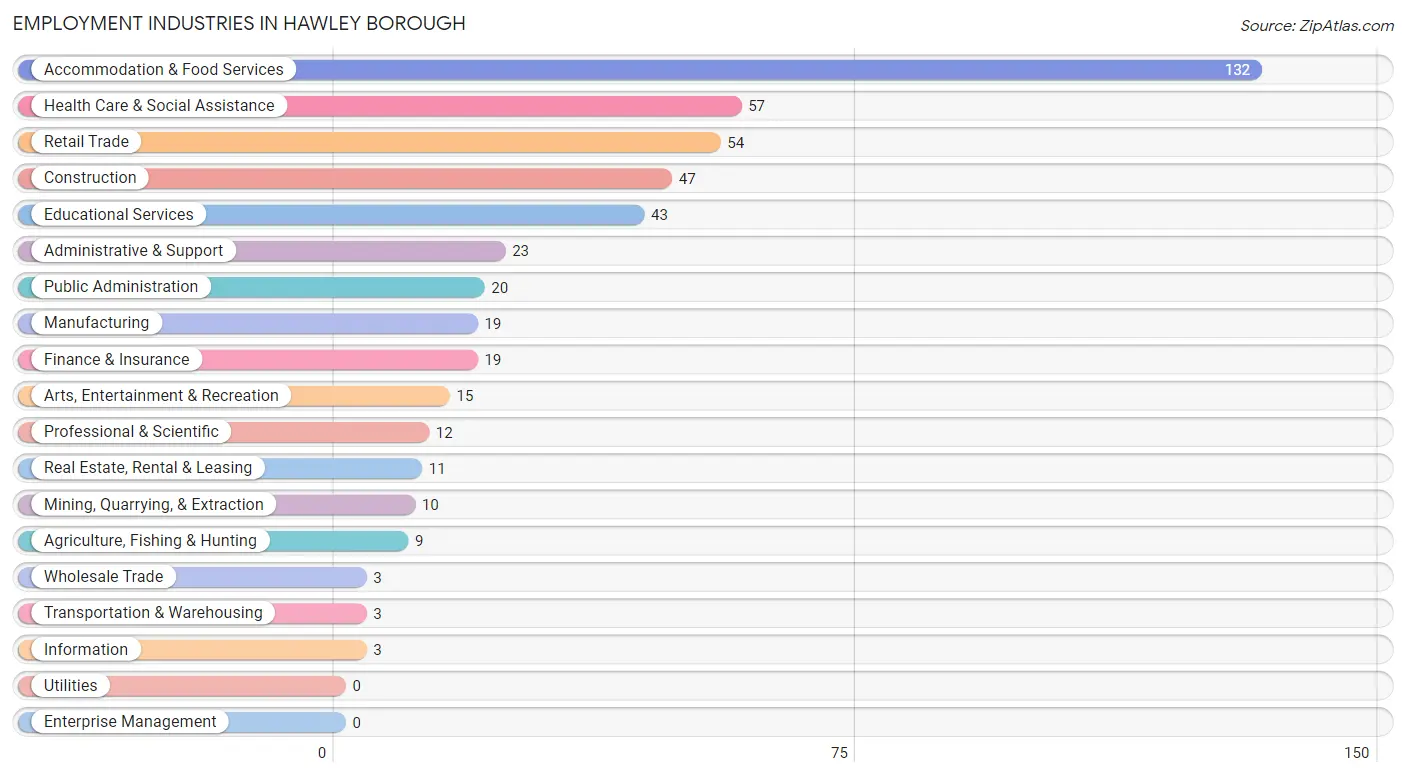
Employment Industries in Hawley borough
The major employment industries in Hawley borough include Accommodation & Food Services (132 | 25.7%), Health Care & Social Assistance (57 | 11.1%), Retail Trade (54 | 10.5%), Construction (47 | 9.1%), and Educational Services (43 | 8.4%).
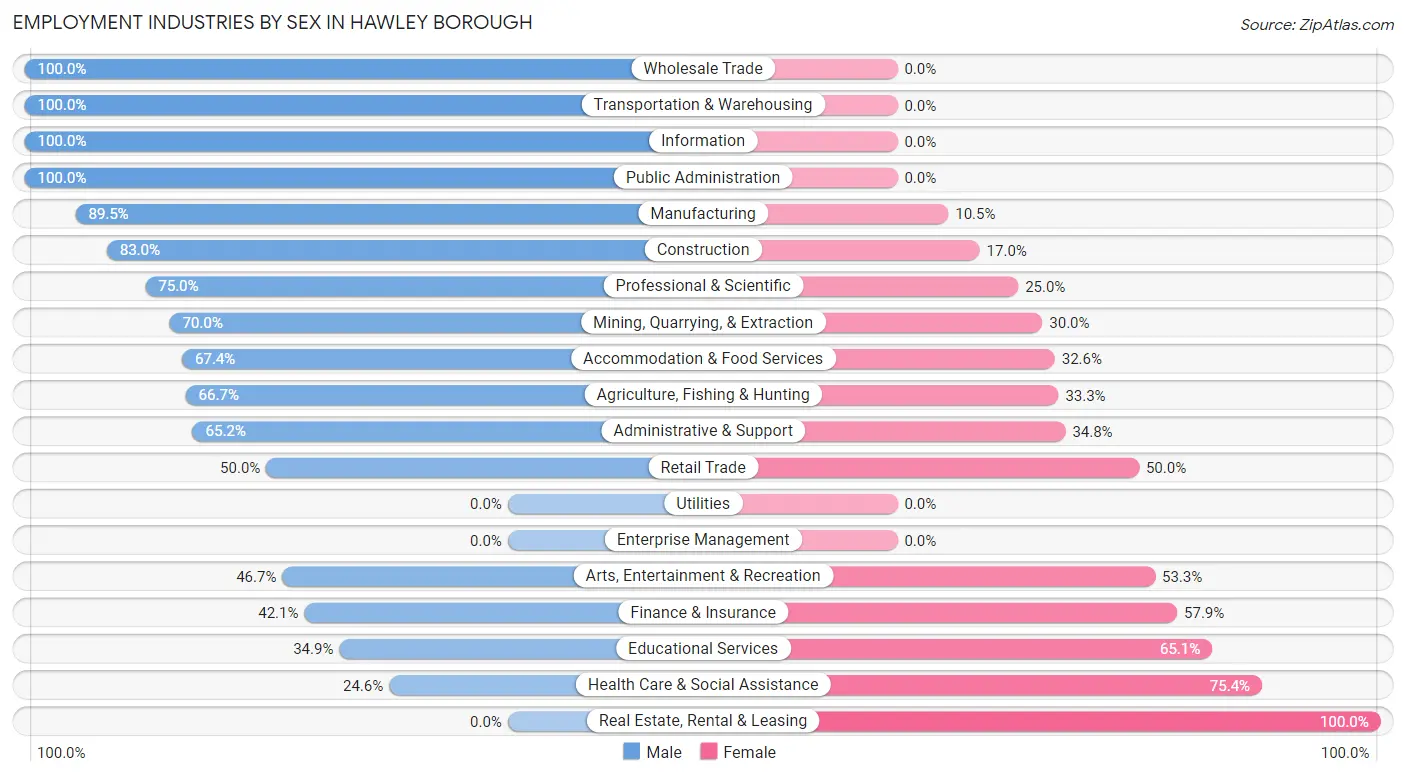
Employment Industries by Sex in Hawley borough
The Hawley borough industries that see more men than women are Wholesale Trade (100.0%), Transportation & Warehousing (100.0%), and Information (100.0%), whereas the industries that tend to have a higher number of women are Real Estate, Rental & Leasing (100.0%), Health Care & Social Assistance (75.4%), and Educational Services (65.1%).
| Industry | Male | Female |
| Agriculture, Fishing & Hunting | 6 (66.7%) | 3 (33.3%) |
| Mining, Quarrying, & Extraction | 7 (70.0%) | 3 (30.0%) |
| Construction | 39 (83.0%) | 8 (17.0%) |
| Manufacturing | 17 (89.5%) | 2 (10.5%) |
| Wholesale Trade | 3 (100.0%) | 0 (0.0%) |
| Retail Trade | 27 (50.0%) | 27 (50.0%) |
| Transportation & Warehousing | 3 (100.0%) | 0 (0.0%) |
| Utilities | 0 (0.0%) | 0 (0.0%) |
| Information | 3 (100.0%) | 0 (0.0%) |
| Finance & Insurance | 8 (42.1%) | 11 (57.9%) |
| Real Estate, Rental & Leasing | 0 (0.0%) | 11 (100.0%) |
| Professional & Scientific | 9 (75.0%) | 3 (25.0%) |
| Enterprise Management | 0 (0.0%) | 0 (0.0%) |
| Administrative & Support | 15 (65.2%) | 8 (34.8%) |
| Educational Services | 15 (34.9%) | 28 (65.1%) |
| Health Care & Social Assistance | 14 (24.6%) | 43 (75.4%) |
| Arts, Entertainment & Recreation | 7 (46.7%) | 8 (53.3%) |
| Accommodation & Food Services | 89 (67.4%) | 43 (32.6%) |
| Public Administration | 20 (100.0%) | 0 (0.0%) |
| Total | 305 (59.3%) | 209 (40.7%) |
Education in Hawley borough
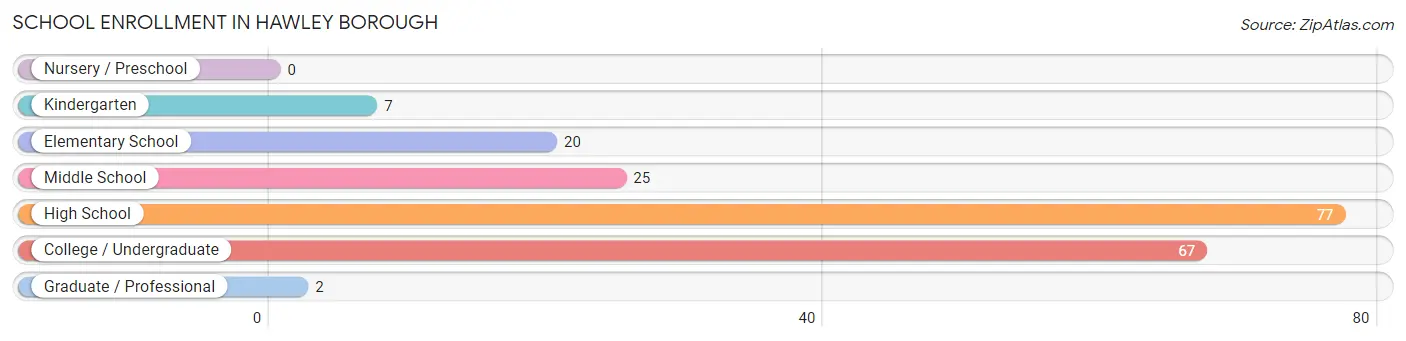
School Enrollment in Hawley borough
The most common levels of schooling among the 198 students in Hawley borough are high school (77 | 38.9%), college / undergraduate (67 | 33.8%), and middle school (25 | 12.6%).
| School Level | # Students | % Students |
| Nursery / Preschool | 0 | 0.0% |
| Kindergarten | 7 | 3.5% |
| Elementary School | 20 | 10.1% |
| Middle School | 25 | 12.6% |
| High School | 77 | 38.9% |
| College / Undergraduate | 67 | 33.8% |
| Graduate / Professional | 2 | 1.0% |
| Total | 198 | 100.0% |
School Enrollment by Age by Funding Source in Hawley borough
Out of a total of 198 students who are enrolled in schools in Hawley borough, 16 (8.1%) attend a private institution, while the remaining 182 (91.9%) are enrolled in public schools. The age group of 35 years and over has the highest likelihood of being enrolled in private schools, with 2 (100.0% in the age bracket) enrolled. Conversely, the age group of 5 to 9 year old has the lowest likelihood of being enrolled in a private school, with 27 (100.0% in the age bracket) attending a public institution.
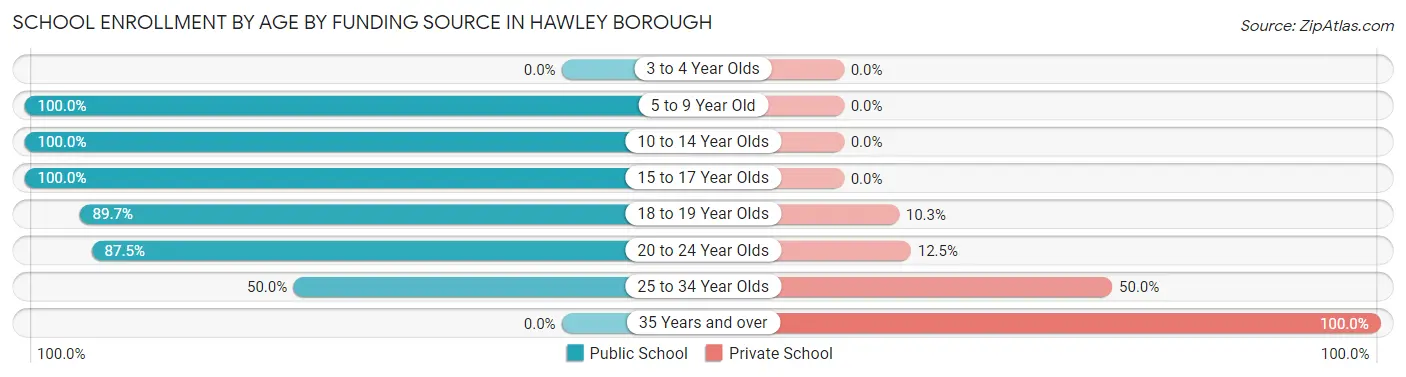
| Age Bracket | Public School | Private School |
| 3 to 4 Year Olds | 0 (0.0%) | 0 (0.0%) |
| 5 to 9 Year Old | 27 (100.0%) | 0 (0.0%) |
| 10 to 14 Year Olds | 25 (100.0%) | 0 (0.0%) |
| 15 to 17 Year Olds | 55 (100.0%) | 0 (0.0%) |
| 18 to 19 Year Olds | 35 (89.7%) | 4 (10.3%) |
| 20 to 24 Year Olds | 35 (87.5%) | 5 (12.5%) |
| 25 to 34 Year Olds | 5 (50.0%) | 5 (50.0%) |
| 35 Years and over | 0 (0.0%) | 2 (100.0%) |
| Total | 182 (91.9%) | 16 (8.1%) |
Educational Attainment by Field of Study in Hawley borough
Education (43 | 23.4%), science & technology (42 | 22.8%), business (41 | 22.3%), liberal arts & history (11 | 6.0%), and visual & performing arts (11 | 6.0%) are the most common fields of study among 184 individuals in Hawley borough who have obtained a bachelor's degree or higher.
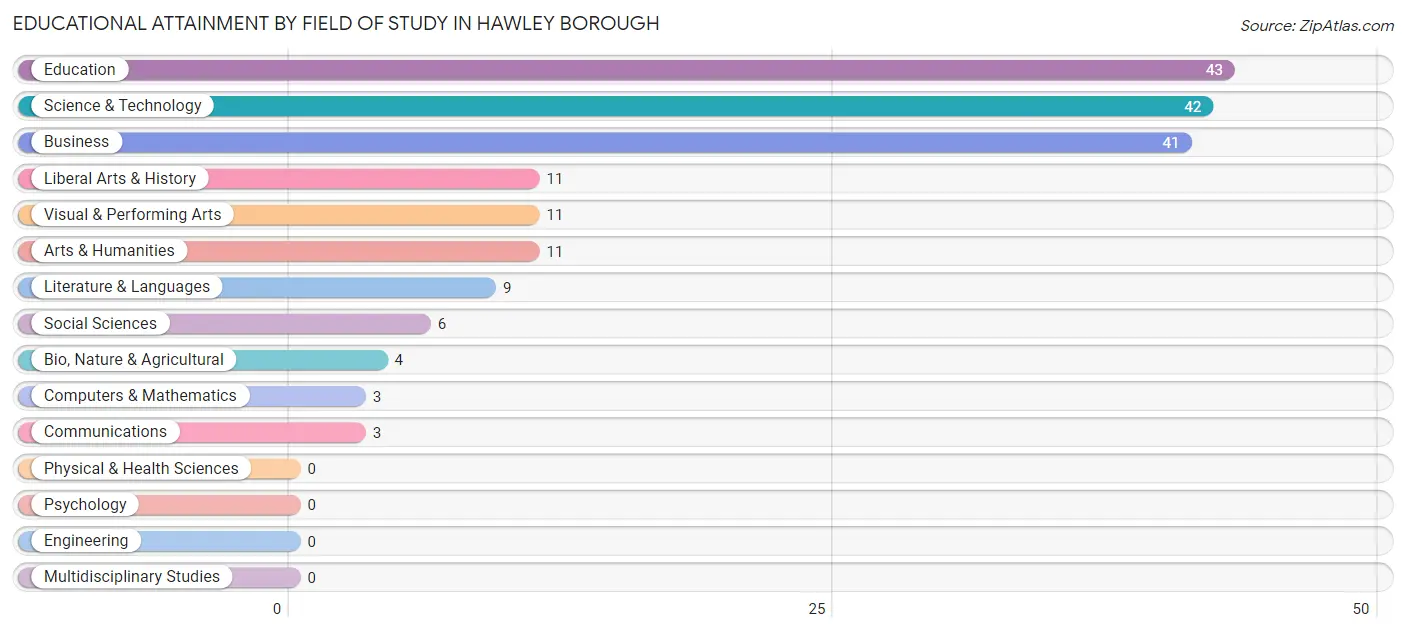
| Field of Study | # Graduates | % Graduates |
| Computers & Mathematics | 3 | 1.6% |
| Bio, Nature & Agricultural | 4 | 2.2% |
| Physical & Health Sciences | 0 | 0.0% |
| Psychology | 0 | 0.0% |
| Social Sciences | 6 | 3.3% |
| Engineering | 0 | 0.0% |
| Multidisciplinary Studies | 0 | 0.0% |
| Science & Technology | 42 | 22.8% |
| Business | 41 | 22.3% |
| Education | 43 | 23.4% |
| Literature & Languages | 9 | 4.9% |
| Liberal Arts & History | 11 | 6.0% |
| Visual & Performing Arts | 11 | 6.0% |
| Communications | 3 | 1.6% |
| Arts & Humanities | 11 | 6.0% |
| Total | 184 | 100.0% |
Transportation & Commute in Hawley borough
Vehicle Availability by Sex in Hawley borough
The most prevalent vehicle ownership categories in Hawley borough are males with 1 vehicle (129, accounting for 43.1%) and females with 1 vehicle (85, making up 61.7%).
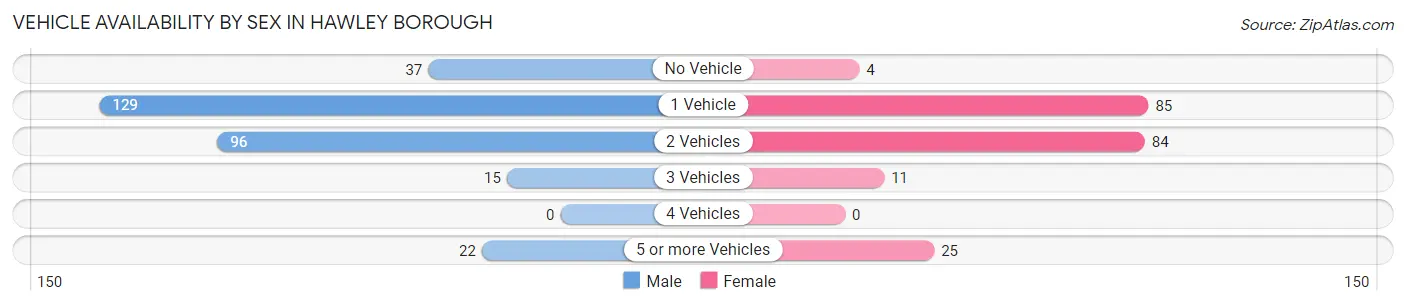
| Vehicles Available | Male | Female |
| No Vehicle | 37 (12.4%) | 4 (1.9%) |
| 1 Vehicle | 129 (43.1%) | 85 (40.7%) |
| 2 Vehicles | 96 (32.1%) | 84 (40.2%) |
| 3 Vehicles | 15 (5.0%) | 11 (5.3%) |
| 4 Vehicles | 0 (0.0%) | 0 (0.0%) |
| 5 or more Vehicles | 22 (7.4%) | 25 (12.0%) |
| Total | 299 (100.0%) | 209 (100.0%) |
Commute Time in Hawley borough
The most frequently occuring commute durations in Hawley borough are 5 to 9 minutes (158 commuters, 33.4%), 15 to 19 minutes (69 commuters, 14.6%), and 10 to 14 minutes (48 commuters, 10.2%).
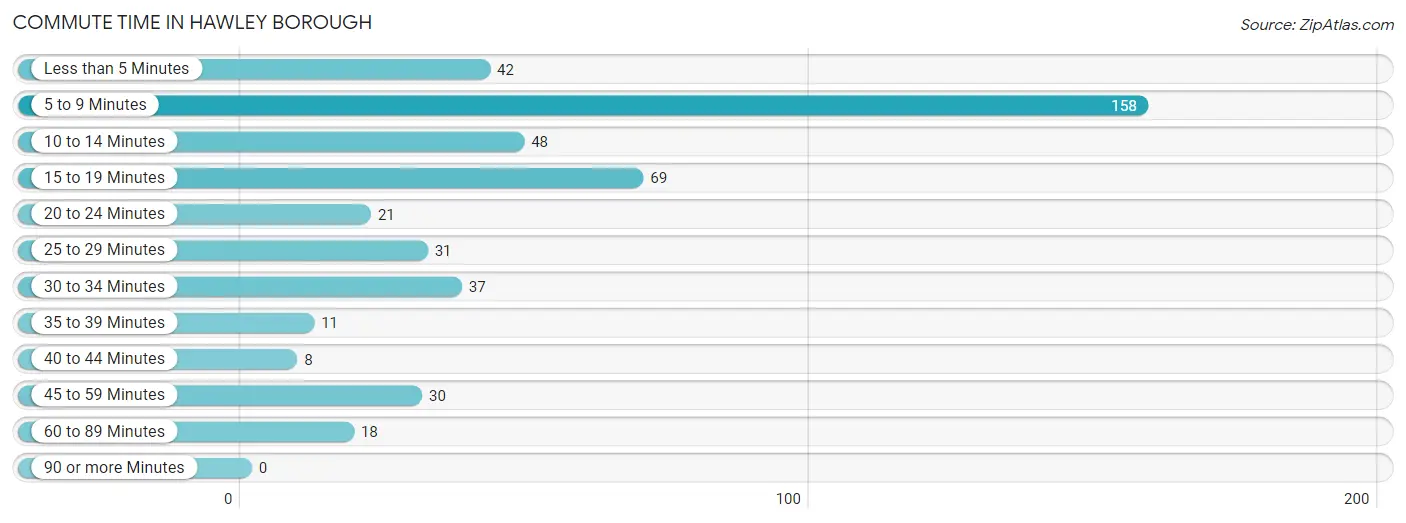
| Commute Time | # Commuters | % Commuters |
| Less than 5 Minutes | 42 | 8.9% |
| 5 to 9 Minutes | 158 | 33.4% |
| 10 to 14 Minutes | 48 | 10.2% |
| 15 to 19 Minutes | 69 | 14.6% |
| 20 to 24 Minutes | 21 | 4.4% |
| 25 to 29 Minutes | 31 | 6.6% |
| 30 to 34 Minutes | 37 | 7.8% |
| 35 to 39 Minutes | 11 | 2.3% |
| 40 to 44 Minutes | 8 | 1.7% |
| 45 to 59 Minutes | 30 | 6.3% |
| 60 to 89 Minutes | 18 | 3.8% |
| 90 or more Minutes | 0 | 0.0% |
Commute Time by Sex in Hawley borough
The most common commute times in Hawley borough are 5 to 9 minutes (106 commuters, 39.3%) for males and 5 to 9 minutes (52 commuters, 25.6%) for females.
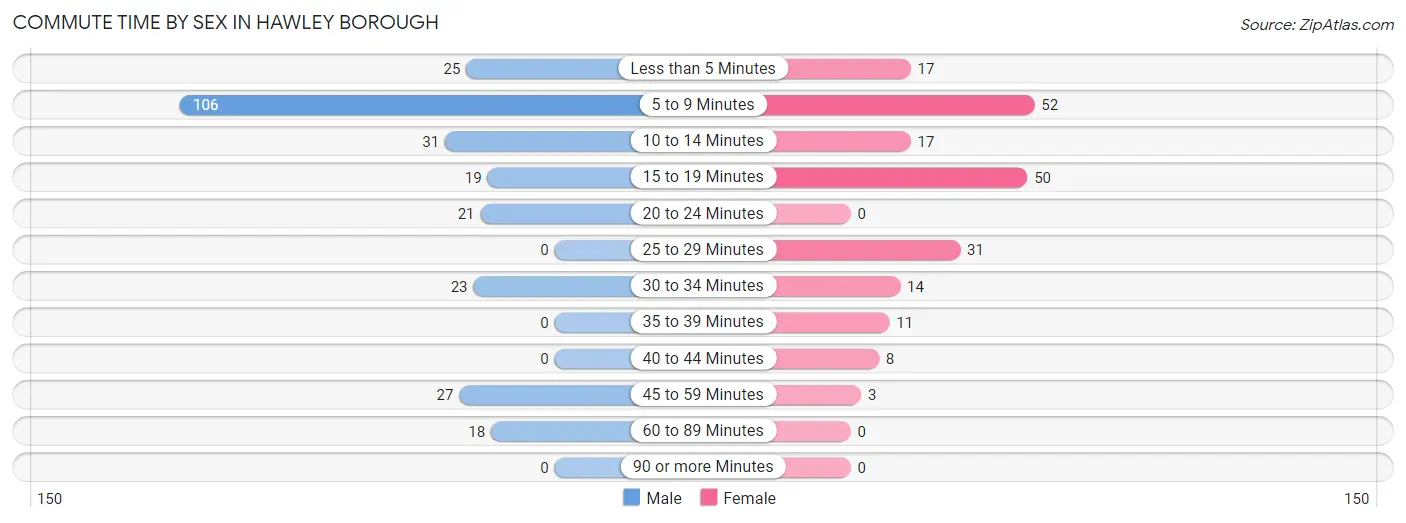
| Commute Time | Male | Female |
| Less than 5 Minutes | 25 (9.3%) | 17 (8.4%) |
| 5 to 9 Minutes | 106 (39.3%) | 52 (25.6%) |
| 10 to 14 Minutes | 31 (11.5%) | 17 (8.4%) |
| 15 to 19 Minutes | 19 (7.0%) | 50 (24.6%) |
| 20 to 24 Minutes | 21 (7.8%) | 0 (0.0%) |
| 25 to 29 Minutes | 0 (0.0%) | 31 (15.3%) |
| 30 to 34 Minutes | 23 (8.5%) | 14 (6.9%) |
| 35 to 39 Minutes | 0 (0.0%) | 11 (5.4%) |
| 40 to 44 Minutes | 0 (0.0%) | 8 (3.9%) |
| 45 to 59 Minutes | 27 (10.0%) | 3 (1.5%) |
| 60 to 89 Minutes | 18 (6.7%) | 0 (0.0%) |
| 90 or more Minutes | 0 (0.0%) | 0 (0.0%) |
Time of Departure to Work by Sex in Hawley borough
The most frequent times of departure to work in Hawley borough are 12:00 PM to 3:59 PM (42, 15.6%) for males and 7:30 AM to 7:59 AM (49, 24.1%) for females.
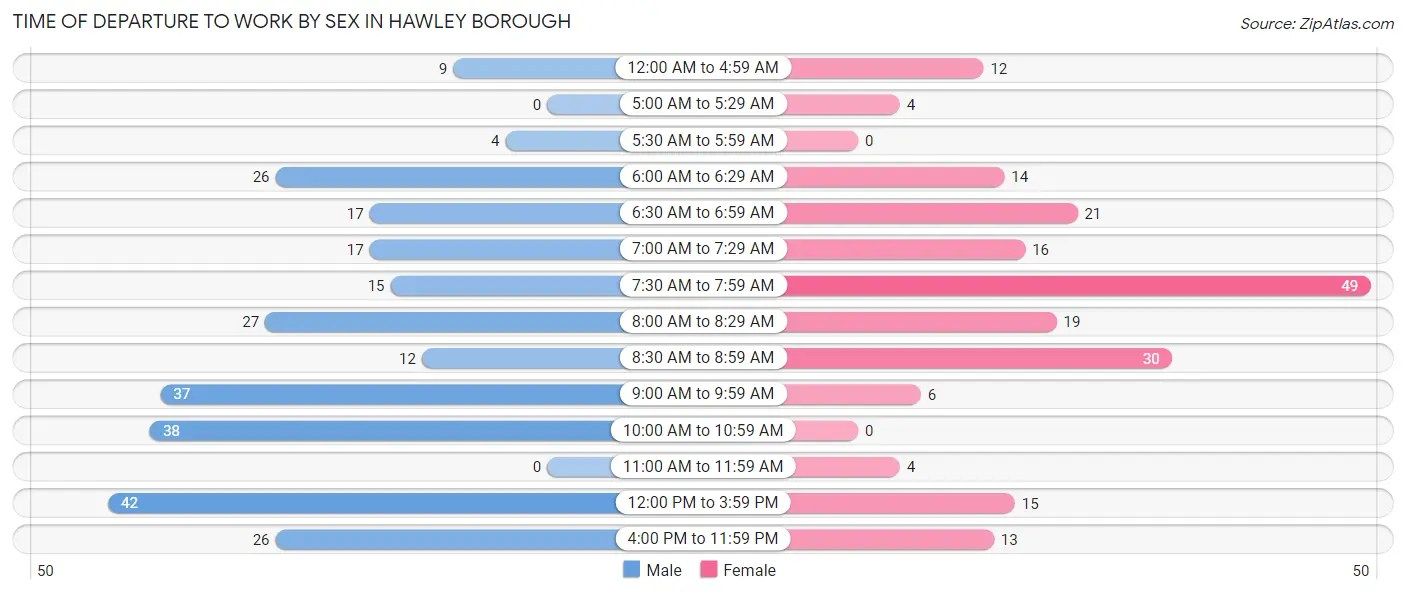
| Time of Departure | Male | Female |
| 12:00 AM to 4:59 AM | 9 (3.3%) | 12 (5.9%) |
| 5:00 AM to 5:29 AM | 0 (0.0%) | 4 (2.0%) |
| 5:30 AM to 5:59 AM | 4 (1.5%) | 0 (0.0%) |
| 6:00 AM to 6:29 AM | 26 (9.6%) | 14 (6.9%) |
| 6:30 AM to 6:59 AM | 17 (6.3%) | 21 (10.3%) |
| 7:00 AM to 7:29 AM | 17 (6.3%) | 16 (7.9%) |
| 7:30 AM to 7:59 AM | 15 (5.6%) | 49 (24.1%) |
| 8:00 AM to 8:29 AM | 27 (10.0%) | 19 (9.4%) |
| 8:30 AM to 8:59 AM | 12 (4.4%) | 30 (14.8%) |
| 9:00 AM to 9:59 AM | 37 (13.7%) | 6 (3.0%) |
| 10:00 AM to 10:59 AM | 38 (14.1%) | 0 (0.0%) |
| 11:00 AM to 11:59 AM | 0 (0.0%) | 4 (2.0%) |
| 12:00 PM to 3:59 PM | 42 (15.6%) | 15 (7.4%) |
| 4:00 PM to 11:59 PM | 26 (9.6%) | 13 (6.4%) |
| Total | 270 (100.0%) | 203 (100.0%) |
Housing Occupancy in Hawley borough
Occupancy by Ownership in Hawley borough
Of the total 532 dwellings in Hawley borough, owner-occupied units account for 258 (48.5%), while renter-occupied units make up 274 (51.5%).
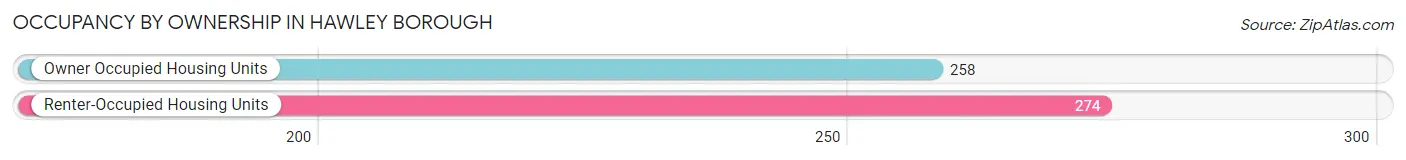
| Occupancy | # Housing Units | % Housing Units |
| Owner Occupied Housing Units | 258 | 48.5% |
| Renter-Occupied Housing Units | 274 | 51.5% |
| Total Occupied Housing Units | 532 | 100.0% |
Occupancy by Household Size in Hawley borough
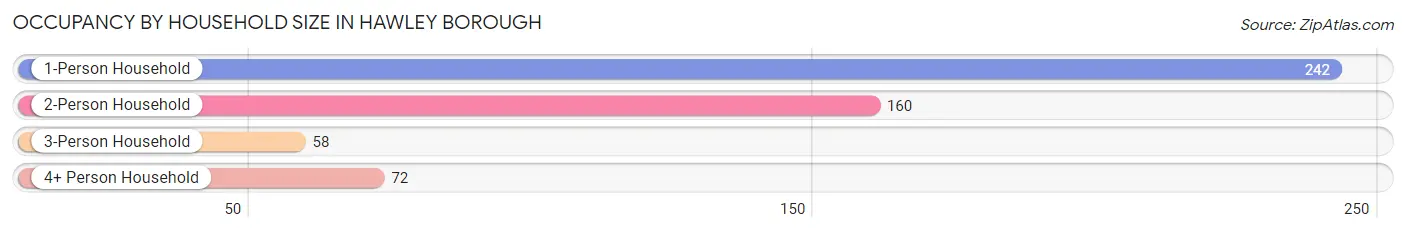
| Household Size | # Housing Units | % Housing Units |
| 1-Person Household | 242 | 45.5% |
| 2-Person Household | 160 | 30.1% |
| 3-Person Household | 58 | 10.9% |
| 4+ Person Household | 72 | 13.5% |
| Total Housing Units | 532 | 100.0% |
Occupancy by Ownership by Household Size in Hawley borough
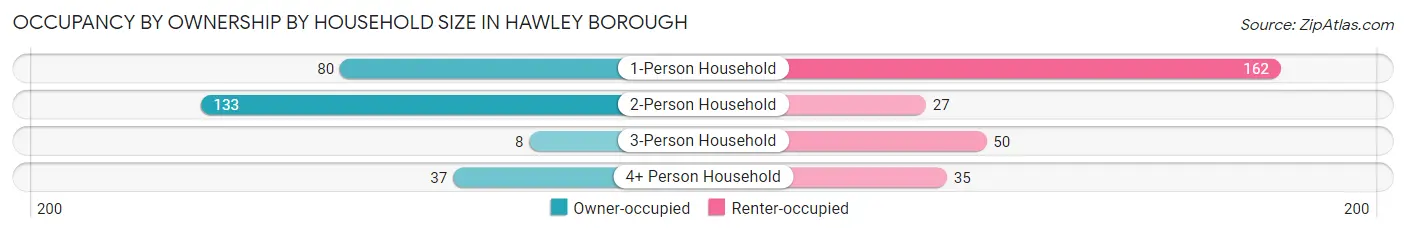
| Household Size | Owner-occupied | Renter-occupied |
| 1-Person Household | 80 (33.1%) | 162 (66.9%) |
| 2-Person Household | 133 (83.1%) | 27 (16.9%) |
| 3-Person Household | 8 (13.8%) | 50 (86.2%) |
| 4+ Person Household | 37 (51.4%) | 35 (48.6%) |
| Total Housing Units | 258 (48.5%) | 274 (51.5%) |
Occupancy by Educational Attainment in Hawley borough
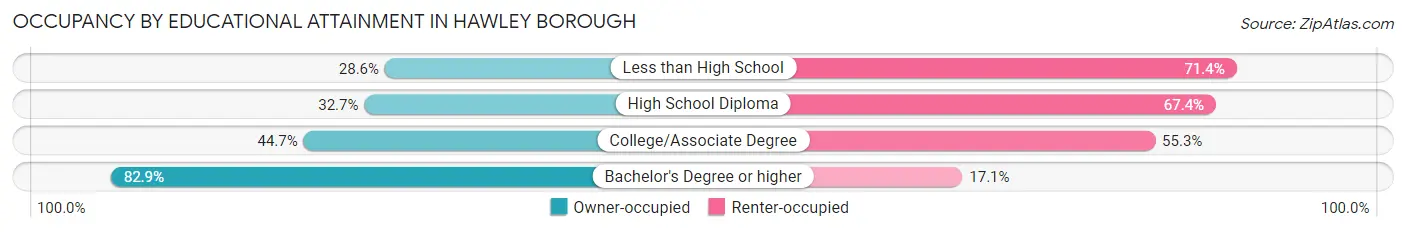
| Household Size | Owner-occupied | Renter-occupied |
| Less than High School | 12 (28.6%) | 30 (71.4%) |
| High School Diploma | 48 (32.7%) | 99 (67.3%) |
| College/Associate Degree | 101 (44.7%) | 125 (55.3%) |
| Bachelor's Degree or higher | 97 (82.9%) | 20 (17.1%) |
Occupancy by Age of Householder in Hawley borough
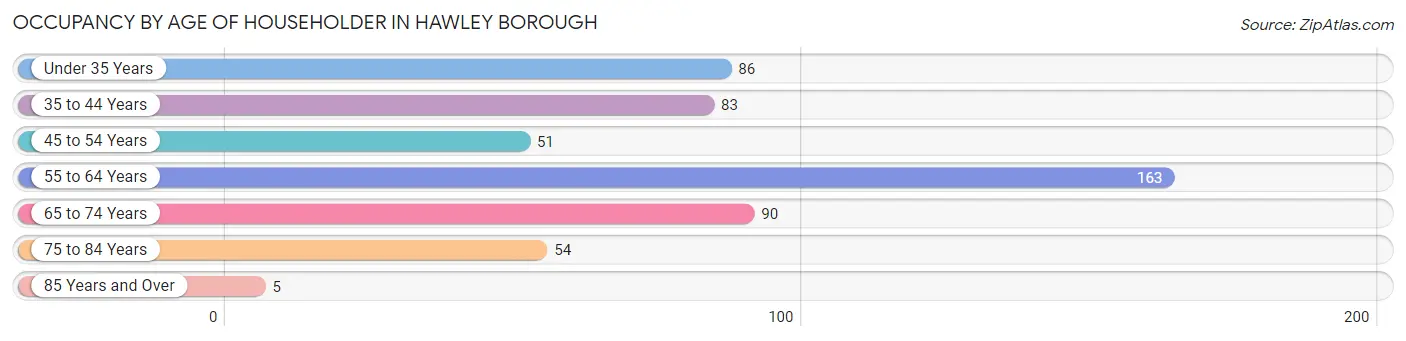
| Age Bracket | # Households | % Households |
| Under 35 Years | 86 | 16.2% |
| 35 to 44 Years | 83 | 15.6% |
| 45 to 54 Years | 51 | 9.6% |
| 55 to 64 Years | 163 | 30.6% |
| 65 to 74 Years | 90 | 16.9% |
| 75 to 84 Years | 54 | 10.2% |
| 85 Years and Over | 5 | 0.9% |
| Total | 532 | 100.0% |
Housing Finances in Hawley borough
Median Income by Occupancy in Hawley borough
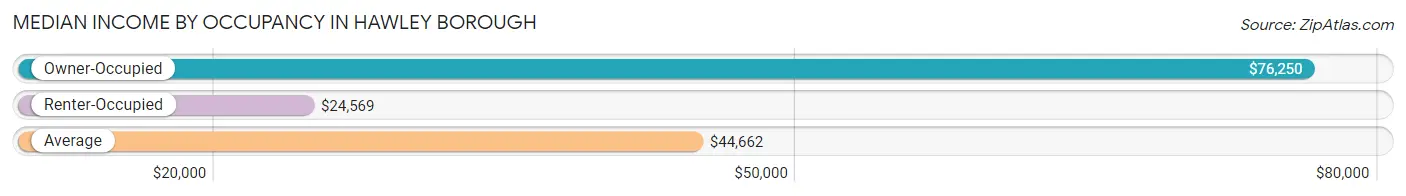
| Occupancy Type | # Households | Median Income |
| Owner-Occupied | 258 (48.5%) | $76,250 |
| Renter-Occupied | 274 (51.5%) | $24,569 |
| Average | 532 (100.0%) | $44,662 |
Occupancy by Householder Income Bracket in Hawley borough
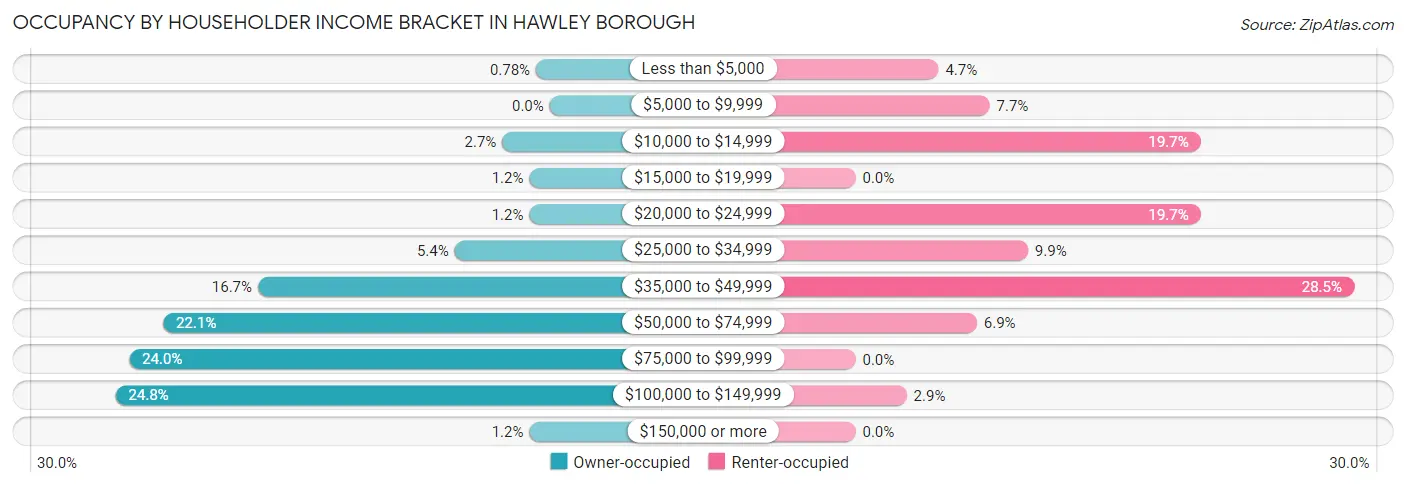
| Income Bracket | Owner-occupied | Renter-occupied |
| Less than $5,000 | 2 (0.8%) | 13 (4.7%) |
| $5,000 to $9,999 | 0 (0.0%) | 21 (7.7%) |
| $10,000 to $14,999 | 7 (2.7%) | 54 (19.7%) |
| $15,000 to $19,999 | 3 (1.2%) | 0 (0.0%) |
| $20,000 to $24,999 | 3 (1.2%) | 54 (19.7%) |
| $25,000 to $34,999 | 14 (5.4%) | 27 (9.9%) |
| $35,000 to $49,999 | 43 (16.7%) | 78 (28.5%) |
| $50,000 to $74,999 | 57 (22.1%) | 19 (6.9%) |
| $75,000 to $99,999 | 62 (24.0%) | 0 (0.0%) |
| $100,000 to $149,999 | 64 (24.8%) | 8 (2.9%) |
| $150,000 or more | 3 (1.2%) | 0 (0.0%) |
| Total | 258 (100.0%) | 274 (100.0%) |
Monthly Housing Cost Tiers in Hawley borough
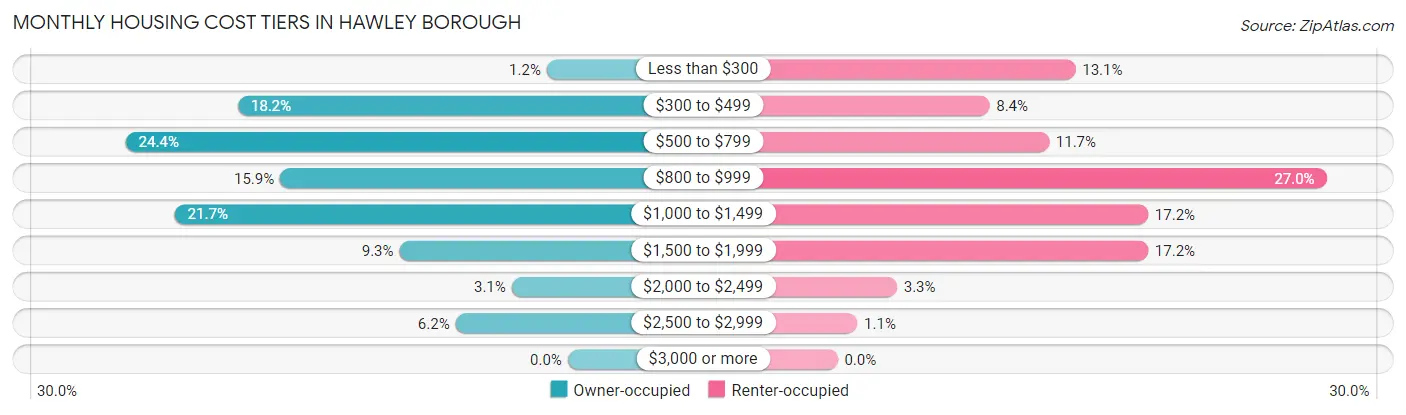
| Monthly Cost | Owner-occupied | Renter-occupied |
| Less than $300 | 3 (1.2%) | 36 (13.1%) |
| $300 to $499 | 47 (18.2%) | 23 (8.4%) |
| $500 to $799 | 63 (24.4%) | 32 (11.7%) |
| $800 to $999 | 41 (15.9%) | 74 (27.0%) |
| $1,000 to $1,499 | 56 (21.7%) | 47 (17.2%) |
| $1,500 to $1,999 | 24 (9.3%) | 47 (17.2%) |
| $2,000 to $2,499 | 8 (3.1%) | 9 (3.3%) |
| $2,500 to $2,999 | 16 (6.2%) | 3 (1.1%) |
| $3,000 or more | 0 (0.0%) | 0 (0.0%) |
| Total | 258 (100.0%) | 274 (100.0%) |
Physical Housing Characteristics in Hawley borough
Housing Structures in Hawley borough
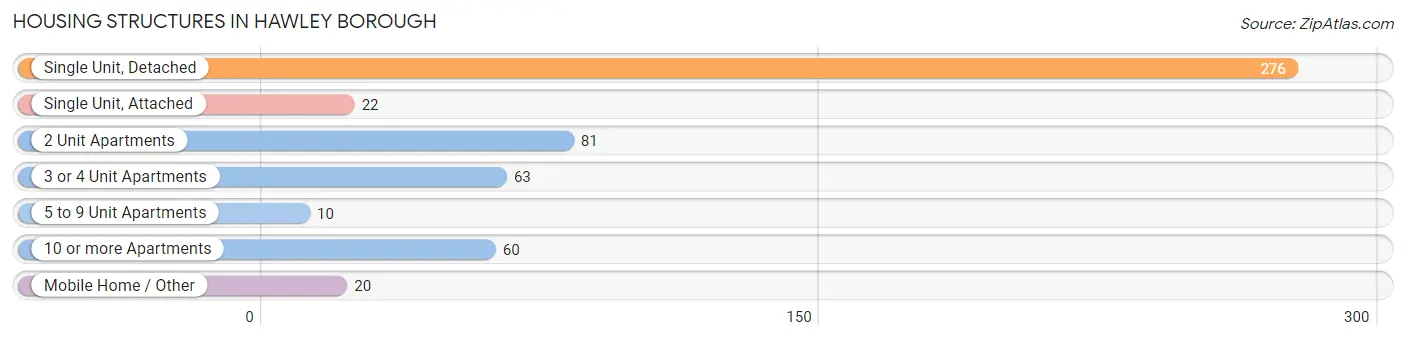
| Structure Type | # Housing Units | % Housing Units |
| Single Unit, Detached | 276 | 51.9% |
| Single Unit, Attached | 22 | 4.1% |
| 2 Unit Apartments | 81 | 15.2% |
| 3 or 4 Unit Apartments | 63 | 11.8% |
| 5 to 9 Unit Apartments | 10 | 1.9% |
| 10 or more Apartments | 60 | 11.3% |
| Mobile Home / Other | 20 | 3.8% |
| Total | 532 | 100.0% |
Housing Structures by Occupancy in Hawley borough
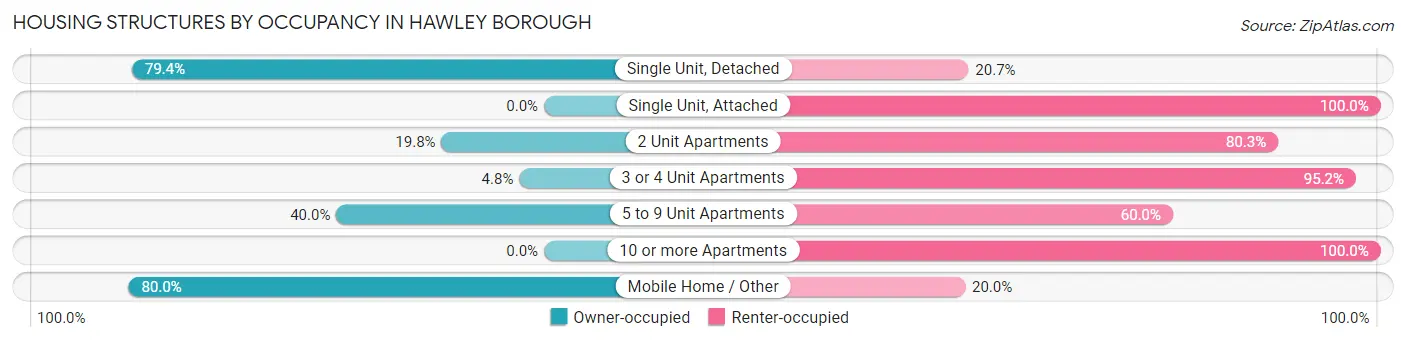
| Structure Type | Owner-occupied | Renter-occupied |
| Single Unit, Detached | 219 (79.3%) | 57 (20.6%) |
| Single Unit, Attached | 0 (0.0%) | 22 (100.0%) |
| 2 Unit Apartments | 16 (19.8%) | 65 (80.2%) |
| 3 or 4 Unit Apartments | 3 (4.8%) | 60 (95.2%) |
| 5 to 9 Unit Apartments | 4 (40.0%) | 6 (60.0%) |
| 10 or more Apartments | 0 (0.0%) | 60 (100.0%) |
| Mobile Home / Other | 16 (80.0%) | 4 (20.0%) |
| Total | 258 (48.5%) | 274 (51.5%) |
Housing Structures by Number of Rooms in Hawley borough
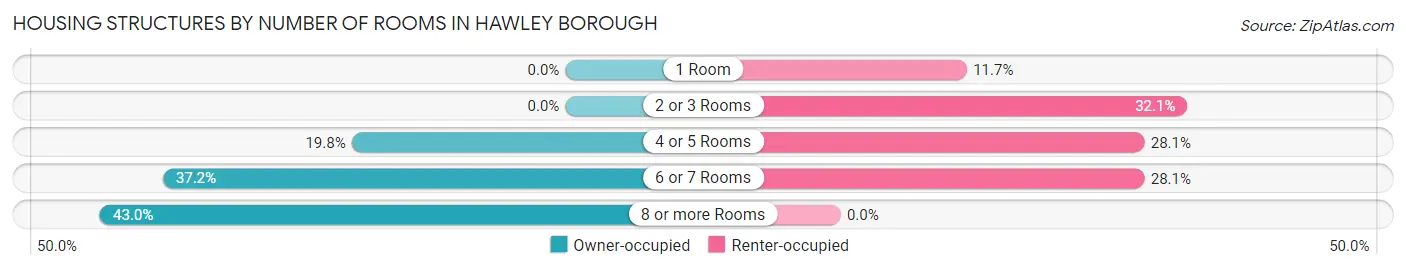
| Number of Rooms | Owner-occupied | Renter-occupied |
| 1 Room | 0 (0.0%) | 32 (11.7%) |
| 2 or 3 Rooms | 0 (0.0%) | 88 (32.1%) |
| 4 or 5 Rooms | 51 (19.8%) | 77 (28.1%) |
| 6 or 7 Rooms | 96 (37.2%) | 77 (28.1%) |
| 8 or more Rooms | 111 (43.0%) | 0 (0.0%) |
| Total | 258 (100.0%) | 274 (100.0%) |
Housing Structure by Heating Type in Hawley borough
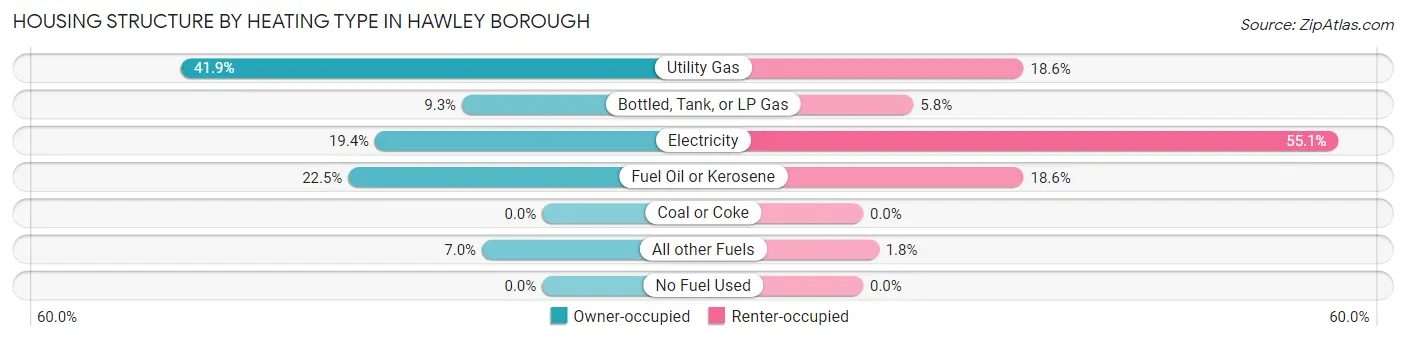
| Heating Type | Owner-occupied | Renter-occupied |
| Utility Gas | 108 (41.9%) | 51 (18.6%) |
| Bottled, Tank, or LP Gas | 24 (9.3%) | 16 (5.8%) |
| Electricity | 50 (19.4%) | 151 (55.1%) |
| Fuel Oil or Kerosene | 58 (22.5%) | 51 (18.6%) |
| Coal or Coke | 0 (0.0%) | 0 (0.0%) |
| All other Fuels | 18 (7.0%) | 5 (1.8%) |
| No Fuel Used | 0 (0.0%) | 0 (0.0%) |
| Total | 258 (100.0%) | 274 (100.0%) |
Household Vehicle Usage in Hawley borough
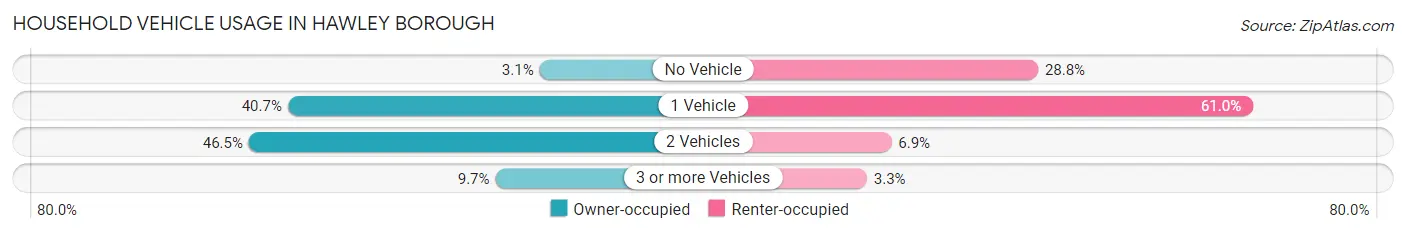
| Vehicles per Household | Owner-occupied | Renter-occupied |
| No Vehicle | 8 (3.1%) | 79 (28.8%) |
| 1 Vehicle | 105 (40.7%) | 167 (61.0%) |
| 2 Vehicles | 120 (46.5%) | 19 (6.9%) |
| 3 or more Vehicles | 25 (9.7%) | 9 (3.3%) |
| Total | 258 (100.0%) | 274 (100.0%) |
Real Estate & Mortgages in Hawley borough
Real Estate and Mortgage Overview in Hawley borough
| Characteristic | Without Mortgage | With Mortgage |
| Housing Units | 130 | 128 |
| Median Property Value | $173,800 | $136,100 |
| Median Household Income | $64,464 | $0 |
| Monthly Housing Costs | $579 | $0 |
| Real Estate Taxes | $2,355 | $8 |
Property Value by Mortgage Status in Hawley borough
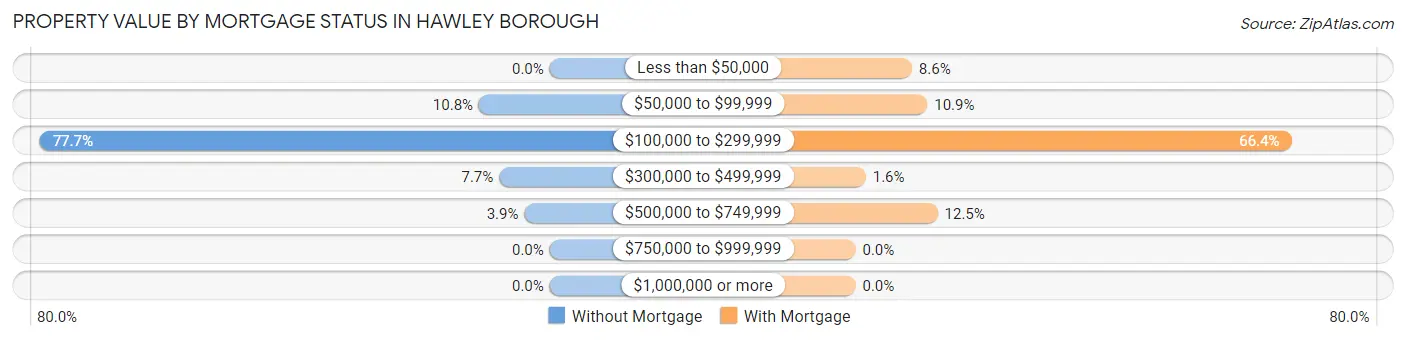
| Property Value | Without Mortgage | With Mortgage |
| Less than $50,000 | 0 (0.0%) | 11 (8.6%) |
| $50,000 to $99,999 | 14 (10.8%) | 14 (10.9%) |
| $100,000 to $299,999 | 101 (77.7%) | 85 (66.4%) |
| $300,000 to $499,999 | 10 (7.7%) | 2 (1.6%) |
| $500,000 to $749,999 | 5 (3.8%) | 16 (12.5%) |
| $750,000 to $999,999 | 0 (0.0%) | 0 (0.0%) |
| $1,000,000 or more | 0 (0.0%) | 0 (0.0%) |
| Total | 130 (100.0%) | 128 (100.0%) |
Household Income by Mortgage Status in Hawley borough
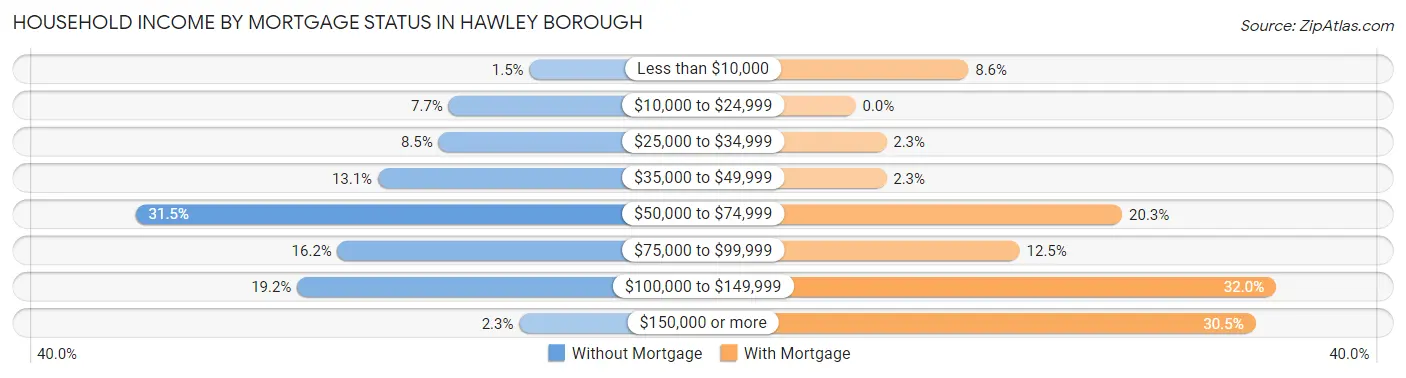
| Household Income | Without Mortgage | With Mortgage |
| Less than $10,000 | 2 (1.5%) | 11 (8.6%) |
| $10,000 to $24,999 | 10 (7.7%) | 0 (0.0%) |
| $25,000 to $34,999 | 11 (8.5%) | 3 (2.3%) |
| $35,000 to $49,999 | 17 (13.1%) | 3 (2.3%) |
| $50,000 to $74,999 | 41 (31.5%) | 26 (20.3%) |
| $75,000 to $99,999 | 21 (16.2%) | 16 (12.5%) |
| $100,000 to $149,999 | 25 (19.2%) | 41 (32.0%) |
| $150,000 or more | 3 (2.3%) | 39 (30.5%) |
| Total | 130 (100.0%) | 128 (100.0%) |
Property Value to Household Income Ratio in Hawley borough
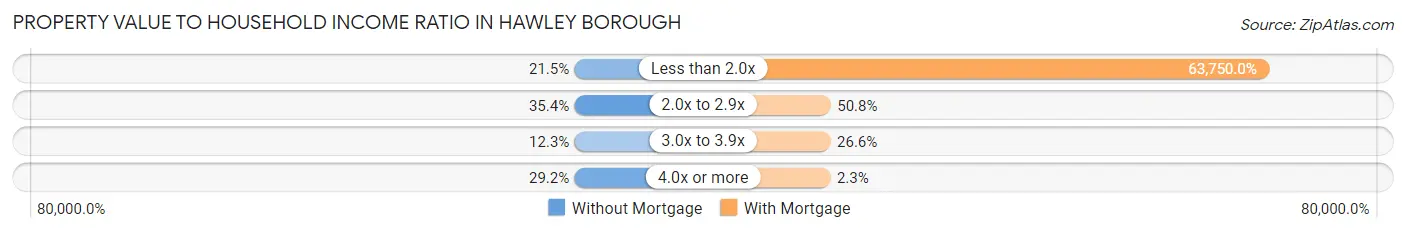
| Value-to-Income Ratio | Without Mortgage | With Mortgage |
| Less than 2.0x | 28 (21.5%) | 81,600 (63,750.0%) |
| 2.0x to 2.9x | 46 (35.4%) | 65 (50.8%) |
| 3.0x to 3.9x | 16 (12.3%) | 34 (26.6%) |
| 4.0x or more | 38 (29.2%) | 3 (2.3%) |
| Total | 130 (100.0%) | 128 (100.0%) |
Real Estate Taxes by Mortgage Status in Hawley borough
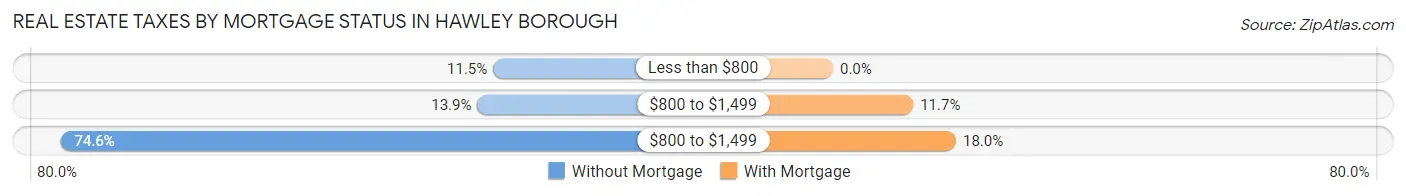
| Property Taxes | Without Mortgage | With Mortgage |
| Less than $800 | 15 (11.5%) | 0 (0.0%) |
| $800 to $1,499 | 18 (13.9%) | 15 (11.7%) |
| $800 to $1,499 | 97 (74.6%) | 23 (18.0%) |
| Total | 130 (100.0%) | 128 (100.0%) |
Health & Disability in Hawley borough
Health Insurance Coverage by Age in Hawley borough
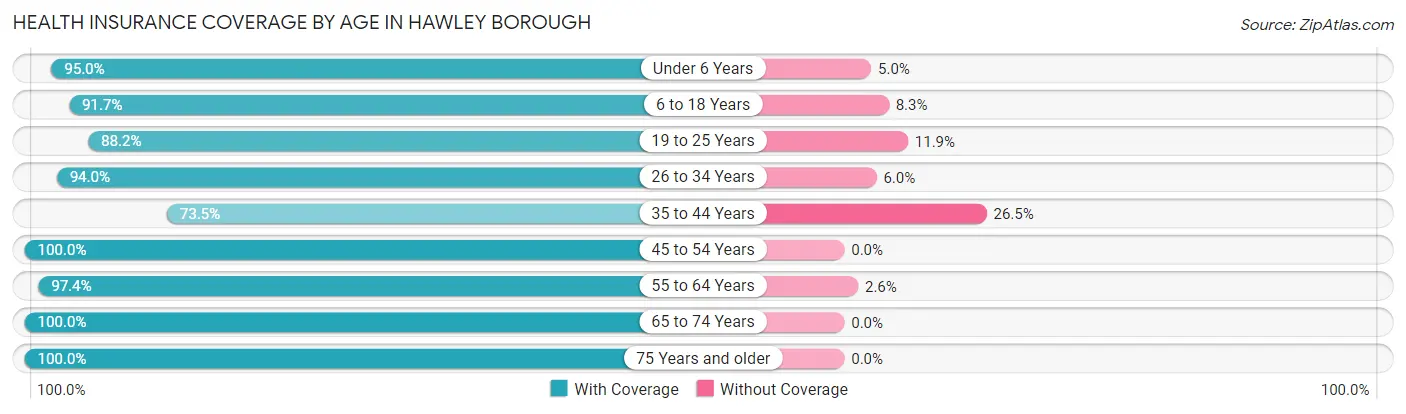
| Age Bracket | With Coverage | Without Coverage |
| Under 6 Years | 19 (95.0%) | 1 (5.0%) |
| 6 to 18 Years | 133 (91.7%) | 12 (8.3%) |
| 19 to 25 Years | 119 (88.1%) | 16 (11.8%) |
| 26 to 34 Years | 94 (94.0%) | 6 (6.0%) |
| 35 to 44 Years | 108 (73.5%) | 39 (26.5%) |
| 45 to 54 Years | 88 (100.0%) | 0 (0.0%) |
| 55 to 64 Years | 228 (97.4%) | 6 (2.6%) |
| 65 to 74 Years | 161 (100.0%) | 0 (0.0%) |
| 75 Years and older | 80 (100.0%) | 0 (0.0%) |
| Total | 1,030 (92.8%) | 80 (7.2%) |
Health Insurance Coverage by Citizenship Status in Hawley borough
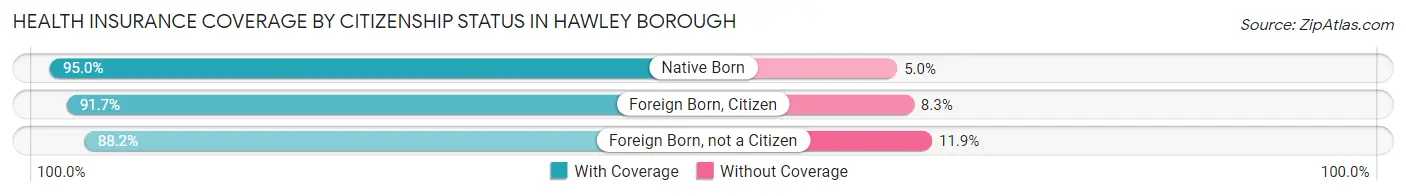
| Citizenship Status | With Coverage | Without Coverage |
| Native Born | 19 (95.0%) | 1 (5.0%) |
| Foreign Born, Citizen | 133 (91.7%) | 12 (8.3%) |
| Foreign Born, not a Citizen | 119 (88.1%) | 16 (11.8%) |
Health Insurance Coverage by Household Income in Hawley borough
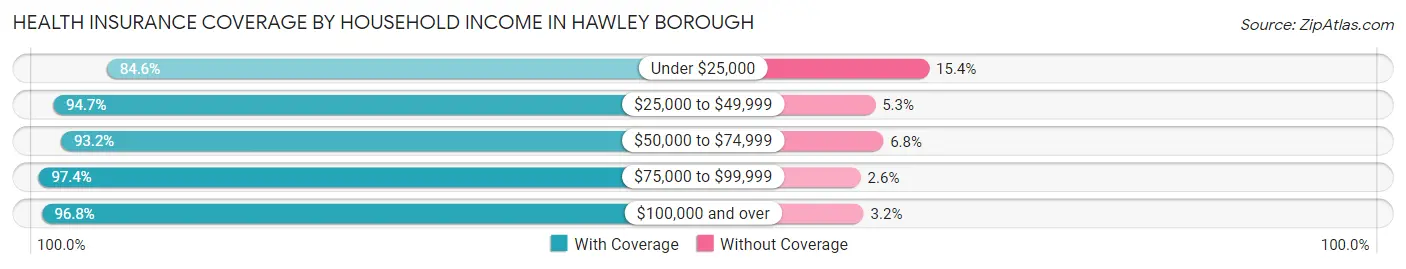
| Household Income | With Coverage | Without Coverage |
| Under $25,000 | 203 (84.6%) | 37 (15.4%) |
| $25,000 to $49,999 | 320 (94.7%) | 18 (5.3%) |
| $50,000 to $74,999 | 164 (93.2%) | 12 (6.8%) |
| $75,000 to $99,999 | 150 (97.4%) | 4 (2.6%) |
| $100,000 and over | 184 (96.8%) | 6 (3.2%) |
Public vs Private Health Insurance Coverage by Age in Hawley borough
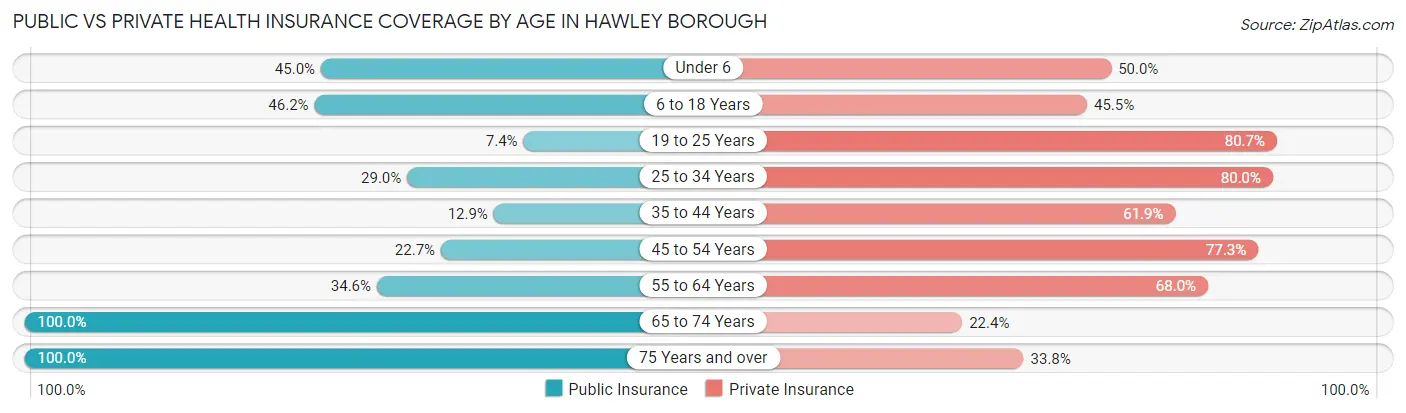
| Age Bracket | Public Insurance | Private Insurance |
| Under 6 | 9 (45.0%) | 10 (50.0%) |
| 6 to 18 Years | 67 (46.2%) | 66 (45.5%) |
| 19 to 25 Years | 10 (7.4%) | 109 (80.7%) |
| 25 to 34 Years | 29 (29.0%) | 80 (80.0%) |
| 35 to 44 Years | 19 (12.9%) | 91 (61.9%) |
| 45 to 54 Years | 20 (22.7%) | 68 (77.3%) |
| 55 to 64 Years | 81 (34.6%) | 159 (67.9%) |
| 65 to 74 Years | 161 (100.0%) | 36 (22.4%) |
| 75 Years and over | 80 (100.0%) | 27 (33.8%) |
| Total | 476 (42.9%) | 646 (58.2%) |
Disability Status by Sex by Age in Hawley borough
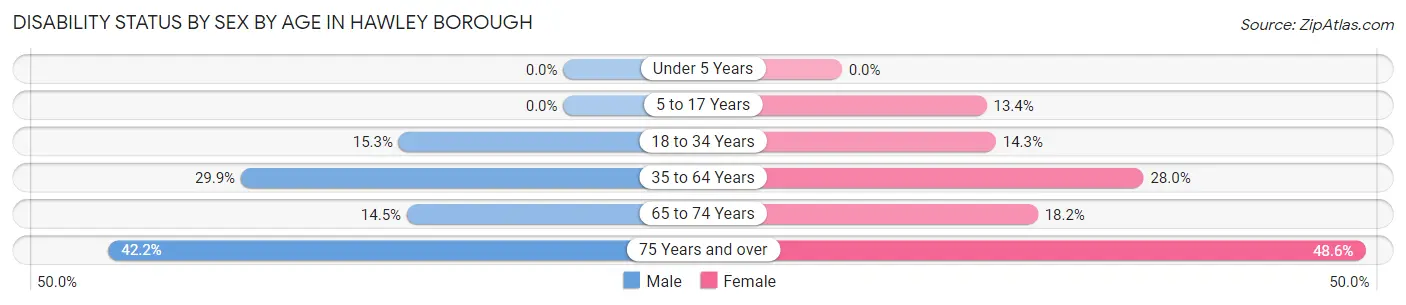
| Age Bracket | Male | Female |
| Under 5 Years | 0 (0.0%) | 0 (0.0%) |
| 5 to 17 Years | 0 (0.0%) | 9 (13.4%) |
| 18 to 34 Years | 20 (15.3%) | 19 (14.3%) |
| 35 to 64 Years | 73 (29.9%) | 63 (28.0%) |
| 65 to 74 Years | 9 (14.5%) | 18 (18.2%) |
| 75 Years and over | 19 (42.2%) | 17 (48.6%) |
Disability Class by Sex by Age in Hawley borough
Disability Class: Hearing Difficulty
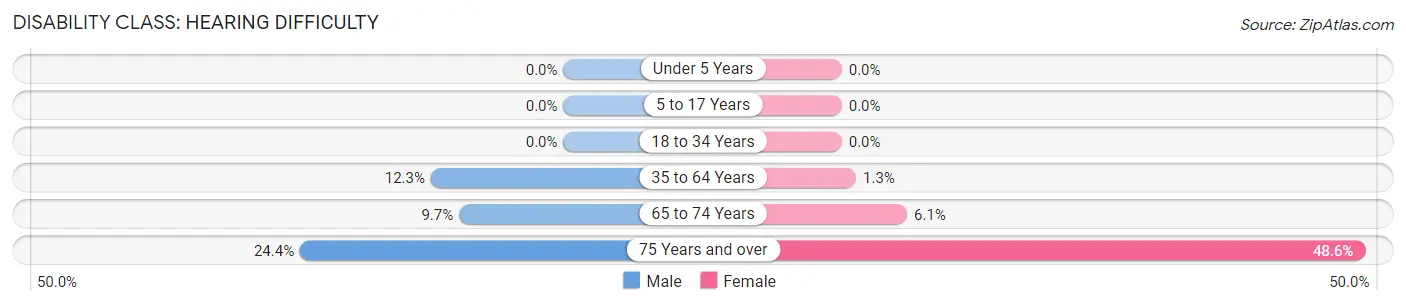
| Age Bracket | Male | Female |
| Under 5 Years | 0 (0.0%) | 0 (0.0%) |
| 5 to 17 Years | 0 (0.0%) | 0 (0.0%) |
| 18 to 34 Years | 0 (0.0%) | 0 (0.0%) |
| 35 to 64 Years | 30 (12.3%) | 3 (1.3%) |
| 65 to 74 Years | 6 (9.7%) | 6 (6.1%) |
| 75 Years and over | 11 (24.4%) | 17 (48.6%) |
Disability Class: Vision Difficulty
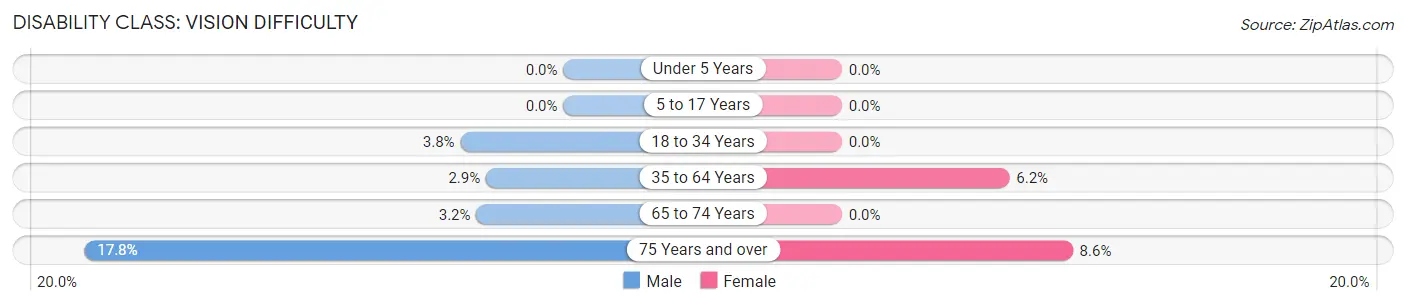
| Age Bracket | Male | Female |
| Under 5 Years | 0 (0.0%) | 0 (0.0%) |
| 5 to 17 Years | 0 (0.0%) | 0 (0.0%) |
| 18 to 34 Years | 5 (3.8%) | 0 (0.0%) |
| 35 to 64 Years | 7 (2.9%) | 14 (6.2%) |
| 65 to 74 Years | 2 (3.2%) | 0 (0.0%) |
| 75 Years and over | 8 (17.8%) | 3 (8.6%) |
Disability Class: Cognitive Difficulty
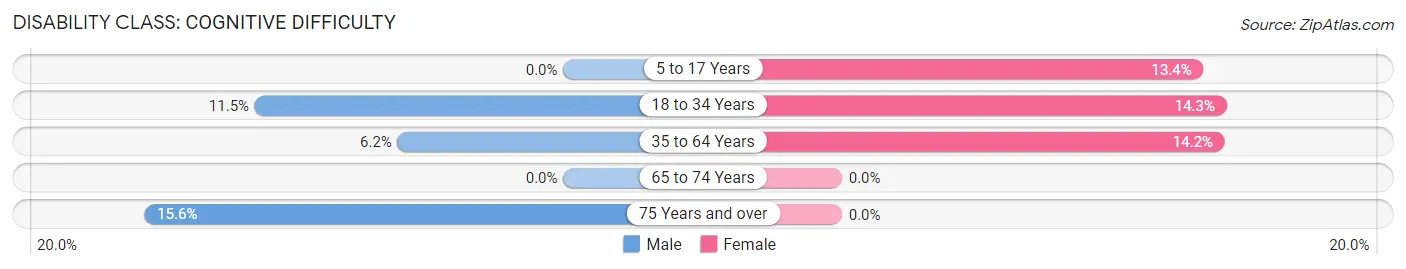
| Age Bracket | Male | Female |
| 5 to 17 Years | 0 (0.0%) | 9 (13.4%) |
| 18 to 34 Years | 15 (11.5%) | 19 (14.3%) |
| 35 to 64 Years | 15 (6.1%) | 32 (14.2%) |
| 65 to 74 Years | 0 (0.0%) | 0 (0.0%) |
| 75 Years and over | 7 (15.6%) | 0 (0.0%) |
Disability Class: Ambulatory Difficulty
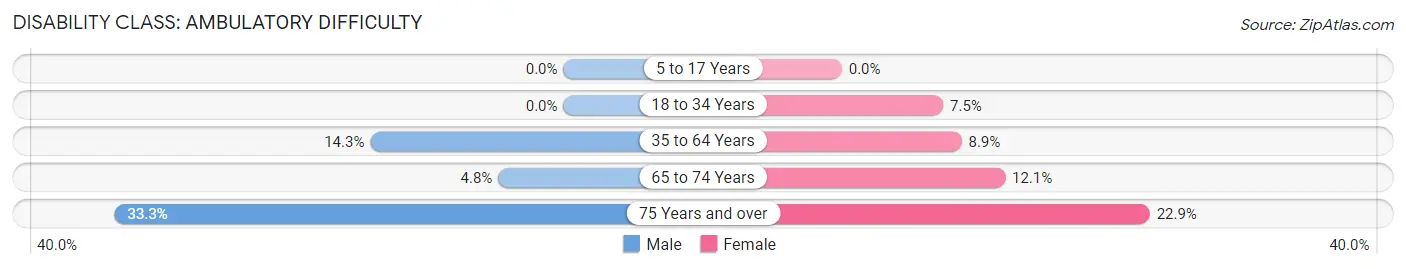
| Age Bracket | Male | Female |
| 5 to 17 Years | 0 (0.0%) | 0 (0.0%) |
| 18 to 34 Years | 0 (0.0%) | 10 (7.5%) |
| 35 to 64 Years | 35 (14.3%) | 20 (8.9%) |
| 65 to 74 Years | 3 (4.8%) | 12 (12.1%) |
| 75 Years and over | 15 (33.3%) | 8 (22.9%) |
Disability Class: Self-Care Difficulty
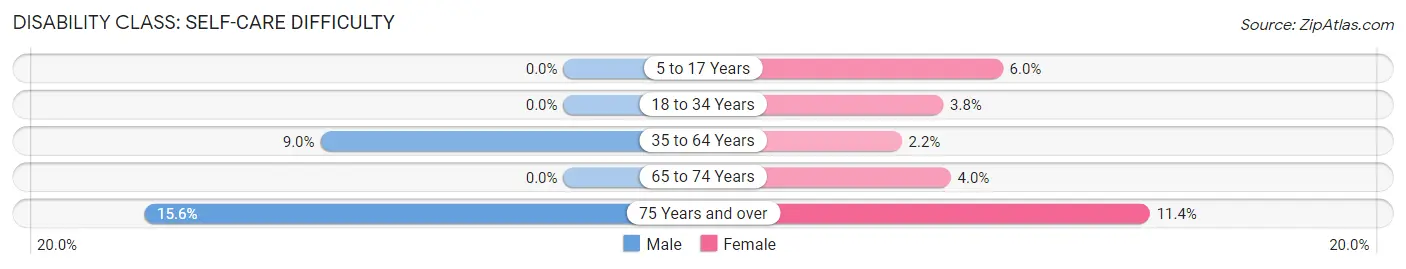
| Age Bracket | Male | Female |
| 5 to 17 Years | 0 (0.0%) | 4 (6.0%) |
| 18 to 34 Years | 0 (0.0%) | 5 (3.8%) |
| 35 to 64 Years | 22 (9.0%) | 5 (2.2%) |
| 65 to 74 Years | 0 (0.0%) | 4 (4.0%) |
| 75 Years and over | 7 (15.6%) | 4 (11.4%) |
Technology Access in Hawley borough
Computing Device Access in Hawley borough
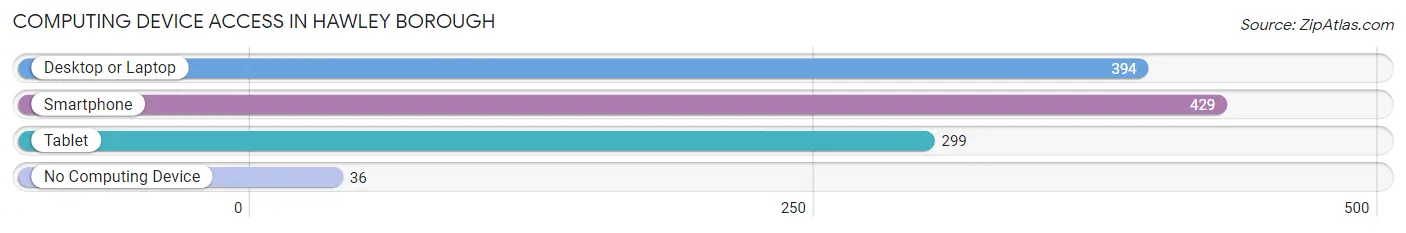
| Device Type | # Households | % Households |
| Desktop or Laptop | 394 | 74.1% |
| Smartphone | 429 | 80.6% |
| Tablet | 299 | 56.2% |
| No Computing Device | 36 | 6.8% |
| Total | 532 | 100.0% |
Internet Access in Hawley borough
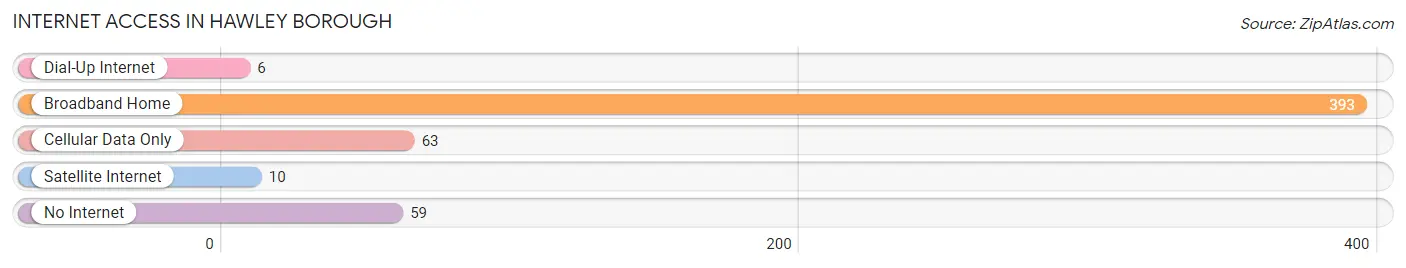
| Internet Type | # Households | % Households |
| Dial-Up Internet | 6 | 1.1% |
| Broadband Home | 393 | 73.9% |
| Cellular Data Only | 63 | 11.8% |
| Satellite Internet | 10 | 1.9% |
| No Internet | 59 | 11.1% |
| Total | 532 | 100.0% |
Hawley borough Summary
Hawley Borough is a borough located in Wayne County, Pennsylvania. It is situated in the Pocono Mountains region of the state, and is part of the Scranton–Wilkes-Barre–Hazleton Metropolitan Statistical Area. The population of Hawley Borough was 1,541 at the 2010 census.
Geography
Hawley Borough is located at 41°25'25" North, 75°14'45" West (41.423750, -75.245833). According to the United States Census Bureau, the borough has a total area of 0.7 square miles (1.8 km2), all of it land.
Hawley Borough is located in the Pocono Mountains region of Pennsylvania. The borough is situated on the banks of the Lackawaxen River, which is a tributary of the Delaware River. The borough is surrounded by Paupack Township to the north, Palmyra Township to the east, and Salem Township to the south and west.
History
Hawley Borough was founded in 1839 by William H. Hawley, a local businessman. The borough was incorporated in 1845.
Hawley Borough was a major center of the lumber industry in the late 19th and early 20th centuries. The borough was home to several sawmills, a planing mill, and a shingle mill. The lumber industry declined in the early 20th century, and the borough shifted to a more tourist-oriented economy.
Economy
Hawley Borough is a popular tourist destination in the Pocono Mountains region of Pennsylvania. The borough is home to several attractions, including the Hawley Silk Mill, a historic silk mill that has been converted into a shopping and entertainment complex; the Dorflinger-Suydam Wildlife Sanctuary, a nature preserve; and the Hawley Winterfest, an annual winter festival.
The borough is also home to several restaurants, bars, and shops. The borough is served by the Hawley Public Library, which is part of the Wayne County Library System.
Demographics
As of the census of 2010, there were 1,541 people, 690 households, and 393 families residing in the borough. The population density was 2,213.6 people per square mile (854.7/km2). There were 745 housing units at an average density of 1,072.9 per square mile (414.7/km2). The racial makeup of the borough was 97.2% White, 0.7% African American, 0.2% Native American, 0.7% Asian, 0.1% Pacific Islander, 0.2% from other races, and 0.9% from two or more races. Hispanic or Latino of any race were 1.2% of the population.
There were 690 households, out of which 22.6% had children under the age of 18 living with them, 43.5% were married couples living together, 10.1% had a female householder with no husband present, and 42.2% were non-families. 36.2% of all households were made up of individuals, and 16.7% had someone living alone who was 65 years of age or older. The average household size was 2.22 and the average family size was 2.90.
In the borough, the population was spread out, with 19.7% under the age of 18, 57.2% from 18 to 64, and 23.1% who were 65 years of age or older. The median age was 46.2 years. For every 100 females, there were 91.2 males. For every 100 females age 18 and over, there were 88.2 males.
The median income for a household in the borough was $41,250, and the median income for a family was $50,000. Males had a median income of $37,500 versus $30,000 for females. The per capita income for the borough was $22,845. About 8.3% of families and 11.2% of the population were below the poverty line, including 16.7% of those under age 18 and 8.3% of those age 65 or over.
Common Questions
What is Per Capita Income in Hawley borough?
Per Capita income in Hawley borough is $26,945.
What is the Median Family Income in Hawley borough?
Median Family Income in Hawley borough is $63,409.
What is the Median Household income in Hawley borough?
Median Household Income in Hawley borough is $44,662.
What is Income or Wage Gap in Hawley borough?
Income or Wage Gap in Hawley borough is 28.9%.
Women in Hawley borough earn 71.1 cents for every dollar earned by a man.
What is Inequality or Gini Index in Hawley borough?
Inequality or Gini Index in Hawley borough is 0.39.
What is the Total Population of Hawley borough?
Total Population of Hawley borough is 1,110.
What is the Total Male Population of Hawley borough?
Total Male Population of Hawley borough is 545.
What is the Total Female Population of Hawley borough?
Total Female Population of Hawley borough is 565.
What is the Ratio of Males per 100 Females in Hawley borough?
There are 96.46 Males per 100 Females in Hawley borough.
What is the Ratio of Females per 100 Males in Hawley borough?
There are 103.67 Females per 100 Males in Hawley borough.
What is the Median Population Age in Hawley borough?
Median Population Age in Hawley borough is 46.7 Years.
What is the Average Family Size in Hawley borough
Average Family Size in Hawley borough is 2.8 People.
What is the Average Household Size in Hawley borough
Average Household Size in Hawley borough is 2.1 People.
How Large is the Labor Force in Hawley borough?
There are 555 People in the Labor Forcein in Hawley borough.
What is the Percentage of People in the Labor Force in Hawley borough?
54.2% of People are in the Labor Force in Hawley borough.
What is the Unemployment Rate in Hawley borough?
Unemployment Rate in Hawley borough is 7.4%.