Cities with the Highest Female Poverty Level in Pennsylvania
RELATED REPORTS & OPTIONS
Highest Poverty | Female
Pennsylvania
Compare Cities
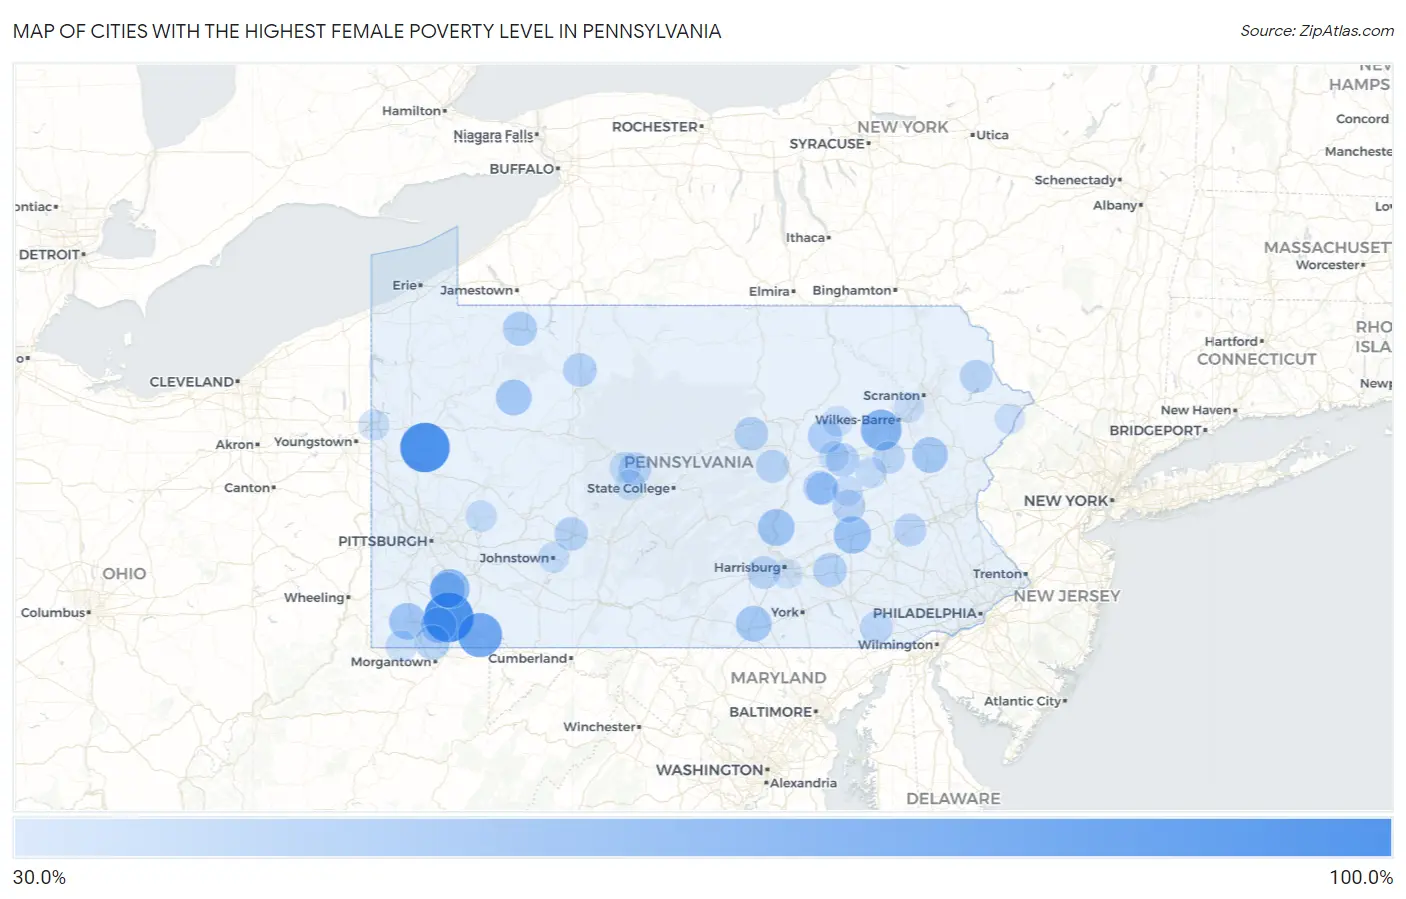
Map of Cities with the Highest Female Poverty Level in Pennsylvania
0.0%
100.0%
Cities with the Highest Female Poverty Level in Pennsylvania
| City | Female Poverty | vs State | vs National | |
| 1. | Slippery Rock University | 100.0% | 12.9%(+87.1)#1 | 13.7%(+86.3)#3 |
| 2. | Buffington | 100.0% | 12.9%(+87.1)#2 | 13.7%(+86.3)#35 |
| 3. | Frankstown | 100.0% | 12.9%(+87.1)#3 | 13.7%(+86.3)#78 |
| 4. | Aaronsburg Cdp Washington County | 86.0% | 12.9%(+73.1)#4 | 13.7%(+72.3)#212 |
| 5. | Farmington | 80.7% | 12.9%(+67.8)#5 | 13.7%(+67.0)#256 |
| 6. | Beavertown | 75.0% | 12.9%(+62.1)#6 | 13.7%(+61.3)#338 |
| 7. | East Altoona | 74.2% | 12.9%(+61.3)#7 | 13.7%(+60.5)#346 |
| 8. | Wanamie | 68.2% | 12.9%(+55.3)#8 | 13.7%(+54.5)#442 |
| 9. | St. Clair | 65.2% | 12.9%(+52.3)#9 | 13.7%(+51.5)#504 |
| 10. | Carson Valley | 64.5% | 12.9%(+51.6)#10 | 13.7%(+50.8)#533 |
| 11. | Cove Forge | 63.0% | 12.9%(+50.1)#11 | 13.7%(+49.3)#575 |
| 12. | Arnold City | 62.8% | 12.9%(+49.9)#12 | 13.7%(+49.1)#580 |
| 13. | Franklin Forge | 62.5% | 12.9%(+49.6)#13 | 13.7%(+48.8)#594 |
| 14. | Coalmont Borough | 58.3% | 12.9%(+45.4)#14 | 13.7%(+44.6)#724 |
| 15. | Bethel | 56.1% | 12.9%(+43.2)#15 | 13.7%(+42.4)#811 |
| 16. | West Waynesburg | 54.0% | 12.9%(+41.1)#16 | 13.7%(+40.3)#908 |
| 17. | Lenkerville | 53.9% | 12.9%(+41.0)#17 | 13.7%(+40.2)#913 |
| 18. | Rainsburg Borough | 52.6% | 12.9%(+39.7)#18 | 13.7%(+38.9)#997 |
| 19. | Polk Borough | 52.5% | 12.9%(+39.6)#19 | 13.7%(+38.8)#1,006 |
| 20. | Sickles Corner | 51.9% | 12.9%(+38.9)#20 | 13.7%(+38.2)#1,055 |
| 21. | Albrightsville | 51.1% | 12.9%(+38.2)#21 | 13.7%(+37.4)#1,094 |
| 22. | Crown | 50.8% | 12.9%(+37.9)#22 | 13.7%(+37.1)#1,108 |
| 23. | Hunterstown | 50.7% | 12.9%(+37.8)#23 | 13.7%(+37.0)#1,119 |
| 24. | Nemacolin | 50.2% | 12.9%(+37.3)#24 | 13.7%(+36.5)#1,143 |
| 25. | Naomi | 50.0% | 12.9%(+37.1)#25 | 13.7%(+36.3)#1,169 |
| 26. | Dale Borough | 49.6% | 12.9%(+36.7)#26 | 13.7%(+35.9)#1,209 |
| 27. | Washingtonville Borough | 49.5% | 12.9%(+36.6)#27 | 13.7%(+35.8)#1,217 |
| 28. | Linds Crossing | 48.4% | 12.9%(+35.5)#28 | 13.7%(+34.7)#1,290 |
| 29. | Bobtown | 47.5% | 12.9%(+34.6)#29 | 13.7%(+33.8)#1,355 |
| 30. | Iola | 46.2% | 12.9%(+33.3)#30 | 13.7%(+32.5)#1,432 |
| 31. | Starbrick | 45.8% | 12.9%(+32.9)#31 | 13.7%(+32.1)#1,463 |
| 32. | Landingville Borough | 44.3% | 12.9%(+31.4)#32 | 13.7%(+30.6)#1,612 |
| 33. | Wilcox | 44.1% | 12.9%(+31.2)#33 | 13.7%(+30.4)#1,625 |
| 34. | Timber Hills | 43.8% | 12.9%(+30.9)#34 | 13.7%(+30.1)#1,657 |
| 35. | Tharptown Uniontown | 43.4% | 12.9%(+30.5)#35 | 13.7%(+29.7)#1,700 |
| 36. | Oval | 43.2% | 12.9%(+30.3)#36 | 13.7%(+29.5)#1,716 |
| 37. | Revloc | 43.1% | 12.9%(+30.2)#37 | 13.7%(+29.4)#1,726 |
| 38. | Mainville | 42.9% | 12.9%(+30.0)#38 | 13.7%(+29.2)#1,756 |
| 39. | Alverda | 42.1% | 12.9%(+29.2)#39 | 13.7%(+28.4)#1,849 |
| 40. | State College Borough | 42.0% | 12.9%(+29.1)#40 | 13.7%(+28.3)#1,869 |
| 41. | Ashley Borough | 41.6% | 12.9%(+28.7)#41 | 13.7%(+27.9)#1,913 |
| 42. | Vicksburg | 41.4% | 12.9%(+28.5)#42 | 13.7%(+27.7)#1,929 |
| 43. | Mount Union Borough | 41.3% | 12.9%(+28.4)#43 | 13.7%(+27.6)#1,938 |
| 44. | White Mills | 41.2% | 12.9%(+28.3)#44 | 13.7%(+27.5)#1,949 |
| 45. | Wall Borough | 41.2% | 12.9%(+28.3)#45 | 13.7%(+27.5)#1,952 |
| 46. | Hawk Run | 40.8% | 12.9%(+27.9)#46 | 13.7%(+27.1)#1,998 |
| 47. | Wilmore Borough | 40.7% | 12.9%(+27.8)#47 | 13.7%(+27.0)#2,000 |
| 48. | New Kingstown | 40.6% | 12.9%(+27.7)#48 | 13.7%(+26.9)#2,031 |
| 49. | Branchdale | 40.1% | 12.9%(+27.2)#49 | 13.7%(+26.4)#2,083 |
| 50. | Shamokin | 40.1% | 12.9%(+27.2)#50 | 13.7%(+26.4)#2,087 |
| 51. | Kutztown University | 40.0% | 12.9%(+27.1)#51 | 13.7%(+26.3)#2,095 |
| 52. | Darby Borough | 39.9% | 12.9%(+27.0)#52 | 13.7%(+26.2)#2,137 |
| 53. | Kirkwood | 39.6% | 12.9%(+26.7)#53 | 13.7%(+25.9)#2,153 |
| 54. | Pardeesville | 39.1% | 12.9%(+26.2)#54 | 13.7%(+25.4)#2,206 |
| 55. | East Conemaugh Borough | 37.8% | 12.9%(+24.9)#55 | 13.7%(+24.1)#2,401 |
| 56. | Loretto Borough | 37.2% | 12.9%(+24.3)#56 | 13.7%(+23.5)#2,497 |
| 57. | Mckees Rocks Borough | 37.0% | 12.9%(+24.1)#57 | 13.7%(+23.3)#2,520 |
| 58. | Donora Borough | 36.8% | 12.9%(+23.9)#58 | 13.7%(+23.1)#2,573 |
| 59. | Brave | 36.7% | 12.9%(+23.8)#59 | 13.7%(+23.0)#2,585 |
| 60. | Fairchance Borough | 36.5% | 12.9%(+23.6)#60 | 13.7%(+22.8)#2,628 |
| 61. | Wattsburg Borough | 36.5% | 12.9%(+23.6)#61 | 13.7%(+22.8)#2,629 |
| 62. | West Decatur | 36.0% | 12.9%(+23.1)#62 | 13.7%(+22.3)#2,733 |
| 63. | Vandergrift Borough | 35.9% | 12.9%(+23.0)#63 | 13.7%(+22.2)#2,758 |
| 64. | Colwyn Borough | 35.8% | 12.9%(+22.9)#64 | 13.7%(+22.1)#2,768 |
| 65. | North Vandergrift | 35.8% | 12.9%(+22.9)#65 | 13.7%(+22.1)#2,787 |
| 66. | Lewistown Borough | 35.7% | 12.9%(+22.8)#66 | 13.7%(+22.0)#2,803 |
| 67. | Slippery Rock Borough | 35.3% | 12.9%(+22.4)#67 | 13.7%(+21.6)#2,885 |
| 68. | New Bethlehem Borough | 35.2% | 12.9%(+22.3)#68 | 13.7%(+21.5)#2,903 |
| 69. | Johnstown | 34.8% | 12.9%(+21.9)#69 | 13.7%(+21.1)#2,988 |
| 70. | Sheppton | 34.7% | 12.9%(+21.8)#70 | 13.7%(+21.0)#3,002 |
| 71. | Brownsville Borough | 34.6% | 12.9%(+21.7)#71 | 13.7%(+20.9)#3,021 |
| 72. | Farrell | 34.6% | 12.9%(+21.7)#72 | 13.7%(+20.9)#3,040 |
| 73. | Rankin Borough | 34.5% | 12.9%(+21.6)#73 | 13.7%(+20.8)#3,044 |
| 74. | Laurel Run Borough | 34.4% | 12.9%(+21.5)#74 | 13.7%(+20.7)#3,067 |
| 75. | Briar Creek Borough | 34.4% | 12.9%(+21.5)#75 | 13.7%(+20.7)#3,071 |
| 76. | Windsor Borough | 34.0% | 12.9%(+21.1)#76 | 13.7%(+20.3)#3,161 |
| 77. | Freedom Borough | 33.9% | 12.9%(+21.0)#77 | 13.7%(+20.2)#3,165 |
| 78. | Edwardsville Borough | 33.9% | 12.9%(+21.0)#78 | 13.7%(+20.2)#3,172 |
| 79. | Westfield Borough | 33.8% | 12.9%(+20.9)#79 | 13.7%(+20.1)#3,185 |
| 80. | Rochester Borough | 33.8% | 12.9%(+20.9)#80 | 13.7%(+20.1)#3,186 |
| 81. | Sandy Ridge | 33.6% | 12.9%(+20.7)#81 | 13.7%(+19.9)#3,230 |
| 82. | Sharon Hill Borough | 33.5% | 12.9%(+20.6)#82 | 13.7%(+19.8)#3,257 |
| 83. | Northern Cambria Borough | 33.5% | 12.9%(+20.6)#83 | 13.7%(+19.8)#3,261 |
| 84. | Fountain Springs | 33.3% | 12.9%(+20.4)#84 | 13.7%(+19.6)#3,295 |
| 85. | Waller | 33.3% | 12.9%(+20.4)#85 | 13.7%(+19.6)#3,315 |
| 86. | Pittston | 32.9% | 12.9%(+20.0)#86 | 13.7%(+19.2)#3,387 |
| 87. | Bloomsburg | 32.7% | 12.9%(+19.8)#87 | 13.7%(+19.0)#3,433 |
| 88. | Spring Drive Mobile Home Park | 32.5% | 12.9%(+19.6)#88 | 13.7%(+18.8)#3,495 |
| 89. | Edinboro Borough | 32.4% | 12.9%(+19.5)#89 | 13.7%(+18.7)#3,496 |
| 90. | Cassville Borough | 32.4% | 12.9%(+19.5)#90 | 13.7%(+18.7)#3,497 |
| 91. | Birchwood Lakes | 32.4% | 12.9%(+19.5)#91 | 13.7%(+18.7)#3,507 |
| 92. | Smithton Borough | 32.0% | 12.9%(+19.1)#92 | 13.7%(+18.3)#3,604 |
| 93. | Woodbury Borough | 32.0% | 12.9%(+19.1)#93 | 13.7%(+18.3)#3,607 |
| 94. | Conneautville Borough | 32.0% | 12.9%(+19.1)#94 | 13.7%(+18.3)#3,621 |
| 95. | California Borough | 31.9% | 12.9%(+19.0)#95 | 13.7%(+18.2)#3,626 |
| 96. | Sugar Notch Borough | 31.7% | 12.9%(+18.8)#96 | 13.7%(+18.0)#3,672 |
| 97. | New Market | 31.5% | 12.9%(+18.6)#97 | 13.7%(+17.8)#3,715 |
| 98. | Weissport Borough | 31.4% | 12.9%(+18.5)#98 | 13.7%(+17.7)#3,732 |
| 99. | Mckee | 31.3% | 12.9%(+18.4)#99 | 13.7%(+17.6)#3,757 |
| 100. | Hazen | 31.2% | 12.9%(+18.3)#100 | 13.7%(+17.6)#3,776 |
Common Questions
What are the Top 10 Cities with the Highest Female Poverty Level in Pennsylvania?
Top 10 Cities with the Highest Female Poverty Level in Pennsylvania are:
#1
100.0%
#2
100.0%
#3
80.7%
#4
68.2%
#5
62.8%
#6
56.1%
#7
54.0%
#8
53.9%
#9
51.1%
#10
50.8%
What city has the Highest Female Poverty Level in Pennsylvania?
Slippery Rock University has the Highest Female Poverty Level in Pennsylvania with 100.0%.
What is the Poverty Level Among Females in the State of Pennsylvania?
Poverty Level Among Females in Pennsylvania is 12.9%.
What is the Poverty Level Among Females in the United States?
Poverty Level Among Females in the United States is 13.7%.