Cities with the Highest Percentage of Sri Lankan Population in Pennsylvania
RELATED REPORTS & OPTIONS
Sri Lankan
Pennsylvania
Compare Cities
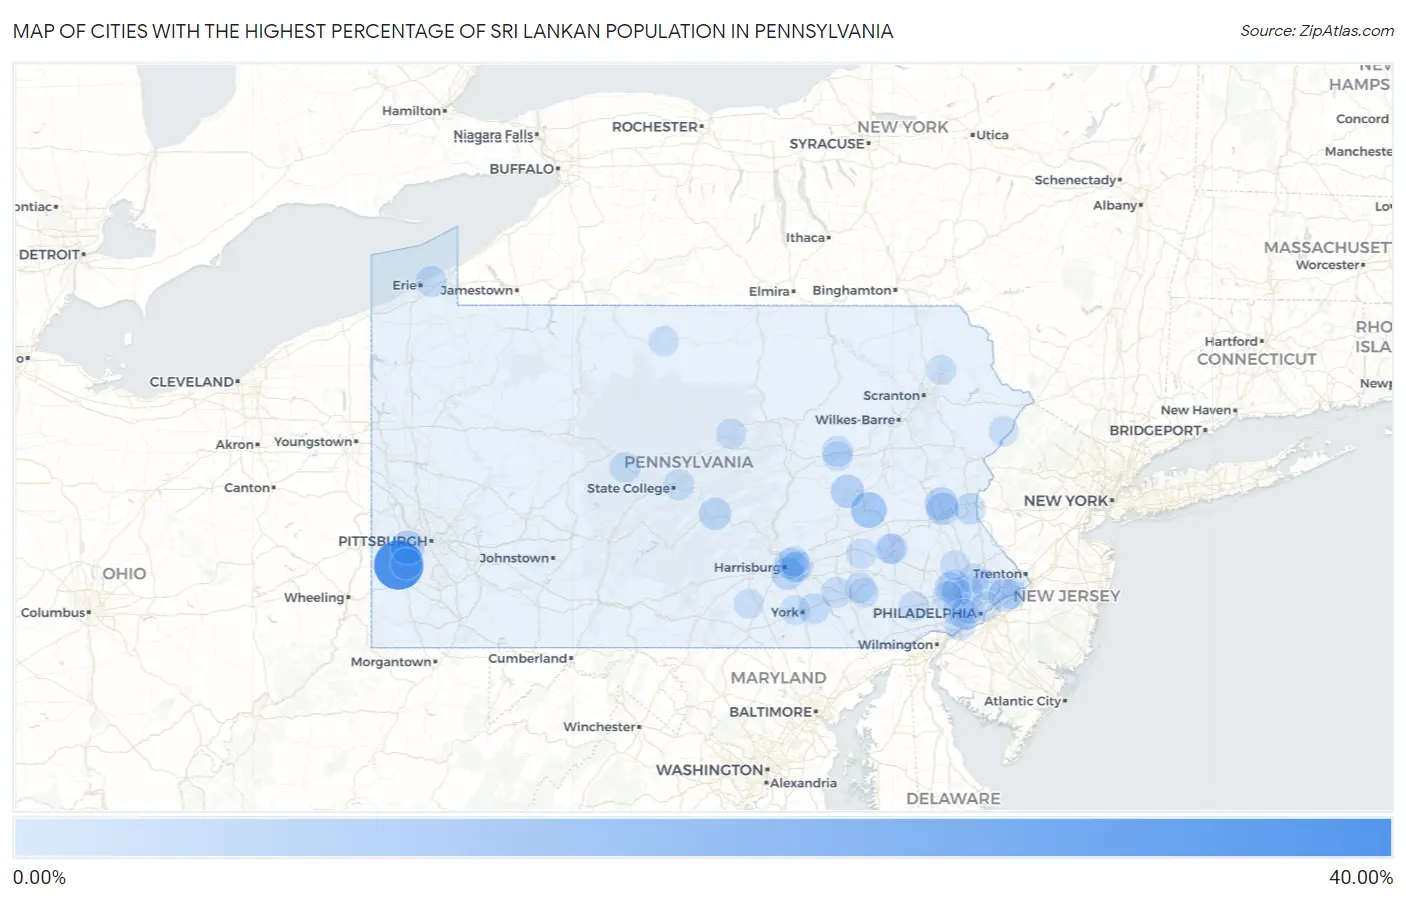
Map of Cities with the Highest Percentage of Sri Lankan Population in Pennsylvania
0.00%
40.00%
Cities with the Highest Percentage of Sri Lankan Population in Pennsylvania
| City | Sri Lankan | vs State | vs National | |
| 1. | Westland | 38.46% | 0.40%(+38.1)#1 | 0.68%(+37.8)#6 |
| 2. | Renningers | 11.43% | 0.40%(+11.0)#2 | 0.68%(+10.8)#40 |
| 3. | Noblestown | 7.89% | 0.40%(+7.50)#3 | 0.68%(+7.22)#76 |
| 4. | Fountain Springs | 6.90% | 0.40%(+6.50)#4 | 0.68%(+6.22)#88 |
| 5. | Cornwells Heights | 6.72% | 0.40%(+6.32)#5 | 0.68%(+6.04)#91 |
| 6. | Cementon | 6.15% | 0.40%(+5.76)#6 | 0.68%(+5.48)#103 |
| 7. | Quarryville Borough | 6.07% | 0.40%(+5.67)#7 | 0.68%(+5.39)#106 |
| 8. | New Market | 5.41% | 0.40%(+5.02)#8 | 0.68%(+4.74)#140 |
| 9. | Hokendauqua | 5.37% | 0.40%(+4.97)#9 | 0.68%(+4.69)#144 |
| 10. | Paxtang Borough | 5.23% | 0.40%(+4.84)#10 | 0.68%(+4.56)#147 |
| 11. | Maitland | 4.95% | 0.40%(+4.55)#11 | 0.68%(+4.27)#166 |
| 12. | Bessemer Borough | 4.06% | 0.40%(+3.66)#12 | 0.68%(+3.38)#234 |
| 13. | Old Orchard | 3.45% | 0.40%(+3.05)#13 | 0.68%(+2.77)#303 |
| 14. | Halifax Borough | 3.44% | 0.40%(+3.04)#14 | 0.68%(+2.76)#306 |
| 15. | Mont Alto Borough | 3.33% | 0.40%(+2.93)#15 | 0.68%(+2.65)#325 |
| 16. | Muse | 3.32% | 0.40%(+2.92)#16 | 0.68%(+2.64)#326 |
| 17. | Telford Borough | 3.16% | 0.40%(+2.76)#17 | 0.68%(+2.48)#353 |
| 18. | Freemansburg Borough | 3.11% | 0.40%(+2.71)#18 | 0.68%(+2.43)#364 |
| 19. | Rutherford | 3.10% | 0.40%(+2.71)#19 | 0.68%(+2.43)#366 |
| 20. | New Britain Borough | 2.95% | 0.40%(+2.55)#20 | 0.68%(+2.27)#404 |
| 21. | Northwest Harborcreek | 2.90% | 0.40%(+2.51)#21 | 0.68%(+2.23)#410 |
| 22. | West Grove Borough | 2.84% | 0.40%(+2.44)#22 | 0.68%(+2.16)#424 |
| 23. | Stonybrook | 2.82% | 0.40%(+2.43)#23 | 0.68%(+2.15)#425 |
| 24. | Souderton Borough | 2.80% | 0.40%(+2.41)#24 | 0.68%(+2.13)#431 |
| 25. | Homestead Borough | 2.62% | 0.40%(+2.22)#25 | 0.68%(+1.94)#470 |
| 26. | Lightstreet | 2.54% | 0.40%(+2.14)#26 | 0.68%(+1.86)#491 |
| 27. | Salunga | 2.47% | 0.40%(+2.07)#27 | 0.68%(+1.79)#506 |
| 28. | Broomall | 2.46% | 0.40%(+2.06)#28 | 0.68%(+1.78)#510 |
| 29. | Progress | 2.43% | 0.40%(+2.03)#29 | 0.68%(+1.75)#518 |
| 30. | Watsontown Borough | 2.40% | 0.40%(+2.00)#30 | 0.68%(+1.72)#528 |
| 31. | Villanova | 2.36% | 0.40%(+1.97)#31 | 0.68%(+1.69)#545 |
| 32. | Trooper | 2.35% | 0.40%(+1.95)#32 | 0.68%(+1.67)#548 |
| 33. | Landisburg Borough | 2.35% | 0.40%(+1.95)#33 | 0.68%(+1.67)#549 |
| 34. | Lemont | 2.35% | 0.40%(+1.95)#34 | 0.68%(+1.67)#550 |
| 35. | Woodlyn | 2.35% | 0.40%(+1.95)#35 | 0.68%(+1.67)#552 |
| 36. | Delta Borough | 2.32% | 0.40%(+1.92)#36 | 0.68%(+1.64)#565 |
| 37. | Nazareth Borough | 2.29% | 0.40%(+1.90)#37 | 0.68%(+1.62)#574 |
| 38. | Lansdale Borough | 2.25% | 0.40%(+1.86)#38 | 0.68%(+1.57)#585 |
| 39. | West Reading Borough | 2.18% | 0.40%(+1.79)#39 | 0.68%(+1.51)#610 |
| 40. | Wyoming Borough | 2.16% | 0.40%(+1.76)#40 | 0.68%(+1.48)#620 |
| 41. | Brownstown | 2.09% | 0.40%(+1.70)#41 | 0.68%(+1.42)#644 |
| 42. | Lawnton | 1.96% | 0.40%(+1.56)#42 | 0.68%(+1.28)#699 |
| 43. | Colonial Park | 1.94% | 0.40%(+1.54)#43 | 0.68%(+1.26)#711 |
| 44. | Etna Borough | 1.90% | 0.40%(+1.51)#44 | 0.68%(+1.23)#724 |
| 45. | Hatfield Borough | 1.89% | 0.40%(+1.49)#45 | 0.68%(+1.21)#731 |
| 46. | West Decatur | 1.88% | 0.40%(+1.48)#46 | 0.68%(+1.20)#741 |
| 47. | Plymouth Meeting | 1.85% | 0.40%(+1.45)#47 | 0.68%(+1.17)#757 |
| 48. | Shiremanstown Borough | 1.77% | 0.40%(+1.37)#48 | 0.68%(+1.09)#800 |
| 49. | Williamsburg Borough | 1.75% | 0.40%(+1.35)#49 | 0.68%(+1.07)#816 |
| 50. | Thorndale | 1.72% | 0.40%(+1.32)#50 | 0.68%(+1.04)#834 |
| 51. | Denver Borough | 1.69% | 0.40%(+1.29)#51 | 0.68%(+1.01)#853 |
| 52. | Spring House | 1.61% | 0.40%(+1.21)#52 | 0.68%(+0.933)#912 |
| 53. | Newmanstown | 1.61% | 0.40%(+1.21)#53 | 0.68%(+0.931)#916 |
| 54. | Croydon | 1.60% | 0.40%(+1.20)#54 | 0.68%(+0.921)#924 |
| 55. | Scottdale Borough | 1.59% | 0.40%(+1.19)#55 | 0.68%(+0.913)#930 |
| 56. | Mcelhattan | 1.56% | 0.40%(+1.17)#56 | 0.68%(+0.886)#961 |
| 57. | Audubon | 1.52% | 0.40%(+1.12)#57 | 0.68%(+0.842)#986 |
| 58. | Penn Wynne | 1.49% | 0.40%(+1.09)#58 | 0.68%(+0.807)#1,017 |
| 59. | Willow Grove | 1.47% | 0.40%(+1.07)#59 | 0.68%(+0.790)#1,035 |
| 60. | Gettysburg Borough | 1.45% | 0.40%(+1.05)#60 | 0.68%(+0.774)#1,046 |
| 61. | East Vandergrift Borough | 1.43% | 0.40%(+1.03)#61 | 0.68%(+0.748)#1,071 |
| 62. | Shamokin Dam Borough | 1.42% | 0.40%(+1.02)#62 | 0.68%(+0.743)#1,076 |
| 63. | Riverview Park | 1.41% | 0.40%(+1.02)#63 | 0.68%(+0.736)#1,084 |
| 64. | Ridley Park Borough | 1.41% | 0.40%(+1.01)#64 | 0.68%(+0.734)#1,086 |
| 65. | New Hope Borough | 1.41% | 0.40%(+1.01)#65 | 0.68%(+0.732)#1,090 |
| 66. | Phoenixville Borough | 1.41% | 0.40%(+1.01)#66 | 0.68%(+0.732)#1,091 |
| 67. | Millville Borough | 1.40% | 0.40%(+1.00)#67 | 0.68%(+0.722)#1,099 |
| 68. | King Of Prussia | 1.38% | 0.40%(+0.986)#68 | 0.68%(+0.705)#1,110 |
| 69. | Sugar Grove Borough | 1.38% | 0.40%(+0.979)#69 | 0.68%(+0.698)#1,116 |
| 70. | Muhlenberg Park | 1.36% | 0.40%(+0.962)#70 | 0.68%(+0.682)#1,131 |
| 71. | Pocono Ranch Lands | 1.31% | 0.40%(+0.915)#71 | 0.68%(+0.635)#1,170 |
| 72. | Ingram Borough | 1.31% | 0.40%(+0.915)#72 | 0.68%(+0.635)#1,172 |
| 73. | Forest City Borough | 1.30% | 0.40%(+0.904)#73 | 0.68%(+0.624)#1,189 |
| 74. | Chesterbrook | 1.29% | 0.40%(+0.891)#74 | 0.68%(+0.611)#1,209 |
| 75. | Bell Acres Borough | 1.24% | 0.40%(+0.840)#75 | 0.68%(+0.560)#1,271 |
| 76. | Idaville | 1.23% | 0.40%(+0.836)#76 | 0.68%(+0.556)#1,276 |
| 77. | Catawissa Borough | 1.23% | 0.40%(+0.827)#77 | 0.68%(+0.547)#1,285 |
| 78. | Leola | 1.21% | 0.40%(+0.810)#78 | 0.68%(+0.530)#1,305 |
| 79. | Harleysville | 1.20% | 0.40%(+0.803)#79 | 0.68%(+0.523)#1,313 |
| 80. | Chester Heights Borough | 1.17% | 0.40%(+0.775)#80 | 0.68%(+0.495)#1,344 |
| 81. | East Side Borough | 1.16% | 0.40%(+0.760)#81 | 0.68%(+0.480)#1,360 |
| 82. | Lansdowne Borough | 1.14% | 0.40%(+0.742)#82 | 0.68%(+0.462)#1,381 |
| 83. | North York Borough | 1.10% | 0.40%(+0.697)#83 | 0.68%(+0.417)#1,434 |
| 84. | Philadelphia | 1.09% | 0.40%(+0.694)#84 | 0.68%(+0.414)#1,437 |
| 85. | Larksville Borough | 1.08% | 0.40%(+0.687)#85 | 0.68%(+0.406)#1,450 |
| 86. | Carbondale | 1.08% | 0.40%(+0.679)#86 | 0.68%(+0.399)#1,456 |
| 87. | Quakertown Borough | 1.07% | 0.40%(+0.676)#87 | 0.68%(+0.396)#1,465 |
| 88. | South Renovo Borough | 1.07% | 0.40%(+0.672)#88 | 0.68%(+0.392)#1,470 |
| 89. | North Braddock Borough | 1.06% | 0.40%(+0.666)#89 | 0.68%(+0.386)#1,477 |
| 90. | New Holland Borough | 1.06% | 0.40%(+0.665)#90 | 0.68%(+0.385)#1,479 |
| 91. | Espy | 1.02% | 0.40%(+0.622)#91 | 0.68%(+0.342)#1,540 |
| 92. | Drexel Hill | 0.99% | 0.40%(+0.590)#92 | 0.68%(+0.310)#1,580 |
| 93. | Sugar Notch Borough | 0.98% | 0.40%(+0.583)#93 | 0.68%(+0.303)#1,591 |
| 94. | Sweden Valley | 0.98% | 0.40%(+0.582)#94 | 0.68%(+0.302)#1,594 |
| 95. | Shiloh | 0.97% | 0.40%(+0.576)#95 | 0.68%(+0.296)#1,602 |
| 96. | Hummelstown Borough | 0.97% | 0.40%(+0.572)#96 | 0.68%(+0.292)#1,607 |
| 97. | East Lansdowne Borough | 0.96% | 0.40%(+0.564)#97 | 0.68%(+0.283)#1,622 |
| 98. | Wayne | 0.96% | 0.40%(+0.561)#98 | 0.68%(+0.281)#1,625 |
| 99. | Womelsdorf Borough | 0.94% | 0.40%(+0.538)#99 | 0.68%(+0.258)#1,670 |
| 100. | Duryea Borough | 0.93% | 0.40%(+0.533)#100 | 0.68%(+0.253)#1,683 |
Common Questions
What are the Top 10 Cities with the Highest Percentage of Sri Lankan Population in Pennsylvania?
Top 10 Cities with the Highest Percentage of Sri Lankan Population in Pennsylvania are:
#1
38.46%
#2
11.43%
#3
7.89%
#4
6.90%
#5
6.72%
#6
6.15%
#7
5.41%
#8
5.37%
#9
4.95%
#10
3.45%
What city has the Highest Percentage of Sri Lankan Population in Pennsylvania?
Westland has the Highest Percentage of Sri Lankan Population in Pennsylvania with 38.46%.
What is the Percentage of Sri Lankan Population in the State of Pennsylvania?
Percentage of Sri Lankan Population in Pennsylvania is 0.40%.
What is the Percentage of Sri Lankan Population in the United States?
Percentage of Sri Lankan Population in the United States is 0.68%.