Hostetter, PA Map & Demographics
Hostetter Map
Hostetter Overview
$35,520
PER CAPITA INCOME
48.9%
WAGE / INCOME GAP [ % ]
51.1¢/ $1
WAGE / INCOME GAP [ $ ]
0.36
INEQUALITY / GINI INDEX
378
TOTAL POPULATION
218
MALE POPULATION
160
FEMALE POPULATION
136.25
MALES / 100 FEMALES
73.39
FEMALES / 100 MALES
47.5
MEDIAN AGE
2.6
AVG FAMILY SIZE
1.3
AVG HOUSEHOLD SIZE
225
LABOR FORCE [ PEOPLE ]
66.2%
PERCENT IN LABOR FORCE
Hostetter Zip Codes
Hostetter Area Codes
Income in Hostetter
Income Overview in Hostetter
| Characteristic | Number | Measure |
| Per Capita Income | 378 | $35,520 |
| Median Family Income | 57 | $0 |
| Mean Family Income | 57 | $94,796 |
| Median Household Income | 268 | $0 |
| Mean Household Income | 268 | $49,550 |
| Income Deficit | 57 | $0 |
| Wage / Income Gap (%) | 378 | 48.87% |
| Wage / Income Gap ($) | 378 | 51.13¢ per $1 |
| Gini / Inequality Index | 378 | 0.36 |
Earnings by Sex in Hostetter
Average Earnings in Hostetter are $44,750, $62,692 for men and $32,054 for women, a difference of 48.9%.
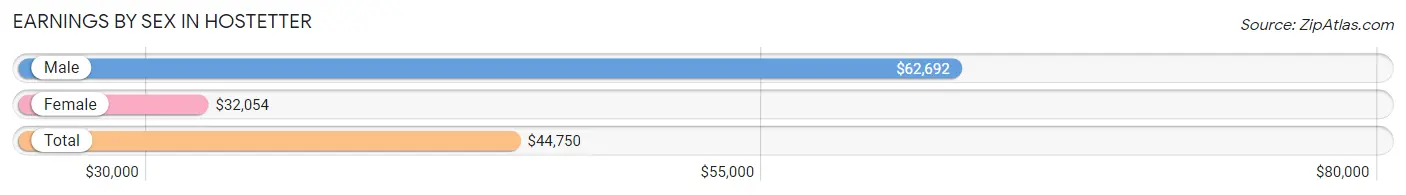
| Sex | Number | Average Earnings |
| Male | 112 (48.9%) | $62,692 |
| Female | 117 (51.1%) | $32,054 |
| Total | 229 (100.0%) | $44,750 |
Earnings by Sex by Income Bracket in Hostetter
The most common earnings brackets in Hostetter are $55,000 to $64,999 for men (58 | 51.8%) and $2,499 or less for women (33 | 28.2%).
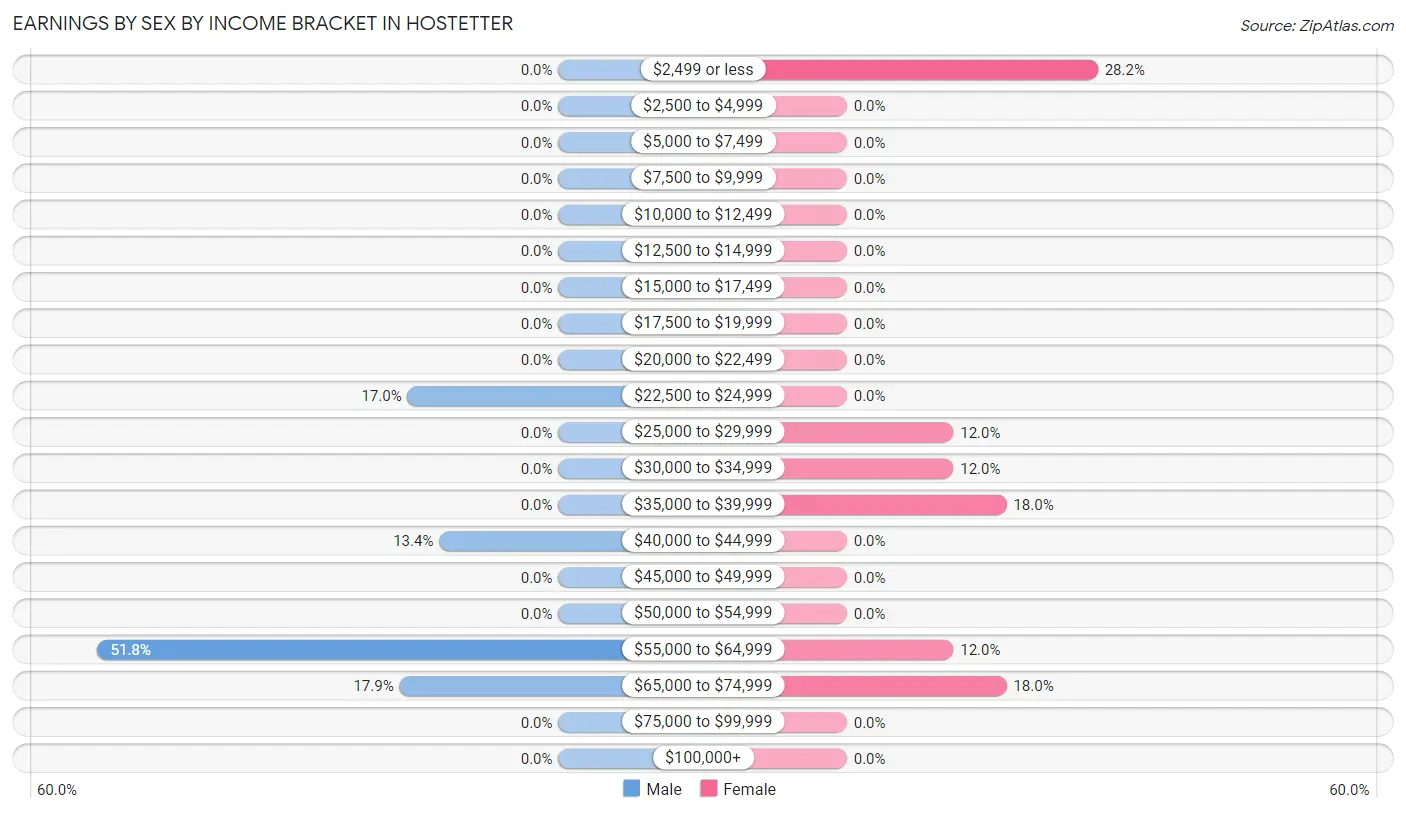
| Income | Male | Female |
| $2,499 or less | 0 (0.0%) | 33 (28.2%) |
| $2,500 to $4,999 | 0 (0.0%) | 0 (0.0%) |
| $5,000 to $7,499 | 0 (0.0%) | 0 (0.0%) |
| $7,500 to $9,999 | 0 (0.0%) | 0 (0.0%) |
| $10,000 to $12,499 | 0 (0.0%) | 0 (0.0%) |
| $12,500 to $14,999 | 0 (0.0%) | 0 (0.0%) |
| $15,000 to $17,499 | 0 (0.0%) | 0 (0.0%) |
| $17,500 to $19,999 | 0 (0.0%) | 0 (0.0%) |
| $20,000 to $22,499 | 0 (0.0%) | 0 (0.0%) |
| $22,500 to $24,999 | 19 (17.0%) | 0 (0.0%) |
| $25,000 to $29,999 | 0 (0.0%) | 14 (12.0%) |
| $30,000 to $34,999 | 0 (0.0%) | 14 (12.0%) |
| $35,000 to $39,999 | 0 (0.0%) | 21 (17.9%) |
| $40,000 to $44,999 | 15 (13.4%) | 0 (0.0%) |
| $45,000 to $49,999 | 0 (0.0%) | 0 (0.0%) |
| $50,000 to $54,999 | 0 (0.0%) | 0 (0.0%) |
| $55,000 to $64,999 | 58 (51.8%) | 14 (12.0%) |
| $65,000 to $74,999 | 20 (17.9%) | 21 (17.9%) |
| $75,000 to $99,999 | 0 (0.0%) | 0 (0.0%) |
| $100,000+ | 0 (0.0%) | 0 (0.0%) |
| Total | 112 (100.0%) | 117 (100.0%) |
Earnings by Sex by Educational Attainment in Hostetter
| Educational Attainment | Male Income | Female Income |
| Less than High School | - | - |
| High School Diploma | - | - |
| College or Associate's Degree | - | - |
| Bachelor's Degree | - | - |
| Graduate Degree | - | - |
| Total | $62,692 | $32,054 |
Family Income in Hostetter
Family Income Brackets in Hostetter
According to the Hostetter family income data, there are 21 families falling into the $50,000 to $74,999 income range, which is the most common income bracket and makes up 36.8% of all families.
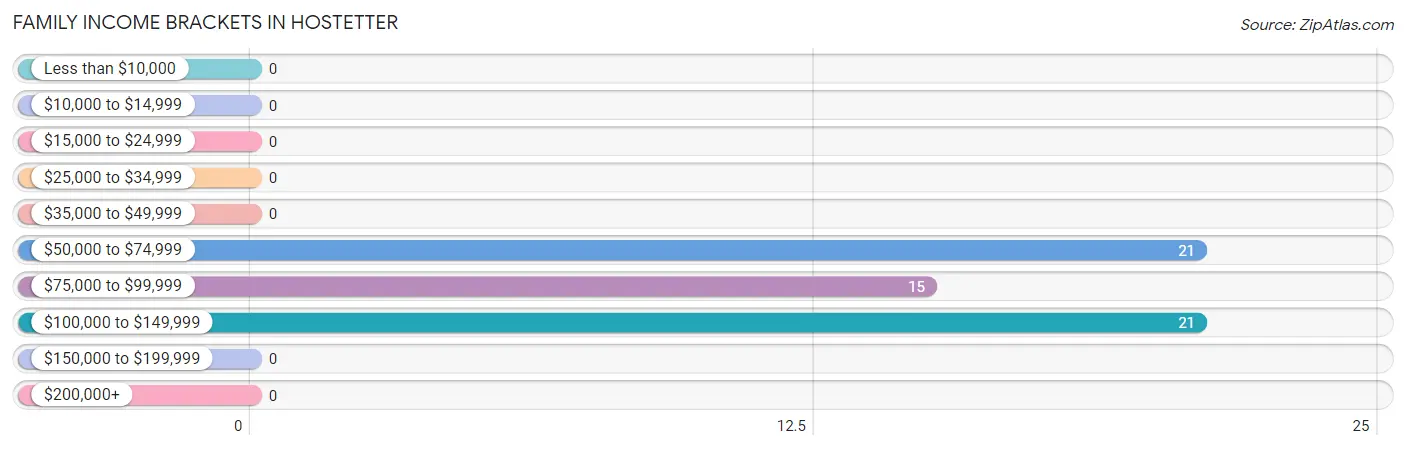
| Income Bracket | # Families | % Families |
| Less than $10,000 | 0 | 0.0% |
| $10,000 to $14,999 | 0 | 0.0% |
| $15,000 to $24,999 | 0 | 0.0% |
| $25,000 to $34,999 | 0 | 0.0% |
| $35,000 to $49,999 | 0 | 0.0% |
| $50,000 to $74,999 | 21 | 36.8% |
| $75,000 to $99,999 | 15 | 26.3% |
| $100,000 to $149,999 | 21 | 36.8% |
| $150,000 to $199,999 | 0 | 0.0% |
| $200,000+ | 0 | 0.0% |
Family Income by Famaliy Size in Hostetter
| Income Bracket | # Families | Median Income |
| 2-Person Families | 36 (63.2%) | $0 |
| 3-Person Families | 0 (0.0%) | $0 |
| 4-Person Families | 21 (36.8%) | $0 |
| 5-Person Families | 0 (0.0%) | $0 |
| 6-Person Families | 0 (0.0%) | $0 |
| 7+ Person Families | 0 (0.0%) | $0 |
| Total | 57 (100.0%) | $0 |
Family Income by Number of Earners in Hostetter
| Number of Earners | # Families | Median Income |
| No Earners | 0 (0.0%) | $0 |
| 1 Earner | 0 (0.0%) | $0 |
| 2 Earners | 57 (100.0%) | $0 |
| 3+ Earners | 0 (0.0%) | $0 |
| Total | 57 (100.0%) | $0 |
Household Income in Hostetter
Household Income Brackets in Hostetter
With 105 households falling in the category, the $50,000 to $74,999 income range is the most frequent in Hostetter, accounting for 39.2% of all households.
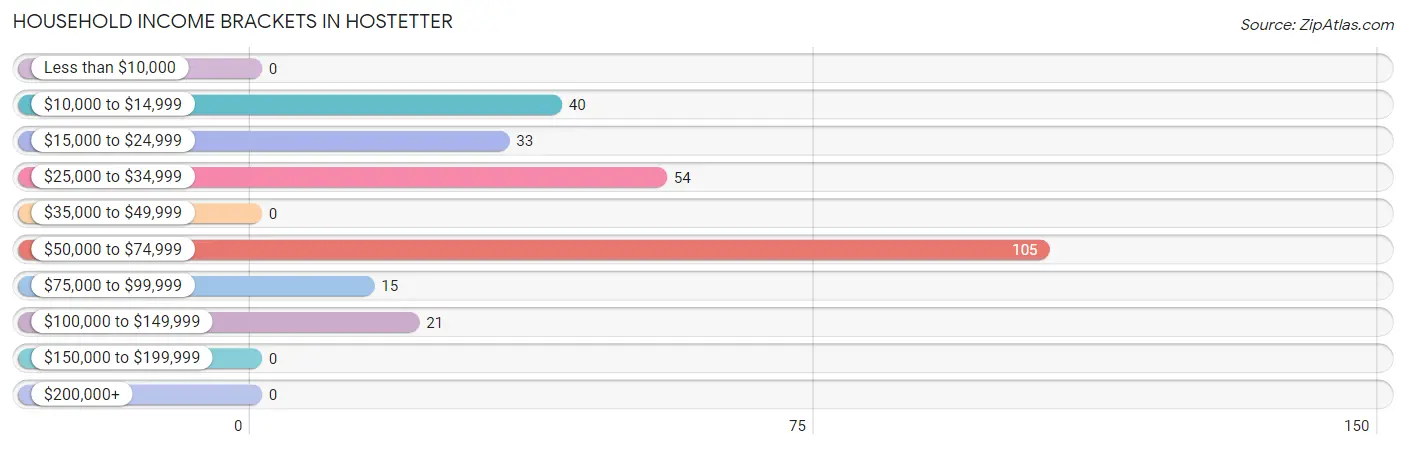
| Income Bracket | # Households | % Households |
| Less than $10,000 | 0 | 0.0% |
| $10,000 to $14,999 | 40 | 14.9% |
| $15,000 to $24,999 | 33 | 12.3% |
| $25,000 to $34,999 | 54 | 20.1% |
| $35,000 to $49,999 | 0 | 0.0% |
| $50,000 to $74,999 | 105 | 39.2% |
| $75,000 to $99,999 | 15 | 5.6% |
| $100,000 to $149,999 | 21 | 7.8% |
| $150,000 to $199,999 | 0 | 0.0% |
| $200,000+ | 0 | 0.0% |
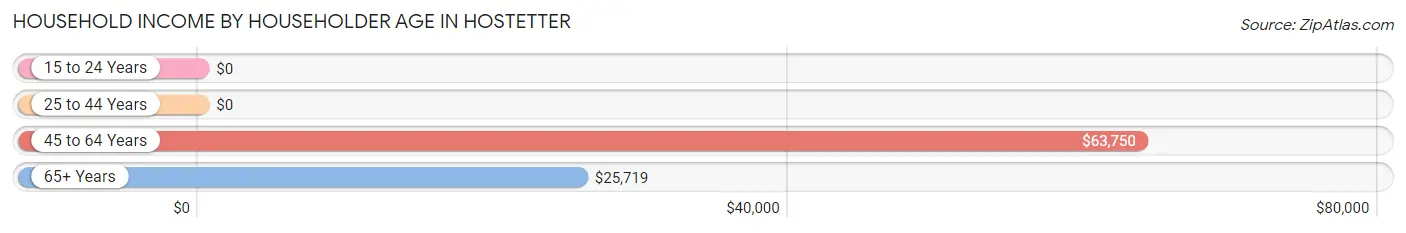
Household Income by Householder Age in Hostetter
The median household income in Hostetter is $0, with the highest median household income of $63,750 found in the 45 to 64 years age bracket for the primary householder. A total of 83 households (31.0%) fall into this category.
| Income Bracket | # Households | Median Income |
| 15 to 24 Years | 0 (0.0%) | $0 |
| 25 to 44 Years | 96 (35.8%) | $0 |
| 45 to 64 Years | 83 (31.0%) | $63,750 |
| 65+ Years | 89 (33.2%) | $25,719 |
| Total | 268 (100.0%) | $0 |
Poverty in Hostetter
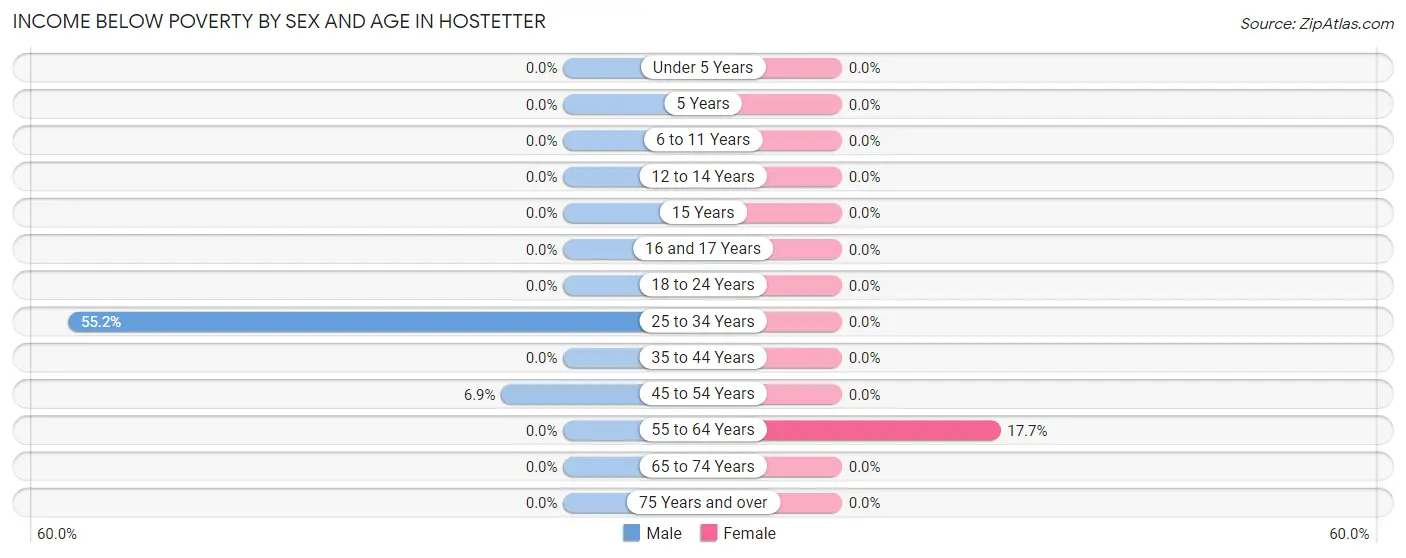
Income Below Poverty by Sex and Age in Hostetter
With 23.8% poverty level for males and 1.9% for females among the residents of Hostetter, 25 to 34 year old males and 55 to 64 year old females are the most vulnerable to poverty, with 48 males (55.2%) and 3 females (17.6%) in their respective age groups living below the poverty level.
| Age Bracket | Male | Female |
| Under 5 Years | 0 (0.0%) | 0 (0.0%) |
| 5 Years | 0 (0.0%) | 0 (0.0%) |
| 6 to 11 Years | 0 (0.0%) | 0 (0.0%) |
| 12 to 14 Years | 0 (0.0%) | 0 (0.0%) |
| 15 Years | 0 (0.0%) | 0 (0.0%) |
| 16 and 17 Years | 0 (0.0%) | 0 (0.0%) |
| 18 to 24 Years | 0 (0.0%) | 0 (0.0%) |
| 25 to 34 Years | 48 (55.2%) | 0 (0.0%) |
| 35 to 44 Years | 0 (0.0%) | 0 (0.0%) |
| 45 to 54 Years | 4 (6.9%) | 0 (0.0%) |
| 55 to 64 Years | 0 (0.0%) | 3 (17.6%) |
| 65 to 74 Years | 0 (0.0%) | 0 (0.0%) |
| 75 Years and over | 0 (0.0%) | 0 (0.0%) |
| Total | 52 (23.8%) | 3 (1.9%) |
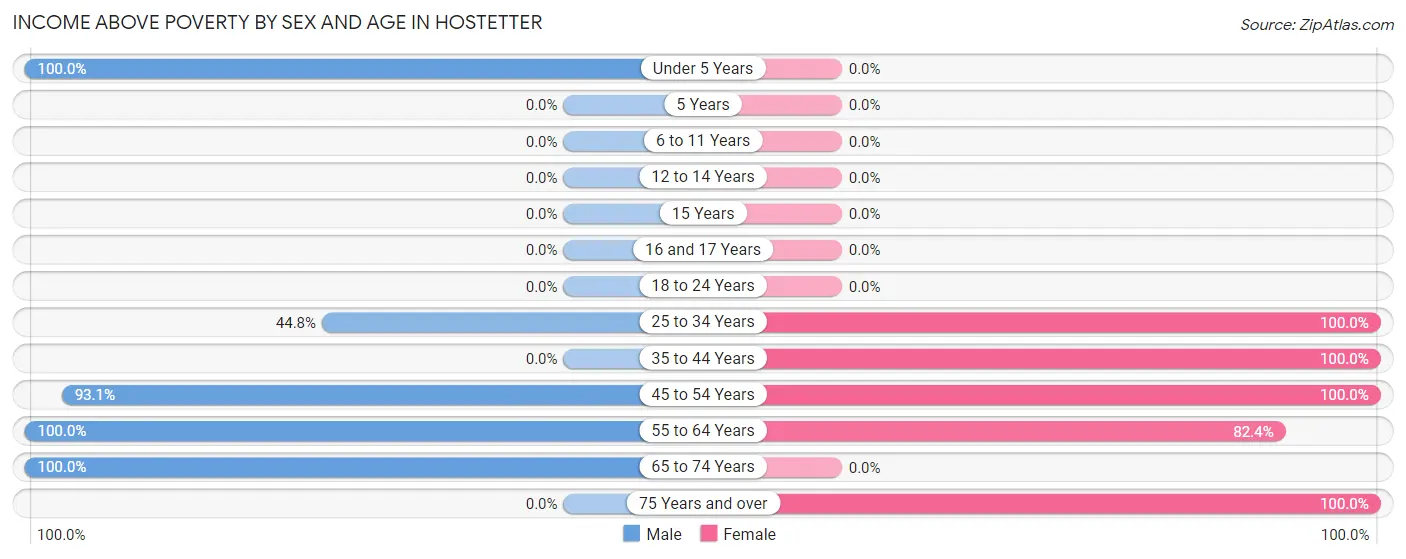
Income Above Poverty by Sex and Age in Hostetter
According to the poverty statistics in Hostetter, males aged under 5 years and females aged 25 to 34 years are the age groups that are most secure financially, with 100.0% of males and 100.0% of females in these age groups living above the poverty line.
| Age Bracket | Male | Female |
| Under 5 Years | 38 (100.0%) | 0 (0.0%) |
| 5 Years | 0 (0.0%) | 0 (0.0%) |
| 6 to 11 Years | 0 (0.0%) | 0 (0.0%) |
| 12 to 14 Years | 0 (0.0%) | 0 (0.0%) |
| 15 Years | 0 (0.0%) | 0 (0.0%) |
| 16 and 17 Years | 0 (0.0%) | 0 (0.0%) |
| 18 to 24 Years | 0 (0.0%) | 0 (0.0%) |
| 25 to 34 Years | 39 (44.8%) | 42 (100.0%) |
| 35 to 44 Years | 0 (0.0%) | 14 (100.0%) |
| 45 to 54 Years | 54 (93.1%) | 14 (100.0%) |
| 55 to 64 Years | 15 (100.0%) | 14 (82.4%) |
| 65 to 74 Years | 20 (100.0%) | 0 (0.0%) |
| 75 Years and over | 0 (0.0%) | 73 (100.0%) |
| Total | 166 (76.1%) | 157 (98.1%) |
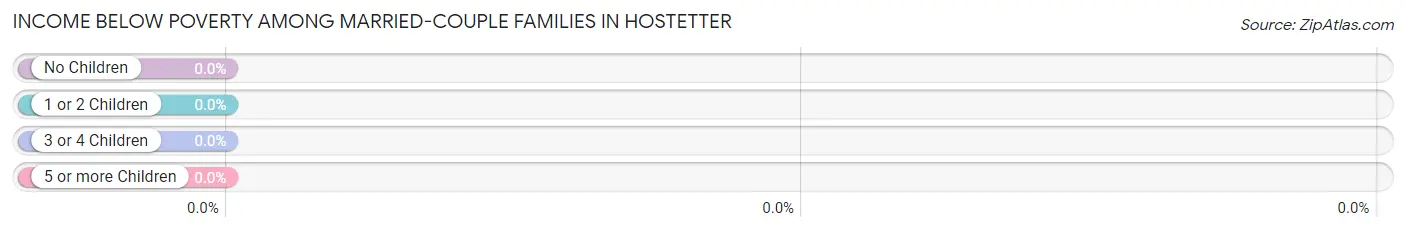
Income Below Poverty Among Married-Couple Families in Hostetter
| Children | Above Poverty | Below Poverty |
| No Children | 36 (100.0%) | 0 (0.0%) |
| 1 or 2 Children | 21 (100.0%) | 0 (0.0%) |
| 3 or 4 Children | 0 (0.0%) | 0 (0.0%) |
| 5 or more Children | 0 (0.0%) | 0 (0.0%) |
| Total | 57 (100.0%) | 0 (0.0%) |
Income Below Poverty Among Single-Parent Households in Hostetter
| Children | Single Father | Single Mother |
| No Children | 0 (0.0%) | 0 (0.0%) |
| 1 or 2 Children | 0 (0.0%) | 0 (0.0%) |
| 3 or 4 Children | 0 (0.0%) | 0 (0.0%) |
| 5 or more Children | 0 (0.0%) | 0 (0.0%) |
| Total | 0 (0.0%) | 0 (0.0%) |
Income Below Poverty Among Married-Couple vs Single-Parent Households in Hostetter
| Children | Married-Couple Families | Single-Parent Households |
| No Children | 0 (0.0%) | 0 (0.0%) |
| 1 or 2 Children | 0 (0.0%) | 0 (0.0%) |
| 3 or 4 Children | 0 (0.0%) | 0 (0.0%) |
| 5 or more Children | 0 (0.0%) | 0 (0.0%) |
| Total | 0 (0.0%) | 0 (0.0%) |
Race in Hostetter
The most populous races in Hostetter are White / Caucasian (378 | 100.0%), and Hispanic or Latino (4 | 1.1%).
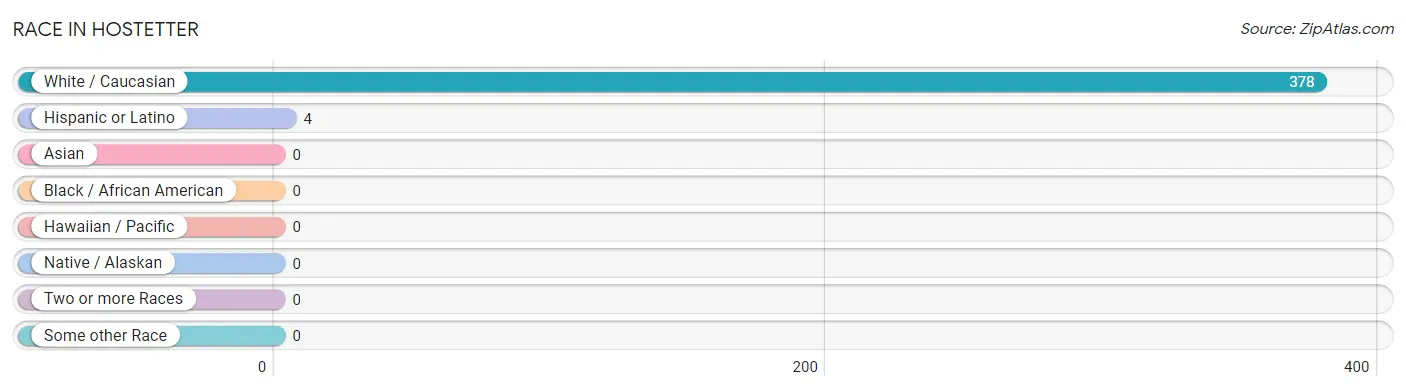
| Race | # Population | % Population |
| Asian | 0 | 0.0% |
| Black / African American | 0 | 0.0% |
| Hawaiian / Pacific | 0 | 0.0% |
| Hispanic or Latino | 4 | 1.1% |
| Native / Alaskan | 0 | 0.0% |
| White / Caucasian | 378 | 100.0% |
| Two or more Races | 0 | 0.0% |
| Some other Race | 0 | 0.0% |
| Total | 378 | 100.0% |
Ancestry in Hostetter
The most populous ancestries reported in Hostetter are Irish (118 | 31.2%), Slovak (68 | 18.0%), German (62 | 16.4%), Swedish (40 | 10.6%), and Polish (39 | 10.3%), together accounting for 86.5% of all Hostetter residents.
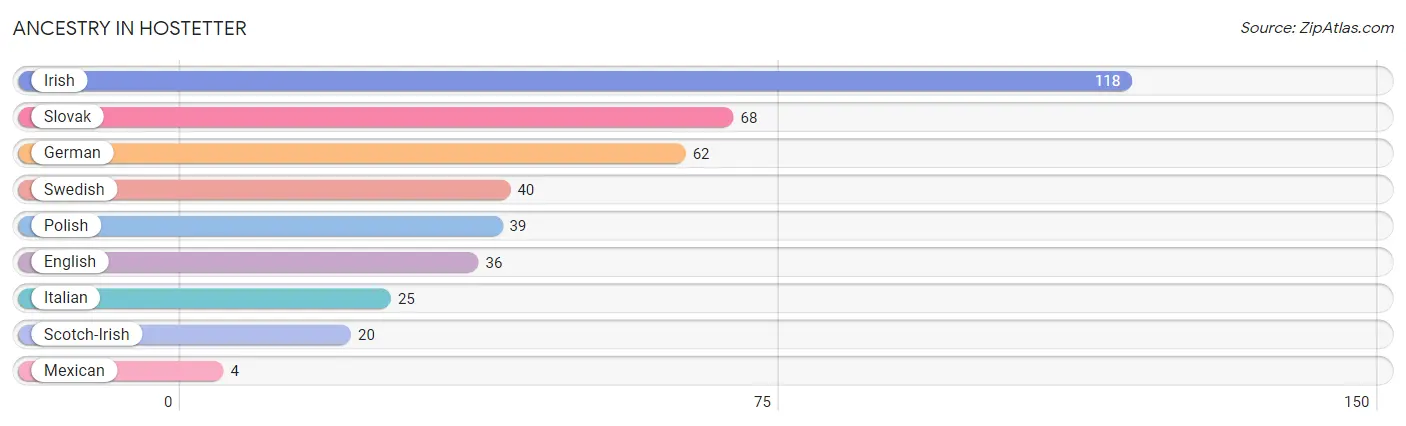
| Ancestry | # Population | % Population |
| English | 36 | 9.5% |
| German | 62 | 16.4% |
| Irish | 118 | 31.2% |
| Italian | 25 | 6.6% |
| Mexican | 4 | 1.1% |
| Polish | 39 | 10.3% |
| Scotch-Irish | 20 | 5.3% |
| Slovak | 68 | 18.0% |
| Swedish | 40 | 10.6% | View All 9 Rows |
Immigrants in Hostetter

| Immigration Origin | # Population | % Population | View All 0 Rows |
Sex and Age in Hostetter
Sex and Age in Hostetter
The most populous age groups in Hostetter are 30 to 34 Years (83 | 38.1%) for men and 30 to 34 Years (42 | 26.3%) for women.
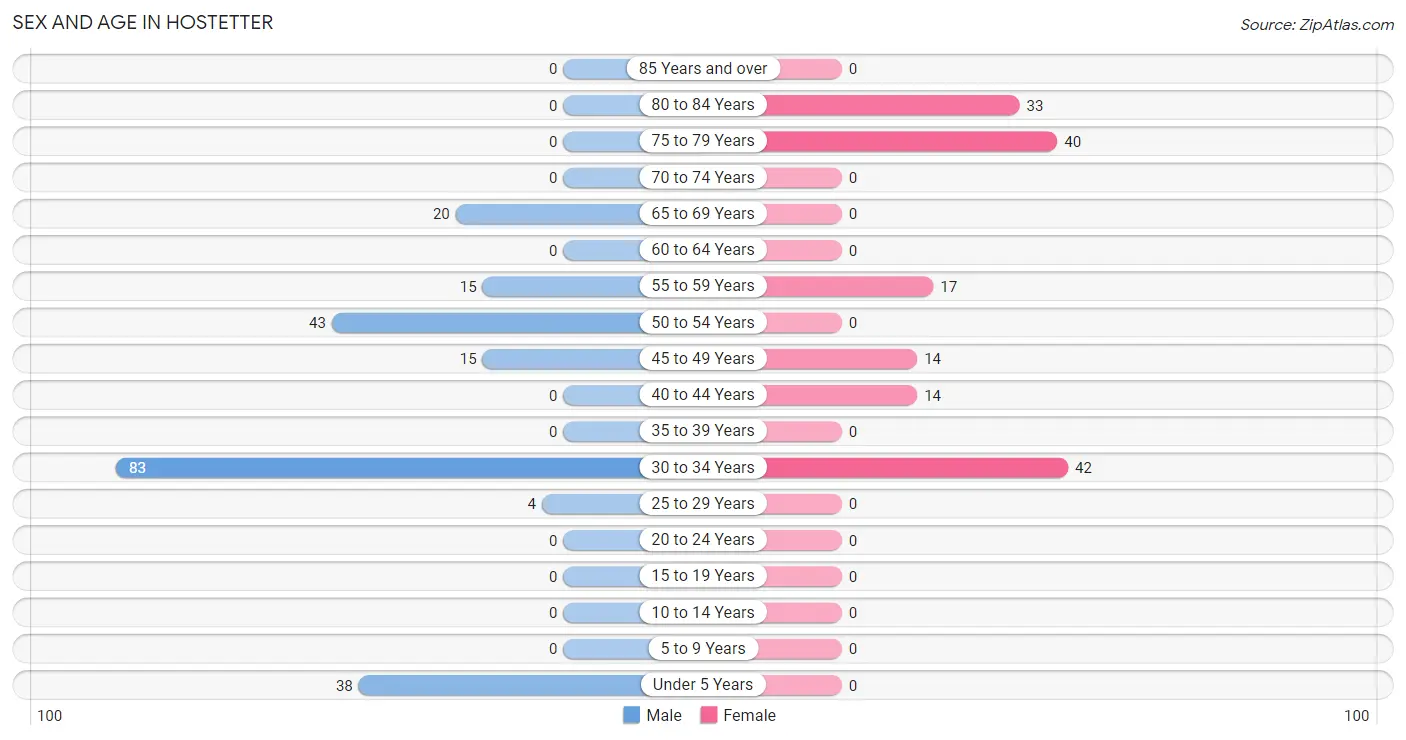
| Age Bracket | Male | Female |
| Under 5 Years | 38 (17.4%) | 0 (0.0%) |
| 5 to 9 Years | 0 (0.0%) | 0 (0.0%) |
| 10 to 14 Years | 0 (0.0%) | 0 (0.0%) |
| 15 to 19 Years | 0 (0.0%) | 0 (0.0%) |
| 20 to 24 Years | 0 (0.0%) | 0 (0.0%) |
| 25 to 29 Years | 4 (1.8%) | 0 (0.0%) |
| 30 to 34 Years | 83 (38.1%) | 42 (26.3%) |
| 35 to 39 Years | 0 (0.0%) | 0 (0.0%) |
| 40 to 44 Years | 0 (0.0%) | 14 (8.7%) |
| 45 to 49 Years | 15 (6.9%) | 14 (8.7%) |
| 50 to 54 Years | 43 (19.7%) | 0 (0.0%) |
| 55 to 59 Years | 15 (6.9%) | 17 (10.6%) |
| 60 to 64 Years | 0 (0.0%) | 0 (0.0%) |
| 65 to 69 Years | 20 (9.2%) | 0 (0.0%) |
| 70 to 74 Years | 0 (0.0%) | 0 (0.0%) |
| 75 to 79 Years | 0 (0.0%) | 40 (25.0%) |
| 80 to 84 Years | 0 (0.0%) | 33 (20.6%) |
| 85 Years and over | 0 (0.0%) | 0 (0.0%) |
| Total | 218 (100.0%) | 160 (100.0%) |
Families and Households in Hostetter
Median Family Size in Hostetter
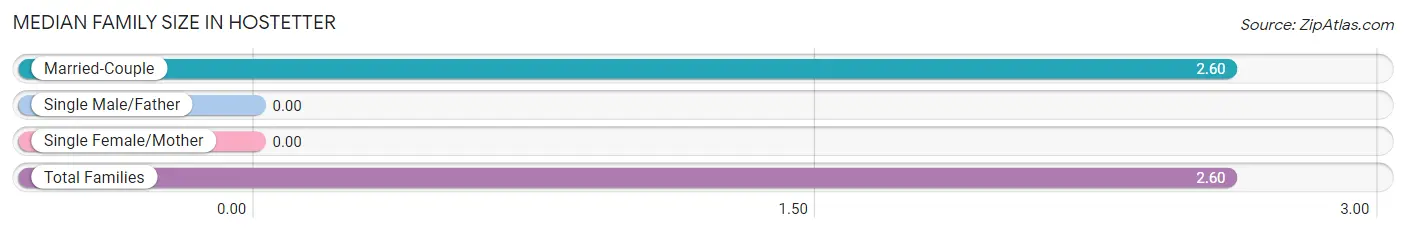
| Family Type | # Families | Family Size |
| Married-Couple | 57 (100.0%) | 2.60 |
| Single Male/Father | 0 (0.0%) | - |
| Single Female/Mother | 0 (0.0%) | - |
| Total Families | 57 (100.0%) | 2.60 |
Median Household Size in Hostetter
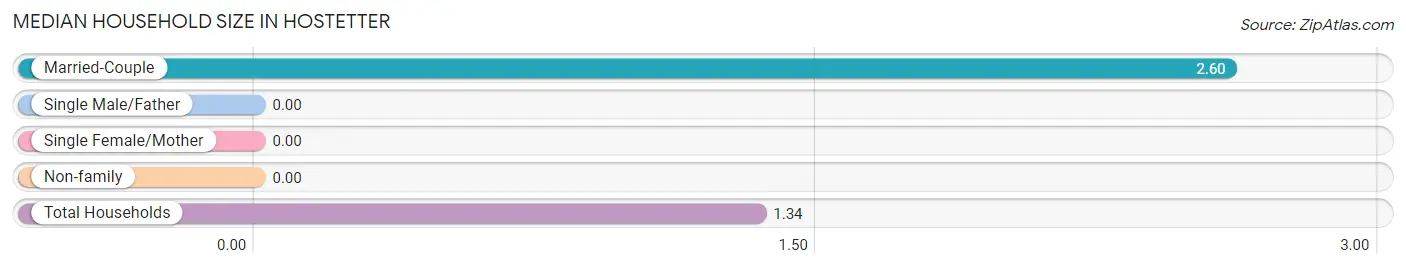
| Household Type | # Households | Household Size |
| Married-Couple | 57 (21.3%) | 2.60 |
| Single Male/Father | 0 (0.0%) | - |
| Single Female/Mother | 0 (0.0%) | - |
| Non-family | 211 (78.7%) | - |
| Total Households | 268 (100.0%) | 1.34 |
Household Size by Marriage Status in Hostetter
Out of a total of 268 households in Hostetter, 57 (21.3%) are family households, while 211 (78.7%) are nonfamily households. The most numerous type of family households are 2-person households, comprising 36, and the most common type of nonfamily households are 1-person households, comprising 211.
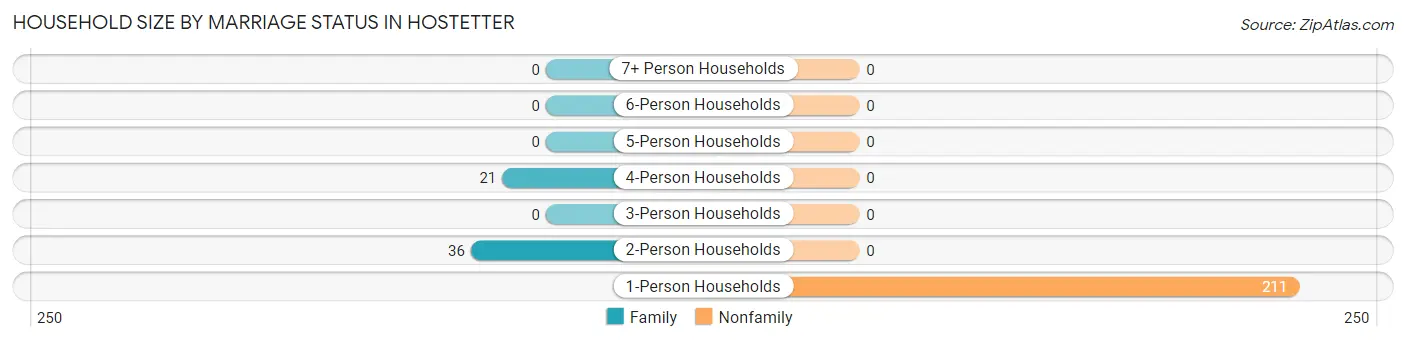
| Household Size | Family Households | Nonfamily Households |
| 1-Person Households | - | 211 (78.7%) |
| 2-Person Households | 36 (13.4%) | 0 (0.0%) |
| 3-Person Households | 0 (0.0%) | 0 (0.0%) |
| 4-Person Households | 21 (7.8%) | 0 (0.0%) |
| 5-Person Households | 0 (0.0%) | 0 (0.0%) |
| 6-Person Households | 0 (0.0%) | 0 (0.0%) |
| 7+ Person Households | 0 (0.0%) | 0 (0.0%) |
| Total | 57 (21.3%) | 211 (78.7%) |
Female Fertility in Hostetter
Fertility by Age in Hostetter
| Age Bracket | Women with Births | Births / 1,000 Women |
| 15 to 19 years | 0 (0.0%) | 0.0 |
| 20 to 34 years | 0 (0.0%) | 0.0 |
| 35 to 50 years | 0 (0.0%) | 0.0 |
| Total | 0 (0.0%) | 0.0 |
Fertility by Age by Marriage Status in Hostetter
| Age Bracket | Married | Unmarried |
| 15 to 19 years | 0 (0.0%) | 0 (0.0%) |
| 20 to 34 years | 0 (0.0%) | 0 (0.0%) |
| 35 to 50 years | 0 (0.0%) | 0 (0.0%) |
| Total | 0 (0.0%) | 0 (0.0%) |
Fertility by Education in Hostetter
| Educational Attainment | Women with Births | Births / 1,000 Women |
| Less than High School | 0 (0.0%) | 0.0 |
| High School Diploma | 0 (0.0%) | 0.0 |
| College or Associate's Degree | 0 (0.0%) | 0.0 |
| Bachelor's Degree | 0 (0.0%) | 0.0 |
| Graduate Degree | 0 (0.0%) | 0.0 |
| Total | 0 (0.0%) | 0.0 |
Fertility by Education by Marriage Status in Hostetter
| Educational Attainment | Married | Unmarried |
| Less than High School | 0 (0.0%) | 0 (0.0%) |
| High School Diploma | 0 (0.0%) | 0 (0.0%) |
| College or Associate's Degree | 0 (0.0%) | 0 (0.0%) |
| Bachelor's Degree | 0 (0.0%) | 0 (0.0%) |
| Graduate Degree | 0 (0.0%) | 0 (0.0%) |
| Total | 0 (0.0%) | 0 (0.0%) |
Employment Characteristics in Hostetter
Employment by Class of Employer in Hostetter
Among the 192 employed individuals in Hostetter, private company employees (145 | 75.5%), self-employed (not incorporated) (19 | 9.9%), and not-for-profit organizations (14 | 7.3%) make up the most common classes of employment.
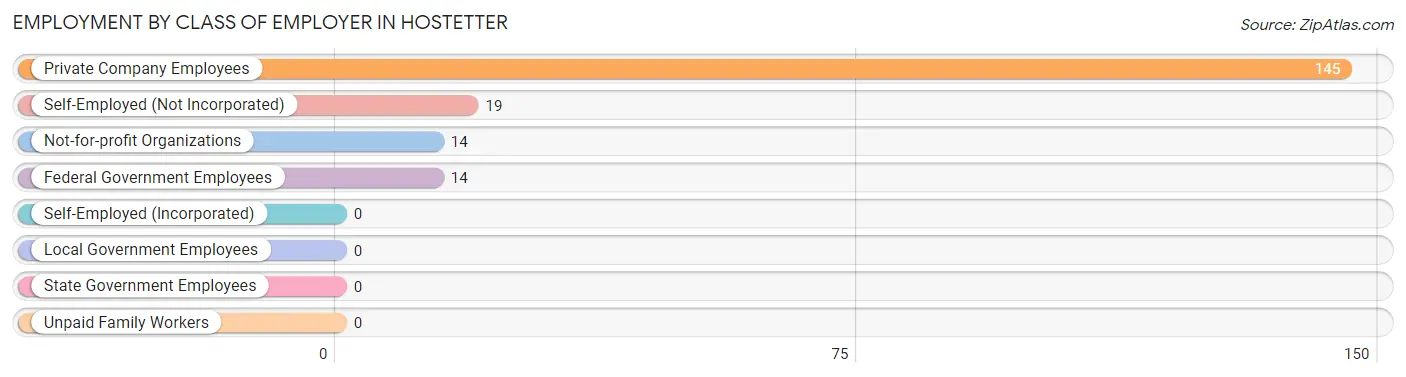
| Employer Class | # Employees | % Employees |
| Private Company Employees | 145 | 75.5% |
| Self-Employed (Incorporated) | 0 | 0.0% |
| Self-Employed (Not Incorporated) | 19 | 9.9% |
| Not-for-profit Organizations | 14 | 7.3% |
| Local Government Employees | 0 | 0.0% |
| State Government Employees | 0 | 0.0% |
| Federal Government Employees | 14 | 7.3% |
| Unpaid Family Workers | 0 | 0.0% |
| Total | 192 | 100.0% |
Employment Status by Age in Hostetter
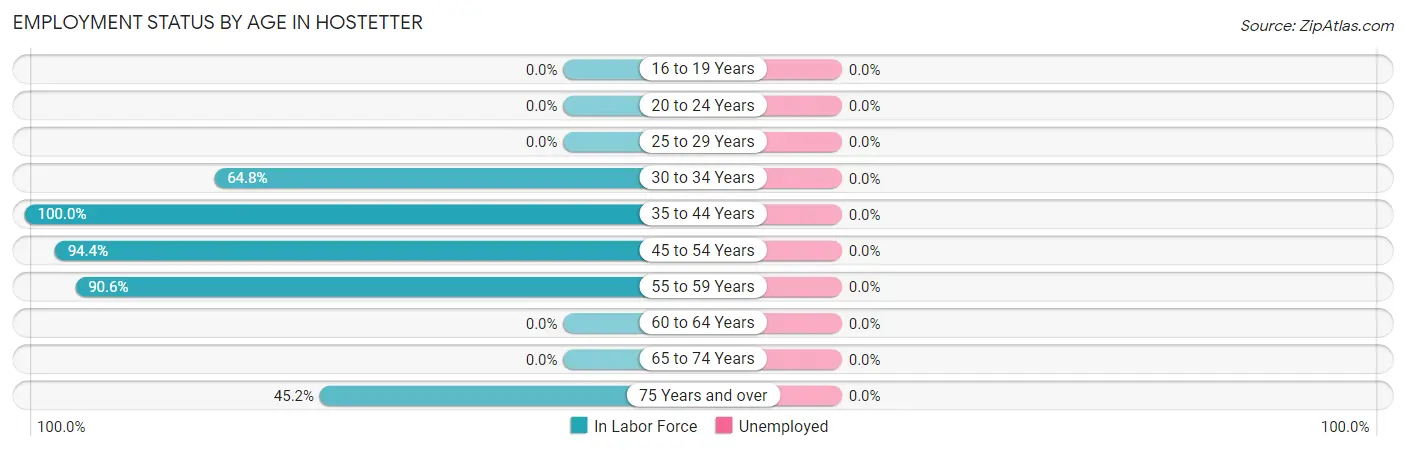
| Age Bracket | In Labor Force | Unemployed |
| 16 to 19 Years | 0 (0.0%) | 0 (0.0%) |
| 20 to 24 Years | 0 (0.0%) | 0 (0.0%) |
| 25 to 29 Years | 0 (0.0%) | 0 (0.0%) |
| 30 to 34 Years | 81 (64.8%) | 0 (0.0%) |
| 35 to 44 Years | 14 (100.0%) | 0 (0.0%) |
| 45 to 54 Years | 68 (94.4%) | 0 (0.0%) |
| 55 to 59 Years | 29 (90.6%) | 0 (0.0%) |
| 60 to 64 Years | 0 (0.0%) | 0 (0.0%) |
| 65 to 74 Years | 0 (0.0%) | 0 (0.0%) |
| 75 Years and over | 33 (45.2%) | 0 (0.0%) |
| Total | 225 (66.2%) | 0 (0.0%) |
Employment Status by Educational Attainment in Hostetter
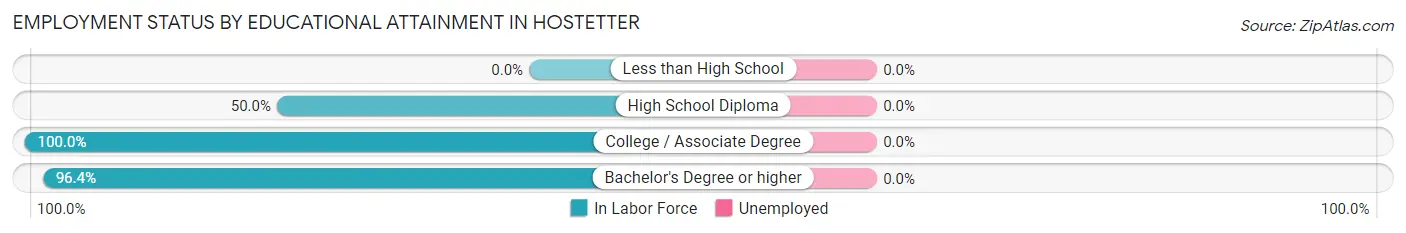
| Educational Attainment | In Labor Force | Unemployed |
| Less than High School | 0 (0.0%) | 0 (0.0%) |
| High School Diploma | 48 (50.0%) | 0 (0.0%) |
| College / Associate Degree | 36 (100.0%) | 0 (0.0%) |
| Bachelor's Degree or higher | 108 (96.4%) | 0 (0.0%) |
| Total | 192 (77.7%) | 0 (0.0%) |
Employment Occupations by Sex in Hostetter
Management, Business, Science and Arts Occupations
The most common Management, Business, Science and Arts occupations in Hostetter are Health Diagnosing & Treating (42 | 18.7%), Management (34 | 15.1%), and Health Technologists (21 | 9.3%).
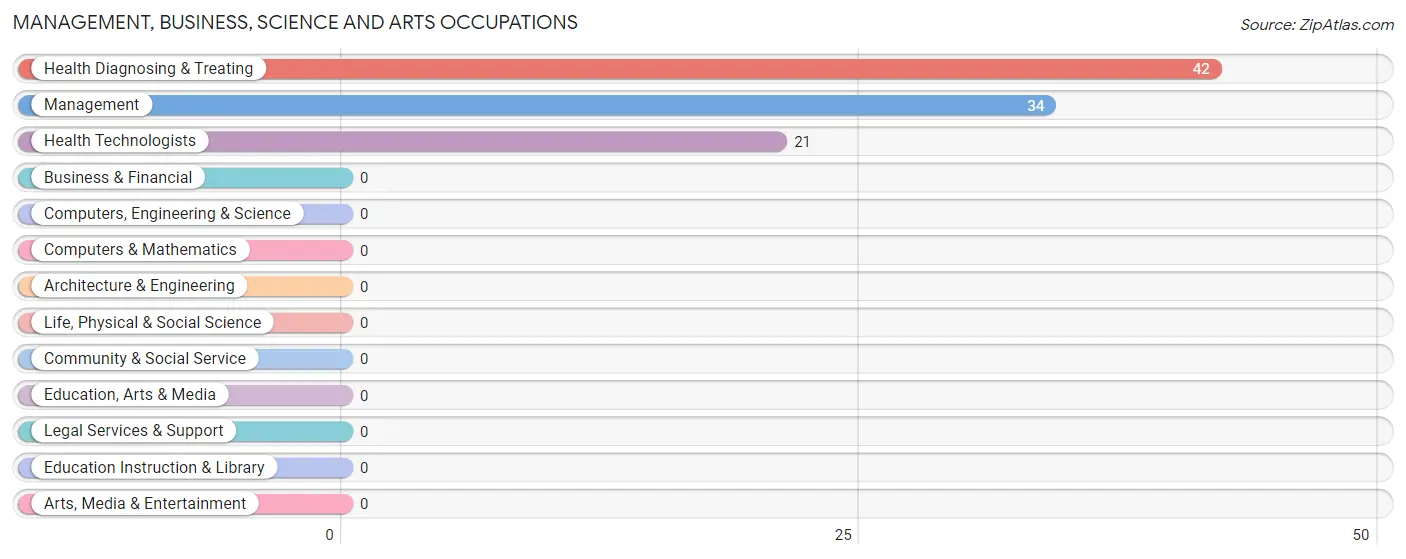
Management, Business, Science and Arts Occupations by Sex
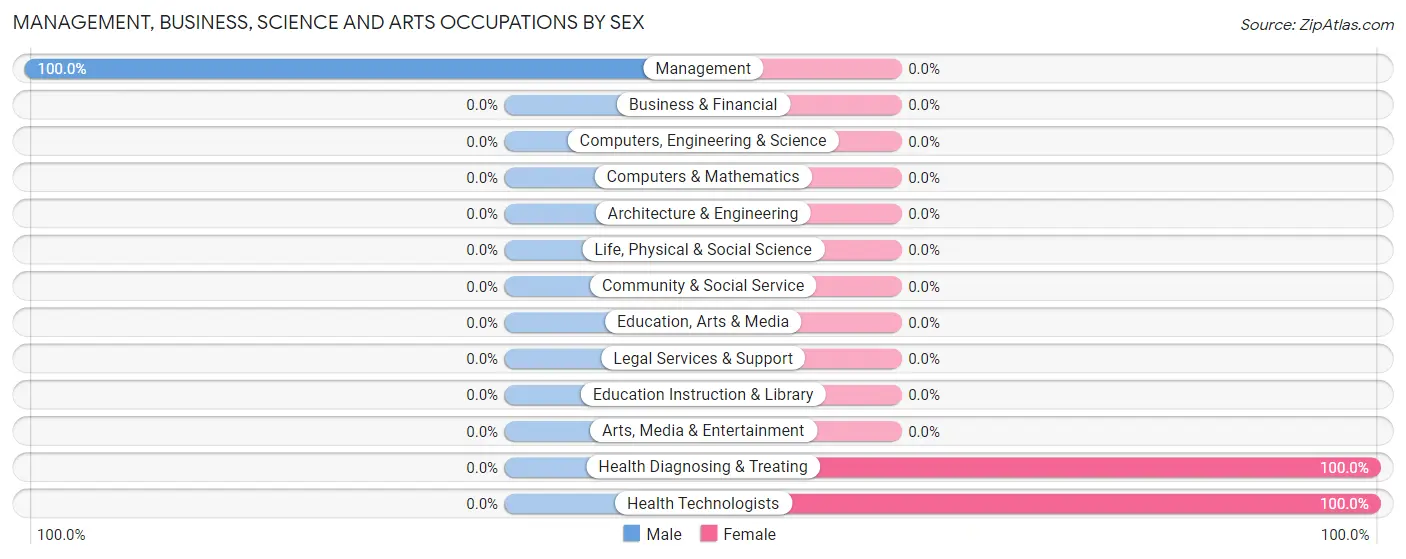
| Occupation | Male | Female |
| Management | 34 (100.0%) | 0 (0.0%) |
| Business & Financial | 0 (0.0%) | 0 (0.0%) |
| Computers, Engineering & Science | 0 (0.0%) | 0 (0.0%) |
| Computers & Mathematics | 0 (0.0%) | 0 (0.0%) |
| Architecture & Engineering | 0 (0.0%) | 0 (0.0%) |
| Life, Physical & Social Science | 0 (0.0%) | 0 (0.0%) |
| Community & Social Service | 0 (0.0%) | 0 (0.0%) |
| Education, Arts & Media | 0 (0.0%) | 0 (0.0%) |
| Legal Services & Support | 0 (0.0%) | 0 (0.0%) |
| Education Instruction & Library | 0 (0.0%) | 0 (0.0%) |
| Arts, Media & Entertainment | 0 (0.0%) | 0 (0.0%) |
| Health Diagnosing & Treating | 0 (0.0%) | 42 (100.0%) |
| Health Technologists | 0 (0.0%) | 21 (100.0%) |
| Total (Category) | 34 (44.7%) | 42 (55.3%) |
| Total (Overall) | 108 (48.0%) | 117 (52.0%) |
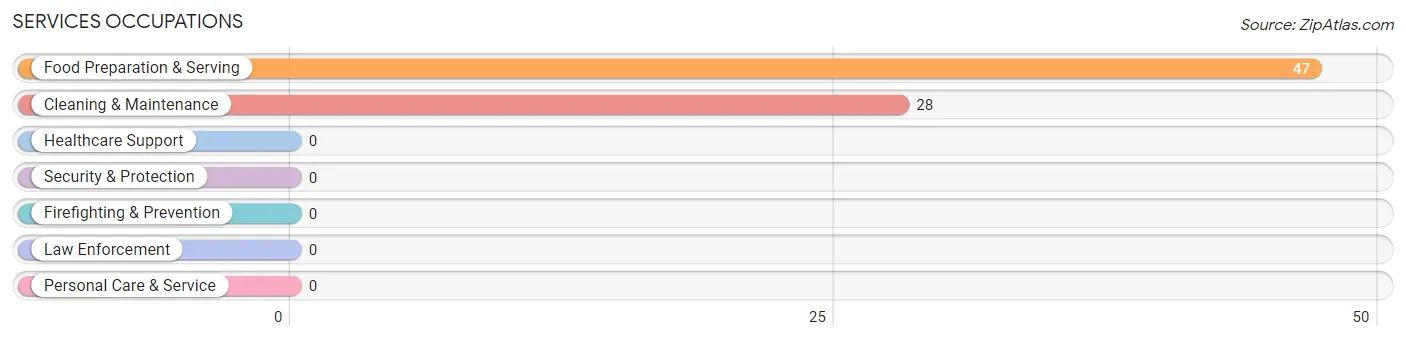
Services Occupations
The most common Services occupations in Hostetter are Food Preparation & Serving (47 | 20.9%), and Cleaning & Maintenance (28 | 12.4%).
Services Occupations by Sex
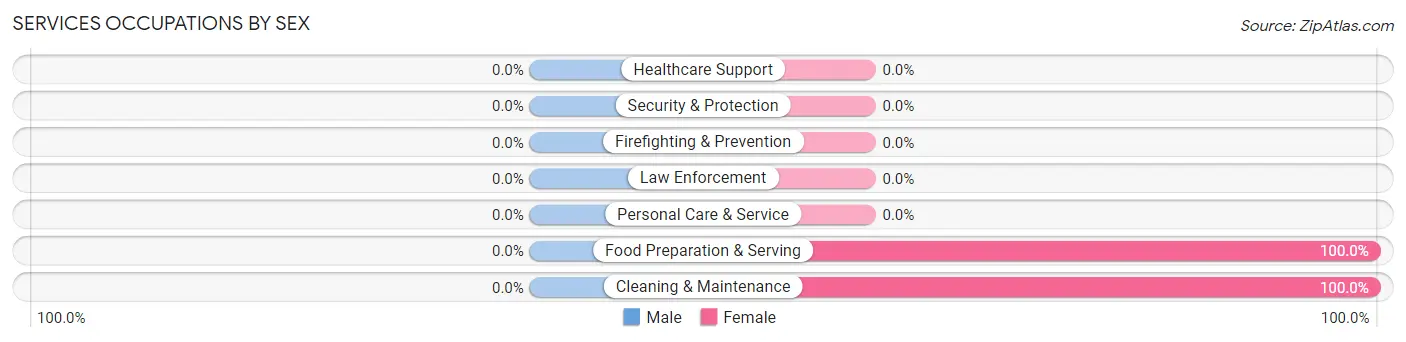
| Occupation | Male | Female |
| Healthcare Support | 0 (0.0%) | 0 (0.0%) |
| Security & Protection | 0 (0.0%) | 0 (0.0%) |
| Firefighting & Prevention | 0 (0.0%) | 0 (0.0%) |
| Law Enforcement | 0 (0.0%) | 0 (0.0%) |
| Food Preparation & Serving | 0 (0.0%) | 47 (100.0%) |
| Cleaning & Maintenance | 0 (0.0%) | 28 (100.0%) |
| Personal Care & Service | 0 (0.0%) | 0 (0.0%) |
| Total (Category) | 0 (0.0%) | 75 (100.0%) |
| Total (Overall) | 108 (48.0%) | 117 (52.0%) |
Sales and Office Occupations
The most common Sales and Office occupations in Hostetter are , and Sales & Related (20 | 8.9%).
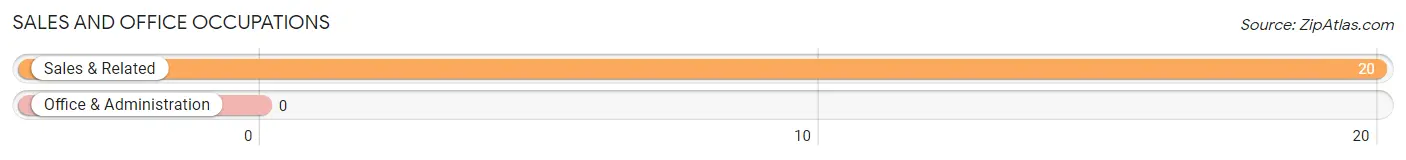
Sales and Office Occupations by Sex
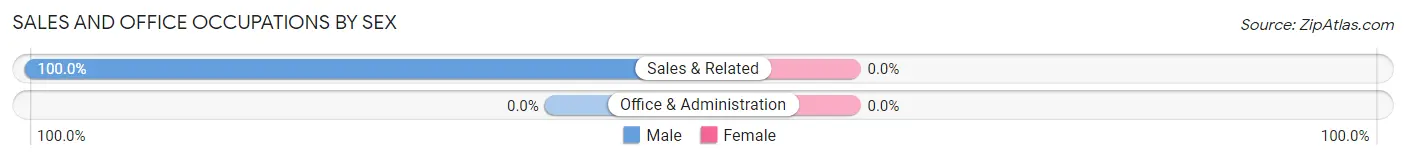
| Occupation | Male | Female |
| Sales & Related | 20 (100.0%) | 0 (0.0%) |
| Office & Administration | 0 (0.0%) | 0 (0.0%) |
| Total (Category) | 20 (100.0%) | 0 (0.0%) |
| Total (Overall) | 108 (48.0%) | 117 (52.0%) |
Natural Resources, Construction and Maintenance Occupations
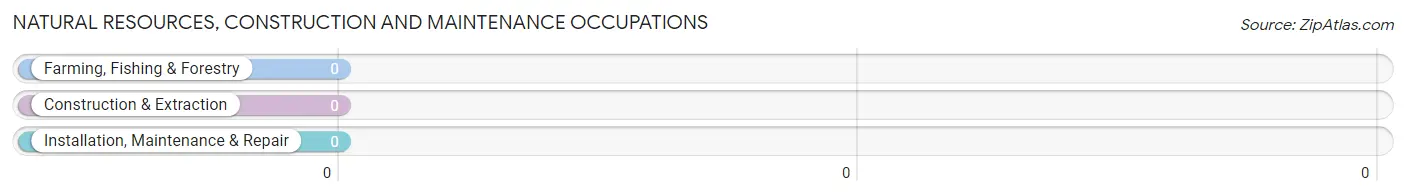
Natural Resources, Construction and Maintenance Occupations by Sex
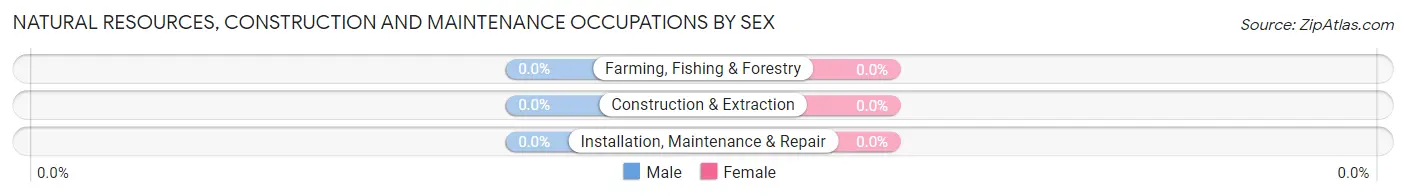
| Occupation | Male | Female |
| Farming, Fishing & Forestry | 0 (0.0%) | 0 (0.0%) |
| Construction & Extraction | 0 (0.0%) | 0 (0.0%) |
| Installation, Maintenance & Repair | 0 (0.0%) | 0 (0.0%) |
| Total (Category) | 0 (0.0%) | 0 (0.0%) |
| Total (Overall) | 108 (48.0%) | 117 (52.0%) |
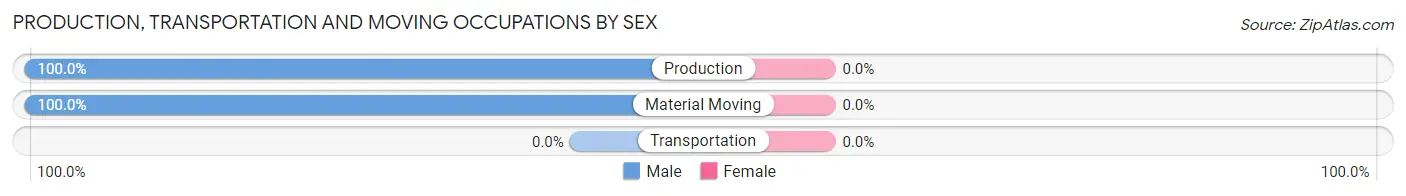
Production, Transportation and Moving Occupations
The most common Production, Transportation and Moving occupations in Hostetter are Material Moving (39 | 17.3%), and Production (15 | 6.7%).
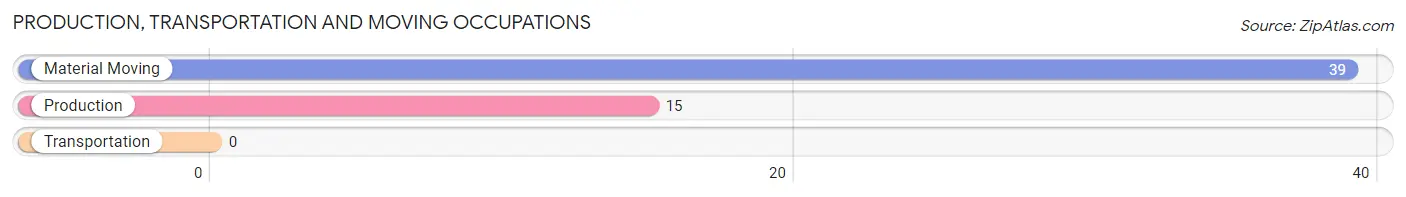
Production, Transportation and Moving Occupations by Sex
| Occupation | Male | Female |
| Production | 15 (100.0%) | 0 (0.0%) |
| Transportation | 0 (0.0%) | 0 (0.0%) |
| Material Moving | 39 (100.0%) | 0 (0.0%) |
| Total (Category) | 54 (100.0%) | 0 (0.0%) |
| Total (Overall) | 108 (48.0%) | 117 (52.0%) |
Employment Industries by Sex in Hostetter
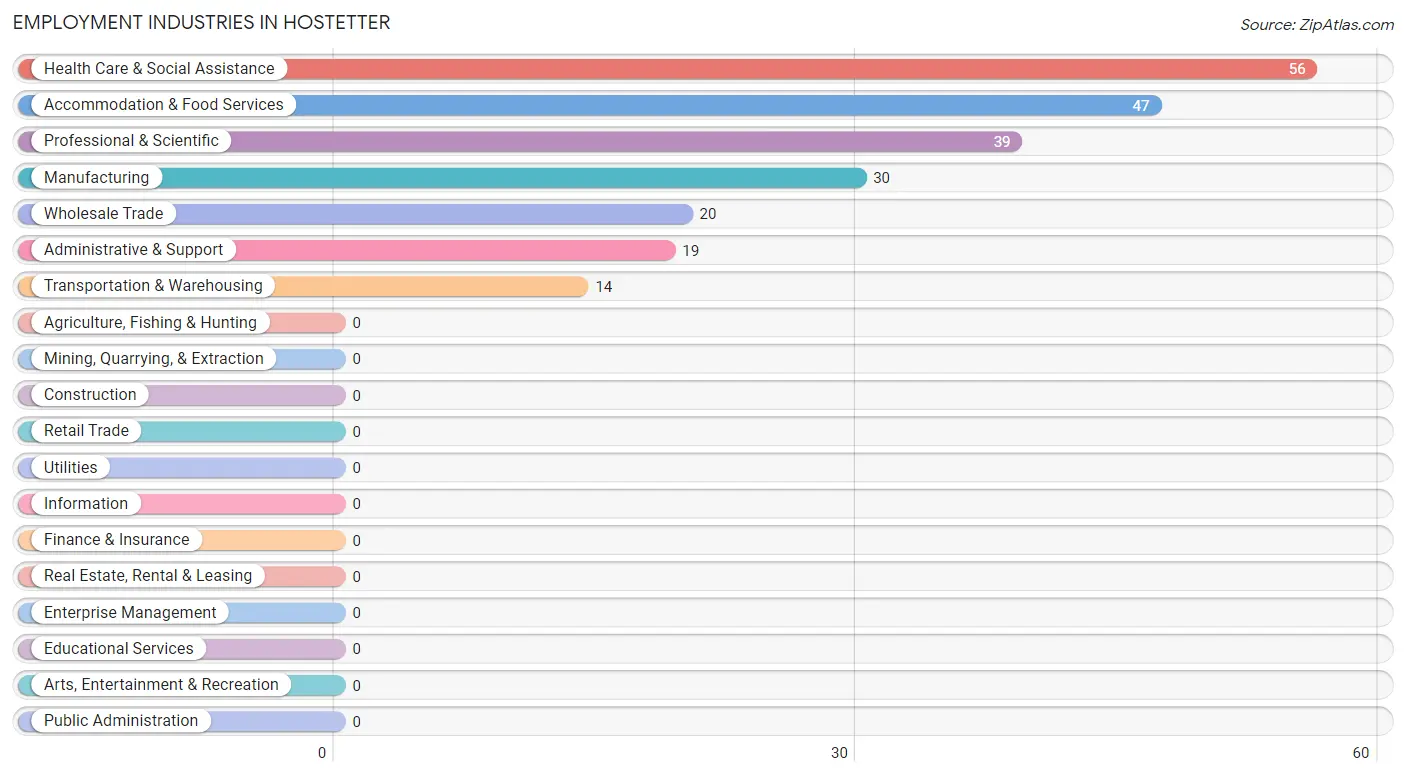
Employment Industries in Hostetter
The major employment industries in Hostetter include Health Care & Social Assistance (56 | 24.9%), Accommodation & Food Services (47 | 20.9%), Professional & Scientific (39 | 17.3%), Manufacturing (30 | 13.3%), and Wholesale Trade (20 | 8.9%).
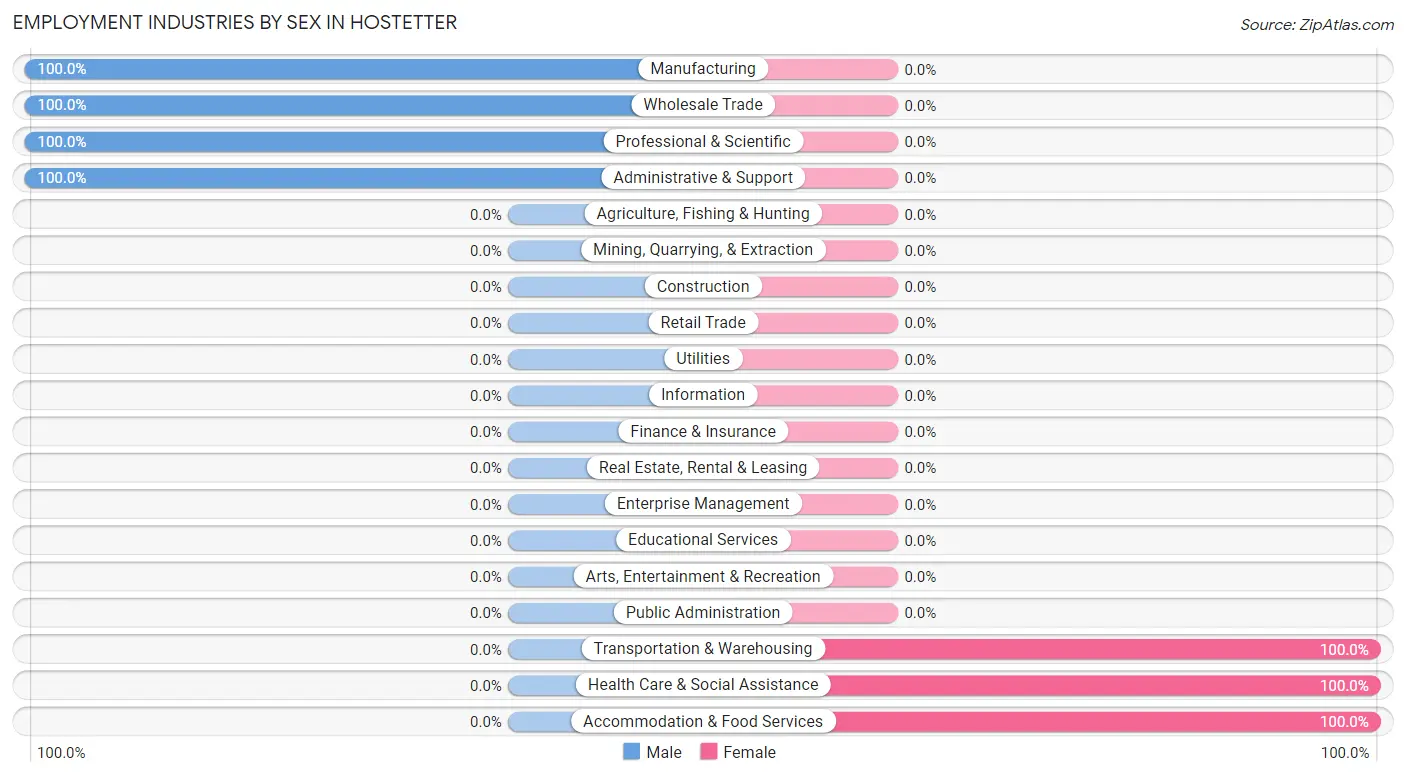
Employment Industries by Sex in Hostetter
The Hostetter industries that see more men than women are Manufacturing (100.0%), Wholesale Trade (100.0%), and Professional & Scientific (100.0%), whereas the industries that tend to have a higher number of women are Transportation & Warehousing (100.0%), Health Care & Social Assistance (100.0%), and Accommodation & Food Services (100.0%).
| Industry | Male | Female |
| Agriculture, Fishing & Hunting | 0 (0.0%) | 0 (0.0%) |
| Mining, Quarrying, & Extraction | 0 (0.0%) | 0 (0.0%) |
| Construction | 0 (0.0%) | 0 (0.0%) |
| Manufacturing | 30 (100.0%) | 0 (0.0%) |
| Wholesale Trade | 20 (100.0%) | 0 (0.0%) |
| Retail Trade | 0 (0.0%) | 0 (0.0%) |
| Transportation & Warehousing | 0 (0.0%) | 14 (100.0%) |
| Utilities | 0 (0.0%) | 0 (0.0%) |
| Information | 0 (0.0%) | 0 (0.0%) |
| Finance & Insurance | 0 (0.0%) | 0 (0.0%) |
| Real Estate, Rental & Leasing | 0 (0.0%) | 0 (0.0%) |
| Professional & Scientific | 39 (100.0%) | 0 (0.0%) |
| Enterprise Management | 0 (0.0%) | 0 (0.0%) |
| Administrative & Support | 19 (100.0%) | 0 (0.0%) |
| Educational Services | 0 (0.0%) | 0 (0.0%) |
| Health Care & Social Assistance | 0 (0.0%) | 56 (100.0%) |
| Arts, Entertainment & Recreation | 0 (0.0%) | 0 (0.0%) |
| Accommodation & Food Services | 0 (0.0%) | 47 (100.0%) |
| Public Administration | 0 (0.0%) | 0 (0.0%) |
| Total | 108 (48.0%) | 117 (52.0%) |
Education in Hostetter
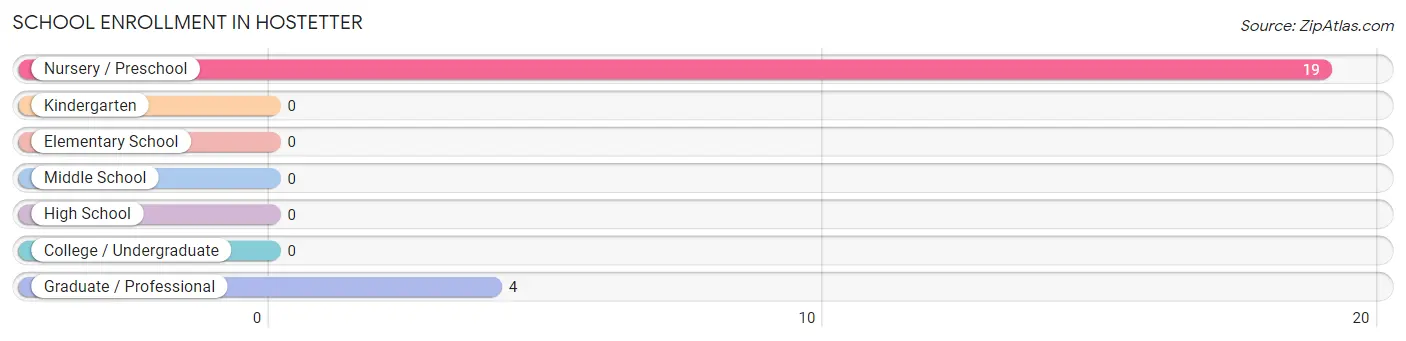
School Enrollment in Hostetter
The most common levels of schooling among the 23 students in Hostetter are nursery / preschool (19 | 82.6%), and graduate / professional (4 | 17.4%).
| School Level | # Students | % Students |
| Nursery / Preschool | 19 | 82.6% |
| Kindergarten | 0 | 0.0% |
| Elementary School | 0 | 0.0% |
| Middle School | 0 | 0.0% |
| High School | 0 | 0.0% |
| College / Undergraduate | 0 | 0.0% |
| Graduate / Professional | 4 | 17.4% |
| Total | 23 | 100.0% |
School Enrollment by Age by Funding Source in Hostetter
Out of a total of 23 students who are enrolled in schools in Hostetter, 4 (17.4%) attend a private institution, while the remaining 19 (82.6%) are enrolled in public schools. The age group of 25 to 34 year olds has the highest likelihood of being enrolled in private schools, with 4 (100.0% in the age bracket) enrolled. Conversely, the age group of 3 to 4 year olds has the lowest likelihood of being enrolled in a private school, with 19 (100.0% in the age bracket) attending a public institution.
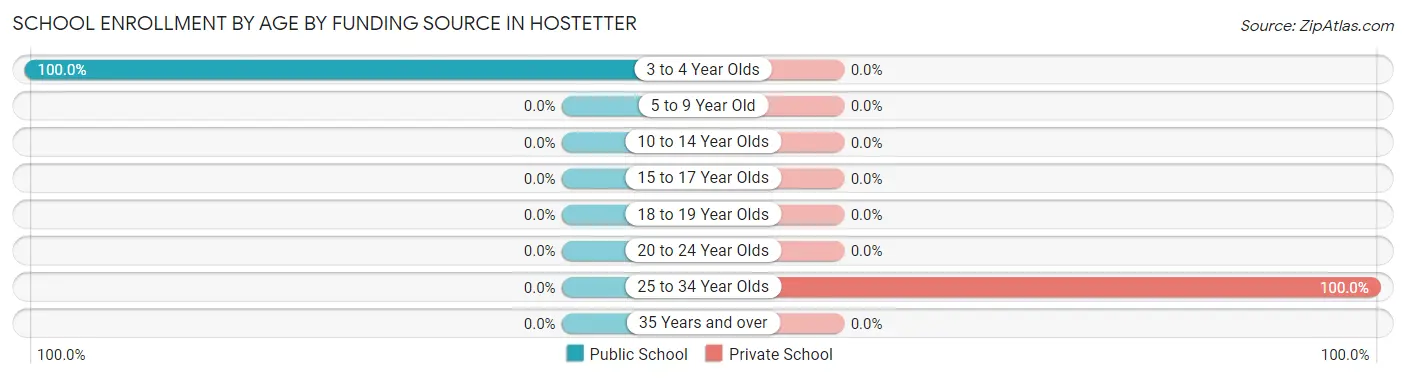
| Age Bracket | Public School | Private School |
| 3 to 4 Year Olds | 19 (100.0%) | 0 (0.0%) |
| 5 to 9 Year Old | 0 (0.0%) | 0 (0.0%) |
| 10 to 14 Year Olds | 0 (0.0%) | 0 (0.0%) |
| 15 to 17 Year Olds | 0 (0.0%) | 0 (0.0%) |
| 18 to 19 Year Olds | 0 (0.0%) | 0 (0.0%) |
| 20 to 24 Year Olds | 0 (0.0%) | 0 (0.0%) |
| 25 to 34 Year Olds | 0 (0.0%) | 4 (100.0%) |
| 35 Years and over | 0 (0.0%) | 0 (0.0%) |
| Total | 19 (82.6%) | 4 (17.4%) |
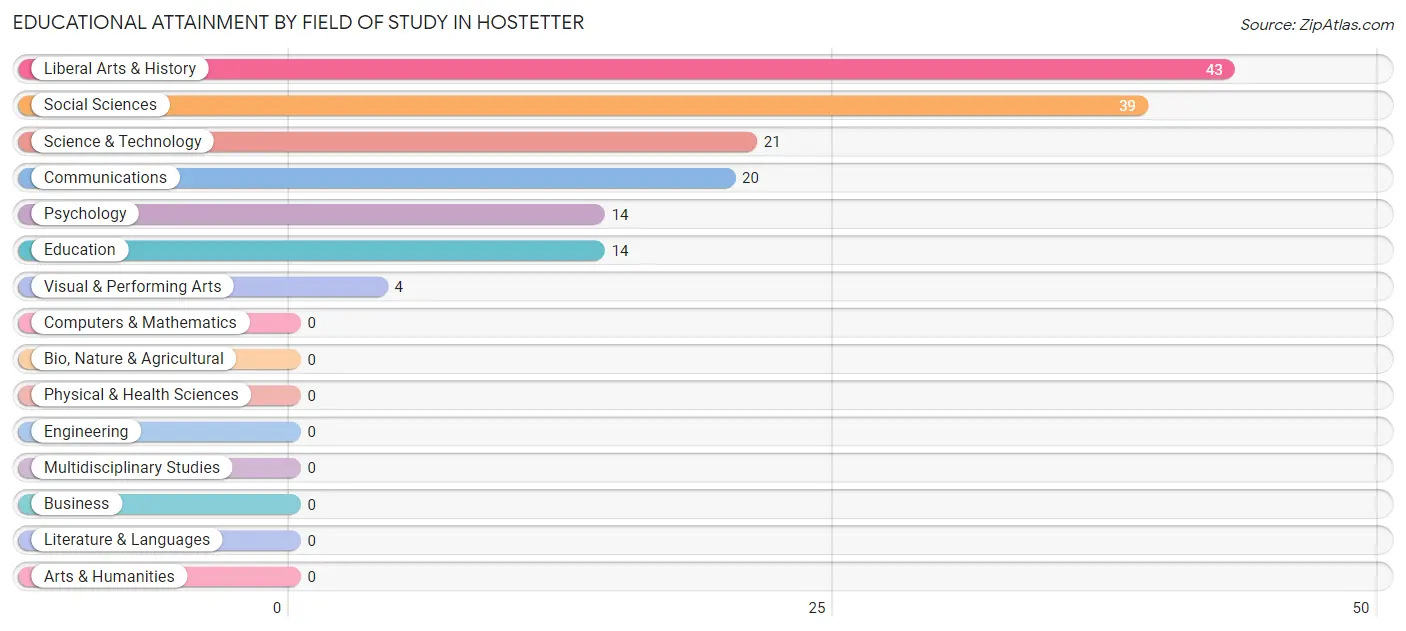
Educational Attainment by Field of Study in Hostetter
Liberal arts & history (43 | 27.7%), social sciences (39 | 25.2%), science & technology (21 | 13.6%), communications (20 | 12.9%), and psychology (14 | 9.0%) are the most common fields of study among 155 individuals in Hostetter who have obtained a bachelor's degree or higher.
| Field of Study | # Graduates | % Graduates |
| Computers & Mathematics | 0 | 0.0% |
| Bio, Nature & Agricultural | 0 | 0.0% |
| Physical & Health Sciences | 0 | 0.0% |
| Psychology | 14 | 9.0% |
| Social Sciences | 39 | 25.2% |
| Engineering | 0 | 0.0% |
| Multidisciplinary Studies | 0 | 0.0% |
| Science & Technology | 21 | 13.6% |
| Business | 0 | 0.0% |
| Education | 14 | 9.0% |
| Literature & Languages | 0 | 0.0% |
| Liberal Arts & History | 43 | 27.7% |
| Visual & Performing Arts | 4 | 2.6% |
| Communications | 20 | 12.9% |
| Arts & Humanities | 0 | 0.0% |
| Total | 155 | 100.0% |
Transportation & Commute in Hostetter
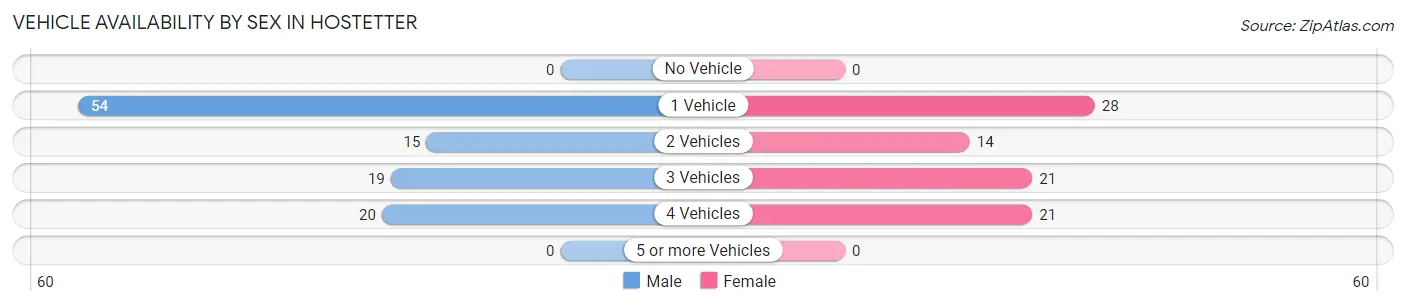
Vehicle Availability by Sex in Hostetter
The most prevalent vehicle ownership categories in Hostetter are males with 1 vehicle (54, accounting for 50.0%) and females with 1 vehicle (28, making up 64.3%).
| Vehicles Available | Male | Female |
| No Vehicle | 0 (0.0%) | 0 (0.0%) |
| 1 Vehicle | 54 (50.0%) | 28 (33.3%) |
| 2 Vehicles | 15 (13.9%) | 14 (16.7%) |
| 3 Vehicles | 19 (17.6%) | 21 (25.0%) |
| 4 Vehicles | 20 (18.5%) | 21 (25.0%) |
| 5 or more Vehicles | 0 (0.0%) | 0 (0.0%) |
| Total | 108 (100.0%) | 84 (100.0%) |
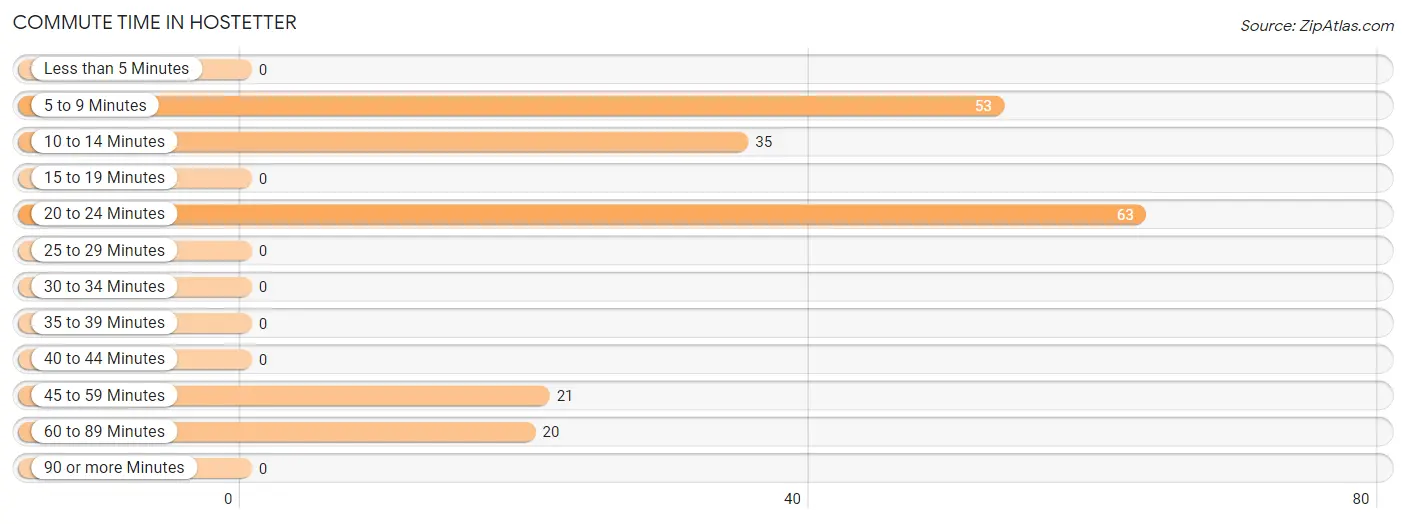
Commute Time in Hostetter
The most frequently occuring commute durations in Hostetter are 20 to 24 minutes (63 commuters, 32.8%), 5 to 9 minutes (53 commuters, 27.6%), and 10 to 14 minutes (35 commuters, 18.2%).
| Commute Time | # Commuters | % Commuters |
| Less than 5 Minutes | 0 | 0.0% |
| 5 to 9 Minutes | 53 | 27.6% |
| 10 to 14 Minutes | 35 | 18.2% |
| 15 to 19 Minutes | 0 | 0.0% |
| 20 to 24 Minutes | 63 | 32.8% |
| 25 to 29 Minutes | 0 | 0.0% |
| 30 to 34 Minutes | 0 | 0.0% |
| 35 to 39 Minutes | 0 | 0.0% |
| 40 to 44 Minutes | 0 | 0.0% |
| 45 to 59 Minutes | 21 | 10.9% |
| 60 to 89 Minutes | 20 | 10.4% |
| 90 or more Minutes | 0 | 0.0% |
Commute Time by Sex in Hostetter
The most common commute times in Hostetter are 20 to 24 minutes (49 commuters, 45.4%) for males and 10 to 14 minutes (35 commuters, 41.7%) for females.
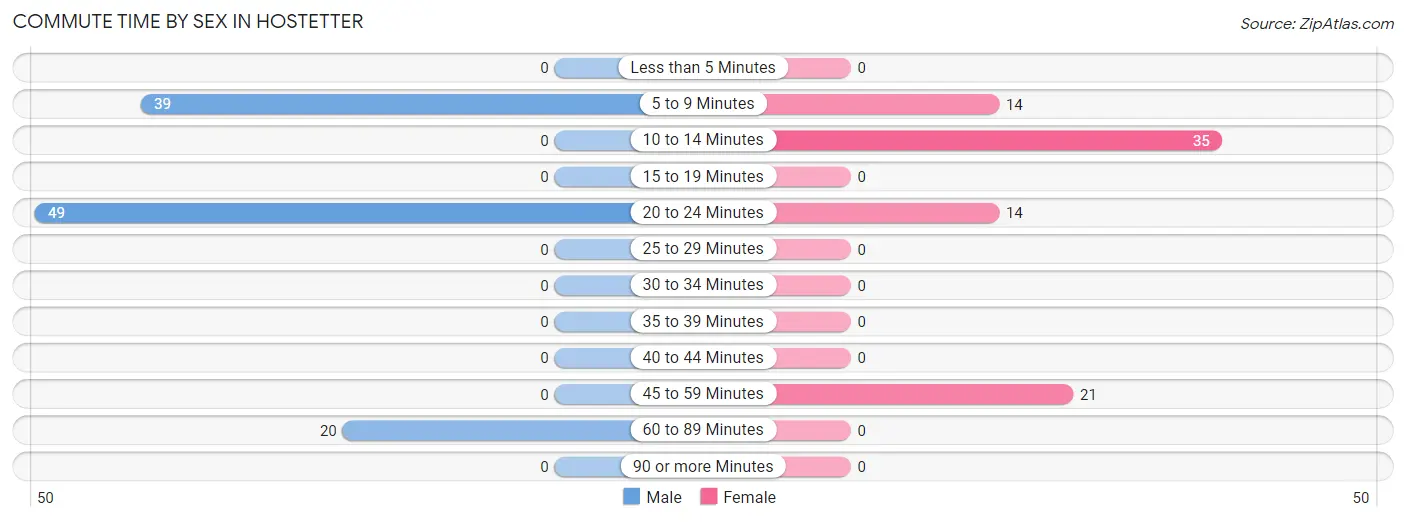
| Commute Time | Male | Female |
| Less than 5 Minutes | 0 (0.0%) | 0 (0.0%) |
| 5 to 9 Minutes | 39 (36.1%) | 14 (16.7%) |
| 10 to 14 Minutes | 0 (0.0%) | 35 (41.7%) |
| 15 to 19 Minutes | 0 (0.0%) | 0 (0.0%) |
| 20 to 24 Minutes | 49 (45.4%) | 14 (16.7%) |
| 25 to 29 Minutes | 0 (0.0%) | 0 (0.0%) |
| 30 to 34 Minutes | 0 (0.0%) | 0 (0.0%) |
| 35 to 39 Minutes | 0 (0.0%) | 0 (0.0%) |
| 40 to 44 Minutes | 0 (0.0%) | 0 (0.0%) |
| 45 to 59 Minutes | 0 (0.0%) | 21 (25.0%) |
| 60 to 89 Minutes | 20 (18.5%) | 0 (0.0%) |
| 90 or more Minutes | 0 (0.0%) | 0 (0.0%) |
Time of Departure to Work by Sex in Hostetter
The most frequent times of departure to work in Hostetter are 5:00 AM to 5:29 AM (39, 36.1%) for males and 5:00 AM to 5:29 AM (21, 25.0%) for females.
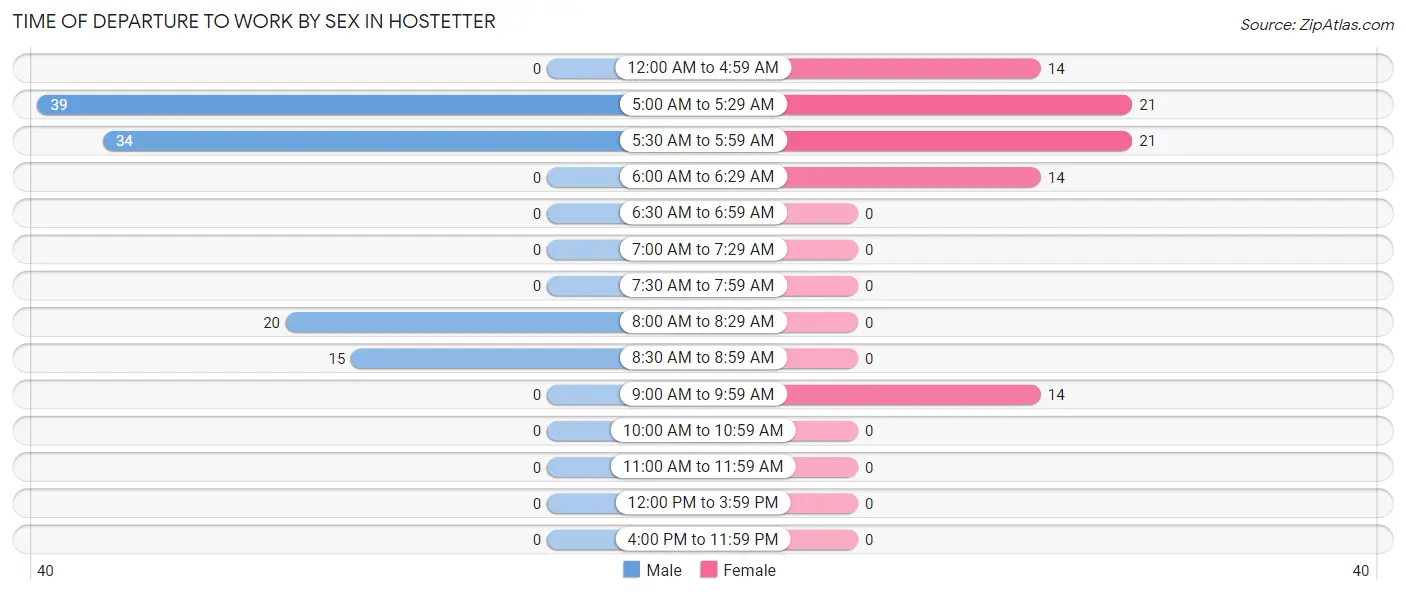
| Time of Departure | Male | Female |
| 12:00 AM to 4:59 AM | 0 (0.0%) | 14 (16.7%) |
| 5:00 AM to 5:29 AM | 39 (36.1%) | 21 (25.0%) |
| 5:30 AM to 5:59 AM | 34 (31.5%) | 21 (25.0%) |
| 6:00 AM to 6:29 AM | 0 (0.0%) | 14 (16.7%) |
| 6:30 AM to 6:59 AM | 0 (0.0%) | 0 (0.0%) |
| 7:00 AM to 7:29 AM | 0 (0.0%) | 0 (0.0%) |
| 7:30 AM to 7:59 AM | 0 (0.0%) | 0 (0.0%) |
| 8:00 AM to 8:29 AM | 20 (18.5%) | 0 (0.0%) |
| 8:30 AM to 8:59 AM | 15 (13.9%) | 0 (0.0%) |
| 9:00 AM to 9:59 AM | 0 (0.0%) | 14 (16.7%) |
| 10:00 AM to 10:59 AM | 0 (0.0%) | 0 (0.0%) |
| 11:00 AM to 11:59 AM | 0 (0.0%) | 0 (0.0%) |
| 12:00 PM to 3:59 PM | 0 (0.0%) | 0 (0.0%) |
| 4:00 PM to 11:59 PM | 0 (0.0%) | 0 (0.0%) |
| Total | 108 (100.0%) | 84 (100.0%) |
Housing Occupancy in Hostetter
Occupancy by Ownership in Hostetter
Of the total 268 dwellings in Hostetter, owner-occupied units account for 181 (67.5%), while renter-occupied units make up 87 (32.5%).
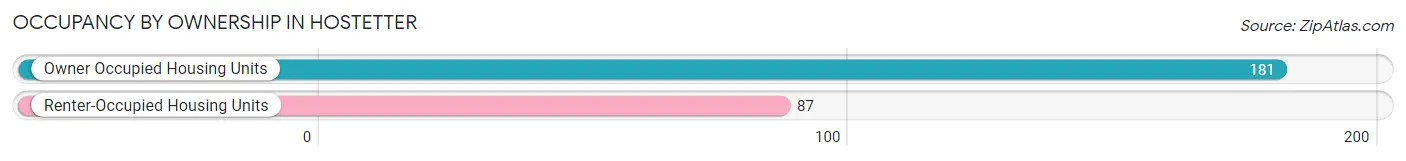
| Occupancy | # Housing Units | % Housing Units |
| Owner Occupied Housing Units | 181 | 67.5% |
| Renter-Occupied Housing Units | 87 | 32.5% |
| Total Occupied Housing Units | 268 | 100.0% |
Occupancy by Household Size in Hostetter
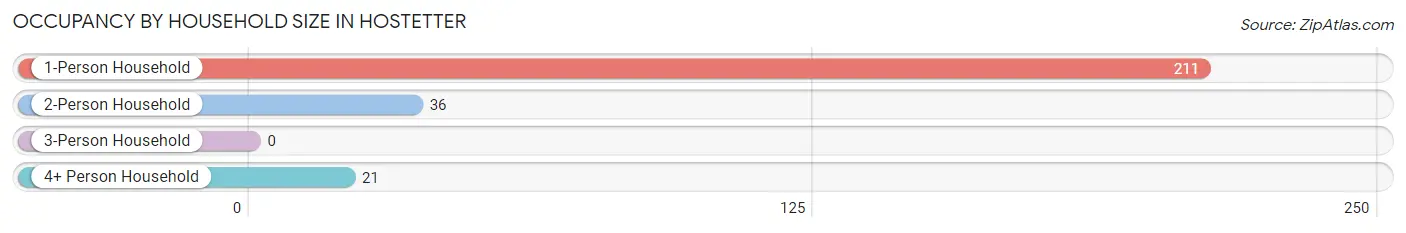
| Household Size | # Housing Units | % Housing Units |
| 1-Person Household | 211 | 78.7% |
| 2-Person Household | 36 | 13.4% |
| 3-Person Household | 0 | 0.0% |
| 4+ Person Household | 21 | 7.8% |
| Total Housing Units | 268 | 100.0% |
Occupancy by Ownership by Household Size in Hostetter
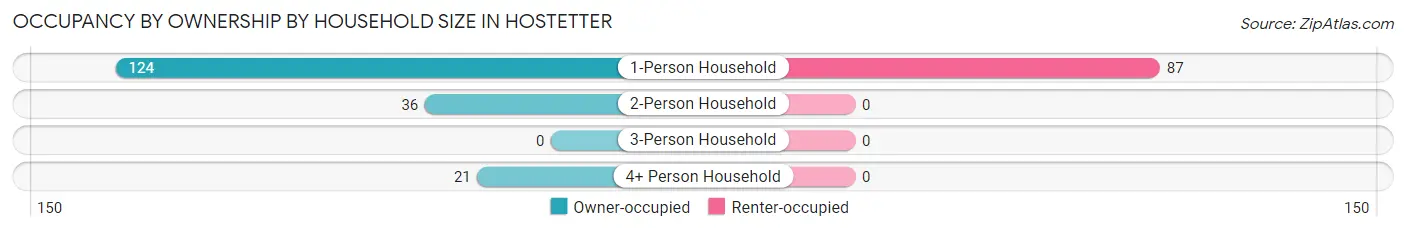
| Household Size | Owner-occupied | Renter-occupied |
| 1-Person Household | 124 (58.8%) | 87 (41.2%) |
| 2-Person Household | 36 (100.0%) | 0 (0.0%) |
| 3-Person Household | 0 (0.0%) | 0 (0.0%) |
| 4+ Person Household | 21 (100.0%) | 0 (0.0%) |
| Total Housing Units | 181 (67.5%) | 87 (32.5%) |
Occupancy by Educational Attainment in Hostetter
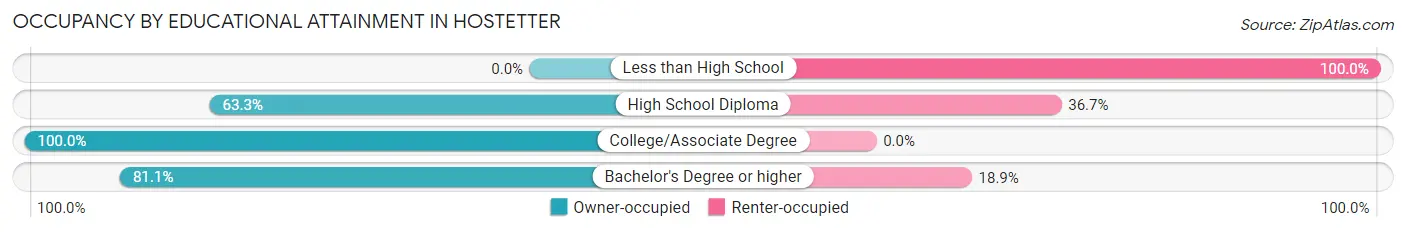
| Household Size | Owner-occupied | Renter-occupied |
| Less than High School | 0 (0.0%) | 33 (100.0%) |
| High School Diploma | 69 (63.3%) | 40 (36.7%) |
| College/Associate Degree | 52 (100.0%) | 0 (0.0%) |
| Bachelor's Degree or higher | 60 (81.1%) | 14 (18.9%) |
Occupancy by Age of Householder in Hostetter
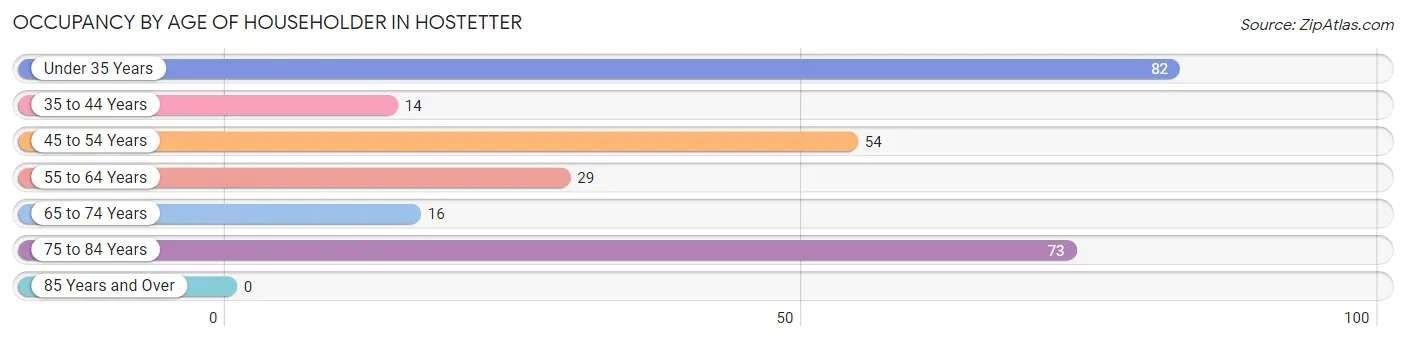
| Age Bracket | # Households | % Households |
| Under 35 Years | 82 | 30.6% |
| 35 to 44 Years | 14 | 5.2% |
| 45 to 54 Years | 54 | 20.2% |
| 55 to 64 Years | 29 | 10.8% |
| 65 to 74 Years | 16 | 6.0% |
| 75 to 84 Years | 73 | 27.2% |
| 85 Years and Over | 0 | 0.0% |
| Total | 268 | 100.0% |
Housing Finances in Hostetter
Median Income by Occupancy in Hostetter
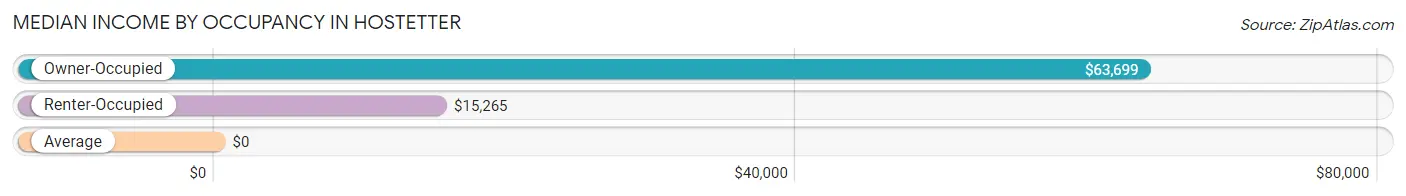
| Occupancy Type | # Households | Median Income |
| Owner-Occupied | 181 (67.5%) | $63,699 |
| Renter-Occupied | 87 (32.5%) | $15,265 |
| Average | 268 (100.0%) | $0 |
Occupancy by Householder Income Bracket in Hostetter
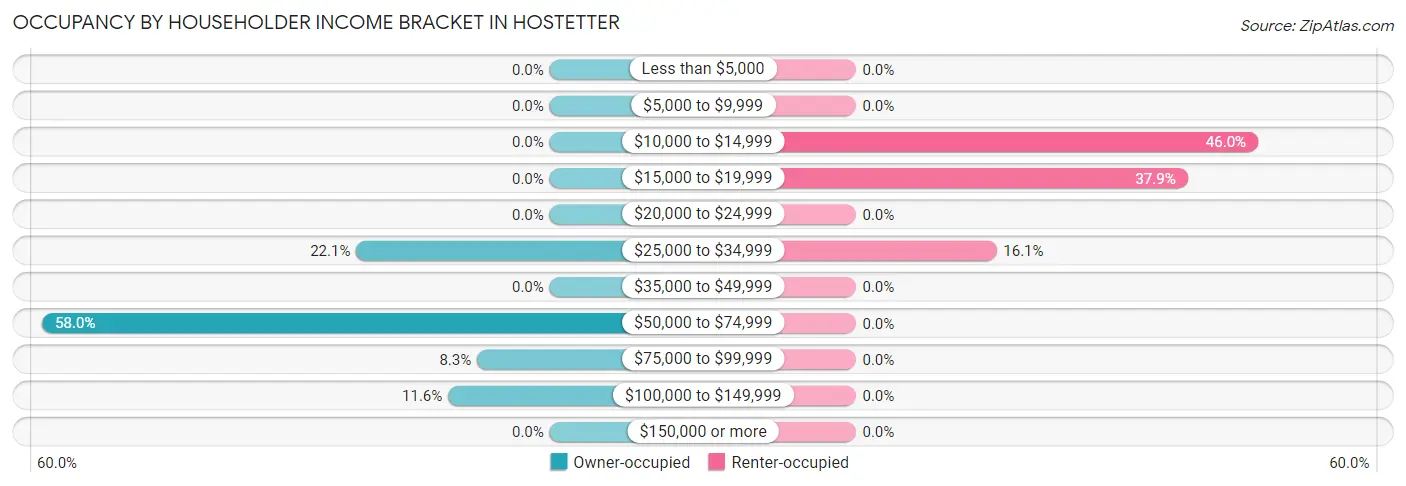
| Income Bracket | Owner-occupied | Renter-occupied |
| Less than $5,000 | 0 (0.0%) | 0 (0.0%) |
| $5,000 to $9,999 | 0 (0.0%) | 0 (0.0%) |
| $10,000 to $14,999 | 0 (0.0%) | 40 (46.0%) |
| $15,000 to $19,999 | 0 (0.0%) | 33 (37.9%) |
| $20,000 to $24,999 | 0 (0.0%) | 0 (0.0%) |
| $25,000 to $34,999 | 40 (22.1%) | 14 (16.1%) |
| $35,000 to $49,999 | 0 (0.0%) | 0 (0.0%) |
| $50,000 to $74,999 | 105 (58.0%) | 0 (0.0%) |
| $75,000 to $99,999 | 15 (8.3%) | 0 (0.0%) |
| $100,000 to $149,999 | 21 (11.6%) | 0 (0.0%) |
| $150,000 or more | 0 (0.0%) | 0 (0.0%) |
| Total | 181 (100.0%) | 87 (100.0%) |
Monthly Housing Cost Tiers in Hostetter
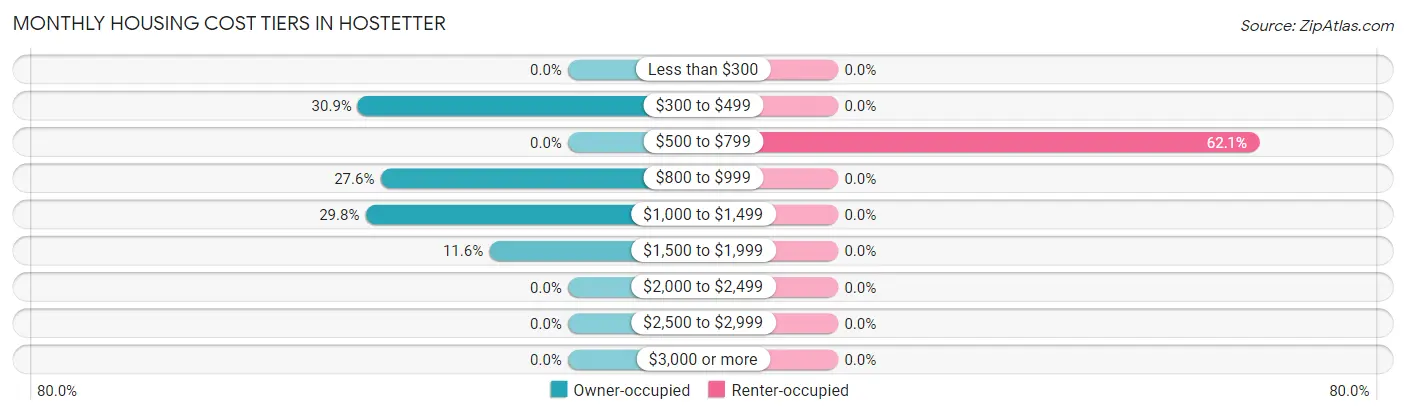
| Monthly Cost | Owner-occupied | Renter-occupied |
| Less than $300 | 0 (0.0%) | 0 (0.0%) |
| $300 to $499 | 56 (30.9%) | 0 (0.0%) |
| $500 to $799 | 0 (0.0%) | 54 (62.1%) |
| $800 to $999 | 50 (27.6%) | 0 (0.0%) |
| $1,000 to $1,499 | 54 (29.8%) | 0 (0.0%) |
| $1,500 to $1,999 | 21 (11.6%) | 0 (0.0%) |
| $2,000 to $2,499 | 0 (0.0%) | 0 (0.0%) |
| $2,500 to $2,999 | 0 (0.0%) | 0 (0.0%) |
| $3,000 or more | 0 (0.0%) | 0 (0.0%) |
| Total | 181 (100.0%) | 87 (100.0%) |
Physical Housing Characteristics in Hostetter
Housing Structures in Hostetter
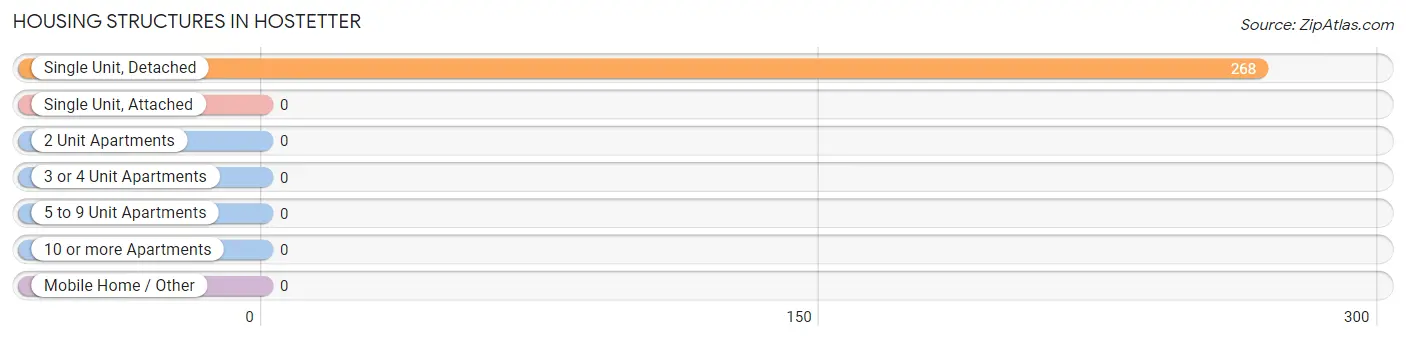
| Structure Type | # Housing Units | % Housing Units |
| Single Unit, Detached | 268 | 100.0% |
| Single Unit, Attached | 0 | 0.0% |
| 2 Unit Apartments | 0 | 0.0% |
| 3 or 4 Unit Apartments | 0 | 0.0% |
| 5 to 9 Unit Apartments | 0 | 0.0% |
| 10 or more Apartments | 0 | 0.0% |
| Mobile Home / Other | 0 | 0.0% |
| Total | 268 | 100.0% |
Housing Structures by Occupancy in Hostetter
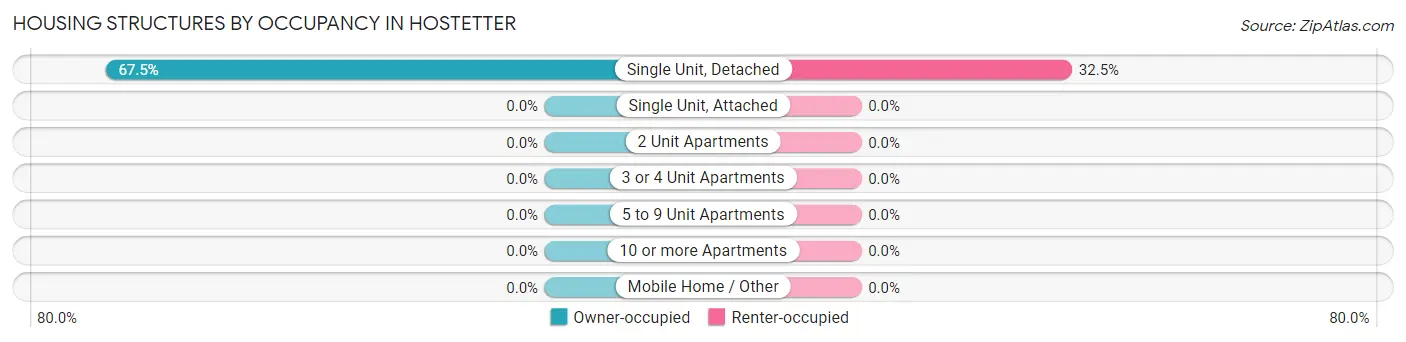
| Structure Type | Owner-occupied | Renter-occupied |
| Single Unit, Detached | 181 (67.5%) | 87 (32.5%) |
| Single Unit, Attached | 0 (0.0%) | 0 (0.0%) |
| 2 Unit Apartments | 0 (0.0%) | 0 (0.0%) |
| 3 or 4 Unit Apartments | 0 (0.0%) | 0 (0.0%) |
| 5 to 9 Unit Apartments | 0 (0.0%) | 0 (0.0%) |
| 10 or more Apartments | 0 (0.0%) | 0 (0.0%) |
| Mobile Home / Other | 0 (0.0%) | 0 (0.0%) |
| Total | 181 (67.5%) | 87 (32.5%) |
Housing Structures by Number of Rooms in Hostetter
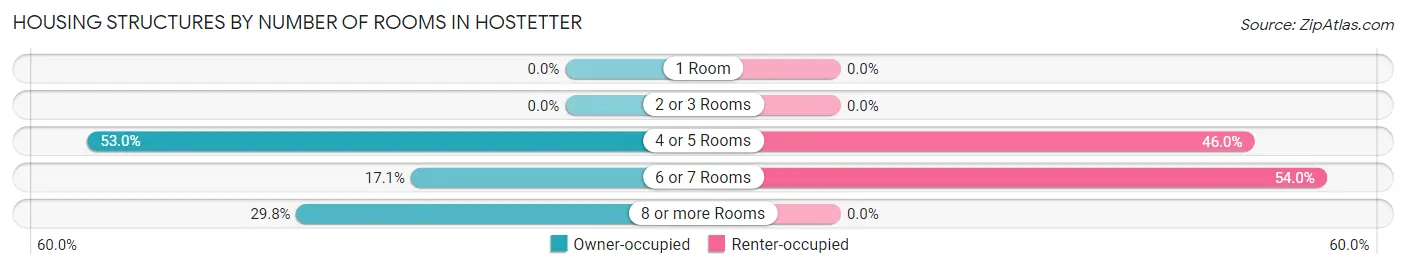
| Number of Rooms | Owner-occupied | Renter-occupied |
| 1 Room | 0 (0.0%) | 0 (0.0%) |
| 2 or 3 Rooms | 0 (0.0%) | 0 (0.0%) |
| 4 or 5 Rooms | 96 (53.0%) | 40 (46.0%) |
| 6 or 7 Rooms | 31 (17.1%) | 47 (54.0%) |
| 8 or more Rooms | 54 (29.8%) | 0 (0.0%) |
| Total | 181 (100.0%) | 87 (100.0%) |
Housing Structure by Heating Type in Hostetter
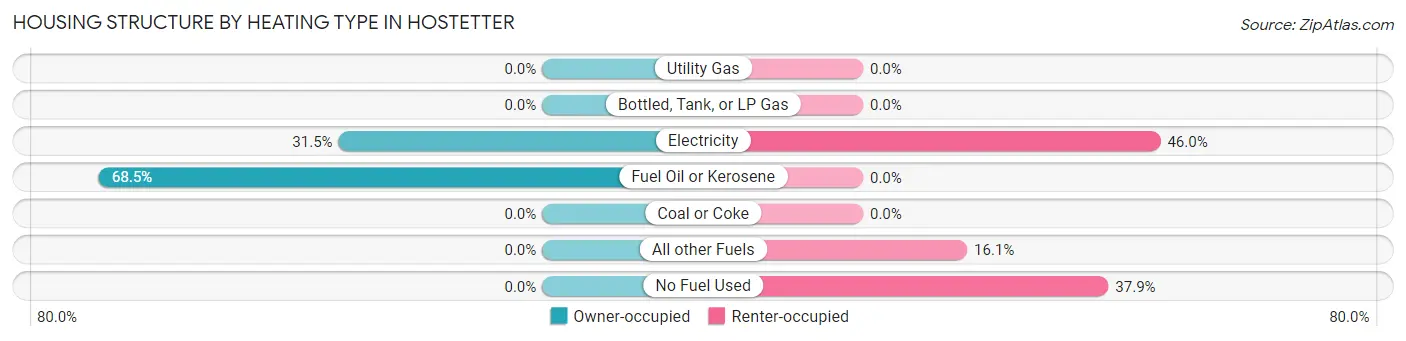
| Heating Type | Owner-occupied | Renter-occupied |
| Utility Gas | 0 (0.0%) | 0 (0.0%) |
| Bottled, Tank, or LP Gas | 0 (0.0%) | 0 (0.0%) |
| Electricity | 57 (31.5%) | 40 (46.0%) |
| Fuel Oil or Kerosene | 124 (68.5%) | 0 (0.0%) |
| Coal or Coke | 0 (0.0%) | 0 (0.0%) |
| All other Fuels | 0 (0.0%) | 14 (16.1%) |
| No Fuel Used | 0 (0.0%) | 33 (37.9%) |
| Total | 181 (100.0%) | 87 (100.0%) |
Household Vehicle Usage in Hostetter
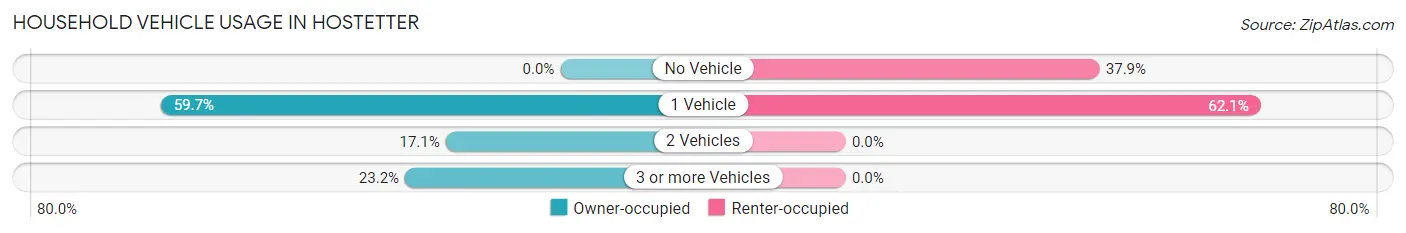
| Vehicles per Household | Owner-occupied | Renter-occupied |
| No Vehicle | 0 (0.0%) | 33 (37.9%) |
| 1 Vehicle | 108 (59.7%) | 54 (62.1%) |
| 2 Vehicles | 31 (17.1%) | 0 (0.0%) |
| 3 or more Vehicles | 42 (23.2%) | 0 (0.0%) |
| Total | 181 (100.0%) | 87 (100.0%) |
Real Estate & Mortgages in Hostetter
Real Estate and Mortgage Overview in Hostetter
| Characteristic | Without Mortgage | With Mortgage |
| Housing Units | 56 | 125 |
| Median Property Value | - | - |
| Median Household Income | - | - |
| Monthly Housing Costs | - | - |
| Real Estate Taxes | - | - |
Property Value by Mortgage Status in Hostetter
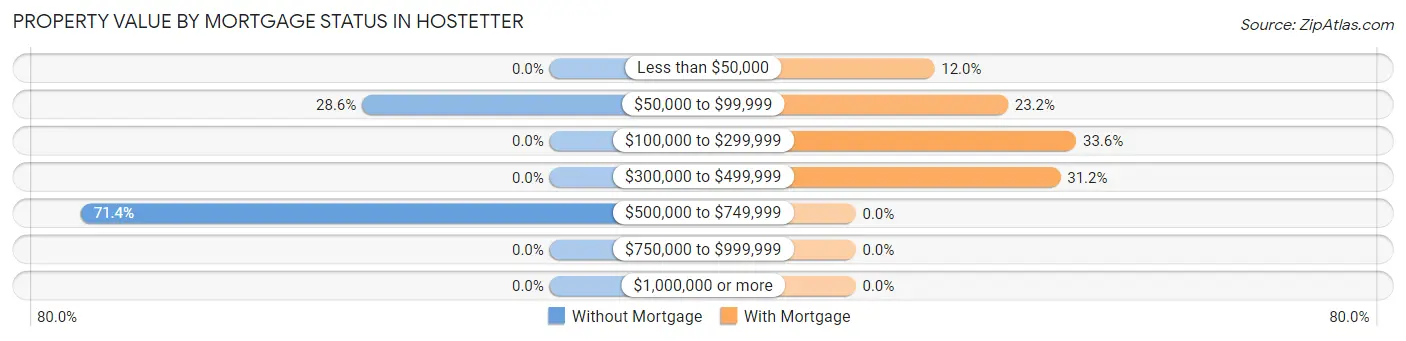
| Property Value | Without Mortgage | With Mortgage |
| Less than $50,000 | 0 (0.0%) | 15 (12.0%) |
| $50,000 to $99,999 | 16 (28.6%) | 29 (23.2%) |
| $100,000 to $299,999 | 0 (0.0%) | 42 (33.6%) |
| $300,000 to $499,999 | 0 (0.0%) | 39 (31.2%) |
| $500,000 to $749,999 | 40 (71.4%) | 0 (0.0%) |
| $750,000 to $999,999 | 0 (0.0%) | 0 (0.0%) |
| $1,000,000 or more | 0 (0.0%) | 0 (0.0%) |
| Total | 56 (100.0%) | 125 (100.0%) |
Household Income by Mortgage Status in Hostetter
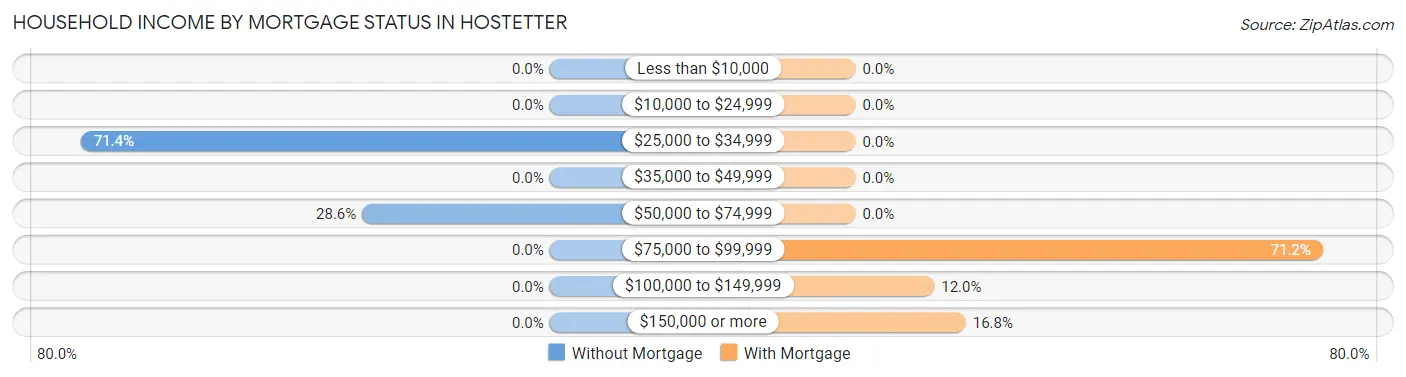
| Household Income | Without Mortgage | With Mortgage |
| Less than $10,000 | 0 (0.0%) | 0 (0.0%) |
| $10,000 to $24,999 | 0 (0.0%) | 0 (0.0%) |
| $25,000 to $34,999 | 40 (71.4%) | 0 (0.0%) |
| $35,000 to $49,999 | 0 (0.0%) | 0 (0.0%) |
| $50,000 to $74,999 | 16 (28.6%) | 0 (0.0%) |
| $75,000 to $99,999 | 0 (0.0%) | 89 (71.2%) |
| $100,000 to $149,999 | 0 (0.0%) | 15 (12.0%) |
| $150,000 or more | 0 (0.0%) | 21 (16.8%) |
| Total | 56 (100.0%) | 125 (100.0%) |
Property Value to Household Income Ratio in Hostetter
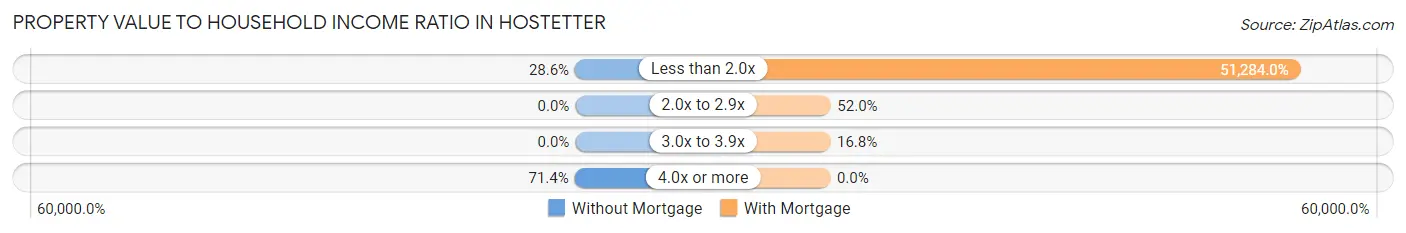
| Value-to-Income Ratio | Without Mortgage | With Mortgage |
| Less than 2.0x | 16 (28.6%) | 64,105 (51,284.0%) |
| 2.0x to 2.9x | 0 (0.0%) | 65 (52.0%) |
| 3.0x to 3.9x | 0 (0.0%) | 21 (16.8%) |
| 4.0x or more | 40 (71.4%) | 0 (0.0%) |
| Total | 56 (100.0%) | 125 (100.0%) |
Real Estate Taxes by Mortgage Status in Hostetter
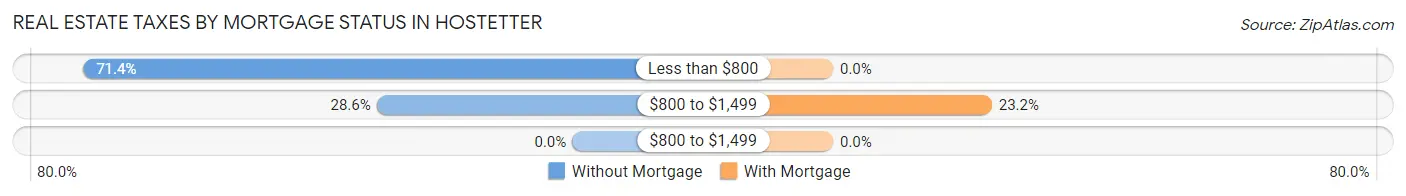
| Property Taxes | Without Mortgage | With Mortgage |
| Less than $800 | 40 (71.4%) | 0 (0.0%) |
| $800 to $1,499 | 16 (28.6%) | 29 (23.2%) |
| $800 to $1,499 | 0 (0.0%) | 0 (0.0%) |
| Total | 56 (100.0%) | 125 (100.0%) |
Health & Disability in Hostetter
Health Insurance Coverage by Age in Hostetter
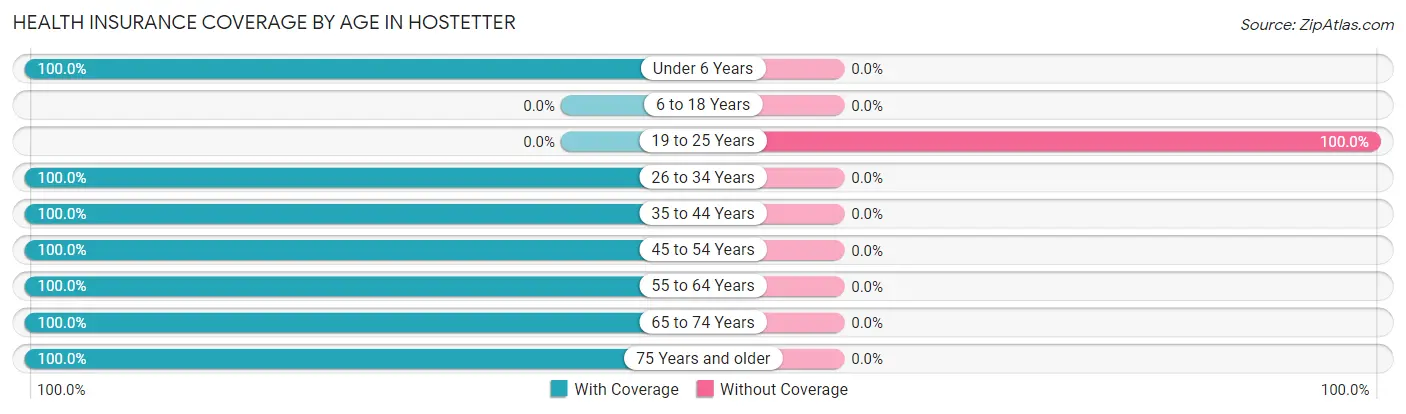
| Age Bracket | With Coverage | Without Coverage |
| Under 6 Years | 38 (100.0%) | 0 (0.0%) |
| 6 to 18 Years | 0 (0.0%) | 0 (0.0%) |
| 19 to 25 Years | 0 (0.0%) | 4 (100.0%) |
| 26 to 34 Years | 125 (100.0%) | 0 (0.0%) |
| 35 to 44 Years | 14 (100.0%) | 0 (0.0%) |
| 45 to 54 Years | 72 (100.0%) | 0 (0.0%) |
| 55 to 64 Years | 32 (100.0%) | 0 (0.0%) |
| 65 to 74 Years | 20 (100.0%) | 0 (0.0%) |
| 75 Years and older | 73 (100.0%) | 0 (0.0%) |
| Total | 374 (98.9%) | 4 (1.1%) |
Health Insurance Coverage by Citizenship Status in Hostetter
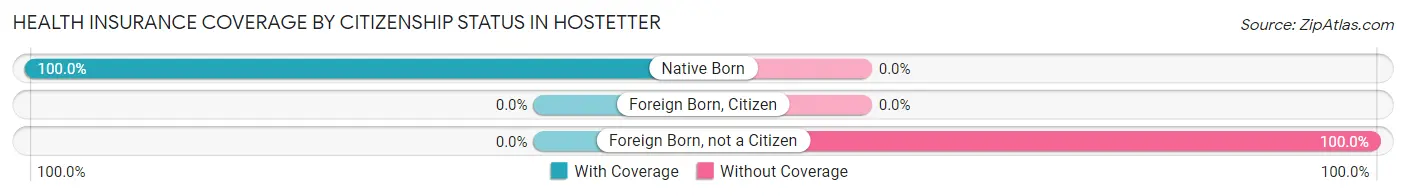
| Citizenship Status | With Coverage | Without Coverage |
| Native Born | 38 (100.0%) | 0 (0.0%) |
| Foreign Born, Citizen | 0 (0.0%) | 0 (0.0%) |
| Foreign Born, not a Citizen | 0 (0.0%) | 4 (100.0%) |
Health Insurance Coverage by Household Income in Hostetter
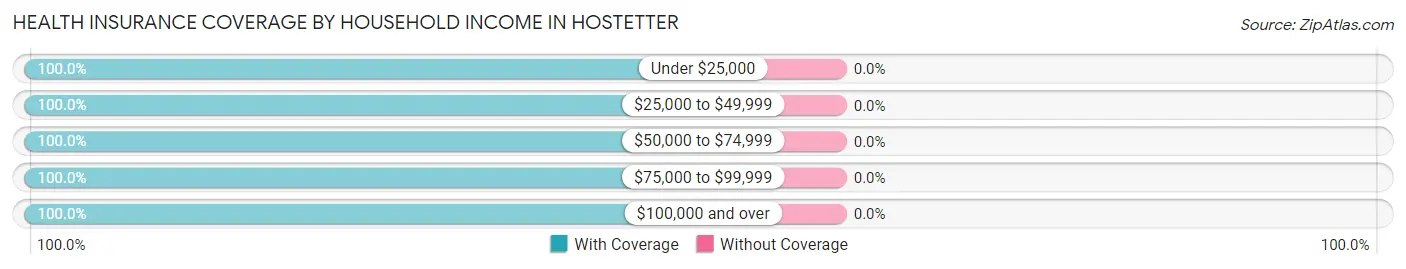
| Household Income | With Coverage | Without Coverage |
| Under $25,000 | 73 (100.0%) | 0 (0.0%) |
| $25,000 to $49,999 | 54 (100.0%) | 0 (0.0%) |
| $50,000 to $74,999 | 162 (100.0%) | 0 (0.0%) |
| $75,000 to $99,999 | 29 (100.0%) | 0 (0.0%) |
| $100,000 and over | 41 (100.0%) | 0 (0.0%) |
Public vs Private Health Insurance Coverage by Age in Hostetter
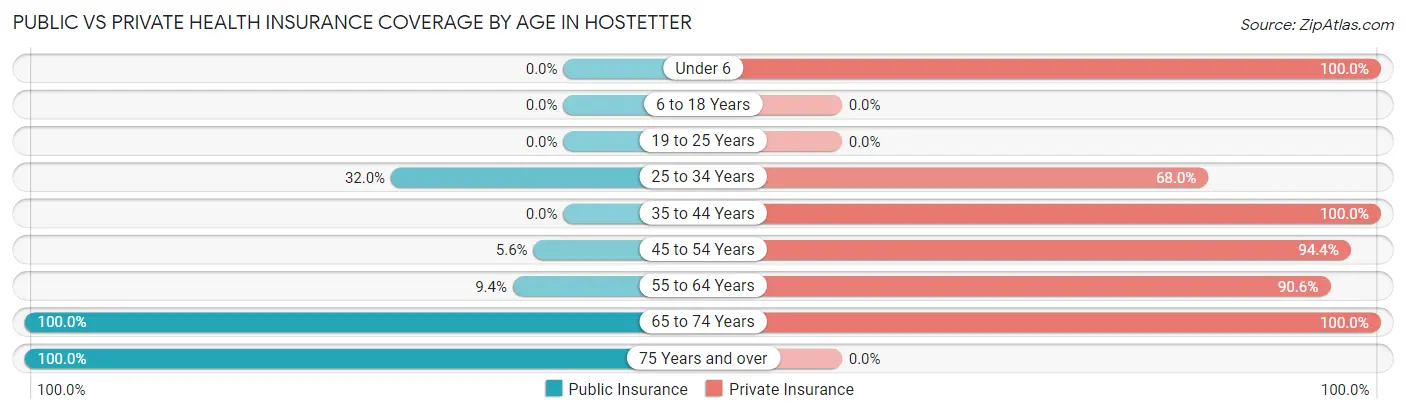
| Age Bracket | Public Insurance | Private Insurance |
| Under 6 | 0 (0.0%) | 38 (100.0%) |
| 6 to 18 Years | 0 (0.0%) | 0 (0.0%) |
| 19 to 25 Years | 0 (0.0%) | 0 (0.0%) |
| 25 to 34 Years | 40 (32.0%) | 85 (68.0%) |
| 35 to 44 Years | 0 (0.0%) | 14 (100.0%) |
| 45 to 54 Years | 4 (5.6%) | 68 (94.4%) |
| 55 to 64 Years | 3 (9.4%) | 29 (90.6%) |
| 65 to 74 Years | 20 (100.0%) | 20 (100.0%) |
| 75 Years and over | 73 (100.0%) | 0 (0.0%) |
| Total | 140 (37.0%) | 254 (67.2%) |
Disability Status by Sex by Age in Hostetter
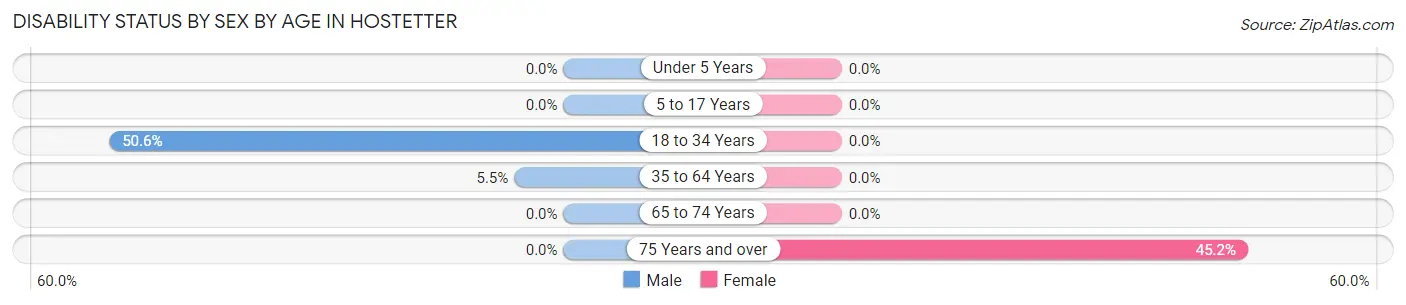
| Age Bracket | Male | Female |
| Under 5 Years | 0 (0.0%) | 0 (0.0%) |
| 5 to 17 Years | 0 (0.0%) | 0 (0.0%) |
| 18 to 34 Years | 44 (50.6%) | 0 (0.0%) |
| 35 to 64 Years | 4 (5.5%) | 0 (0.0%) |
| 65 to 74 Years | 0 (0.0%) | 0 (0.0%) |
| 75 Years and over | 0 (0.0%) | 33 (45.2%) |
Disability Class by Sex by Age in Hostetter
Disability Class: Hearing Difficulty
| Age Bracket | Male | Female |
| Under 5 Years | 0 (0.0%) | 0 (0.0%) |
| 5 to 17 Years | 0 (0.0%) | 0 (0.0%) |
| 18 to 34 Years | 0 (0.0%) | 0 (0.0%) |
| 35 to 64 Years | 0 (0.0%) | 0 (0.0%) |
| 65 to 74 Years | 0 (0.0%) | 0 (0.0%) |
| 75 Years and over | 0 (0.0%) | 0 (0.0%) |
Disability Class: Vision Difficulty
| Age Bracket | Male | Female |
| Under 5 Years | 0 (0.0%) | 0 (0.0%) |
| 5 to 17 Years | 0 (0.0%) | 0 (0.0%) |
| 18 to 34 Years | 0 (0.0%) | 0 (0.0%) |
| 35 to 64 Years | 0 (0.0%) | 0 (0.0%) |
| 65 to 74 Years | 0 (0.0%) | 0 (0.0%) |
| 75 Years and over | 0 (0.0%) | 0 (0.0%) |
Disability Class: Cognitive Difficulty
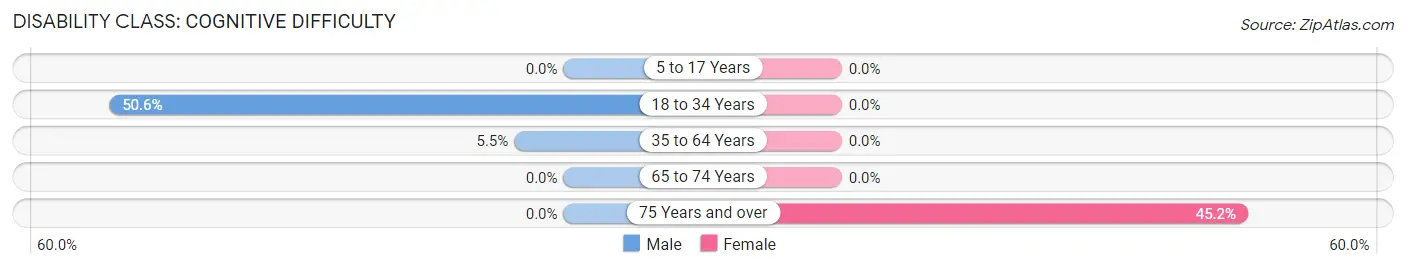
| Age Bracket | Male | Female |
| 5 to 17 Years | 0 (0.0%) | 0 (0.0%) |
| 18 to 34 Years | 44 (50.6%) | 0 (0.0%) |
| 35 to 64 Years | 4 (5.5%) | 0 (0.0%) |
| 65 to 74 Years | 0 (0.0%) | 0 (0.0%) |
| 75 Years and over | 0 (0.0%) | 33 (45.2%) |
Disability Class: Ambulatory Difficulty
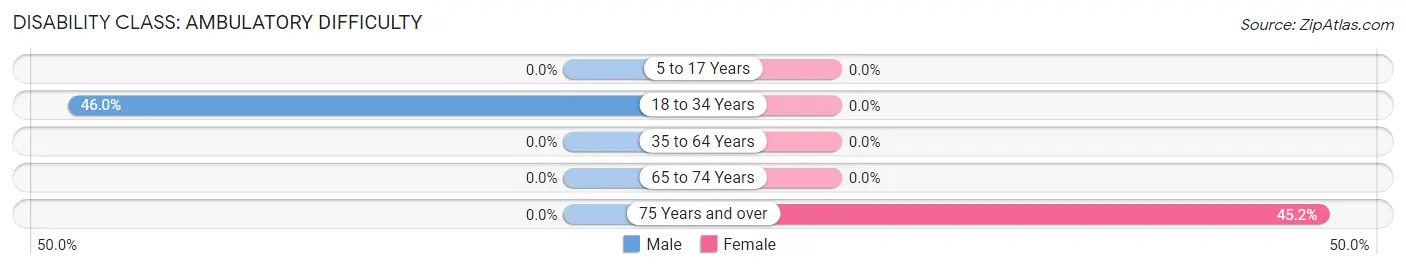
| Age Bracket | Male | Female |
| 5 to 17 Years | 0 (0.0%) | 0 (0.0%) |
| 18 to 34 Years | 40 (46.0%) | 0 (0.0%) |
| 35 to 64 Years | 0 (0.0%) | 0 (0.0%) |
| 65 to 74 Years | 0 (0.0%) | 0 (0.0%) |
| 75 Years and over | 0 (0.0%) | 33 (45.2%) |
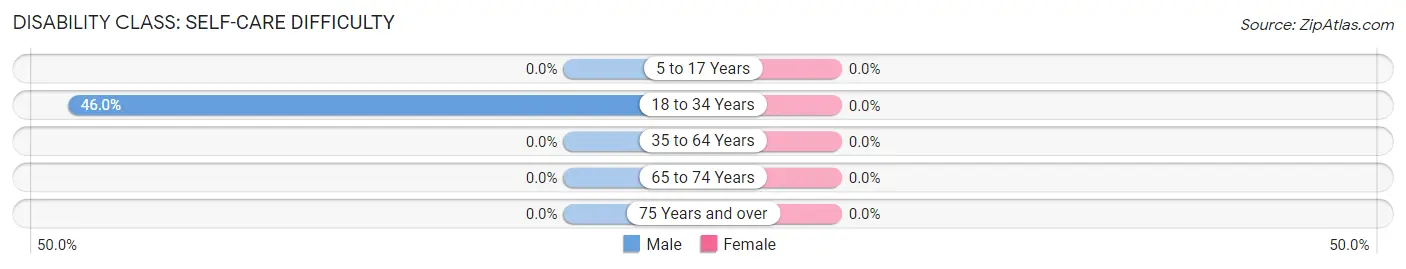
Disability Class: Self-Care Difficulty
| Age Bracket | Male | Female |
| 5 to 17 Years | 0 (0.0%) | 0 (0.0%) |
| 18 to 34 Years | 40 (46.0%) | 0 (0.0%) |
| 35 to 64 Years | 0 (0.0%) | 0 (0.0%) |
| 65 to 74 Years | 0 (0.0%) | 0 (0.0%) |
| 75 Years and over | 0 (0.0%) | 0 (0.0%) |
Technology Access in Hostetter
Computing Device Access in Hostetter
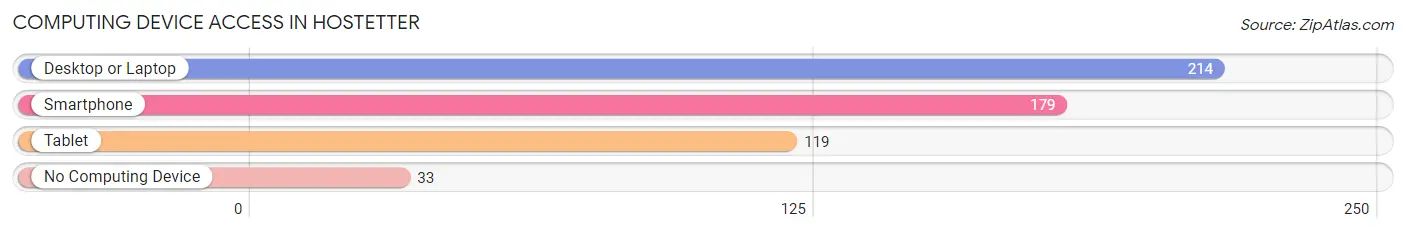
| Device Type | # Households | % Households |
| Desktop or Laptop | 214 | 79.8% |
| Smartphone | 179 | 66.8% |
| Tablet | 119 | 44.4% |
| No Computing Device | 33 | 12.3% |
| Total | 268 | 100.0% |
Internet Access in Hostetter
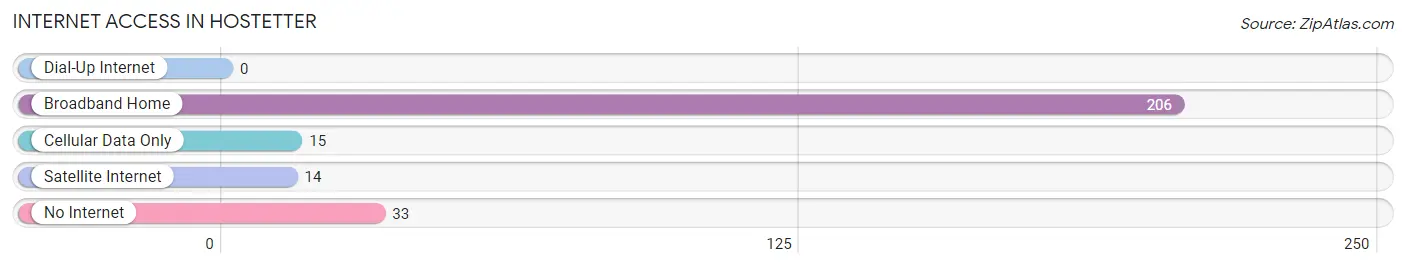
| Internet Type | # Households | % Households |
| Dial-Up Internet | 0 | 0.0% |
| Broadband Home | 206 | 76.9% |
| Cellular Data Only | 15 | 5.6% |
| Satellite Internet | 14 | 5.2% |
| No Internet | 33 | 12.3% |
| Total | 268 | 100.0% |
Hostetter Summary
Located in the southwestern corner of Pennsylvania, the borough of Hostetter is a small community of approximately 1,000 people. The borough is situated in the heart of the Allegheny Mountains, and is surrounded by the townships of East Huntingdon, South Huntingdon, and Sewickley. The borough is located approximately 40 miles southeast of Pittsburgh, and is part of the greater Pittsburgh metropolitan area.
Geography
Hostetter is located in the southwestern corner of Pennsylvania, in the heart of the Allegheny Mountains. The borough is situated in the Youghiogheny River Valley, and is surrounded by the townships of East Huntingdon, South Huntingdon, and Sewickley. The borough is located approximately 40 miles southeast of Pittsburgh, and is part of the greater Pittsburgh metropolitan area. The borough is situated at an elevation of 1,400 feet above sea level, and is located in the Eastern Time Zone. The borough is located in the humid continental climate zone, and experiences four distinct seasons.
The borough is located in a rural area, and is surrounded by rolling hills and forests. The borough is home to several small streams, including the Youghiogheny River, which flows through the borough. The borough is also home to several parks, including the Hostetter Park, which is located in the center of the borough.
Economy
The economy of Hostetter is largely based on agriculture and tourism. The borough is home to several small farms, which produce a variety of crops, including corn, soybeans, and hay. The borough is also home to several small businesses, including restaurants, retail stores, and service providers. The borough is also home to several small manufacturing companies, which produce a variety of products, including furniture, clothing, and electronics.
The borough is also home to several tourist attractions, including the Hostetter Park, which is located in the center of the borough. The park is home to several hiking trails, picnic areas, and a playground. The borough is also home to several historic sites, including the Hostetter House, which was built in the late 19th century.
Demographics
As of the 2010 census, the population of Hostetter was 1,000 people. The population is largely white, with approximately 95% of the population identifying as white. The median age of the population is 44 years old, and the median household income is $45,000. The borough is home to several churches, including the Hostetter United Methodist Church, which was founded in 1845.
Conclusion
Hostetter is a small borough located in the southwestern corner of Pennsylvania. The borough is situated in the heart of the Allegheny Mountains, and is surrounded by the townships of East Huntingdon, South Huntingdon, and Sewickley. The borough is home to approximately 1,000 people, and is largely white. The economy of Hostetter is largely based on agriculture and tourism, and the borough is home to several small businesses, farms, and tourist attractions.
Common Questions
What is Per Capita Income in Hostetter?
Per Capita income in Hostetter is $35,520.
What is Income or Wage Gap in Hostetter?
Income or Wage Gap in Hostetter is 48.9%.
Women in Hostetter earn 51.1 cents for every dollar earned by a man.
What is Inequality or Gini Index in Hostetter?
Inequality or Gini Index in Hostetter is 0.36.
What is the Total Population of Hostetter?
Total Population of Hostetter is 378.
What is the Total Male Population of Hostetter?
Total Male Population of Hostetter is 218.
What is the Total Female Population of Hostetter?
Total Female Population of Hostetter is 160.
What is the Ratio of Males per 100 Females in Hostetter?
There are 136.25 Males per 100 Females in Hostetter.
What is the Ratio of Females per 100 Males in Hostetter?
There are 73.39 Females per 100 Males in Hostetter.
What is the Median Population Age in Hostetter?
Median Population Age in Hostetter is 47.5 Years.
What is the Average Family Size in Hostetter
Average Family Size in Hostetter is 2.6 People.
What is the Average Household Size in Hostetter
Average Household Size in Hostetter is 1.3 People.
How Large is the Labor Force in Hostetter?
There are 225 People in the Labor Forcein in Hostetter.
What is the Percentage of People in the Labor Force in Hostetter?
66.2% of People are in the Labor Force in Hostetter.