Cities with the Highest Percentage of Immigrants from South Africa in Pennsylvania
RELATED REPORTS & OPTIONS
South Africa
Pennsylvania
Compare Cities
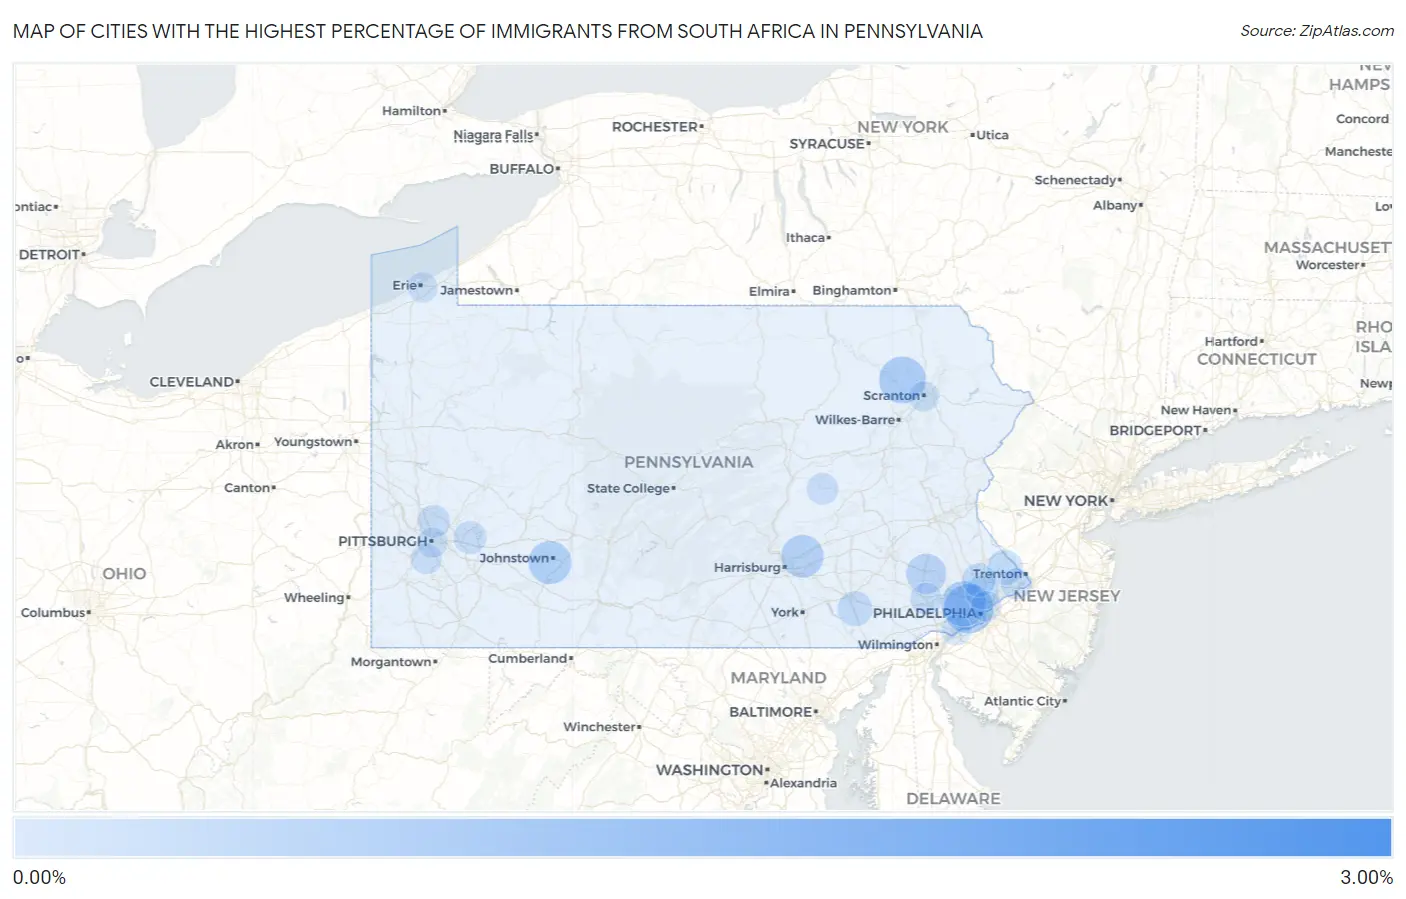
Map of Cities with the Highest Percentage of Immigrants from South Africa in Pennsylvania
0.00%
3.00%
Cities with the Highest Percentage of Immigrants from South Africa in Pennsylvania
| City | South Africa | vs State | vs National | |
| 1. | Royalton Borough | 2.86% | 0.021%(+2.84)#-1 | 0.035%(+2.82)#0 |
| 2. | West Conshohocken Borough | 2.31% | 0.021%(+2.29)#0 | 0.035%(+2.27)#1 |
| 3. | Schwenksville Borough | 1.39% | 0.021%(+1.37)#1 | 0.035%(+1.36)#2 |
| 4. | Franklintown Borough | 1.28% | 0.021%(+1.25)#2 | 0.035%(+1.24)#3 |
| 5. | Ambler Borough | 1.21% | 0.021%(+1.19)#3 | 0.035%(+1.17)#4 |
| 6. | Wyalusing Borough | 1.20% | 0.021%(+1.18)#4 | 0.035%(+1.17)#5 |
| 7. | York Haven Borough | 0.79% | 0.021%(+0.766)#5 | 0.035%(+0.752)#6 |
| 8. | Penn Wynne | 0.77% | 0.021%(+0.746)#6 | 0.035%(+0.732)#7 |
| 9. | Lake Winola | 0.66% | 0.021%(+0.643)#7 | 0.035%(+0.629)#8 |
| 10. | Throop Borough | 0.64% | 0.021%(+0.619)#8 | 0.035%(+0.605)#9 |
| 11. | Downingtown Borough | 0.63% | 0.021%(+0.609)#9 | 0.035%(+0.595)#10 |
| 12. | Bryn Mawr | 0.60% | 0.021%(+0.578)#10 | 0.035%(+0.564)#11 |
| 13. | Ohioville Borough | 0.57% | 0.021%(+0.547)#11 | 0.035%(+0.533)#12 |
| 14. | Cooperstown Borough | 0.54% | 0.021%(+0.515)#12 | 0.035%(+0.501)#13 |
| 15. | Elim | 0.51% | 0.021%(+0.491)#13 | 0.035%(+0.477)#14 |
| 16. | Skyline View | 0.50% | 0.021%(+0.474)#14 | 0.035%(+0.460)#15 |
| 17. | Villanova | 0.46% | 0.021%(+0.436)#15 | 0.035%(+0.423)#16 |
| 18. | Bryn Athyn Borough | 0.45% | 0.021%(+0.427)#16 | 0.035%(+0.413)#17 |
| 19. | Dormont Borough | 0.41% | 0.021%(+0.393)#17 | 0.035%(+0.379)#18 |
| 20. | Kenilworth | 0.39% | 0.021%(+0.370)#18 | 0.035%(+0.356)#19 |
| 21. | Wyomissing Borough | 0.36% | 0.021%(+0.340)#19 | 0.035%(+0.326)#20 |
| 22. | Marysville Borough | 0.34% | 0.021%(+0.318)#20 | 0.035%(+0.304)#21 |
| 23. | Merion Station | 0.30% | 0.021%(+0.275)#21 | 0.035%(+0.261)#71 |
| 24. | Gettysburg Borough | 0.29% | 0.021%(+0.264)#22 | 0.035%(+0.250)#72 |
| 25. | Slippery Rock Borough | 0.27% | 0.021%(+0.246)#23 | 0.035%(+0.232)#73 |
| 26. | Bala Cynwyd | 0.27% | 0.021%(+0.245)#24 | 0.035%(+0.231)#74 |
| 27. | Sewickley Heights Borough | 0.26% | 0.021%(+0.241)#25 | 0.035%(+0.227)#75 |
| 28. | Langhorne Borough | 0.25% | 0.021%(+0.232)#26 | 0.035%(+0.218)#76 |
| 29. | Charleroi Borough | 0.24% | 0.021%(+0.215)#27 | 0.035%(+0.202)#77 |
| 30. | St. Davids | 0.22% | 0.021%(+0.198)#28 | 0.035%(+0.184)#78 |
| 31. | Milford Borough | 0.22% | 0.021%(+0.196)#29 | 0.035%(+0.182)#79 |
| 32. | Newtown Grant | 0.21% | 0.021%(+0.184)#30 | 0.035%(+0.170)#80 |
| 33. | Stewartstown Borough | 0.20% | 0.021%(+0.180)#31 | 0.035%(+0.166)#81 |
| 34. | Emsworth Borough | 0.20% | 0.021%(+0.177)#32 | 0.035%(+0.163)#82 |
| 35. | Willow Street | 0.20% | 0.021%(+0.176)#33 | 0.035%(+0.162)#83 |
| 36. | West View Borough | 0.17% | 0.021%(+0.144)#34 | 0.035%(+0.130)#84 |
| 37. | Wyncote | 0.15% | 0.021%(+0.125)#35 | 0.035%(+0.111)#85 |
| 38. | Maple Glen | 0.14% | 0.021%(+0.114)#36 | 0.035%(+0.100)#86 |
| 39. | Murrysville | 0.12% | 0.021%(+0.094)#37 | 0.035%(+0.080)#87 |
| 40. | Franklin Park Borough | 0.11% | 0.021%(+0.090)#38 | 0.035%(+0.076)#88 |
| 41. | Media Borough | 0.10% | 0.021%(+0.081)#39 | 0.035%(+0.067)#89 |
| 42. | West Chester Borough | 0.100% | 0.021%(+0.078)#40 | 0.035%(+0.065)#90 |
| 43. | Allison Park | 0.093% | 0.021%(+0.071)#41 | 0.035%(+0.057)#91 |
| 44. | Middleburg Borough | 0.075% | 0.021%(+0.054)#42 | 0.035%(+0.040)#92 |
| 45. | Lionville | 0.074% | 0.021%(+0.053)#43 | 0.035%(+0.039)#93 |
| 46. | Oakmont Borough | 0.074% | 0.021%(+0.053)#44 | 0.035%(+0.039)#94 |
| 47. | Plum Borough | 0.067% | 0.021%(+0.045)#45 | 0.035%(+0.031)#95 |
| 48. | Norristown Borough | 0.064% | 0.021%(+0.043)#46 | 0.035%(+0.029)#96 |
| 49. | Shamokin | 0.058% | 0.021%(+0.036)#47 | 0.035%(+0.022)#97 |
| 50. | Dunmore Borough | 0.050% | 0.021%(+0.028)#48 | 0.035%(+0.014)#98 |
| 51. | Levittown | 0.033% | 0.021%(+0.012)#49 | 0.035%(-0.002)#99 |
| 52. | Bethel Park | 0.024% | 0.021%(+0.003)#50 | 0.035%(-0.011)#100 |
| 53. | Chester | 0.021% | 0.021%(-0.000)#51 | 0.035%(-0.014)#101 |
| 54. | Philadelphia | 0.017% | 0.021%(-0.005)#52 | 0.035%(-0.019)#247 |
| 55. | Pittsburgh | 0.013% | 0.021%(-0.008)#53 | 0.035%(-0.022)#248 |
| 56. | Erie | 0.0084% | 0.021%(-0.013)#54 | 0.035%(-0.027)#249 |
| 57. | Scranton | 0.0079% | 0.021%(-0.014)#55 | 0.035%(-0.027)#250 |
Common Questions
What are the Top 10 Cities with the Highest Percentage of Immigrants from South Africa in Pennsylvania?
Top 10 Cities with the Highest Percentage of Immigrants from South Africa in Pennsylvania are:
#1
0.77%
#2
0.66%
#3
0.60%
#4
0.51%
#5
0.50%
#6
0.39%
#7
0.21%
#8
0.20%
#9
0.15%
#10
0.14%
What city has the Highest Percentage of Immigrants from South Africa in Pennsylvania?
Penn Wynne has the Highest Percentage of Immigrants from South Africa in Pennsylvania with 0.77%.
What is the Percentage of Immigrants from South Africa in the State of Pennsylvania?
Percentage of Immigrants from South Africa in Pennsylvania is 0.021%.
What is the Percentage of Immigrants from South Africa in the United States?
Percentage of Immigrants from South Africa in the United States is 0.035%.