Kutztown University, PA Map & Demographics
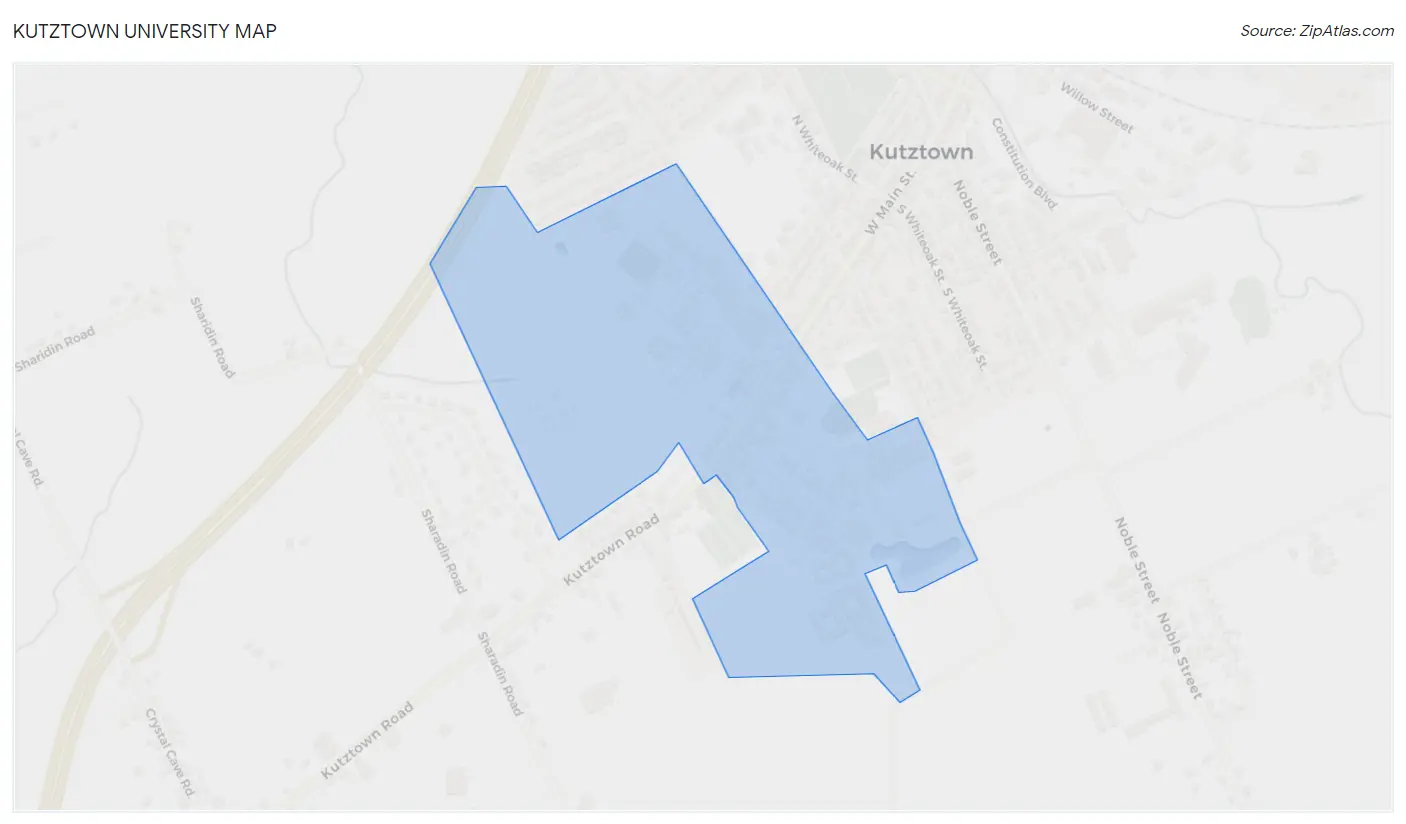
Kutztown University Map
Kutztown University Overview
$8,837
PER CAPITA INCOME
2.6%
WAGE / INCOME GAP [ % ]
97.4¢/ $1
WAGE / INCOME GAP [ $ ]
4,065
TOTAL POPULATION
1,869
MALE POPULATION
2,196
FEMALE POPULATION
85.11
MALES / 100 FEMALES
117.50
FEMALES / 100 MALES
19.7
MEDIAN AGE
1,829
LABOR FORCE [ PEOPLE ]
45.0%
PERCENT IN LABOR FORCE
8.5%
UNEMPLOYMENT RATE
Income in Kutztown University
Income Overview in Kutztown University
| Characteristic | Number | Measure |
| Per Capita Income | 4,065 | $8,837 |
| Median Family Income | 0 | $0 |
| Mean Family Income | 0 | $0 |
| Median Household Income | 0 | $0 |
| Mean Household Income | 0 | $0 |
| Income Deficit | 0 | $0 |
| Wage / Income Gap (%) | 4,065 | 2.64% |
| Wage / Income Gap ($) | 4,065 | 97.36¢ per $1 |
| Gini / Inequality Index | 4,065 | 0.00 |
Earnings by Sex in Kutztown University
Average Earnings in Kutztown University are $4,578, $4,506 for men and $4,628 for women, a difference of 2.6%.
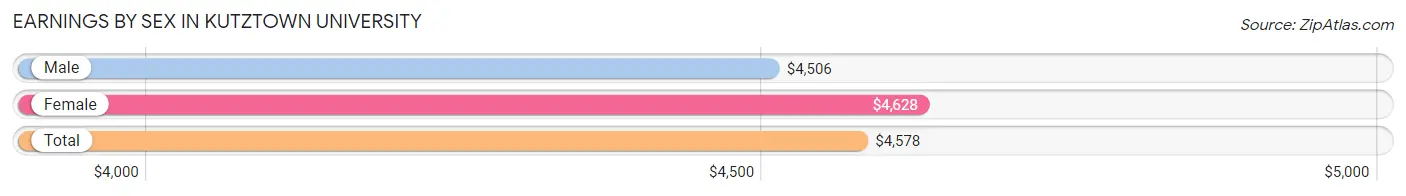
| Sex | Number | Average Earnings |
| Male | 1,384 (42.3%) | $4,506 |
| Female | 1,891 (57.7%) | $4,628 |
| Total | 3,275 (100.0%) | $4,578 |
Earnings by Sex by Income Bracket in Kutztown University
The most common earnings brackets in Kutztown University are $2,499 or less for men (444 | 32.1%) and $2,499 or less for women (576 | 30.5%).
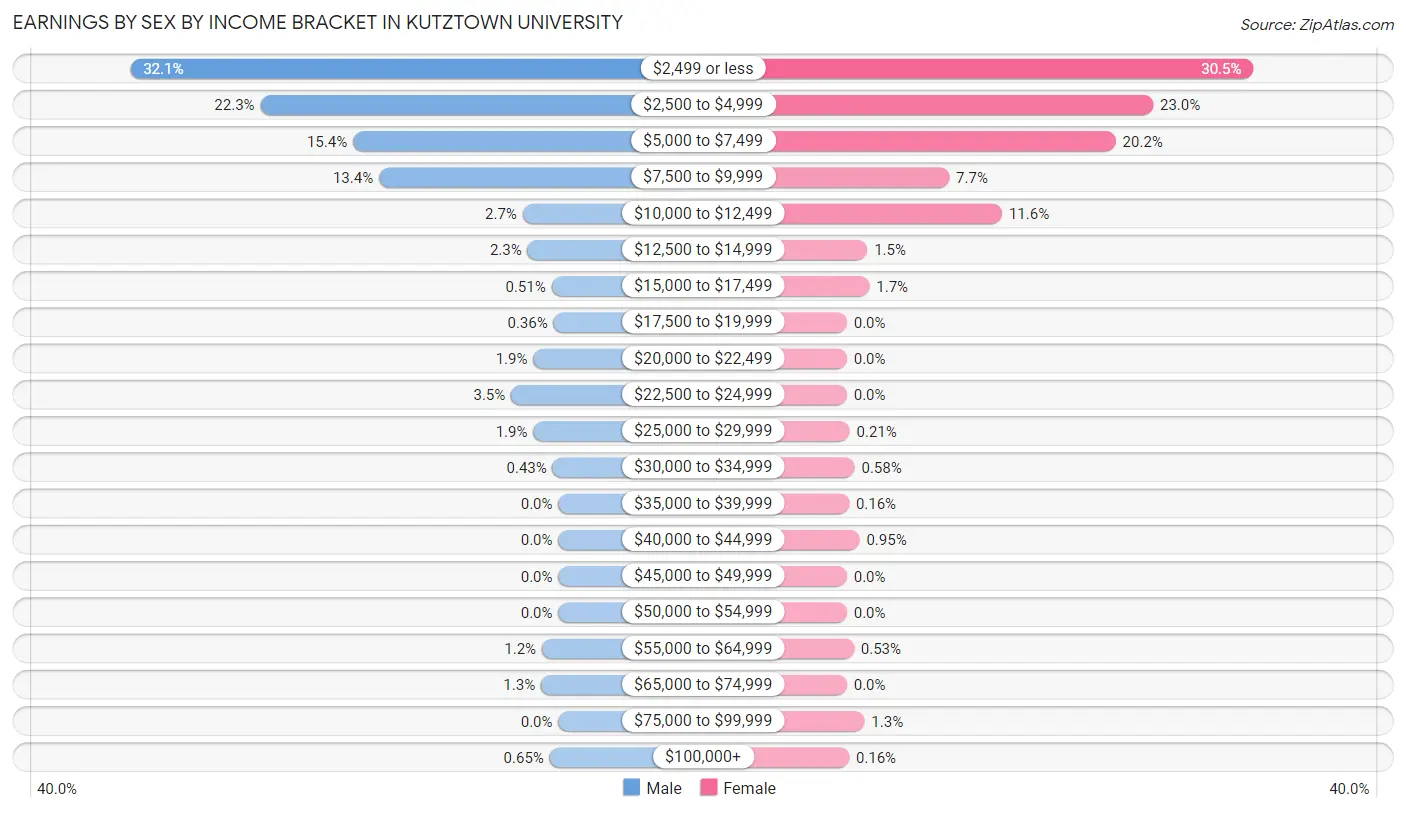
| Income | Male | Female |
| $2,499 or less | 444 (32.1%) | 576 (30.5%) |
| $2,500 to $4,999 | 309 (22.3%) | 434 (23.0%) |
| $5,000 to $7,499 | 213 (15.4%) | 381 (20.2%) |
| $7,500 to $9,999 | 186 (13.4%) | 145 (7.7%) |
| $10,000 to $12,499 | 37 (2.7%) | 220 (11.6%) |
| $12,500 to $14,999 | 32 (2.3%) | 29 (1.5%) |
| $15,000 to $17,499 | 7 (0.5%) | 32 (1.7%) |
| $17,500 to $19,999 | 5 (0.4%) | 0 (0.0%) |
| $20,000 to $22,499 | 26 (1.9%) | 0 (0.0%) |
| $22,500 to $24,999 | 49 (3.5%) | 0 (0.0%) |
| $25,000 to $29,999 | 26 (1.9%) | 4 (0.2%) |
| $30,000 to $34,999 | 6 (0.4%) | 11 (0.6%) |
| $35,000 to $39,999 | 0 (0.0%) | 3 (0.2%) |
| $40,000 to $44,999 | 0 (0.0%) | 18 (0.9%) |
| $45,000 to $49,999 | 0 (0.0%) | 0 (0.0%) |
| $50,000 to $54,999 | 0 (0.0%) | 0 (0.0%) |
| $55,000 to $64,999 | 17 (1.2%) | 10 (0.5%) |
| $65,000 to $74,999 | 18 (1.3%) | 0 (0.0%) |
| $75,000 to $99,999 | 0 (0.0%) | 25 (1.3%) |
| $100,000+ | 9 (0.6%) | 3 (0.2%) |
| Total | 1,384 (100.0%) | 1,891 (100.0%) |
Earnings by Sex by Educational Attainment in Kutztown University
| Educational Attainment | Male Income | Female Income |
| Less than High School | - | - |
| High School Diploma | - | - |
| College or Associate's Degree | - | - |
| Bachelor's Degree | - | - |
| Graduate Degree | - | - |
| Total | - | - |
Family Income in Kutztown University
Family Income Brackets in Kutztown University
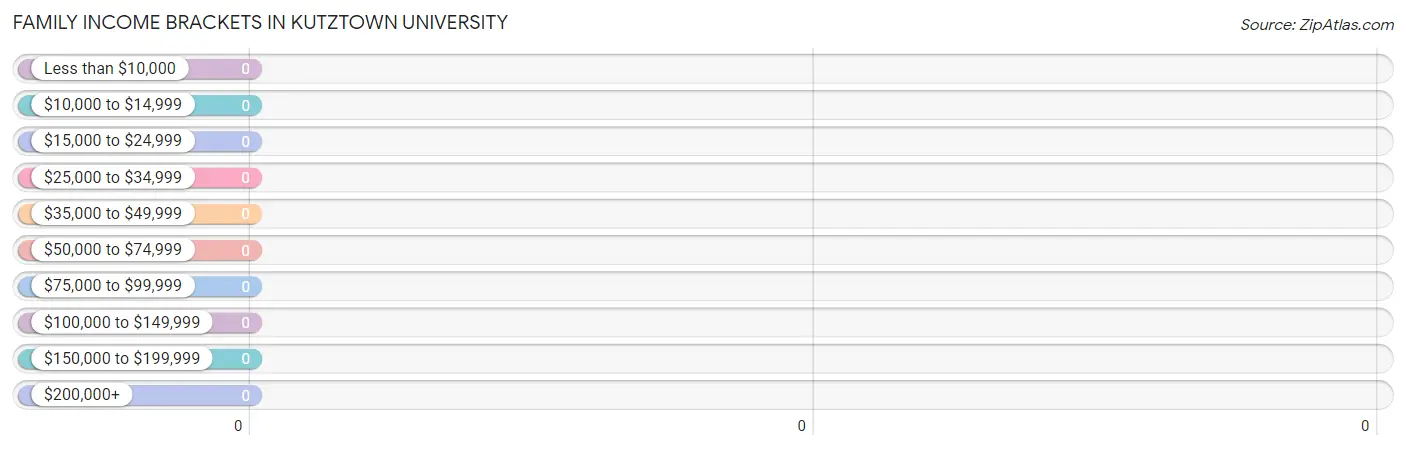
| Income Bracket | # Families | % Families |
| Less than $10,000 | 0 | 0.0% |
| $10,000 to $14,999 | 0 | 0.0% |
| $15,000 to $24,999 | 0 | 0.0% |
| $25,000 to $34,999 | 0 | 0.0% |
| $35,000 to $49,999 | 0 | 0.0% |
| $50,000 to $74,999 | 0 | 0.0% |
| $75,000 to $99,999 | 0 | 0.0% |
| $100,000 to $149,999 | 0 | 0.0% |
| $150,000 to $199,999 | 0 | 0.0% |
| $200,000+ | 0 | 0.0% |
Family Income by Famaliy Size in Kutztown University
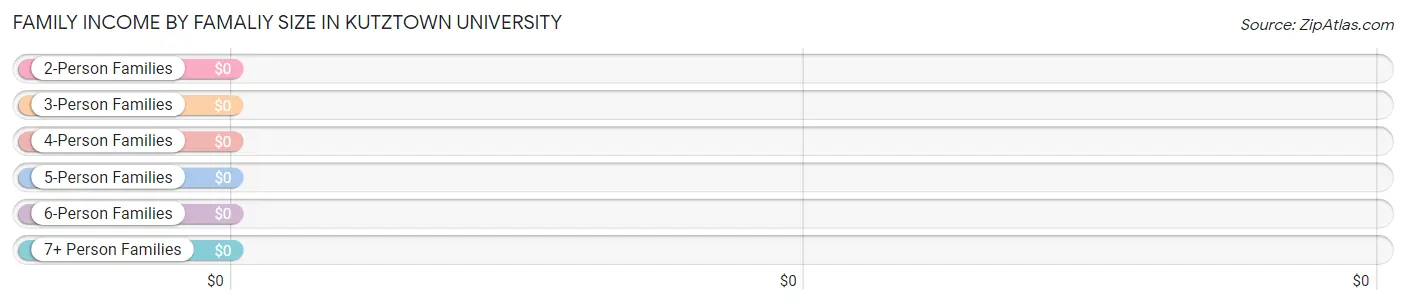
| Income Bracket | # Families | Median Income |
| 2-Person Families | 0 (0.0%) | $0 |
| 3-Person Families | 0 (0.0%) | $0 |
| 4-Person Families | 0 (0.0%) | $0 |
| 5-Person Families | 0 (0.0%) | $0 |
| 6-Person Families | 0 (0.0%) | $0 |
| 7+ Person Families | 0 (0.0%) | $0 |
| Total | 0 (0.0%) | $0 |
Family Income by Number of Earners in Kutztown University
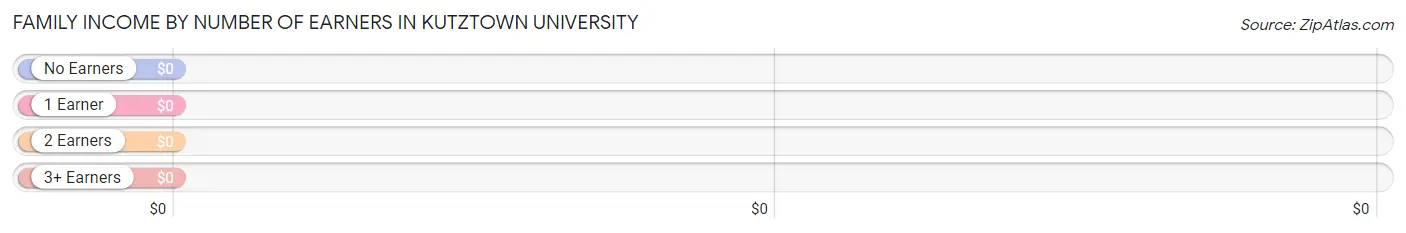
| Number of Earners | # Families | Median Income |
| No Earners | 0 (0.0%) | $0 |
| 1 Earner | 0 (0.0%) | $0 |
| 2 Earners | 0 (0.0%) | $0 |
| 3+ Earners | 0 (0.0%) | $0 |
| Total | 0 (0.0%) | $0 |
Household Income in Kutztown University
Household Income Brackets in Kutztown University
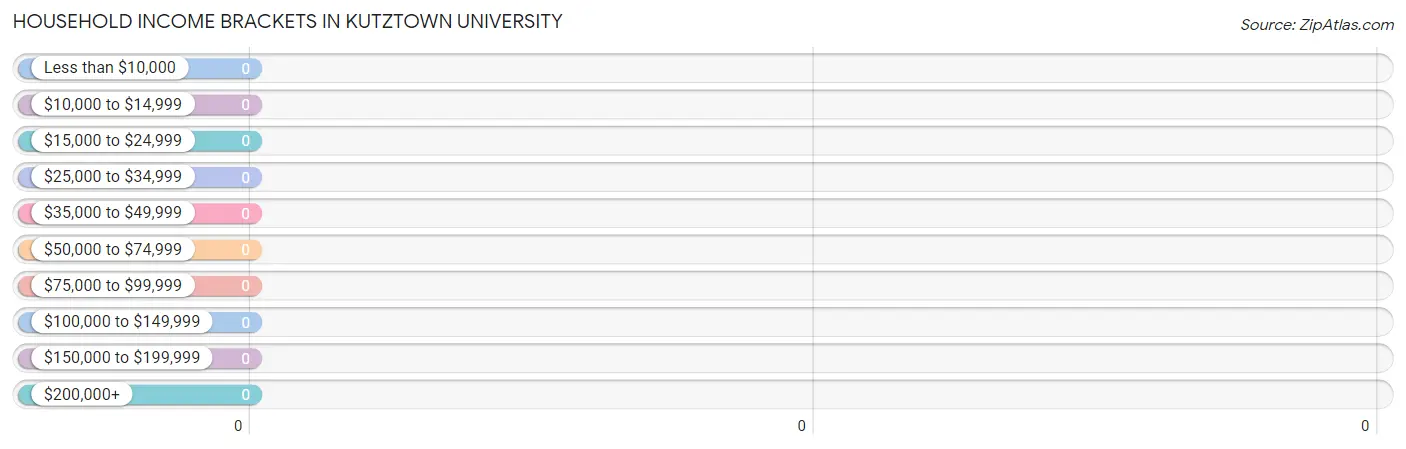
| Income Bracket | # Households | % Households |
| Less than $10,000 | 0 | 0.0% |
| $10,000 to $14,999 | 0 | 0.0% |
| $15,000 to $24,999 | 0 | 0.0% |
| $25,000 to $34,999 | 0 | 0.0% |
| $35,000 to $49,999 | 0 | 0.0% |
| $50,000 to $74,999 | 0 | 0.0% |
| $75,000 to $99,999 | 0 | 0.0% |
| $100,000 to $149,999 | 0 | 0.0% |
| $150,000 to $199,999 | 0 | 0.0% |
| $200,000+ | 0 | 0.0% |
Household Income by Householder Age in Kutztown University
| Income Bracket | # Households | Median Income |
| 15 to 24 Years | 0 (0.0%) | $0 |
| 25 to 44 Years | 0 (0.0%) | $0 |
| 45 to 64 Years | 0 (0.0%) | $0 |
| 65+ Years | 0 (0.0%) | $0 |
| Total | 0 (0.0%) | $0 |
Poverty in Kutztown University
Income Below Poverty by Sex and Age in Kutztown University
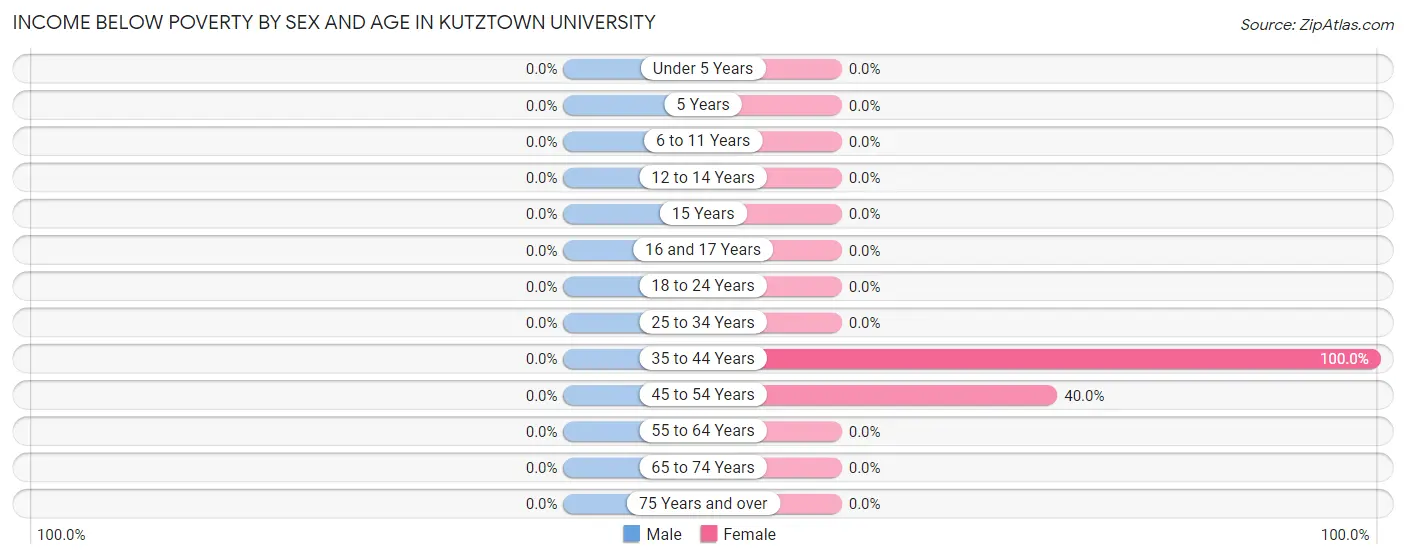
| Age Bracket | Male | Female |
| Under 5 Years | 0 (0.0%) | 0 (0.0%) |
| 5 Years | 0 (0.0%) | 0 (0.0%) |
| 6 to 11 Years | 0 (0.0%) | 0 (0.0%) |
| 12 to 14 Years | 0 (0.0%) | 0 (0.0%) |
| 15 Years | 0 (0.0%) | 0 (0.0%) |
| 16 and 17 Years | 0 (0.0%) | 0 (0.0%) |
| 18 to 24 Years | 0 (0.0%) | 0 (0.0%) |
| 25 to 34 Years | 0 (0.0%) | 0 (0.0%) |
| 35 to 44 Years | 0 (0.0%) | 2 (100.0%) |
| 45 to 54 Years | 0 (0.0%) | 2 (40.0%) |
| 55 to 64 Years | 0 (0.0%) | 0 (0.0%) |
| 65 to 74 Years | 0 (0.0%) | 0 (0.0%) |
| 75 Years and over | 0 (0.0%) | 0 (0.0%) |
| Total | 0 (0.0%) | 4 (40.0%) |
Income Above Poverty by Sex and Age in Kutztown University
According to the poverty statistics in Kutztown University, males aged 45 to 54 years and females aged 55 to 64 years are the age groups that are most secure financially, with 100.0% of males and 100.0% of females in these age groups living above the poverty line.
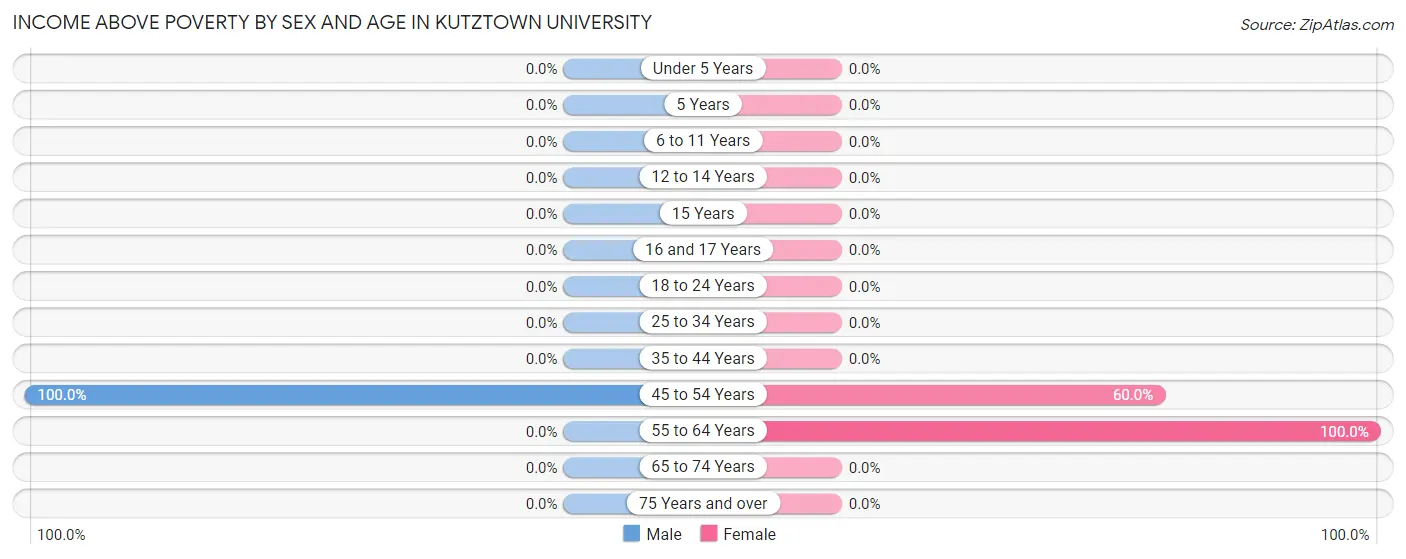
| Age Bracket | Male | Female |
| Under 5 Years | 0 (0.0%) | 0 (0.0%) |
| 5 Years | 0 (0.0%) | 0 (0.0%) |
| 6 to 11 Years | 0 (0.0%) | 0 (0.0%) |
| 12 to 14 Years | 0 (0.0%) | 0 (0.0%) |
| 15 Years | 0 (0.0%) | 0 (0.0%) |
| 16 and 17 Years | 0 (0.0%) | 0 (0.0%) |
| 18 to 24 Years | 0 (0.0%) | 0 (0.0%) |
| 25 to 34 Years | 0 (0.0%) | 0 (0.0%) |
| 35 to 44 Years | 0 (0.0%) | 0 (0.0%) |
| 45 to 54 Years | 2 (100.0%) | 3 (60.0%) |
| 55 to 64 Years | 0 (0.0%) | 3 (100.0%) |
| 65 to 74 Years | 0 (0.0%) | 0 (0.0%) |
| 75 Years and over | 0 (0.0%) | 0 (0.0%) |
| Total | 2 (100.0%) | 6 (60.0%) |
Income Below Poverty Among Married-Couple Families in Kutztown University
| Children | Above Poverty | Below Poverty |
| No Children | 0 (0.0%) | 0 (0.0%) |
| 1 or 2 Children | 0 (0.0%) | 0 (0.0%) |
| 3 or 4 Children | 0 (0.0%) | 0 (0.0%) |
| 5 or more Children | 0 (0.0%) | 0 (0.0%) |
| Total | 0 (0.0%) | 0 (0.0%) |
Income Below Poverty Among Single-Parent Households in Kutztown University
| Children | Single Father | Single Mother |
| No Children | 0 (0.0%) | 0 (0.0%) |
| 1 or 2 Children | 0 (0.0%) | 0 (0.0%) |
| 3 or 4 Children | 0 (0.0%) | 0 (0.0%) |
| 5 or more Children | 0 (0.0%) | 0 (0.0%) |
| Total | 0 (0.0%) | 0 (0.0%) |
Income Below Poverty Among Married-Couple vs Single-Parent Households in Kutztown University
| Children | Married-Couple Families | Single-Parent Households |
| No Children | 0 (0.0%) | 0 (0.0%) |
| 1 or 2 Children | 0 (0.0%) | 0 (0.0%) |
| 3 or 4 Children | 0 (0.0%) | 0 (0.0%) |
| 5 or more Children | 0 (0.0%) | 0 (0.0%) |
| Total | 0 (0.0%) | 0 (0.0%) |
Race in Kutztown University
The most populous races in Kutztown University are White / Caucasian (3,082 | 75.8%), Black / African American (660 | 16.2%), and Hispanic or Latino (322 | 7.9%).
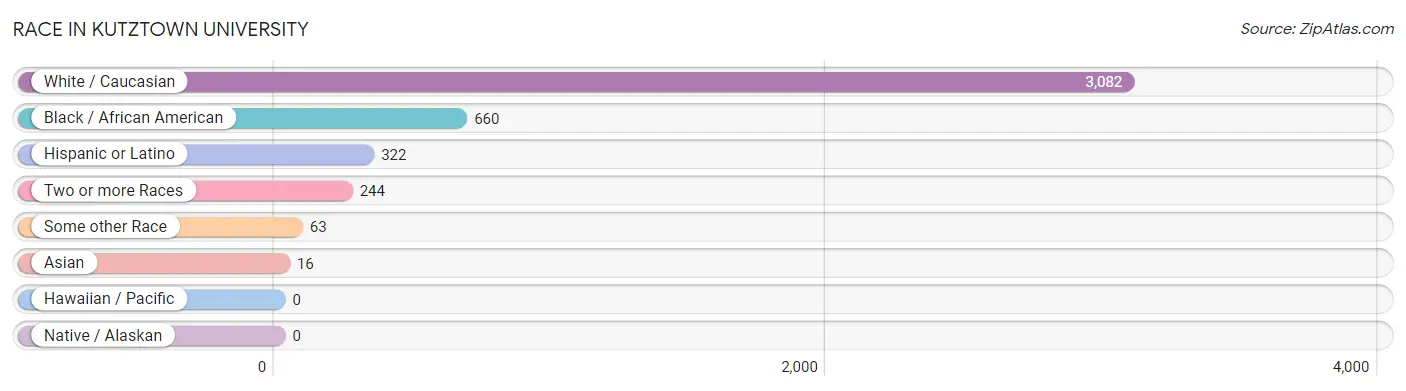
| Race | # Population | % Population |
| Asian | 16 | 0.4% |
| Black / African American | 660 | 16.2% |
| Hawaiian / Pacific | 0 | 0.0% |
| Hispanic or Latino | 322 | 7.9% |
| Native / Alaskan | 0 | 0.0% |
| White / Caucasian | 3,082 | 75.8% |
| Two or more Races | 244 | 6.0% |
| Some other Race | 63 | 1.5% |
| Total | 4,065 | 100.0% |
Ancestry in Kutztown University
The most populous ancestries reported in Kutztown University are German (686 | 16.9%), Irish (625 | 15.4%), Italian (545 | 13.4%), Polish (256 | 6.3%), and Puerto Rican (208 | 5.1%), together accounting for 57.1% of all Kutztown University residents.
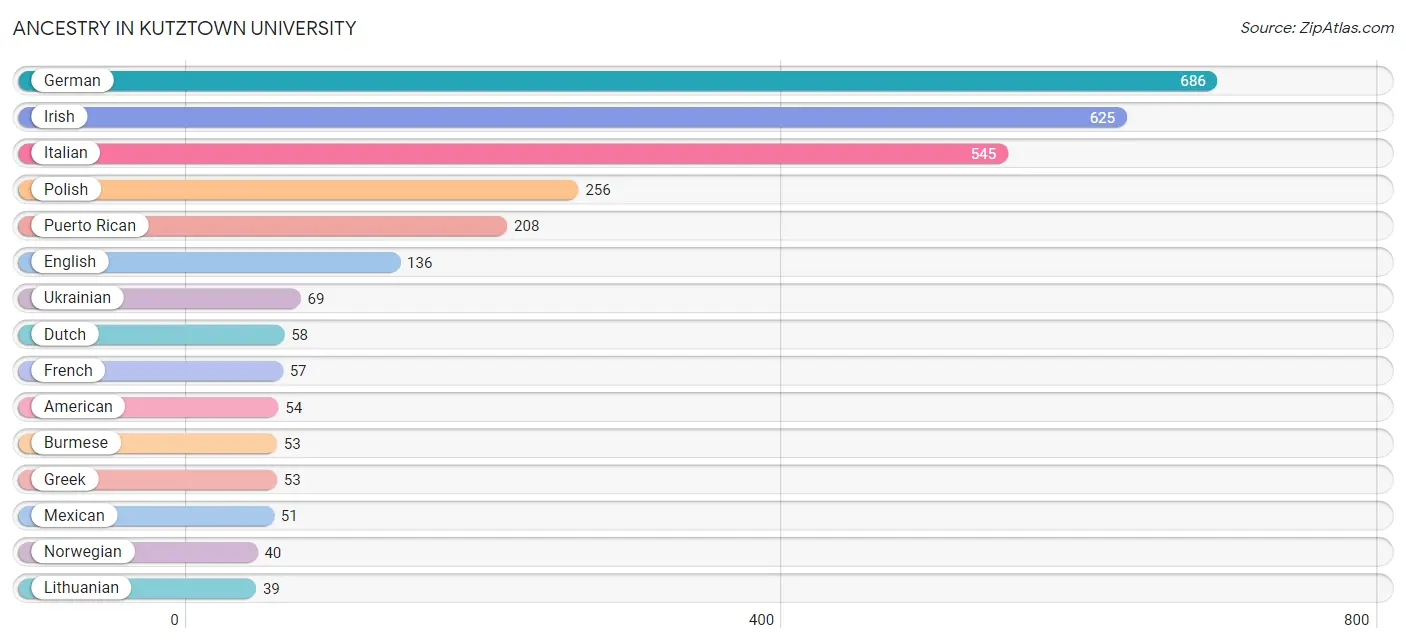
| Ancestry | # Population | % Population |
| African | 17 | 0.4% |
| American | 54 | 1.3% |
| Arab | 17 | 0.4% |
| Armenian | 7 | 0.2% |
| Bhutanese | 13 | 0.3% |
| British | 24 | 0.6% |
| Burmese | 53 | 1.3% |
| Central American Indian | 15 | 0.4% |
| Cuban | 6 | 0.2% |
| Czechoslovakian | 5 | 0.1% |
| Danish | 12 | 0.3% |
| Dominican | 22 | 0.5% |
| Dutch | 58 | 1.4% |
| English | 136 | 3.4% |
| European | 25 | 0.6% |
| French | 57 | 1.4% |
| French Canadian | 14 | 0.3% |
| German | 686 | 16.9% |
| Greek | 53 | 1.3% |
| Haitian | 7 | 0.2% |
| Hungarian | 20 | 0.5% |
| Irish | 625 | 15.4% |
| Israeli | 5 | 0.1% |
| Italian | 545 | 13.4% |
| Jamaican | 26 | 0.6% |
| Kenyan | 1 | 0.0% |
| Korean | 23 | 0.6% |
| Liberian | 6 | 0.2% |
| Lithuanian | 39 | 1.0% |
| Mexican | 51 | 1.3% |
| Northern European | 1 | 0.0% |
| Norwegian | 40 | 1.0% |
| Pennsylvania German | 19 | 0.5% |
| Polish | 256 | 6.3% |
| Portuguese | 5 | 0.1% |
| Puerto Rican | 208 | 5.1% |
| Russian | 3 | 0.1% |
| Scottish | 28 | 0.7% |
| Slovak | 15 | 0.4% |
| South American | 18 | 0.4% |
| Spaniard | 7 | 0.2% |
| Subsaharan African | 24 | 0.6% |
| Syrian | 13 | 0.3% |
| Thai | 25 | 0.6% |
| Trinidadian and Tobagonian | 24 | 0.6% |
| Ukrainian | 69 | 1.7% |
| Uruguayan | 7 | 0.2% |
| Venezuelan | 11 | 0.3% |
| Welsh | 27 | 0.7% | View All 49 Rows |
Immigrants in Kutztown University
The most numerous immigrant groups reported in Kutztown University came from Africa (42 | 1.0%), Europe (37 | 0.9%), Western Africa (37 | 0.9%), Latin America (36 | 0.9%), and Central America (24 | 0.6%), together accounting for 4.3% of all Kutztown University residents.
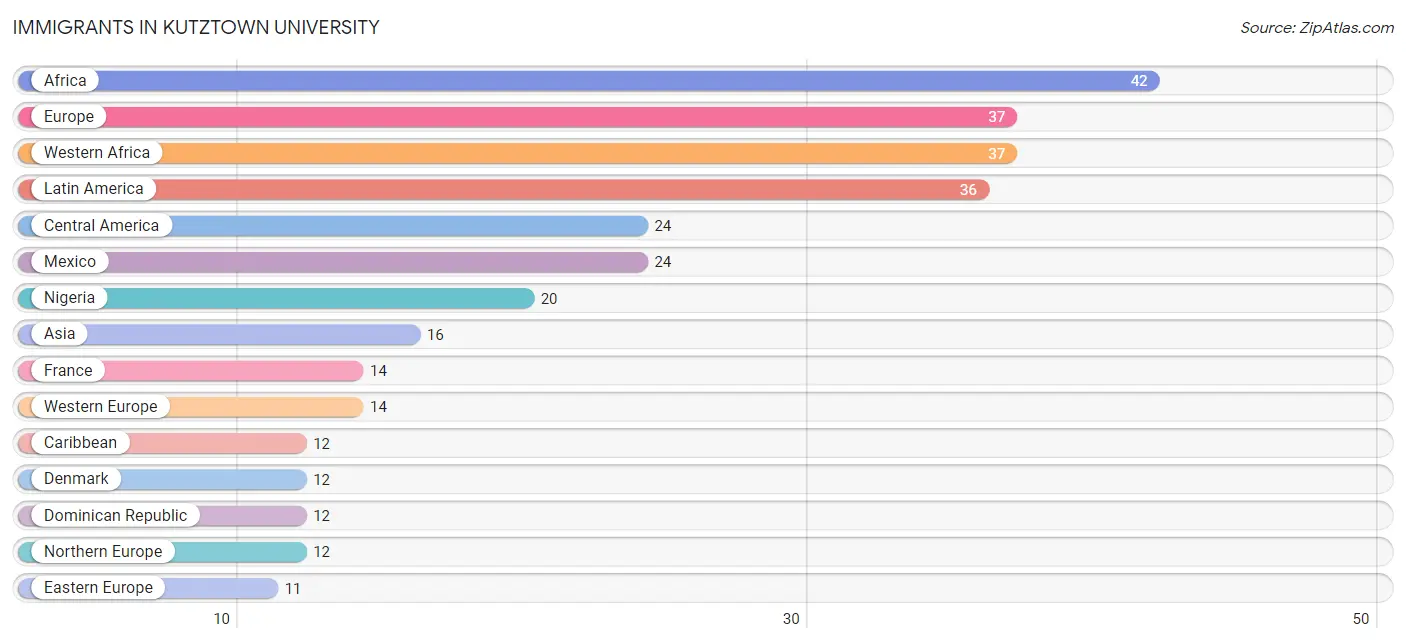
| Immigration Origin | # Population | % Population |
| Africa | 42 | 1.0% |
| Asia | 16 | 0.4% |
| Caribbean | 12 | 0.3% |
| Central America | 24 | 0.6% |
| Denmark | 12 | 0.3% |
| Dominican Republic | 12 | 0.3% |
| Eastern Africa | 1 | 0.0% |
| Eastern Asia | 10 | 0.3% |
| Eastern Europe | 11 | 0.3% |
| Europe | 37 | 0.9% |
| France | 14 | 0.3% |
| Kenya | 1 | 0.0% |
| Korea | 10 | 0.3% |
| Latin America | 36 | 0.9% |
| Mexico | 24 | 0.6% |
| Nigeria | 20 | 0.5% |
| Northern Africa | 4 | 0.1% |
| Northern Europe | 12 | 0.3% |
| Poland | 1 | 0.0% |
| Russia | 10 | 0.3% |
| South Central Asia | 6 | 0.2% |
| Western Africa | 37 | 0.9% |
| Western Europe | 14 | 0.3% | View All 23 Rows |
Sex and Age in Kutztown University
Sex and Age in Kutztown University
The most populous age groups in Kutztown University are 15 to 19 Years (1,161 | 62.1%) for men and 15 to 19 Years (1,360 | 61.9%) for women.
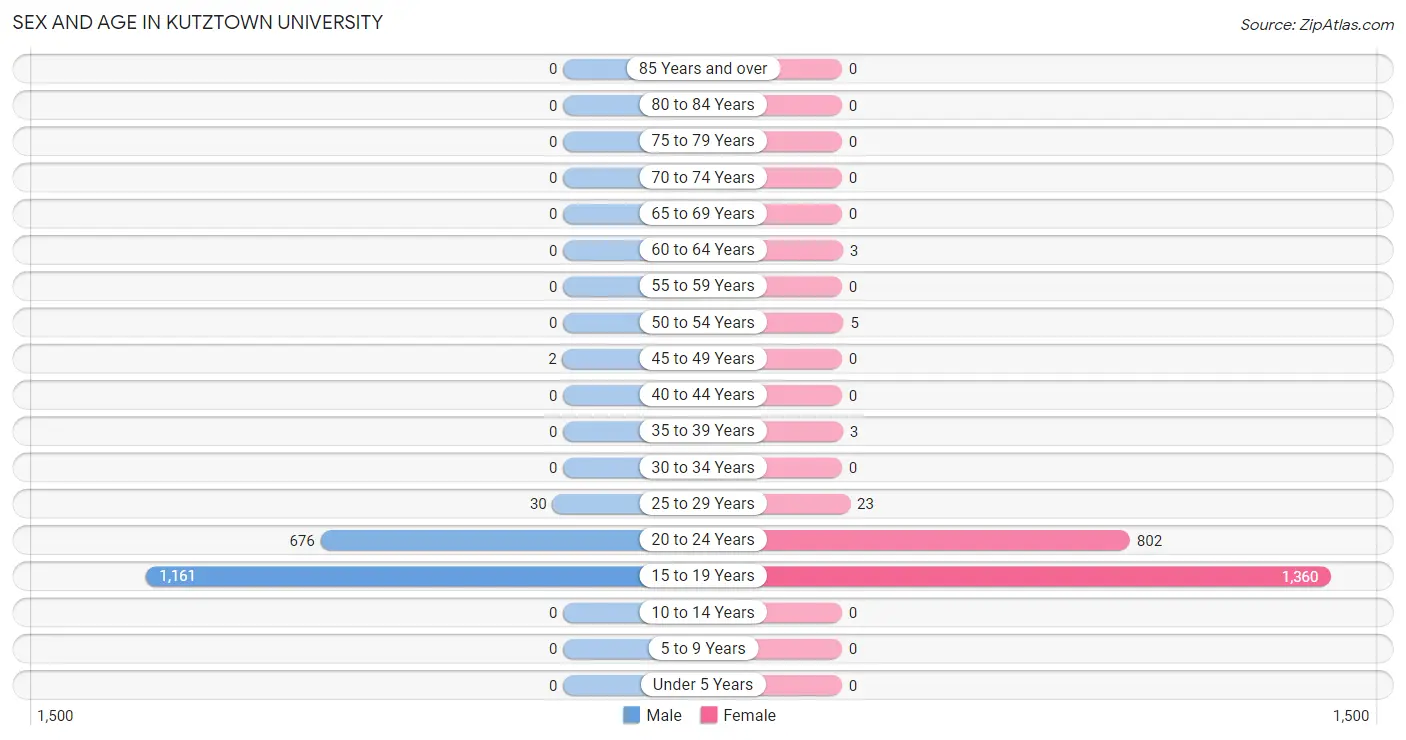
| Age Bracket | Male | Female |
| Under 5 Years | 0 (0.0%) | 0 (0.0%) |
| 5 to 9 Years | 0 (0.0%) | 0 (0.0%) |
| 10 to 14 Years | 0 (0.0%) | 0 (0.0%) |
| 15 to 19 Years | 1,161 (62.1%) | 1,360 (61.9%) |
| 20 to 24 Years | 676 (36.2%) | 802 (36.5%) |
| 25 to 29 Years | 30 (1.6%) | 23 (1.1%) |
| 30 to 34 Years | 0 (0.0%) | 0 (0.0%) |
| 35 to 39 Years | 0 (0.0%) | 3 (0.1%) |
| 40 to 44 Years | 0 (0.0%) | 0 (0.0%) |
| 45 to 49 Years | 2 (0.1%) | 0 (0.0%) |
| 50 to 54 Years | 0 (0.0%) | 5 (0.2%) |
| 55 to 59 Years | 0 (0.0%) | 0 (0.0%) |
| 60 to 64 Years | 0 (0.0%) | 3 (0.1%) |
| 65 to 69 Years | 0 (0.0%) | 0 (0.0%) |
| 70 to 74 Years | 0 (0.0%) | 0 (0.0%) |
| 75 to 79 Years | 0 (0.0%) | 0 (0.0%) |
| 80 to 84 Years | 0 (0.0%) | 0 (0.0%) |
| 85 Years and over | 0 (0.0%) | 0 (0.0%) |
| Total | 1,869 (100.0%) | 2,196 (100.0%) |
Families and Households in Kutztown University
Median Family Size in Kutztown University
| Family Type | # Families | Family Size |
| Married-Couple | 0 (0.0%) | - |
| Single Male/Father | 0 (0.0%) | - |
| Single Female/Mother | 0 (0.0%) | - |
| Total Families | 0 (0.0%) | - |
Median Household Size in Kutztown University
| Household Type | # Households | Household Size |
| Married-Couple | 0 (0.0%) | - |
| Single Male/Father | 0 (0.0%) | - |
| Single Female/Mother | 0 (0.0%) | - |
| Non-family | 0 (0.0%) | - |
| Total Households | 0 (0.0%) | - |
Household Size by Marriage Status in Kutztown University
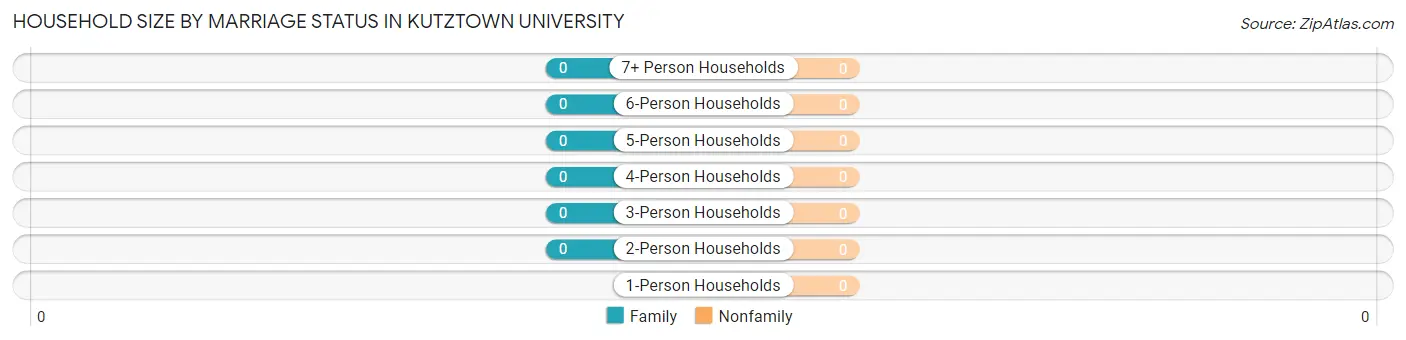
| Household Size | Family Households | Nonfamily Households |
| 1-Person Households | - | 0 (0.0%) |
| 2-Person Households | 0 (0.0%) | 0 (0.0%) |
| 3-Person Households | 0 (0.0%) | 0 (0.0%) |
| 4-Person Households | 0 (0.0%) | 0 (0.0%) |
| 5-Person Households | 0 (0.0%) | 0 (0.0%) |
| 6-Person Households | 0 (0.0%) | 0 (0.0%) |
| 7+ Person Households | 0 (0.0%) | 0 (0.0%) |
| Total | 0 (0.0%) | 0 (0.0%) |
Female Fertility in Kutztown University
Fertility by Age in Kutztown University
| Age Bracket | Women with Births | Births / 1,000 Women |
| 15 to 19 years | 0 (0.0%) | 0.0 |
| 20 to 34 years | 0 (0.0%) | 0.0 |
| 35 to 50 years | 0 (0.0%) | 0.0 |
| Total | 0 (0.0%) | 0.0 |
Fertility by Age by Marriage Status in Kutztown University
| Age Bracket | Married | Unmarried |
| 15 to 19 years | 0 (0.0%) | 0 (0.0%) |
| 20 to 34 years | 0 (0.0%) | 0 (0.0%) |
| 35 to 50 years | 0 (0.0%) | 0 (0.0%) |
| Total | 0 (0.0%) | 0 (0.0%) |
Fertility by Education in Kutztown University
| Educational Attainment | Women with Births | Births / 1,000 Women |
| Less than High School | 0 (0.0%) | 0.0 |
| High School Diploma | 0 (0.0%) | 0.0 |
| College or Associate's Degree | 0 (0.0%) | 0.0 |
| Bachelor's Degree | 0 (0.0%) | 0.0 |
| Graduate Degree | 0 (0.0%) | 0.0 |
| Total | 0 (0.0%) | 0.0 |
Fertility by Education by Marriage Status in Kutztown University
| Educational Attainment | Married | Unmarried |
| Less than High School | 0 (0.0%) | 0 (0.0%) |
| High School Diploma | 0 (0.0%) | 0 (0.0%) |
| College or Associate's Degree | 0 (0.0%) | 0 (0.0%) |
| Bachelor's Degree | 0 (0.0%) | 0 (0.0%) |
| Graduate Degree | 0 (0.0%) | 0 (0.0%) |
| Total | 0 (0.0%) | 0 (0.0%) |
Employment Characteristics in Kutztown University
Employment by Class of Employer in Kutztown University
Among the 1,424 employed individuals in Kutztown University, private company employees (1,017 | 71.4%), state government employees (202 | 14.2%), and not-for-profit organizations (121 | 8.5%) make up the most common classes of employment.
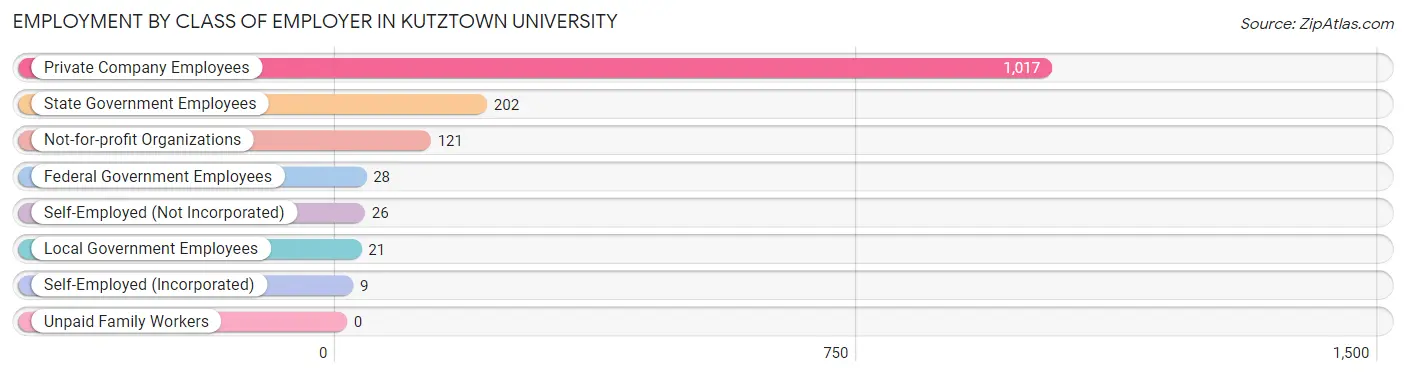
| Employer Class | # Employees | % Employees |
| Private Company Employees | 1,017 | 71.4% |
| Self-Employed (Incorporated) | 9 | 0.6% |
| Self-Employed (Not Incorporated) | 26 | 1.8% |
| Not-for-profit Organizations | 121 | 8.5% |
| Local Government Employees | 21 | 1.5% |
| State Government Employees | 202 | 14.2% |
| Federal Government Employees | 28 | 2.0% |
| Unpaid Family Workers | 0 | 0.0% |
| Total | 1,424 | 100.0% |
Employment Status by Age in Kutztown University
According to the labor force statistics for Kutztown University, out of the total population over 16 years of age (4,065), 45.0% or 1,829 individuals are in the labor force, with 8.5% or 155 of them unemployed. The age group with the highest labor force participation rate is 60 to 64 years, with 100.0% or 3 individuals in the labor force. Within the labor force, the 16 to 19 years age range has the highest percentage of unemployed individuals, with 9.0% or 101 of them being unemployed.
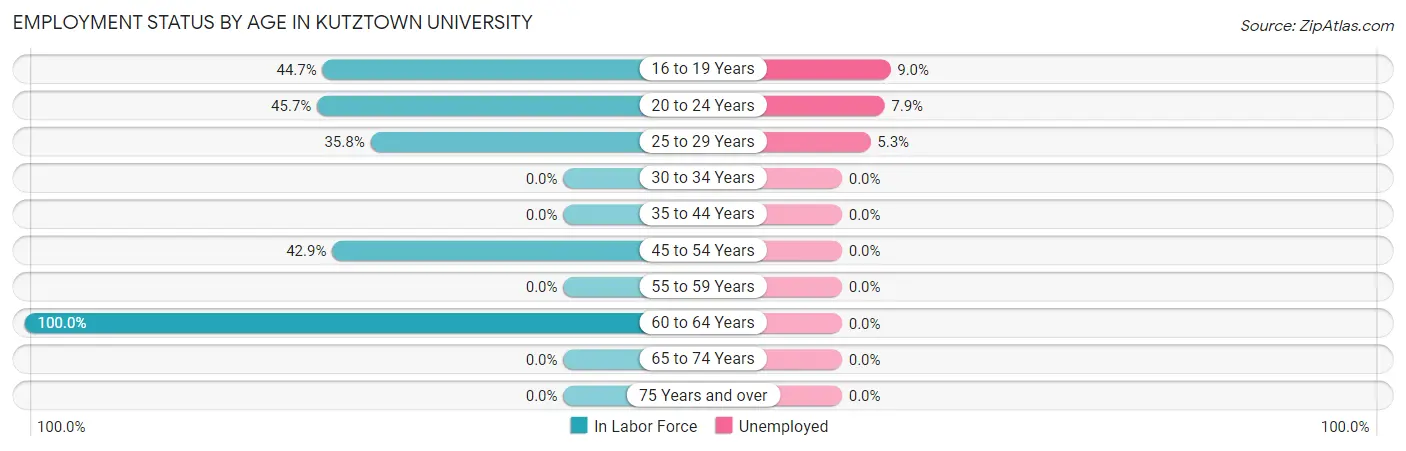
| Age Bracket | In Labor Force | Unemployed |
| 16 to 19 Years | 1,127 (44.7%) | 101 (9.0%) |
| 20 to 24 Years | 675 (45.7%) | 53 (7.9%) |
| 25 to 29 Years | 19 (35.8%) | 1 (5.3%) |
| 30 to 34 Years | 0 (0.0%) | 0 (0.0%) |
| 35 to 44 Years | 0 (0.0%) | 0 (0.0%) |
| 45 to 54 Years | 3 (42.9%) | 0 (0.0%) |
| 55 to 59 Years | 0 (0.0%) | 0 (0.0%) |
| 60 to 64 Years | 3 (100.0%) | 0 (0.0%) |
| 65 to 74 Years | 0 (0.0%) | 0 (0.0%) |
| 75 Years and over | 0 (0.0%) | 0 (0.0%) |
| Total | 1,829 (45.0%) | 155 (8.5%) |
Employment Status by Educational Attainment in Kutztown University
According to labor force statistics for Kutztown University, 37.9% of individuals (25) out of the total population between 25 and 64 years of age (66) are in the labor force, with 4.0% or 1 of them being unemployed. The group with the highest labor force participation rate are those with the educational attainment of college / associate degree, with 50.0% or 16 individuals in the labor force. Within the labor force, individuals with bachelor's degree or higher education have the highest percentage of unemployment, with 11.1% or 1 of them being unemployed.
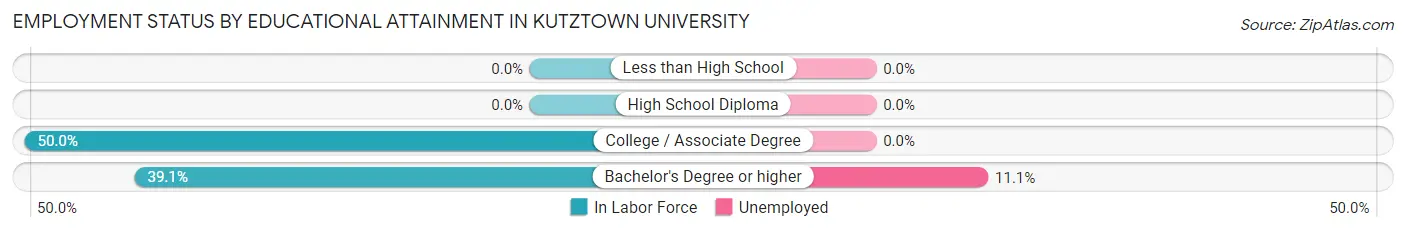
| Educational Attainment | In Labor Force | Unemployed |
| Less than High School | 0 (0.0%) | 0 (0.0%) |
| High School Diploma | 0 (0.0%) | 0 (0.0%) |
| College / Associate Degree | 16 (50.0%) | 0 (0.0%) |
| Bachelor's Degree or higher | 9 (39.1%) | 3 (11.1%) |
| Total | 25 (37.9%) | 3 (4.0%) |
Employment Occupations by Sex in Kutztown University
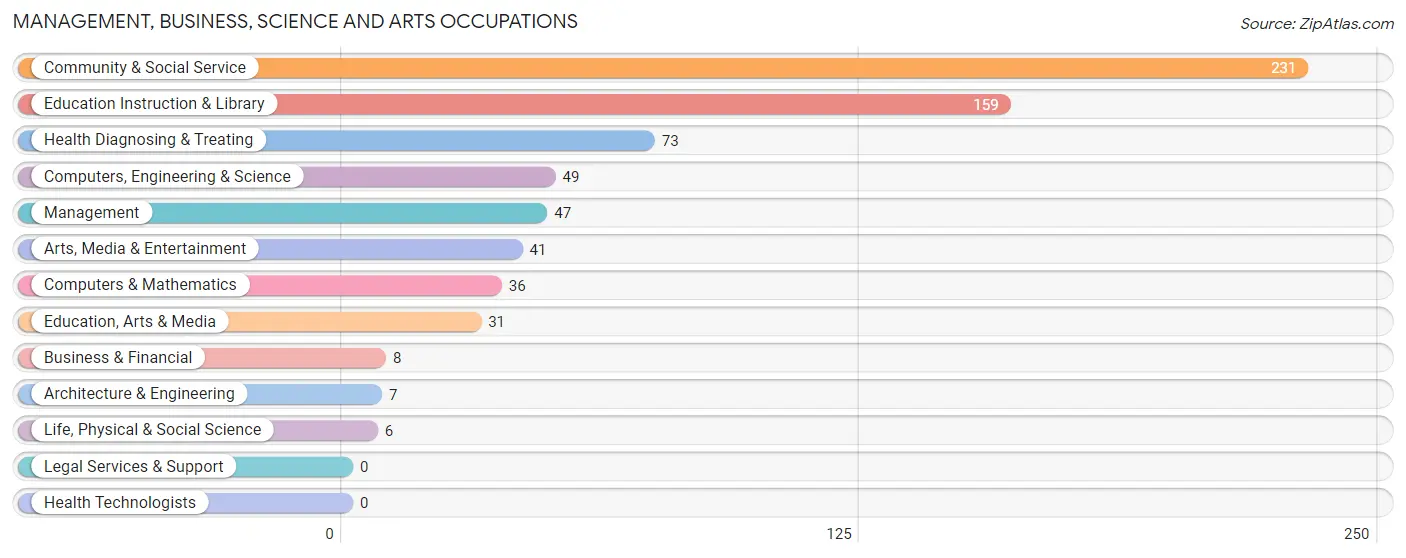
Management, Business, Science and Arts Occupations
The most common Management, Business, Science and Arts occupations in Kutztown University are Community & Social Service (231 | 13.8%), Education Instruction & Library (159 | 9.5%), Health Diagnosing & Treating (73 | 4.4%), Computers, Engineering & Science (49 | 2.9%), and Management (47 | 2.8%).
Management, Business, Science and Arts Occupations by Sex
Within the Management, Business, Science and Arts occupations in Kutztown University, the most male-oriented occupations are Computers & Mathematics (100.0%), Life, Physical & Social Science (100.0%), and Computers, Engineering & Science (85.7%), while the most female-oriented occupations are Business & Financial (100.0%), Architecture & Engineering (100.0%), and Health Diagnosing & Treating (100.0%).
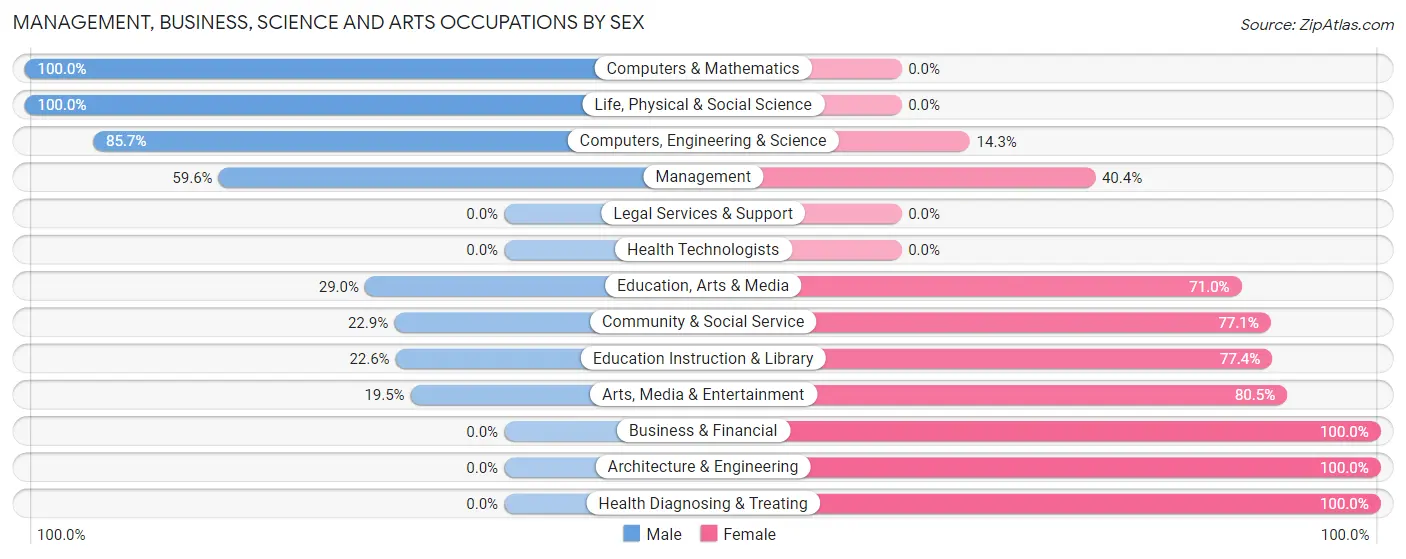
| Occupation | Male | Female |
| Management | 28 (59.6%) | 19 (40.4%) |
| Business & Financial | 0 (0.0%) | 8 (100.0%) |
| Computers, Engineering & Science | 42 (85.7%) | 7 (14.3%) |
| Computers & Mathematics | 36 (100.0%) | 0 (0.0%) |
| Architecture & Engineering | 0 (0.0%) | 7 (100.0%) |
| Life, Physical & Social Science | 6 (100.0%) | 0 (0.0%) |
| Community & Social Service | 53 (22.9%) | 178 (77.1%) |
| Education, Arts & Media | 9 (29.0%) | 22 (71.0%) |
| Legal Services & Support | 0 (0.0%) | 0 (0.0%) |
| Education Instruction & Library | 36 (22.6%) | 123 (77.4%) |
| Arts, Media & Entertainment | 8 (19.5%) | 33 (80.5%) |
| Health Diagnosing & Treating | 0 (0.0%) | 73 (100.0%) |
| Health Technologists | 0 (0.0%) | 0 (0.0%) |
| Total (Category) | 123 (30.1%) | 285 (69.9%) |
| Total (Overall) | 672 (40.2%) | 1,000 (59.8%) |
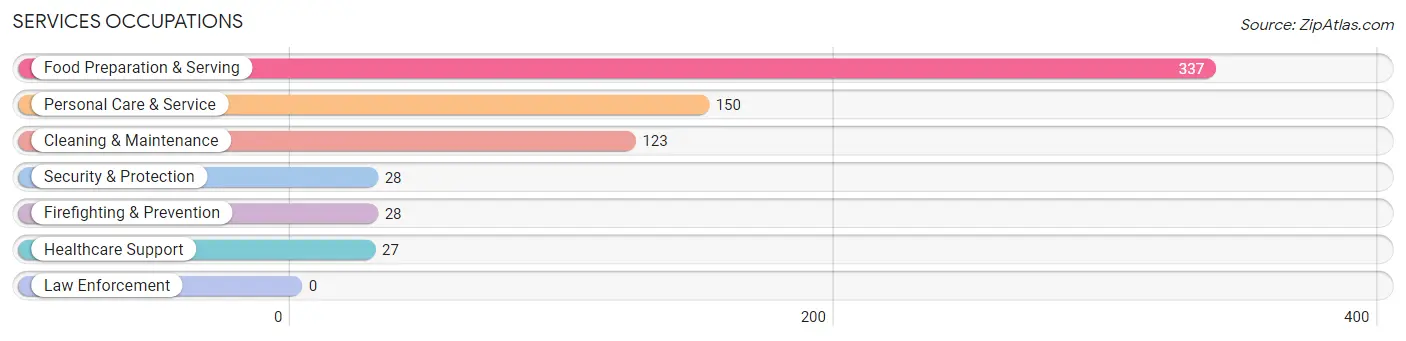
Services Occupations
The most common Services occupations in Kutztown University are Food Preparation & Serving (337 | 20.2%), Personal Care & Service (150 | 9.0%), Cleaning & Maintenance (123 | 7.4%), Security & Protection (28 | 1.7%), and Firefighting & Prevention (28 | 1.7%).
Services Occupations by Sex
Within the Services occupations in Kutztown University, the most male-oriented occupations are Cleaning & Maintenance (72.4%), Healthcare Support (63.0%), and Food Preparation & Serving (48.4%), while the most female-oriented occupations are Security & Protection (75.0%), Firefighting & Prevention (75.0%), and Personal Care & Service (58.0%).
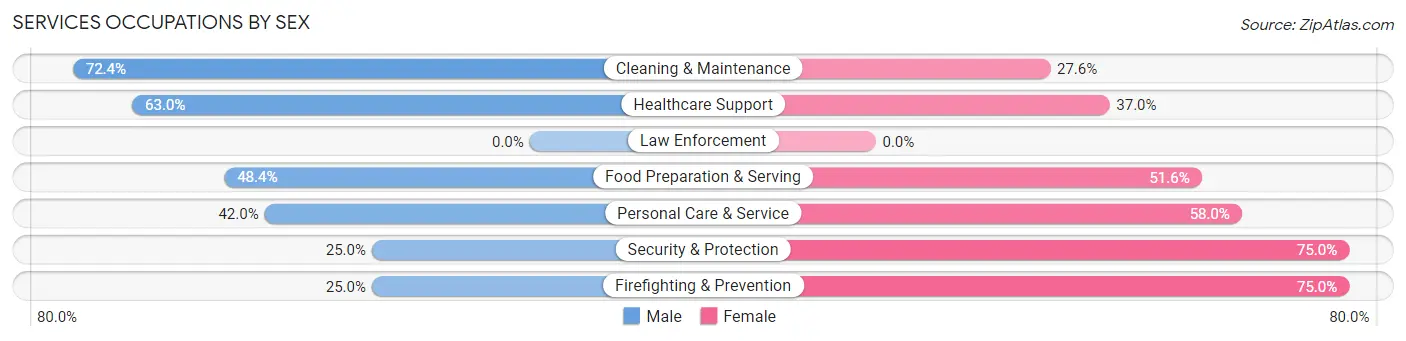
| Occupation | Male | Female |
| Healthcare Support | 17 (63.0%) | 10 (37.0%) |
| Security & Protection | 7 (25.0%) | 21 (75.0%) |
| Firefighting & Prevention | 7 (25.0%) | 21 (75.0%) |
| Law Enforcement | 0 (0.0%) | 0 (0.0%) |
| Food Preparation & Serving | 163 (48.4%) | 174 (51.6%) |
| Cleaning & Maintenance | 89 (72.4%) | 34 (27.6%) |
| Personal Care & Service | 63 (42.0%) | 87 (58.0%) |
| Total (Category) | 339 (51.0%) | 326 (49.0%) |
| Total (Overall) | 672 (40.2%) | 1,000 (59.8%) |
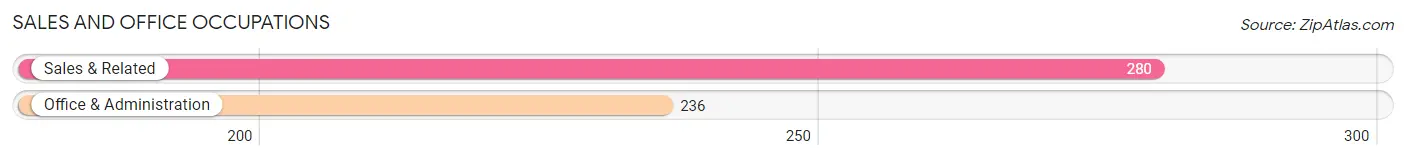
Sales and Office Occupations
The most common Sales and Office occupations in Kutztown University are Sales & Related (280 | 16.8%), and Office & Administration (236 | 14.1%).
Sales and Office Occupations by Sex
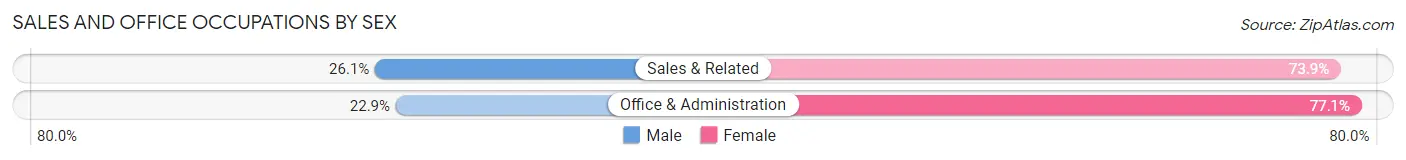
| Occupation | Male | Female |
| Sales & Related | 73 (26.1%) | 207 (73.9%) |
| Office & Administration | 54 (22.9%) | 182 (77.1%) |
| Total (Category) | 127 (24.6%) | 389 (75.4%) |
| Total (Overall) | 672 (40.2%) | 1,000 (59.8%) |
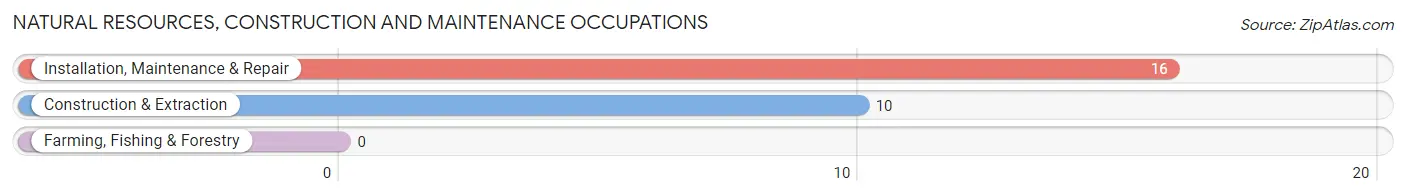
Natural Resources, Construction and Maintenance Occupations
The most common Natural Resources, Construction and Maintenance occupations in Kutztown University are Installation, Maintenance & Repair (16 | 1.0%), and Construction & Extraction (10 | 0.6%).
Natural Resources, Construction and Maintenance Occupations by Sex
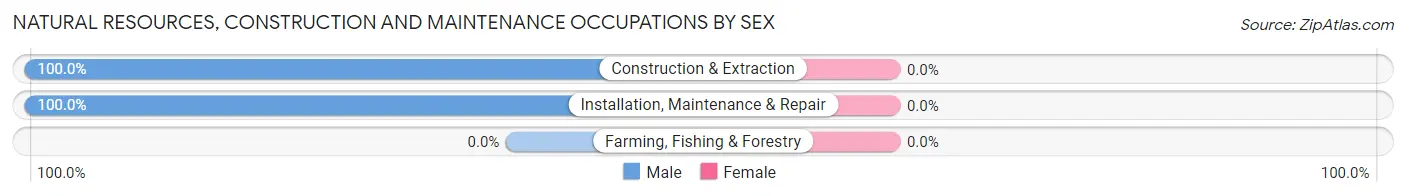
| Occupation | Male | Female |
| Farming, Fishing & Forestry | 0 (0.0%) | 0 (0.0%) |
| Construction & Extraction | 10 (100.0%) | 0 (0.0%) |
| Installation, Maintenance & Repair | 16 (100.0%) | 0 (0.0%) |
| Total (Category) | 26 (100.0%) | 0 (0.0%) |
| Total (Overall) | 672 (40.2%) | 1,000 (59.8%) |
Production, Transportation and Moving Occupations
The most common Production, Transportation and Moving occupations in Kutztown University are Material Moving (20 | 1.2%), Production (19 | 1.1%), and Transportation (18 | 1.1%).
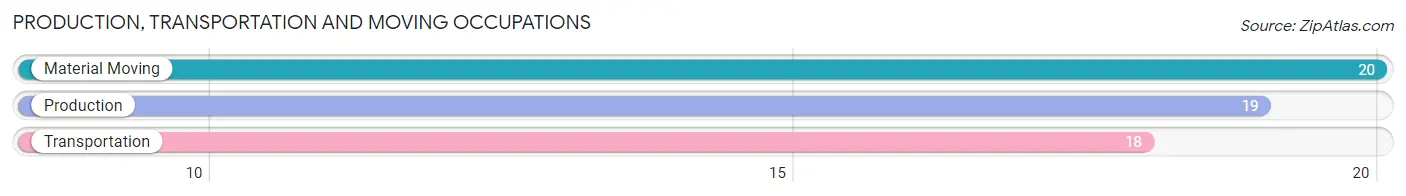
Production, Transportation and Moving Occupations by Sex
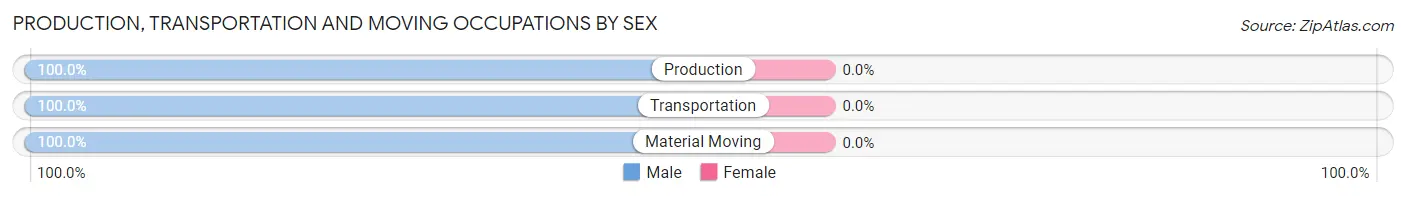
| Occupation | Male | Female |
| Production | 19 (100.0%) | 0 (0.0%) |
| Transportation | 18 (100.0%) | 0 (0.0%) |
| Material Moving | 20 (100.0%) | 0 (0.0%) |
| Total (Category) | 57 (100.0%) | 0 (0.0%) |
| Total (Overall) | 672 (40.2%) | 1,000 (59.8%) |
Employment Industries by Sex in Kutztown University
Employment Industries in Kutztown University
The major employment industries in Kutztown University include Educational Services (530 | 31.7%), Accommodation & Food Services (342 | 20.4%), Retail Trade (218 | 13.0%), Arts, Entertainment & Recreation (182 | 10.9%), and Professional & Scientific (116 | 6.9%).
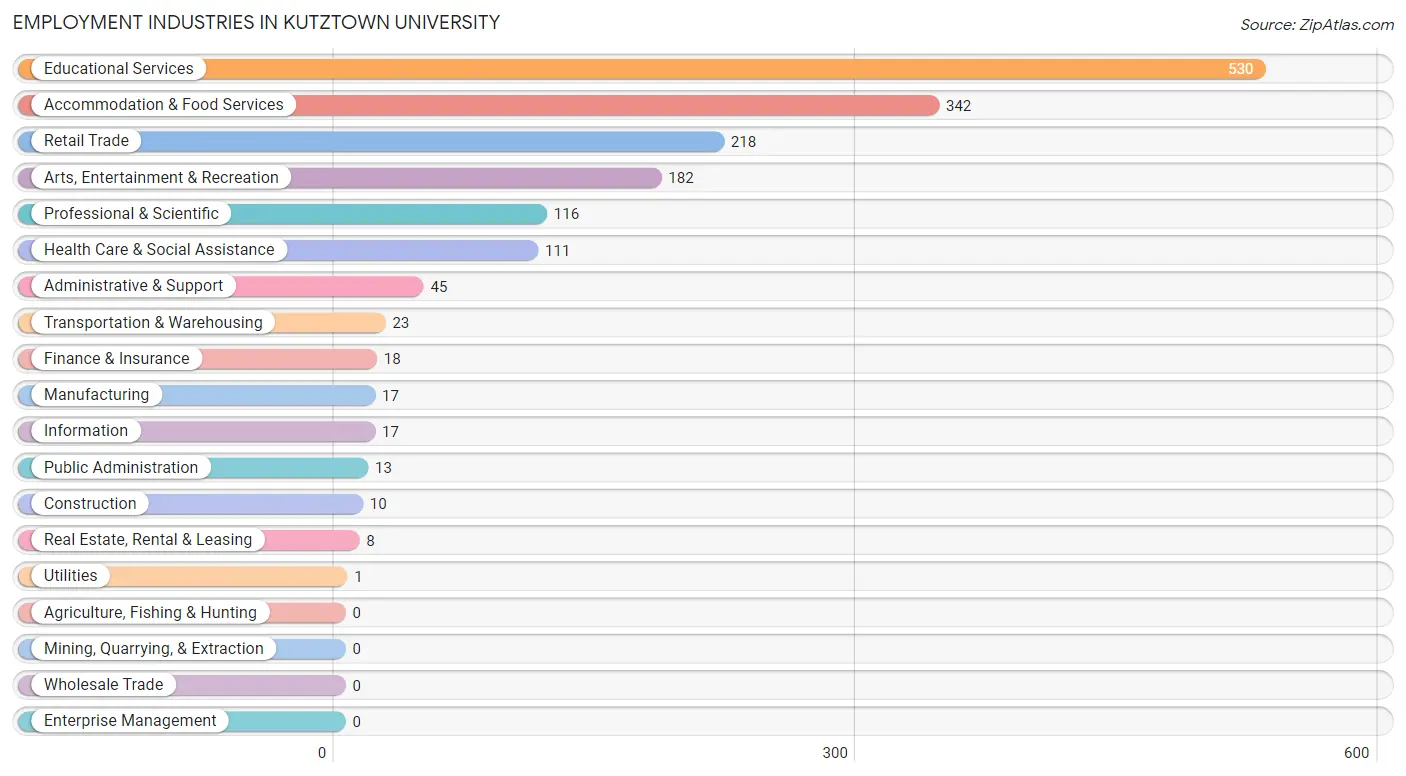
Employment Industries by Sex in Kutztown University
The Kutztown University industries that see more men than women are Construction (100.0%), Transportation & Warehousing (100.0%), and Administrative & Support (100.0%), whereas the industries that tend to have a higher number of women are Manufacturing (100.0%), Utilities (100.0%), and Real Estate, Rental & Leasing (100.0%).
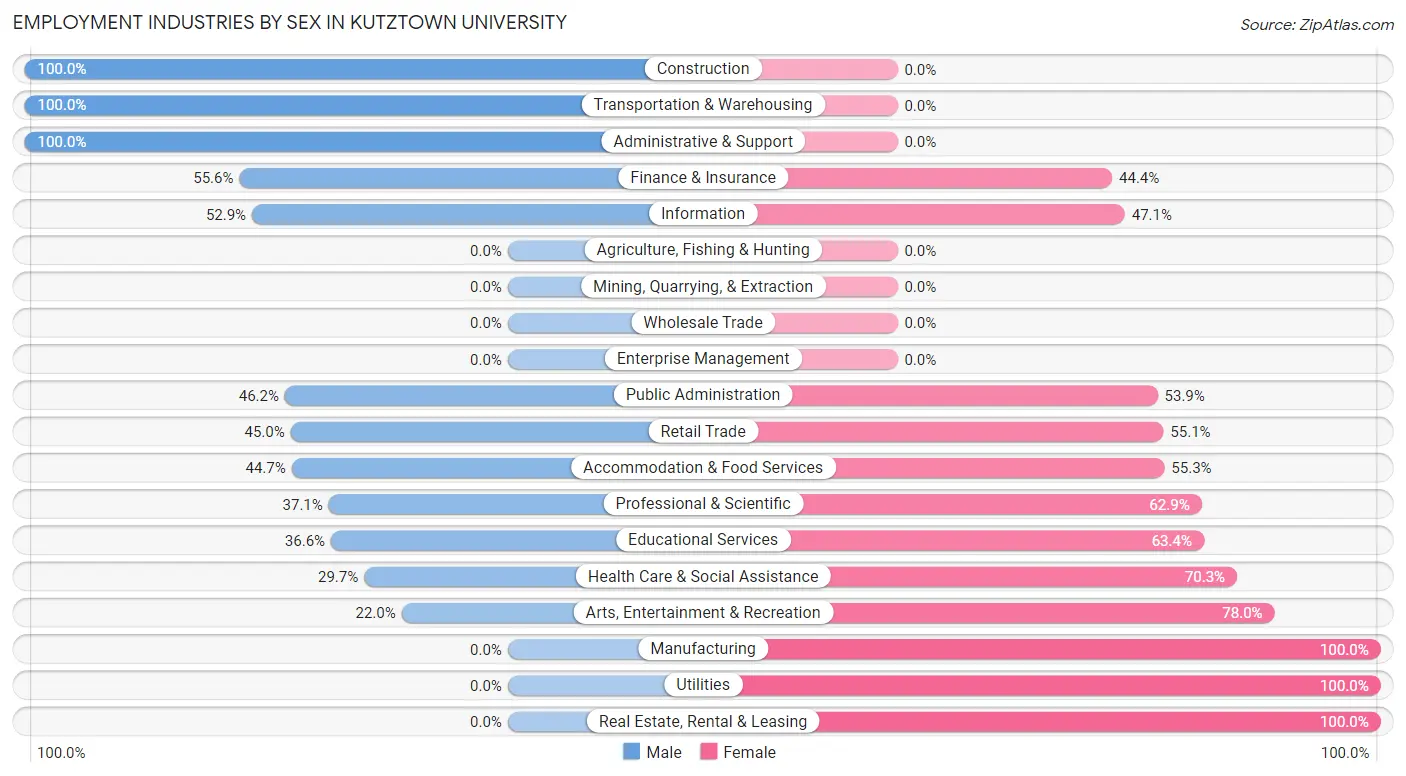
| Industry | Male | Female |
| Agriculture, Fishing & Hunting | 0 (0.0%) | 0 (0.0%) |
| Mining, Quarrying, & Extraction | 0 (0.0%) | 0 (0.0%) |
| Construction | 10 (100.0%) | 0 (0.0%) |
| Manufacturing | 0 (0.0%) | 17 (100.0%) |
| Wholesale Trade | 0 (0.0%) | 0 (0.0%) |
| Retail Trade | 98 (45.0%) | 120 (55.0%) |
| Transportation & Warehousing | 23 (100.0%) | 0 (0.0%) |
| Utilities | 0 (0.0%) | 1 (100.0%) |
| Information | 9 (52.9%) | 8 (47.1%) |
| Finance & Insurance | 10 (55.6%) | 8 (44.4%) |
| Real Estate, Rental & Leasing | 0 (0.0%) | 8 (100.0%) |
| Professional & Scientific | 43 (37.1%) | 73 (62.9%) |
| Enterprise Management | 0 (0.0%) | 0 (0.0%) |
| Administrative & Support | 45 (100.0%) | 0 (0.0%) |
| Educational Services | 194 (36.6%) | 336 (63.4%) |
| Health Care & Social Assistance | 33 (29.7%) | 78 (70.3%) |
| Arts, Entertainment & Recreation | 40 (22.0%) | 142 (78.0%) |
| Accommodation & Food Services | 153 (44.7%) | 189 (55.3%) |
| Public Administration | 6 (46.2%) | 7 (53.8%) |
| Total | 672 (40.2%) | 1,000 (59.8%) |
Education in Kutztown University
School Enrollment in Kutztown University
The most common levels of schooling among the 4,052 students in Kutztown University are college / undergraduate (4,013 | 99.0%), and graduate / professional (39 | 1.0%).
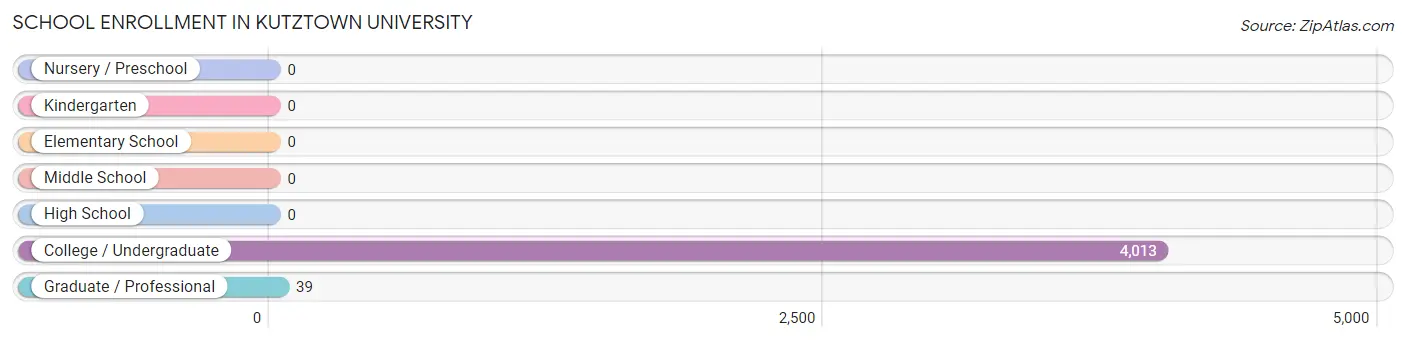
| School Level | # Students | % Students |
| Nursery / Preschool | 0 | 0.0% |
| Kindergarten | 0 | 0.0% |
| Elementary School | 0 | 0.0% |
| Middle School | 0 | 0.0% |
| High School | 0 | 0.0% |
| College / Undergraduate | 4,013 | 99.0% |
| Graduate / Professional | 39 | 1.0% |
| Total | 4,052 | 100.0% |
School Enrollment by Age by Funding Source in Kutztown University
Out of a total of 4,052 students who are enrolled in schools in Kutztown University, 1,001 (24.7%) attend a private institution, while the remaining 3,051 (75.3%) are enrolled in public schools. The age group of 15 to 17 year olds has the highest likelihood of being enrolled in private schools, with 73 (100.0% in the age bracket) enrolled. Conversely, the age group of 35 years and over has the lowest likelihood of being enrolled in a private school, with 1 (100.0% in the age bracket) attending a public institution.
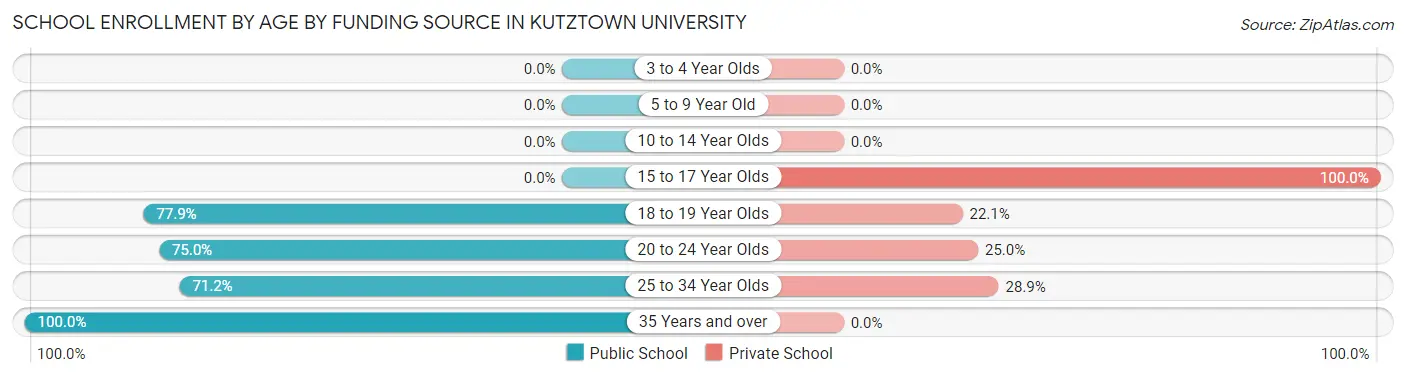
| Age Bracket | Public School | Private School |
| 3 to 4 Year Olds | 0 (0.0%) | 0 (0.0%) |
| 5 to 9 Year Old | 0 (0.0%) | 0 (0.0%) |
| 10 to 14 Year Olds | 0 (0.0%) | 0 (0.0%) |
| 15 to 17 Year Olds | 0 (0.0%) | 73 (100.0%) |
| 18 to 19 Year Olds | 1,906 (77.9%) | 542 (22.1%) |
| 20 to 24 Year Olds | 1,108 (75.0%) | 370 (25.0%) |
| 25 to 34 Year Olds | 37 (71.2%) | 15 (28.8%) |
| 35 Years and over | 1 (100.0%) | 0 (0.0%) |
| Total | 3,051 (75.3%) | 1,001 (24.7%) |
Educational Attainment by Field of Study in Kutztown University
Business (13 | 52.0%), education (8 | 32.0%), psychology (1 | 4.0%), social sciences (1 | 4.0%), and science & technology (1 | 4.0%) are the most common fields of study among 25 individuals in Kutztown University who have obtained a bachelor's degree or higher.
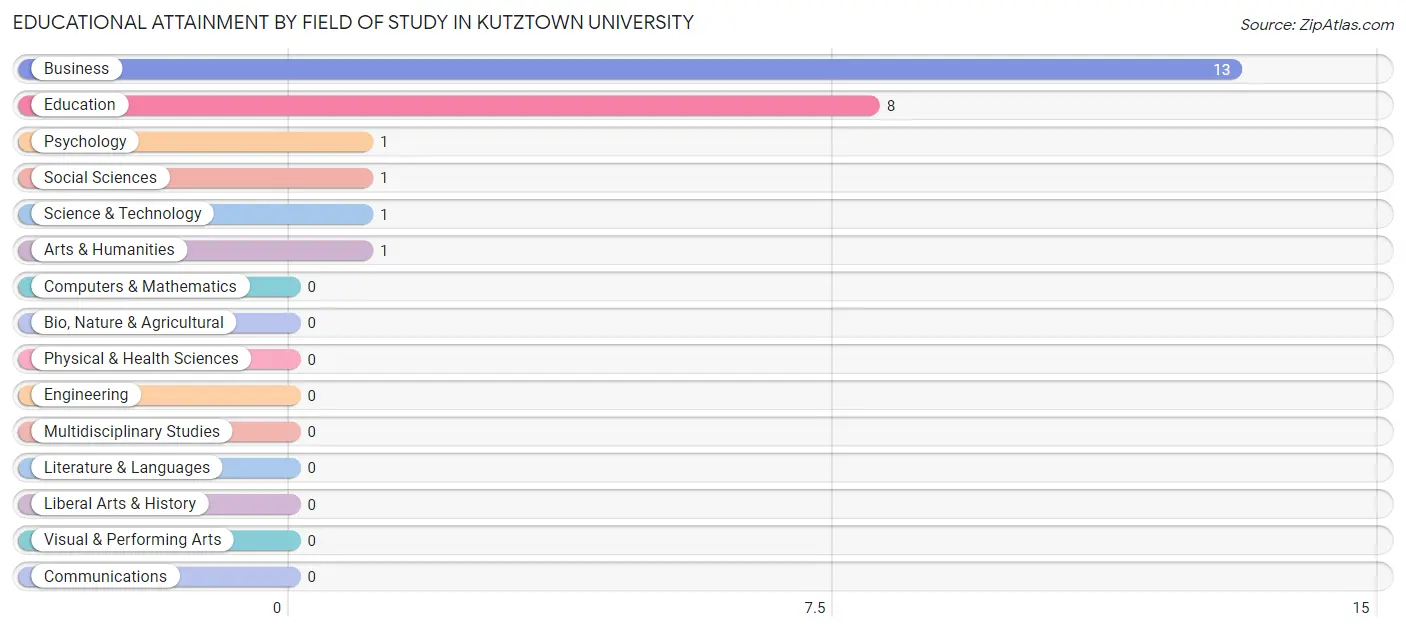
| Field of Study | # Graduates | % Graduates |
| Computers & Mathematics | 0 | 0.0% |
| Bio, Nature & Agricultural | 0 | 0.0% |
| Physical & Health Sciences | 0 | 0.0% |
| Psychology | 1 | 4.0% |
| Social Sciences | 1 | 4.0% |
| Engineering | 0 | 0.0% |
| Multidisciplinary Studies | 0 | 0.0% |
| Science & Technology | 1 | 4.0% |
| Business | 13 | 52.0% |
| Education | 8 | 32.0% |
| Literature & Languages | 0 | 0.0% |
| Liberal Arts & History | 0 | 0.0% |
| Visual & Performing Arts | 0 | 0.0% |
| Communications | 0 | 0.0% |
| Arts & Humanities | 1 | 4.0% |
| Total | 25 | 100.0% |
Transportation & Commute in Kutztown University
Vehicle Availability by Sex in Kutztown University
| Vehicles Available | Male | Female |
| No Vehicle | 0 (0.0%) | 0 (0.0%) |
| 1 Vehicle | 0 (0.0%) | 0 (0.0%) |
| 2 Vehicles | 0 (0.0%) | 0 (0.0%) |
| 3 Vehicles | 0 (0.0%) | 0 (0.0%) |
| 4 Vehicles | 0 (0.0%) | 0 (0.0%) |
| 5 or more Vehicles | 0 (0.0%) | 0 (0.0%) |
| Total | 0 (0.0%) | 0 (0.0%) |
Commute Time in Kutztown University
The most frequently occuring commute durations in Kutztown University are 5 to 9 minutes (529 commuters, 42.2%), 10 to 14 minutes (251 commuters, 20.0%), and 15 to 19 minutes (154 commuters, 12.3%).
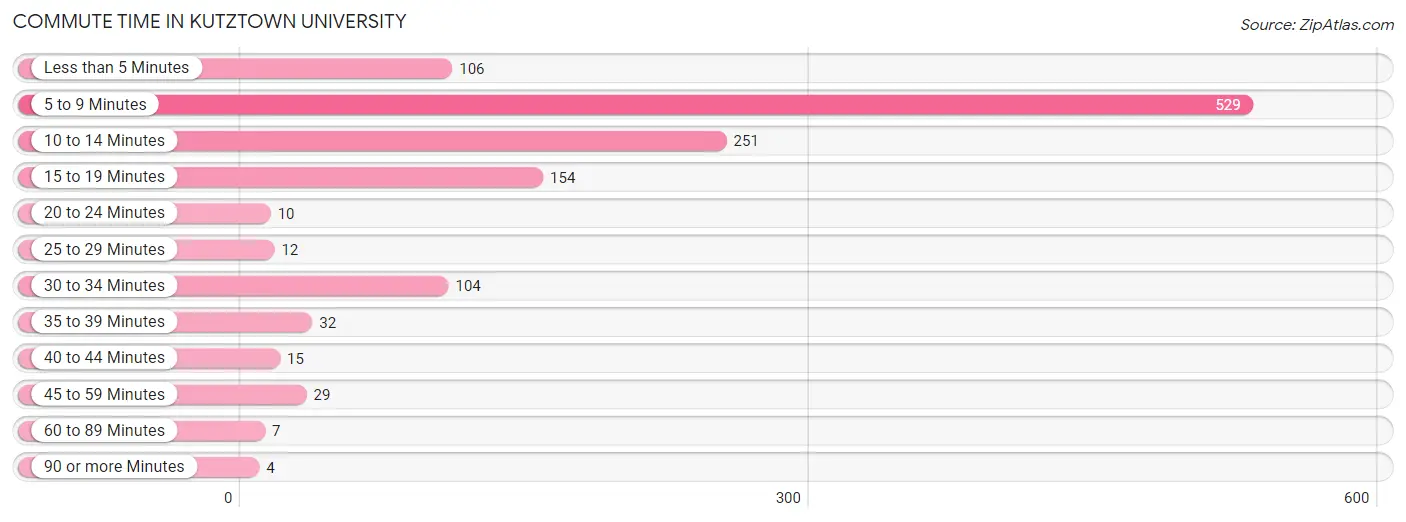
| Commute Time | # Commuters | % Commuters |
| Less than 5 Minutes | 106 | 8.5% |
| 5 to 9 Minutes | 529 | 42.2% |
| 10 to 14 Minutes | 251 | 20.0% |
| 15 to 19 Minutes | 154 | 12.3% |
| 20 to 24 Minutes | 10 | 0.8% |
| 25 to 29 Minutes | 12 | 1.0% |
| 30 to 34 Minutes | 104 | 8.3% |
| 35 to 39 Minutes | 32 | 2.5% |
| 40 to 44 Minutes | 15 | 1.2% |
| 45 to 59 Minutes | 29 | 2.3% |
| 60 to 89 Minutes | 7 | 0.6% |
| 90 or more Minutes | 4 | 0.3% |
Commute Time by Sex in Kutztown University
The most common commute times in Kutztown University are 5 to 9 minutes (216 commuters, 44.6%) for males and 5 to 9 minutes (313 commuters, 40.7%) for females.
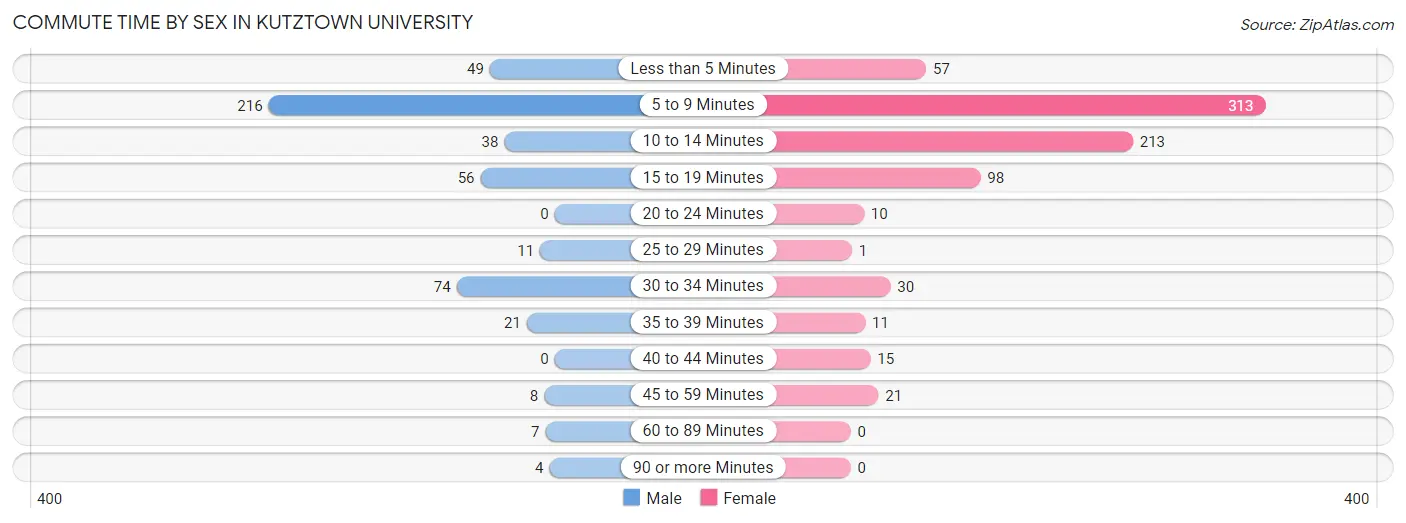
| Commute Time | Male | Female |
| Less than 5 Minutes | 49 (10.1%) | 57 (7.4%) |
| 5 to 9 Minutes | 216 (44.6%) | 313 (40.7%) |
| 10 to 14 Minutes | 38 (7.9%) | 213 (27.7%) |
| 15 to 19 Minutes | 56 (11.6%) | 98 (12.7%) |
| 20 to 24 Minutes | 0 (0.0%) | 10 (1.3%) |
| 25 to 29 Minutes | 11 (2.3%) | 1 (0.1%) |
| 30 to 34 Minutes | 74 (15.3%) | 30 (3.9%) |
| 35 to 39 Minutes | 21 (4.3%) | 11 (1.4%) |
| 40 to 44 Minutes | 0 (0.0%) | 15 (1.9%) |
| 45 to 59 Minutes | 8 (1.7%) | 21 (2.7%) |
| 60 to 89 Minutes | 7 (1.5%) | 0 (0.0%) |
| 90 or more Minutes | 4 (0.8%) | 0 (0.0%) |
Time of Departure to Work by Sex in Kutztown University
The most frequent times of departure to work in Kutztown University are 4:00 PM to 11:59 PM (134, 27.7%) for males and 12:00 PM to 3:59 PM (368, 47.8%) for females.
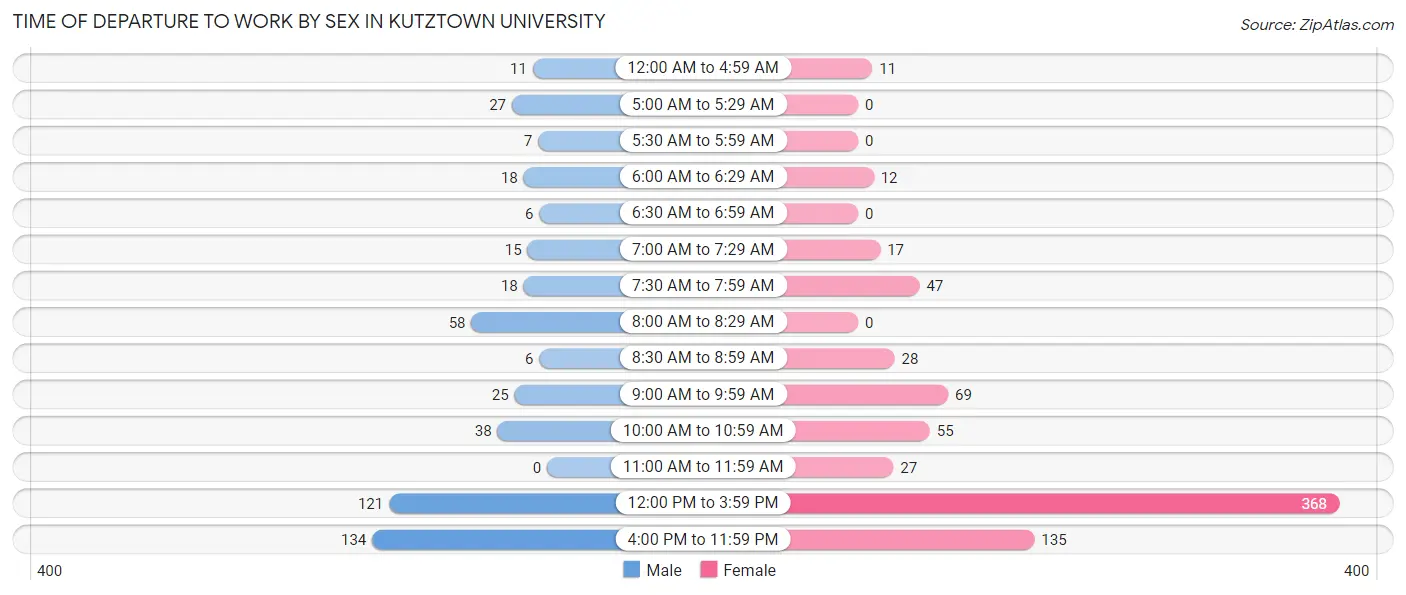
| Time of Departure | Male | Female |
| 12:00 AM to 4:59 AM | 11 (2.3%) | 11 (1.4%) |
| 5:00 AM to 5:29 AM | 27 (5.6%) | 0 (0.0%) |
| 5:30 AM to 5:59 AM | 7 (1.5%) | 0 (0.0%) |
| 6:00 AM to 6:29 AM | 18 (3.7%) | 12 (1.6%) |
| 6:30 AM to 6:59 AM | 6 (1.2%) | 0 (0.0%) |
| 7:00 AM to 7:29 AM | 15 (3.1%) | 17 (2.2%) |
| 7:30 AM to 7:59 AM | 18 (3.7%) | 47 (6.1%) |
| 8:00 AM to 8:29 AM | 58 (12.0%) | 0 (0.0%) |
| 8:30 AM to 8:59 AM | 6 (1.2%) | 28 (3.6%) |
| 9:00 AM to 9:59 AM | 25 (5.2%) | 69 (9.0%) |
| 10:00 AM to 10:59 AM | 38 (7.9%) | 55 (7.1%) |
| 11:00 AM to 11:59 AM | 0 (0.0%) | 27 (3.5%) |
| 12:00 PM to 3:59 PM | 121 (25.0%) | 368 (47.8%) |
| 4:00 PM to 11:59 PM | 134 (27.7%) | 135 (17.6%) |
| Total | 484 (100.0%) | 769 (100.0%) |
Housing Occupancy in Kutztown University
Occupancy by Ownership in Kutztown University
| Occupancy | # Housing Units | % Housing Units |
| Owner Occupied Housing Units | 0 | 0.0% |
| Renter-Occupied Housing Units | 0 | 0.0% |
| Total Occupied Housing Units | 0 | 0.0% |
Occupancy by Household Size in Kutztown University
| Household Size | # Housing Units | % Housing Units |
| 1-Person Household | 0 | 0.0% |
| 2-Person Household | 0 | 0.0% |
| 3-Person Household | 0 | 0.0% |
| 4+ Person Household | 0 | 0.0% |
| Total Housing Units | 0 | 0.0% |
Occupancy by Ownership by Household Size in Kutztown University
| Household Size | Owner-occupied | Renter-occupied |
| 1-Person Household | 0 (0.0%) | 0 (0.0%) |
| 2-Person Household | 0 (0.0%) | 0 (0.0%) |
| 3-Person Household | 0 (0.0%) | 0 (0.0%) |
| 4+ Person Household | 0 (0.0%) | 0 (0.0%) |
| Total Housing Units | 0 (0.0%) | 0 (0.0%) |
Occupancy by Educational Attainment in Kutztown University
| Household Size | Owner-occupied | Renter-occupied |
| Less than High School | 0 (0.0%) | 0 (0.0%) |
| High School Diploma | 0 (0.0%) | 0 (0.0%) |
| College/Associate Degree | 0 (0.0%) | 0 (0.0%) |
| Bachelor's Degree or higher | 0 (0.0%) | 0 (0.0%) |
Occupancy by Age of Householder in Kutztown University
| Age Bracket | # Households | % Households |
| Under 35 Years | 0 | 0.0% |
| 35 to 44 Years | 0 | 0.0% |
| 45 to 54 Years | 0 | 0.0% |
| 55 to 64 Years | 0 | 0.0% |
| 65 to 74 Years | 0 | 0.0% |
| 75 to 84 Years | 0 | 0.0% |
| 85 Years and Over | 0 | 0.0% |
| Total | 0 | 0.0% |
Housing Finances in Kutztown University
Median Income by Occupancy in Kutztown University
| Occupancy Type | # Households | Median Income |
| Owner-Occupied | 0 (0.0%) | $0 |
| Renter-Occupied | 0 (0.0%) | $0 |
| Average | 0 (0.0%) | $0 |
Occupancy by Householder Income Bracket in Kutztown University
| Income Bracket | Owner-occupied | Renter-occupied |
| Less than $5,000 | 0 (0.0%) | 0 (0.0%) |
| $5,000 to $9,999 | 0 (0.0%) | 0 (0.0%) |
| $10,000 to $14,999 | 0 (0.0%) | 0 (0.0%) |
| $15,000 to $19,999 | 0 (0.0%) | 0 (0.0%) |
| $20,000 to $24,999 | 0 (0.0%) | 0 (0.0%) |
| $25,000 to $34,999 | 0 (0.0%) | 0 (0.0%) |
| $35,000 to $49,999 | 0 (0.0%) | 0 (0.0%) |
| $50,000 to $74,999 | 0 (0.0%) | 0 (0.0%) |
| $75,000 to $99,999 | 0 (0.0%) | 0 (0.0%) |
| $100,000 to $149,999 | 0 (0.0%) | 0 (0.0%) |
| $150,000 or more | 0 (0.0%) | 0 (0.0%) |
| Total | 0 (0.0%) | 0 (0.0%) |
Monthly Housing Cost Tiers in Kutztown University
| Monthly Cost | Owner-occupied | Renter-occupied |
| Less than $300 | 0 (0.0%) | 0 (0.0%) |
| $300 to $499 | 0 (0.0%) | 0 (0.0%) |
| $500 to $799 | 0 (0.0%) | 0 (0.0%) |
| $800 to $999 | 0 (0.0%) | 0 (0.0%) |
| $1,000 to $1,499 | 0 (0.0%) | 0 (0.0%) |
| $1,500 to $1,999 | 0 (0.0%) | 0 (0.0%) |
| $2,000 to $2,499 | 0 (0.0%) | 0 (0.0%) |
| $2,500 to $2,999 | 0 (0.0%) | 0 (0.0%) |
| $3,000 or more | 0 (0.0%) | 0 (0.0%) |
| Total | 0 (0.0%) | 0 (0.0%) |
Physical Housing Characteristics in Kutztown University
Housing Structures in Kutztown University
| Structure Type | # Housing Units | % Housing Units |
| Single Unit, Detached | 0 | 0.0% |
| Single Unit, Attached | 0 | 0.0% |
| 2 Unit Apartments | 0 | 0.0% |
| 3 or 4 Unit Apartments | 0 | 0.0% |
| 5 to 9 Unit Apartments | 0 | 0.0% |
| 10 or more Apartments | 0 | 0.0% |
| Mobile Home / Other | 0 | 0.0% |
| Total | 0 | 0.0% |
Housing Structures by Occupancy in Kutztown University
| Structure Type | Owner-occupied | Renter-occupied |
| Single Unit, Detached | 0 (0.0%) | 0 (0.0%) |
| Single Unit, Attached | 0 (0.0%) | 0 (0.0%) |
| 2 Unit Apartments | 0 (0.0%) | 0 (0.0%) |
| 3 or 4 Unit Apartments | 0 (0.0%) | 0 (0.0%) |
| 5 to 9 Unit Apartments | 0 (0.0%) | 0 (0.0%) |
| 10 or more Apartments | 0 (0.0%) | 0 (0.0%) |
| Mobile Home / Other | 0 (0.0%) | 0 (0.0%) |
| Total | 0 (0.0%) | 0 (0.0%) |
Housing Structures by Number of Rooms in Kutztown University
| Number of Rooms | Owner-occupied | Renter-occupied |
| 1 Room | 0 (0.0%) | 0 (0.0%) |
| 2 or 3 Rooms | 0 (0.0%) | 0 (0.0%) |
| 4 or 5 Rooms | 0 (0.0%) | 0 (0.0%) |
| 6 or 7 Rooms | 0 (0.0%) | 0 (0.0%) |
| 8 or more Rooms | 0 (0.0%) | 0 (0.0%) |
| Total | 0 (0.0%) | 0 (0.0%) |
Housing Structure by Heating Type in Kutztown University
| Heating Type | Owner-occupied | Renter-occupied |
| Utility Gas | 0 (0.0%) | 0 (0.0%) |
| Bottled, Tank, or LP Gas | 0 (0.0%) | 0 (0.0%) |
| Electricity | 0 (0.0%) | 0 (0.0%) |
| Fuel Oil or Kerosene | 0 (0.0%) | 0 (0.0%) |
| Coal or Coke | 0 (0.0%) | 0 (0.0%) |
| All other Fuels | 0 (0.0%) | 0 (0.0%) |
| No Fuel Used | 0 (0.0%) | 0 (0.0%) |
| Total | 0 (0.0%) | 0 (0.0%) |
Household Vehicle Usage in Kutztown University
| Vehicles per Household | Owner-occupied | Renter-occupied |
| No Vehicle | 0 (0.0%) | 0 (0.0%) |
| 1 Vehicle | 0 (0.0%) | 0 (0.0%) |
| 2 Vehicles | 0 (0.0%) | 0 (0.0%) |
| 3 or more Vehicles | 0 (0.0%) | 0 (0.0%) |
| Total | 0 (0.0%) | 0 (0.0%) |
Real Estate & Mortgages in Kutztown University
Real Estate and Mortgage Overview in Kutztown University
| Characteristic | Without Mortgage | With Mortgage |
| Housing Units | 0 | 0 |
| Median Property Value | - | - |
| Median Household Income | - | - |
| Monthly Housing Costs | - | - |
| Real Estate Taxes | - | - |
Property Value by Mortgage Status in Kutztown University
| Property Value | Without Mortgage | With Mortgage |
| Less than $50,000 | 0 (0.0%) | 0 (0.0%) |
| $50,000 to $99,999 | 0 (0.0%) | 0 (0.0%) |
| $100,000 to $299,999 | 0 (0.0%) | 0 (0.0%) |
| $300,000 to $499,999 | 0 (0.0%) | 0 (0.0%) |
| $500,000 to $749,999 | 0 (0.0%) | 0 (0.0%) |
| $750,000 to $999,999 | 0 (0.0%) | 0 (0.0%) |
| $1,000,000 or more | 0 (0.0%) | 0 (0.0%) |
| Total | 0 (0.0%) | 0 (0.0%) |
Household Income by Mortgage Status in Kutztown University
| Household Income | Without Mortgage | With Mortgage |
| Less than $10,000 | 0 (0.0%) | 0 (0.0%) |
| $10,000 to $24,999 | 0 (0.0%) | 0 (0.0%) |
| $25,000 to $34,999 | 0 (0.0%) | 0 (0.0%) |
| $35,000 to $49,999 | 0 (0.0%) | 0 (0.0%) |
| $50,000 to $74,999 | 0 (0.0%) | 0 (0.0%) |
| $75,000 to $99,999 | 0 (0.0%) | 0 (0.0%) |
| $100,000 to $149,999 | 0 (0.0%) | 0 (0.0%) |
| $150,000 or more | 0 (0.0%) | 0 (0.0%) |
| Total | 0 (0.0%) | 0 (0.0%) |
Property Value to Household Income Ratio in Kutztown University
| Value-to-Income Ratio | Without Mortgage | With Mortgage |
| Less than 2.0x | 0 (0.0%) | 0 (0.0%) |
| 2.0x to 2.9x | 0 (0.0%) | 0 (0.0%) |
| 3.0x to 3.9x | 0 (0.0%) | 0 (0.0%) |
| 4.0x or more | 0 (0.0%) | 0 (0.0%) |
| Total | 0 (0.0%) | 0 (0.0%) |
Real Estate Taxes by Mortgage Status in Kutztown University
| Property Taxes | Without Mortgage | With Mortgage |
| Less than $800 | 0 (0.0%) | 0 (0.0%) |
| $800 to $1,499 | 0 (0.0%) | 0 (0.0%) |
| $800 to $1,499 | 0 (0.0%) | 0 (0.0%) |
| Total | 0 (0.0%) | 0 (0.0%) |
Health & Disability in Kutztown University
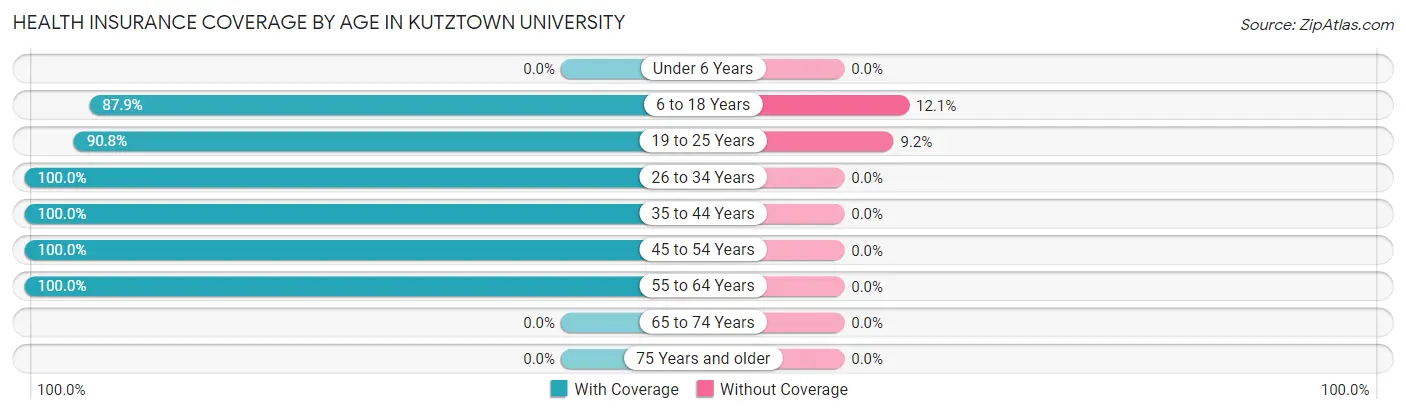
Health Insurance Coverage by Age in Kutztown University
| Age Bracket | With Coverage | Without Coverage |
| Under 6 Years | 0 (0.0%) | 0 (0.0%) |
| 6 to 18 Years | 756 (87.9%) | 104 (12.1%) |
| 19 to 25 Years | 2,890 (90.8%) | 292 (9.2%) |
| 26 to 34 Years | 10 (100.0%) | 0 (0.0%) |
| 35 to 44 Years | 3 (100.0%) | 0 (0.0%) |
| 45 to 54 Years | 7 (100.0%) | 0 (0.0%) |
| 55 to 64 Years | 3 (100.0%) | 0 (0.0%) |
| 65 to 74 Years | 0 (0.0%) | 0 (0.0%) |
| 75 Years and older | 0 (0.0%) | 0 (0.0%) |
| Total | 3,669 (90.3%) | 396 (9.7%) |
Health Insurance Coverage by Citizenship Status in Kutztown University
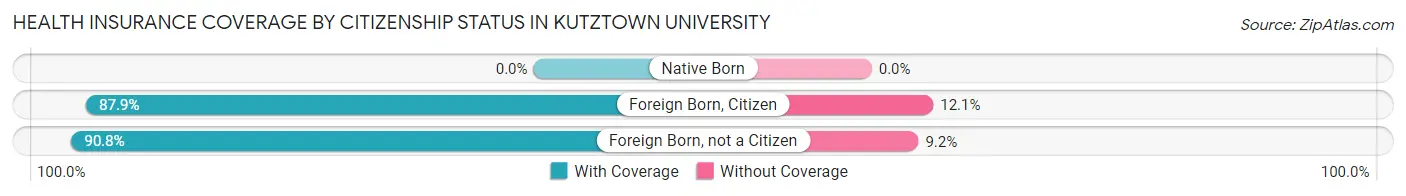
| Citizenship Status | With Coverage | Without Coverage |
| Native Born | 0 (0.0%) | 0 (0.0%) |
| Foreign Born, Citizen | 756 (87.9%) | 104 (12.1%) |
| Foreign Born, not a Citizen | 2,890 (90.8%) | 292 (9.2%) |
Health Insurance Coverage by Household Income in Kutztown University
| Household Income | With Coverage | Without Coverage |
| Under $25,000 | 0 (0.0%) | 0 (0.0%) |
| $25,000 to $49,999 | 0 (0.0%) | 0 (0.0%) |
| $50,000 to $74,999 | 0 (0.0%) | 0 (0.0%) |
| $75,000 to $99,999 | 0 (0.0%) | 0 (0.0%) |
| $100,000 and over | 0 (0.0%) | 0 (0.0%) |
Public vs Private Health Insurance Coverage by Age in Kutztown University
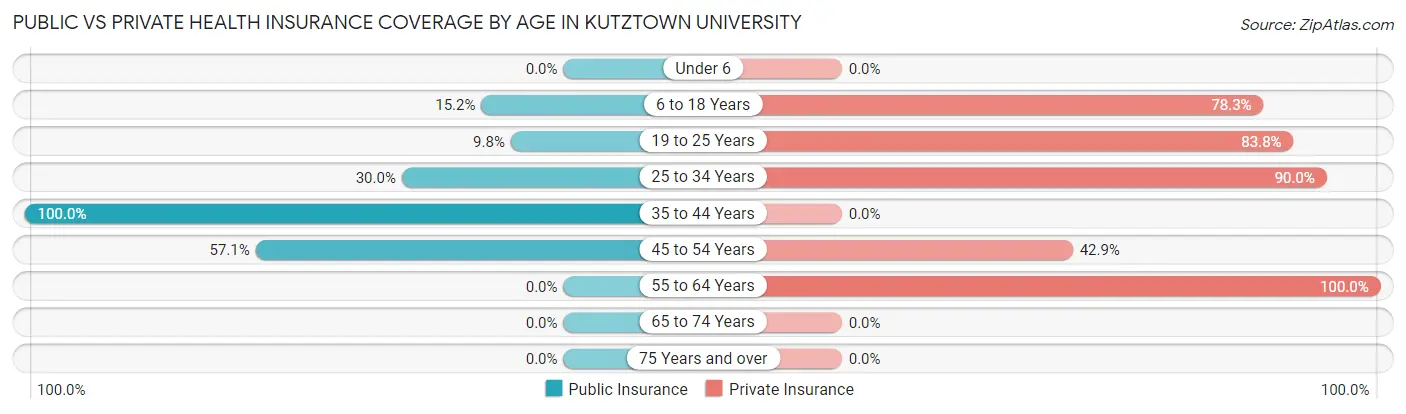
| Age Bracket | Public Insurance | Private Insurance |
| Under 6 | 0 (0.0%) | 0 (0.0%) |
| 6 to 18 Years | 131 (15.2%) | 673 (78.3%) |
| 19 to 25 Years | 311 (9.8%) | 2,667 (83.8%) |
| 25 to 34 Years | 3 (30.0%) | 9 (90.0%) |
| 35 to 44 Years | 3 (100.0%) | 0 (0.0%) |
| 45 to 54 Years | 4 (57.1%) | 3 (42.9%) |
| 55 to 64 Years | 0 (0.0%) | 3 (100.0%) |
| 65 to 74 Years | 0 (0.0%) | 0 (0.0%) |
| 75 Years and over | 0 (0.0%) | 0 (0.0%) |
| Total | 452 (11.1%) | 3,355 (82.5%) |
Disability Status by Sex by Age in Kutztown University
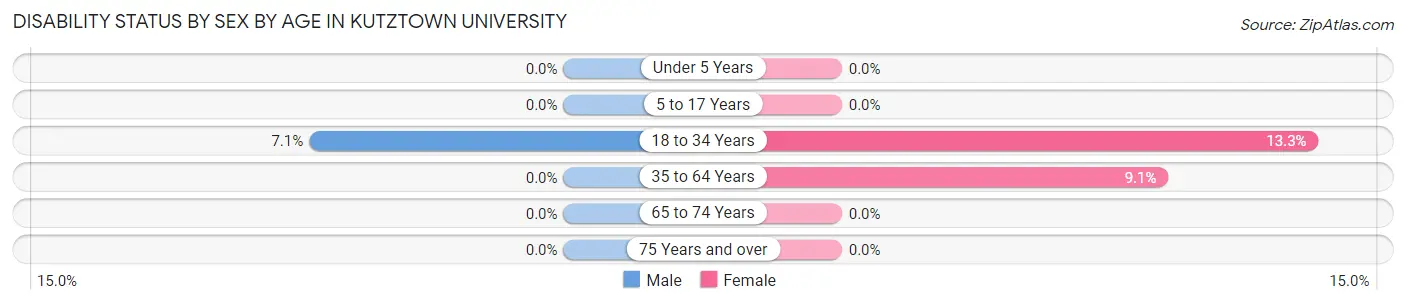
| Age Bracket | Male | Female |
| Under 5 Years | 0 (0.0%) | 0 (0.0%) |
| 5 to 17 Years | 0 (0.0%) | 0 (0.0%) |
| 18 to 34 Years | 127 (7.1%) | 290 (13.3%) |
| 35 to 64 Years | 0 (0.0%) | 1 (9.1%) |
| 65 to 74 Years | 0 (0.0%) | 0 (0.0%) |
| 75 Years and over | 0 (0.0%) | 0 (0.0%) |
Disability Class by Sex by Age in Kutztown University
Disability Class: Hearing Difficulty
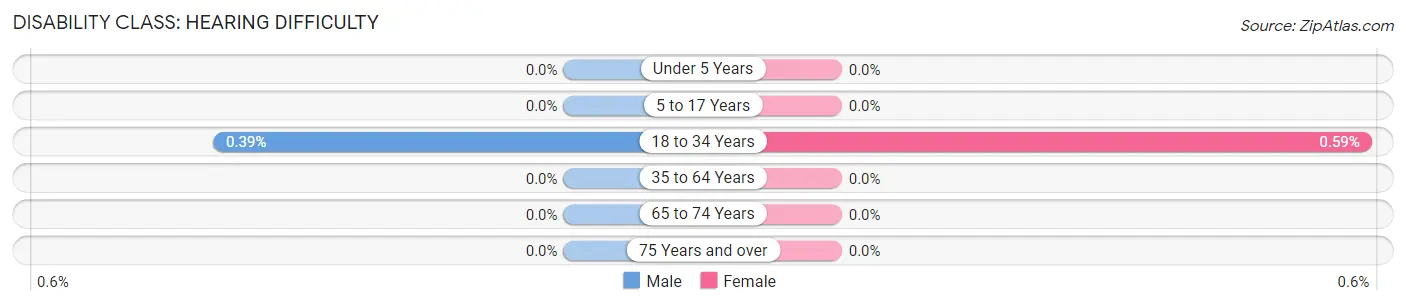
| Age Bracket | Male | Female |
| Under 5 Years | 0 (0.0%) | 0 (0.0%) |
| 5 to 17 Years | 0 (0.0%) | 0 (0.0%) |
| 18 to 34 Years | 7 (0.4%) | 13 (0.6%) |
| 35 to 64 Years | 0 (0.0%) | 0 (0.0%) |
| 65 to 74 Years | 0 (0.0%) | 0 (0.0%) |
| 75 Years and over | 0 (0.0%) | 0 (0.0%) |
Disability Class: Vision Difficulty
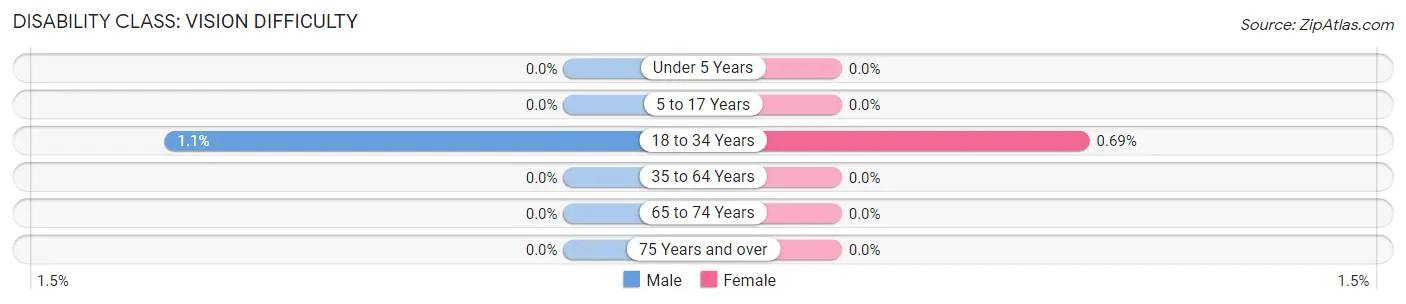
| Age Bracket | Male | Female |
| Under 5 Years | 0 (0.0%) | 0 (0.0%) |
| 5 to 17 Years | 0 (0.0%) | 0 (0.0%) |
| 18 to 34 Years | 20 (1.1%) | 15 (0.7%) |
| 35 to 64 Years | 0 (0.0%) | 0 (0.0%) |
| 65 to 74 Years | 0 (0.0%) | 0 (0.0%) |
| 75 Years and over | 0 (0.0%) | 0 (0.0%) |
Disability Class: Cognitive Difficulty
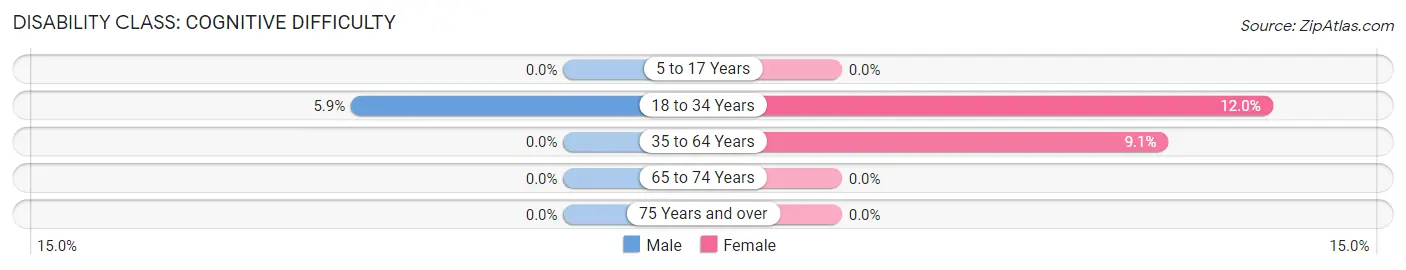
| Age Bracket | Male | Female |
| 5 to 17 Years | 0 (0.0%) | 0 (0.0%) |
| 18 to 34 Years | 106 (5.9%) | 262 (12.0%) |
| 35 to 64 Years | 0 (0.0%) | 1 (9.1%) |
| 65 to 74 Years | 0 (0.0%) | 0 (0.0%) |
| 75 Years and over | 0 (0.0%) | 0 (0.0%) |
Disability Class: Ambulatory Difficulty
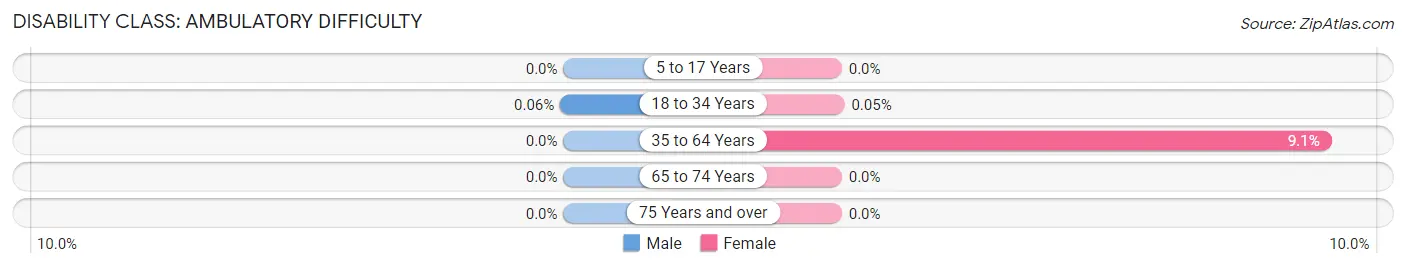
| Age Bracket | Male | Female |
| 5 to 17 Years | 0 (0.0%) | 0 (0.0%) |
| 18 to 34 Years | 1 (0.1%) | 1 (0.1%) |
| 35 to 64 Years | 0 (0.0%) | 1 (9.1%) |
| 65 to 74 Years | 0 (0.0%) | 0 (0.0%) |
| 75 Years and over | 0 (0.0%) | 0 (0.0%) |
Disability Class: Self-Care Difficulty
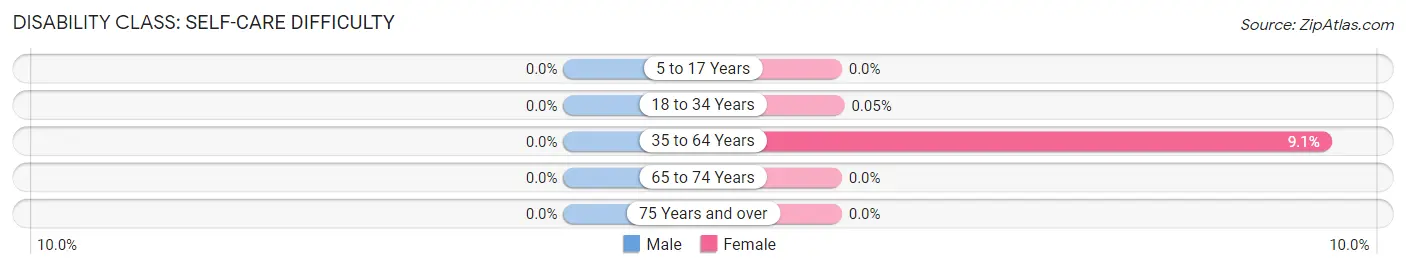
| Age Bracket | Male | Female |
| 5 to 17 Years | 0 (0.0%) | 0 (0.0%) |
| 18 to 34 Years | 0 (0.0%) | 1 (0.1%) |
| 35 to 64 Years | 0 (0.0%) | 1 (9.1%) |
| 65 to 74 Years | 0 (0.0%) | 0 (0.0%) |
| 75 Years and over | 0 (0.0%) | 0 (0.0%) |
Technology Access in Kutztown University
Computing Device Access in Kutztown University
| Device Type | # Households | % Households |
| Desktop or Laptop | 0 | 0.0% |
| Smartphone | 0 | 0.0% |
| Tablet | 0 | 0.0% |
| No Computing Device | 0 | 0.0% |
| Total | 0 | 0.0% |
Internet Access in Kutztown University
| Internet Type | # Households | % Households |
| Dial-Up Internet | 0 | 0.0% |
| Broadband Home | 0 | 0.0% |
| Cellular Data Only | 0 | 0.0% |
| Satellite Internet | 0 | 0.0% |
| No Internet | 0 | 0.0% |
| Total | 0 | 0.0% |
Kutztown University Summary
Kutztown University, located in Kutztown, Pennsylvania, is a public university that was founded in 1866. It is part of the Pennsylvania State System of Higher Education and is the oldest university in the system. The university offers a variety of undergraduate and graduate degree programs, as well as a number of certificate programs.
History
Kutztown University was founded in 1866 as Keystone Normal School, a teacher-training school. The school was established by the Pennsylvania General Assembly in response to the need for more teachers in the state. The school was initially located in Allentown, Pennsylvania, but was moved to Kutztown in 1872. In 1928, the school was renamed Kutztown State Teachers College and began offering four-year degrees. In 1960, the school was renamed Kutztown State College and began offering master's degrees. In 1983, the school was renamed Kutztown University of Pennsylvania and began offering doctoral degrees.
Geography
Kutztown University is located in Kutztown, Pennsylvania, which is in Berks County. The university is situated on a hill overlooking the town. The campus is approximately 200 acres in size and is surrounded by farmland. The university is located approximately 50 miles northwest of Philadelphia and 70 miles west of New York City.
Economy
Kutztown University is a major economic driver in the region. The university has an annual economic impact of over $400 million and supports over 4,000 jobs in the region. The university also provides a variety of services to the community, including a free health clinic, a free legal clinic, and a free tax preparation clinic.
Demographics
As of the fall of 2019, Kutztown University had a total enrollment of 8,845 students. Of these students, 6,845 were undergraduate students and 2,000 were graduate students. The student body is composed of students from all 50 states and over 40 countries. The student body is also diverse, with approximately 40% of students identifying as students of color. The university also has a large international student population, with over 1,000 international students enrolled.
Kutztown University is also home to a large faculty and staff population. As of the fall of 2019, the university had a total of 1,072 faculty and staff members. The faculty and staff are diverse, with approximately 30% of faculty and staff members identifying as people of color.
Conclusion
Kutztown University is a public university located in Kutztown, Pennsylvania. The university was founded in 1866 and is the oldest university in the Pennsylvania State System of Higher Education. The university offers a variety of undergraduate and graduate degree programs, as well as a number of certificate programs. The university has an annual economic impact of over $400 million and supports over 4,000 jobs in the region. The university also has a diverse student body, with approximately 40% of students identifying as students of color and over 1,000 international students enrolled. The faculty and staff are also diverse, with approximately 30% of faculty and staff members identifying as people of color.
Common Questions
What is Per Capita Income in Kutztown University?
Per Capita income in Kutztown University is $8,837.
What is Income or Wage Gap in Kutztown University?
Income or Wage Gap in Kutztown University is 2.6%.
Women in Kutztown University earn 97.4 cents for every dollar earned by a man.
What is the Total Population of Kutztown University?
Total Population of Kutztown University is 4,065.
What is the Total Male Population of Kutztown University?
Total Male Population of Kutztown University is 1,869.
What is the Total Female Population of Kutztown University?
Total Female Population of Kutztown University is 2,196.
What is the Ratio of Males per 100 Females in Kutztown University?
There are 85.11 Males per 100 Females in Kutztown University.
What is the Ratio of Females per 100 Males in Kutztown University?
There are 117.50 Females per 100 Males in Kutztown University.
What is the Median Population Age in Kutztown University?
Median Population Age in Kutztown University is 19.7 Years.
How Large is the Labor Force in Kutztown University?
There are 1,829 People in the Labor Forcein in Kutztown University.
What is the Percentage of People in the Labor Force in Kutztown University?
45.0% of People are in the Labor Force in Kutztown University.
What is the Unemployment Rate in Kutztown University?
Unemployment Rate in Kutztown University is 8.5%.