Cities with the Highest Percentage of Population Employed in Administrative & Support Services in Pennsylvania
RELATED REPORTS & OPTIONS
Administrative & Support Services
Pennsylvania
Compare Cities
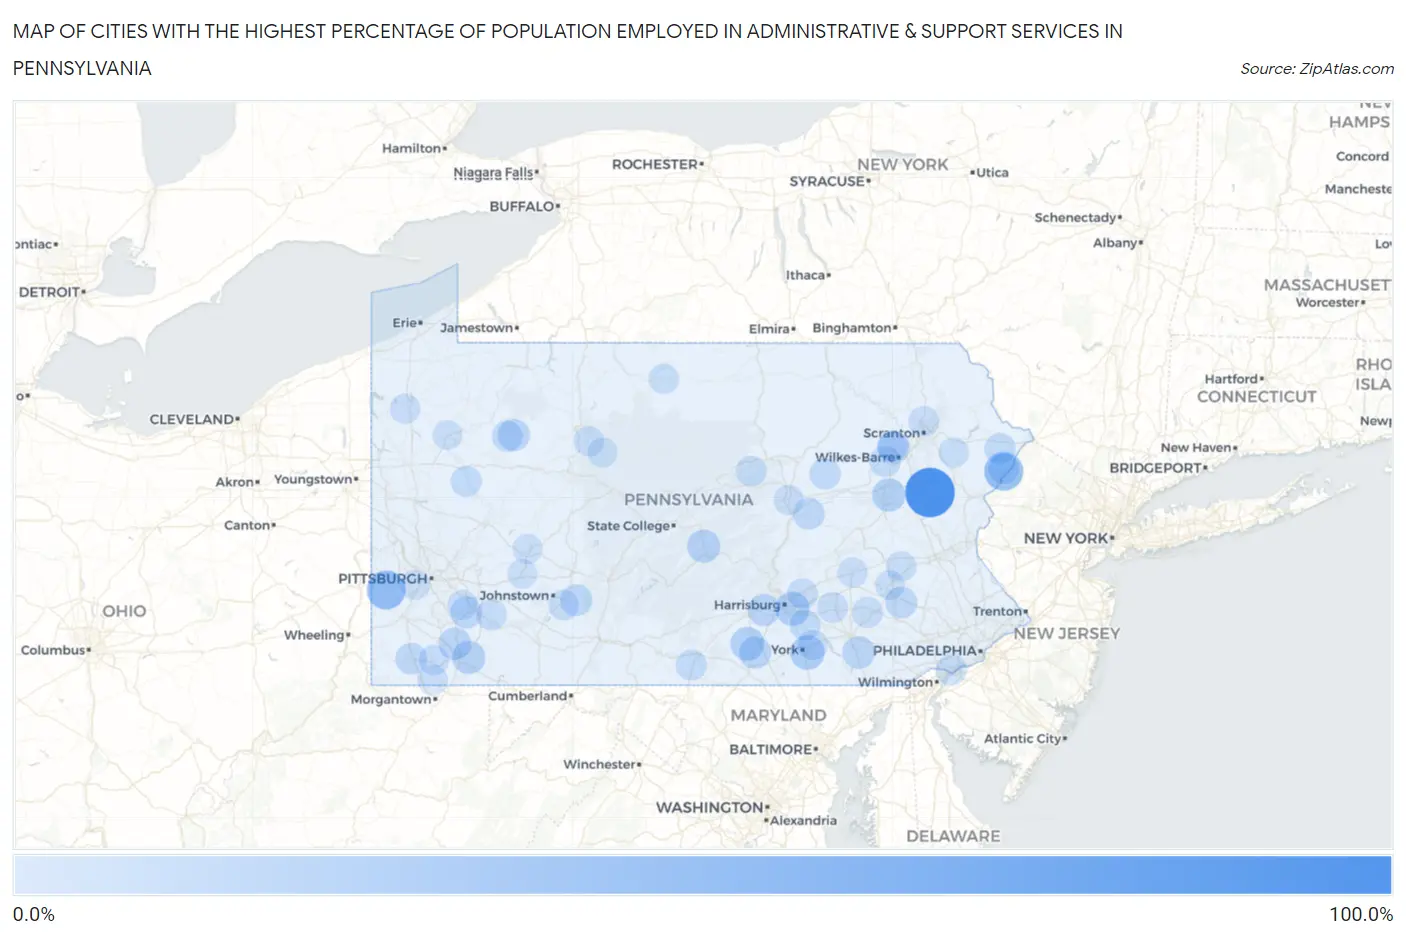
Map of Cities with the Highest Percentage of Population Employed in Administrative & Support Services in Pennsylvania
0.0%
100.0%
Cities with the Highest Percentage of Population Employed in Administrative & Support Services in Pennsylvania
| City | % Employed | vs State | vs National | |
| 1. | Albrightsville | 100.0% | 3.6%(+96.4)#1 | 4.1%(+95.9)#2 |
| 2. | Hamorton | 66.7% | 3.6%(+63.1)#2 | 4.1%(+62.5)#27 |
| 3. | Reese | 50.0% | 3.6%(+46.4)#3 | 4.1%(+45.9)#59 |
| 4. | Frankstown | 48.9% | 3.6%(+45.4)#4 | 4.1%(+44.8)#65 |
| 5. | Pocono Mountain Lake Estates | 48.5% | 3.6%(+44.9)#5 | 4.1%(+44.3)#66 |
| 6. | Slovan | 48.1% | 3.6%(+44.6)#6 | 4.1%(+44.0)#68 |
| 7. | New Washington Borough | 33.3% | 3.6%(+29.7)#7 | 4.1%(+29.2)#144 |
| 8. | Trainer Borough | 30.3% | 3.6%(+26.7)#8 | 4.1%(+26.1)#182 |
| 9. | Queens Gate | 29.3% | 3.6%(+25.7)#9 | 4.1%(+25.1)#198 |
| 10. | Oberlin | 27.2% | 3.6%(+23.6)#10 | 4.1%(+23.1)#236 |
| 11. | Gardners | 25.9% | 3.6%(+22.3)#11 | 4.1%(+21.8)#262 |
| 12. | Pardeesville | 24.0% | 3.6%(+20.4)#12 | 4.1%(+19.8)#310 |
| 13. | Lumber City | 23.4% | 3.6%(+19.8)#13 | 4.1%(+19.2)#330 |
| 14. | Lemont Furnace | 23.3% | 3.6%(+19.7)#14 | 4.1%(+19.1)#332 |
| 15. | Eagleville Cdp Centre County | 20.5% | 3.6%(+16.9)#15 | 4.1%(+16.4)#422 |
| 16. | Refton | 20.5% | 3.6%(+16.9)#16 | 4.1%(+16.3)#423 |
| 17. | Smock | 20.3% | 3.6%(+16.7)#17 | 4.1%(+16.1)#428 |
| 18. | Heidlersburg | 20.0% | 3.6%(+16.4)#18 | 4.1%(+15.9)#433 |
| 19. | Trucksville | 18.4% | 3.6%(+14.8)#19 | 4.1%(+14.3)#512 |
| 20. | Crown | 18.4% | 3.6%(+14.8)#20 | 4.1%(+14.3)#513 |
| 21. | Hop Bottom Borough | 18.2% | 3.6%(+14.7)#21 | 4.1%(+14.1)#523 |
| 22. | New Kingstown | 18.2% | 3.6%(+14.7)#22 | 4.1%(+14.1)#525 |
| 23. | Shippingport Borough | 17.9% | 3.6%(+14.3)#23 | 4.1%(+13.7)#549 |
| 24. | Wallaceton Borough | 17.8% | 3.6%(+14.2)#24 | 4.1%(+13.6)#553 |
| 25. | Yukon | 17.6% | 3.6%(+14.1)#25 | 4.1%(+13.5)#563 |
| 26. | Mckees Rocks Borough | 17.4% | 3.6%(+13.8)#26 | 4.1%(+13.3)#582 |
| 27. | Franklin Borough | 17.1% | 3.6%(+13.5)#27 | 4.1%(+13.0)#598 |
| 28. | West Mayfield Borough | 17.1% | 3.6%(+13.5)#28 | 4.1%(+12.9)#604 |
| 29. | Snydertown | 16.9% | 3.6%(+13.3)#29 | 4.1%(+12.8)#614 |
| 30. | Gibraltar | 16.8% | 3.6%(+13.2)#30 | 4.1%(+12.7)#622 |
| 31. | Mill Run | 16.7% | 3.6%(+13.1)#31 | 4.1%(+12.5)#636 |
| 32. | Dunlo | 16.5% | 3.6%(+12.9)#32 | 4.1%(+12.3)#649 |
| 33. | Morrisville | 16.3% | 3.6%(+12.7)#33 | 4.1%(+12.1)#661 |
| 34. | Sadsburyville | 15.7% | 3.6%(+12.1)#34 | 4.1%(+11.6)#707 |
| 35. | Conashaugh Lakes | 15.5% | 3.6%(+11.9)#35 | 4.1%(+11.4)#732 |
| 36. | Pocono Ranch Lands | 15.4% | 3.6%(+11.8)#36 | 4.1%(+11.3)#751 |
| 37. | Coalport Borough | 15.3% | 3.6%(+11.7)#37 | 4.1%(+11.2)#761 |
| 38. | Spring Drive Mobile Home Park | 14.8% | 3.6%(+11.2)#38 | 4.1%(+10.7)#824 |
| 39. | Iola | 14.7% | 3.6%(+11.1)#39 | 4.1%(+10.6)#836 |
| 40. | Tylersburg | 14.5% | 3.6%(+10.9)#40 | 4.1%(+10.4)#862 |
| 41. | Ashley Borough | 14.3% | 3.6%(+10.7)#41 | 4.1%(+10.1)#894 |
| 42. | West Nanticoke | 14.3% | 3.6%(+10.7)#42 | 4.1%(+10.1)#898 |
| 43. | Marion | 14.0% | 3.6%(+10.4)#43 | 4.1%(+9.81)#948 |
| 44. | Falmouth | 13.9% | 3.6%(+10.3)#44 | 4.1%(+9.74)#960 |
| 45. | Linwood | 13.8% | 3.6%(+10.2)#45 | 4.1%(+9.68)#969 |
| 46. | Parker | 13.8% | 3.6%(+10.2)#46 | 4.1%(+9.68)#970 |
| 47. | New Holland Borough | 13.6% | 3.6%(+9.99)#47 | 4.1%(+9.43)#1,023 |
| 48. | Stevens | 13.0% | 3.6%(+9.46)#48 | 4.1%(+8.89)#1,109 |
| 49. | Mammoth | 12.9% | 3.6%(+9.35)#49 | 4.1%(+8.79)#1,131 |
| 50. | Mount Gretna Heights | 12.8% | 3.6%(+9.20)#50 | 4.1%(+8.63)#1,159 |
| 51. | Midland Borough | 12.7% | 3.6%(+9.15)#51 | 4.1%(+8.58)#1,168 |
| 52. | Skyline View | 12.7% | 3.6%(+9.09)#52 | 4.1%(+8.53)#1,182 |
| 53. | Briar Creek Borough | 12.6% | 3.6%(+9.02)#53 | 4.1%(+8.45)#1,191 |
| 54. | Wesleyville Borough | 12.5% | 3.6%(+8.95)#54 | 4.1%(+8.38)#1,199 |
| 55. | Fort Fetter | 12.5% | 3.6%(+8.91)#55 | 4.1%(+8.35)#1,211 |
| 56. | University Of Pittsburgh Johnstown | 12.0% | 3.6%(+8.39)#56 | 4.1%(+7.82)#1,317 |
| 57. | Shavertown | 11.8% | 3.6%(+8.25)#57 | 4.1%(+7.69)#1,346 |
| 58. | Oval | 11.8% | 3.6%(+8.25)#58 | 4.1%(+7.68)#1,348 |
| 59. | Robeson Extension | 11.8% | 3.6%(+8.18)#59 | 4.1%(+7.61)#1,364 |
| 60. | Bobtown | 11.6% | 3.6%(+8.06)#60 | 4.1%(+7.50)#1,395 |
| 61. | Chinchilla | 11.6% | 3.6%(+7.99)#61 | 4.1%(+7.42)#1,409 |
| 62. | Newton Hamilton Borough | 11.4% | 3.6%(+7.84)#62 | 4.1%(+7.28)#1,439 |
| 63. | Jeddo Borough | 11.4% | 3.6%(+7.82)#63 | 4.1%(+7.25)#1,443 |
| 64. | Kersey | 11.3% | 3.6%(+7.74)#64 | 4.1%(+7.17)#1,462 |
| 65. | Yorklyn | 11.2% | 3.6%(+7.61)#65 | 4.1%(+7.05)#1,492 |
| 66. | Chalfont Borough | 11.1% | 3.6%(+7.50)#66 | 4.1%(+6.93)#1,531 |
| 67. | Carlisle Barracks | 11.0% | 3.6%(+7.44)#67 | 4.1%(+6.88)#1,544 |
| 68. | Wilmerding Borough | 11.0% | 3.6%(+7.42)#68 | 4.1%(+6.85)#1,553 |
| 69. | Montandon | 10.6% | 3.6%(+7.04)#69 | 4.1%(+6.47)#1,657 |
| 70. | Galeton Borough | 10.6% | 3.6%(+7.02)#70 | 4.1%(+6.46)#1,663 |
| 71. | Mcsherrystown Borough | 10.6% | 3.6%(+7.01)#71 | 4.1%(+6.45)#1,666 |
| 72. | Shade Gap Borough | 10.5% | 3.6%(+6.94)#72 | 4.1%(+6.38)#1,688 |
| 73. | Pocono Springs | 10.5% | 3.6%(+6.88)#73 | 4.1%(+6.32)#1,713 |
| 74. | Shanksville Borough | 10.5% | 3.6%(+6.88)#74 | 4.1%(+6.32)#1,714 |
| 75. | Oklahoma Borough | 10.4% | 3.6%(+6.85)#75 | 4.1%(+6.28)#1,726 |
| 76. | Sweden Valley | 10.4% | 3.6%(+6.83)#76 | 4.1%(+6.27)#1,733 |
| 77. | Bethel | 10.4% | 3.6%(+6.79)#77 | 4.1%(+6.22)#1,751 |
| 78. | Geneva | 10.3% | 3.6%(+6.76)#78 | 4.1%(+6.20)#1,765 |
| 79. | Emlenton Borough | 10.3% | 3.6%(+6.74)#79 | 4.1%(+6.17)#1,774 |
| 80. | Fairdale | 10.3% | 3.6%(+6.73)#80 | 4.1%(+6.17)#1,775 |
| 81. | Wilkinsburg Borough | 10.3% | 3.6%(+6.73)#81 | 4.1%(+6.16)#1,777 |
| 82. | Herminie | 10.3% | 3.6%(+6.70)#82 | 4.1%(+6.13)#1,786 |
| 83. | Virginville | 10.3% | 3.6%(+6.67)#83 | 4.1%(+6.11)#1,795 |
| 84. | Haysville Borough | 10.2% | 3.6%(+6.62)#84 | 4.1%(+6.05)#1,816 |
| 85. | Lansford Borough | 10.2% | 3.6%(+6.61)#85 | 4.1%(+6.04)#1,817 |
| 86. | Osceola Mills Borough | 10.2% | 3.6%(+6.60)#86 | 4.1%(+6.03)#1,820 |
| 87. | Burlington Borough | 10.1% | 3.6%(+6.56)#87 | 4.1%(+6.00)#1,839 |
| 88. | Weedville | 10.1% | 3.6%(+6.55)#88 | 4.1%(+5.98)#1,843 |
| 89. | Abbottstown Borough | 10.0% | 3.6%(+6.41)#89 | 4.1%(+5.85)#1,897 |
| 90. | Mckinley | 9.9% | 3.6%(+6.33)#90 | 4.1%(+5.77)#1,945 |
| 91. | Clintondale | 9.9% | 3.6%(+6.30)#91 | 4.1%(+5.74)#1,955 |
| 92. | Polk Borough | 9.9% | 3.6%(+6.28)#92 | 4.1%(+5.71)#1,966 |
| 93. | Fox Chase | 9.9% | 3.6%(+6.27)#93 | 4.1%(+5.70)#1,971 |
| 94. | Chevy Chase Heights | 9.8% | 3.6%(+6.19)#94 | 4.1%(+5.63)#1,999 |
| 95. | Rennerdale | 9.8% | 3.6%(+6.18)#95 | 4.1%(+5.61)#2,006 |
| 96. | Franklin | 9.7% | 3.6%(+6.16)#96 | 4.1%(+5.59)#2,019 |
| 97. | Mapleton Borough | 9.6% | 3.6%(+6.02)#97 | 4.1%(+5.45)#2,071 |
| 98. | Shelocta Borough | 9.5% | 3.6%(+5.94)#98 | 4.1%(+5.37)#2,117 |
| 99. | Chadds Ford | 9.4% | 3.6%(+5.86)#99 | 4.1%(+5.30)#2,146 |
| 100. | Black Lick | 9.4% | 3.6%(+5.83)#100 | 4.1%(+5.27)#2,157 |
Common Questions
What are the Top 10 Cities with the Highest Percentage of Population Employed in Administrative & Support Services in Pennsylvania?
Top 10 Cities with the Highest Percentage of Population Employed in Administrative & Support Services in Pennsylvania are:
#1
100.0%
#2
48.5%
#3
48.1%
#4
29.3%
#5
27.2%
#6
25.9%
#7
24.0%
#8
23.4%
#9
23.3%
#10
20.5%
What city has the Highest Percentage of Population Employed in Administrative & Support Services in Pennsylvania?
Albrightsville has the Highest Percentage of Population Employed in Administrative & Support Services in Pennsylvania with 100.0%.
What is the Percentage of Population Employed in Administrative & Support Services in the State of Pennsylvania?
Percentage of Population Employed in Administrative & Support Services in Pennsylvania is 3.6%.
What is the Percentage of Population Employed in Administrative & Support Services in the United States?
Percentage of Population Employed in Administrative & Support Services in the United States is 4.1%.