West Waynesburg, PA Map & Demographics
West Waynesburg Map
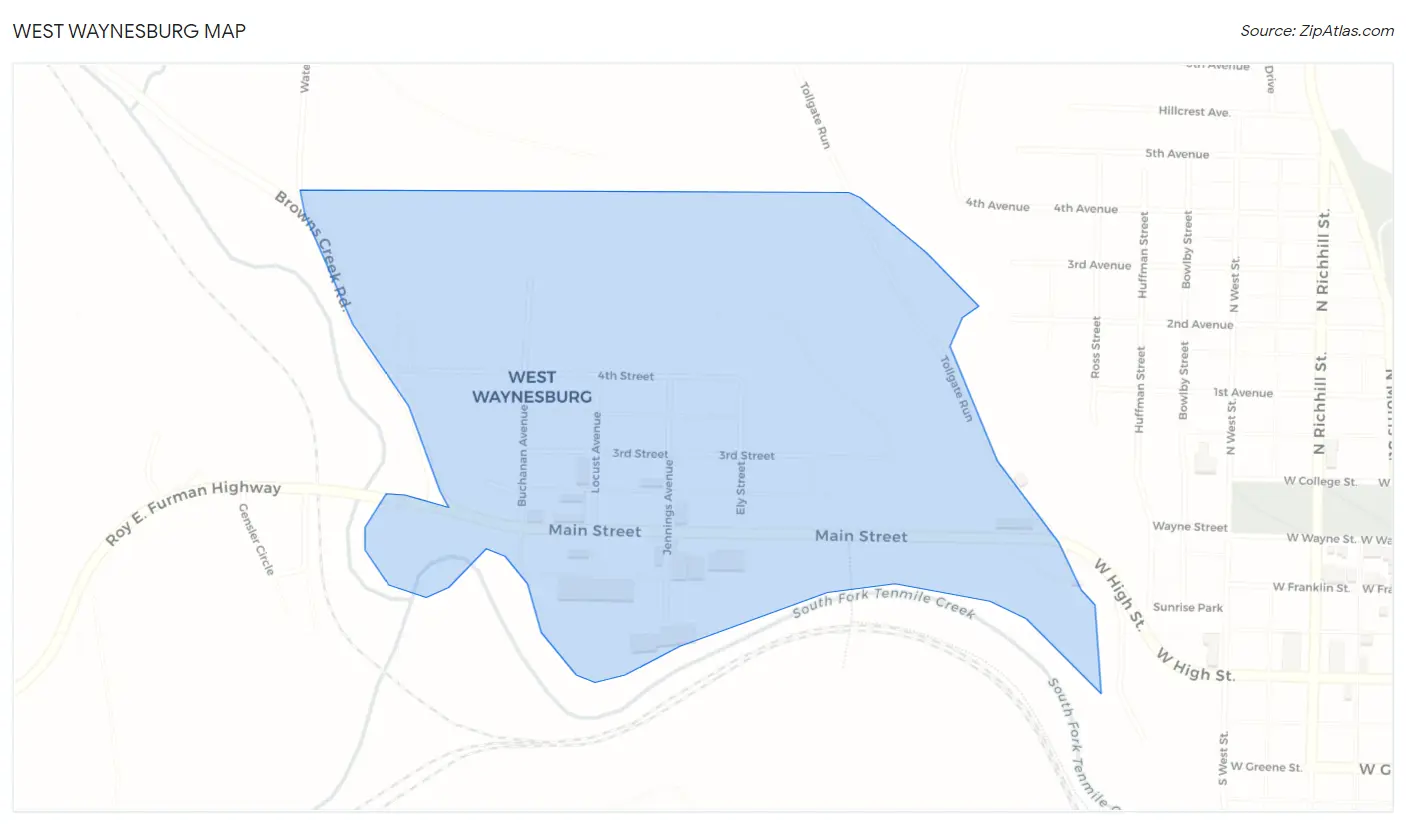
West Waynesburg Overview
$20,546
PER CAPITA INCOME
$38,268
AVG HOUSEHOLD INCOME
0.21
INEQUALITY / GINI INDEX
453
TOTAL POPULATION
323
MALE POPULATION
130
FEMALE POPULATION
248.46
MALES / 100 FEMALES
40.25
FEMALES / 100 MALES
30.0
MEDIAN AGE
2.6
AVG FAMILY SIZE
1.5
AVG HOUSEHOLD SIZE
293
LABOR FORCE [ PEOPLE ]
67.7%
PERCENT IN LABOR FORCE
Income in West Waynesburg
Income Overview in West Waynesburg
| Characteristic | Number | Measure |
| Per Capita Income | 453 | $20,546 |
| Median Family Income | 61 | $0 |
| Mean Family Income | 61 | $0 |
| Median Household Income | 306 | $38,268 |
| Mean Household Income | 306 | $38,338 |
| Income Deficit | 61 | $0 |
| Wage / Income Gap (%) | 453 | 0.00% |
| Wage / Income Gap ($) | 453 | 100.00¢ per $1 |
| Gini / Inequality Index | 453 | 0.21 |
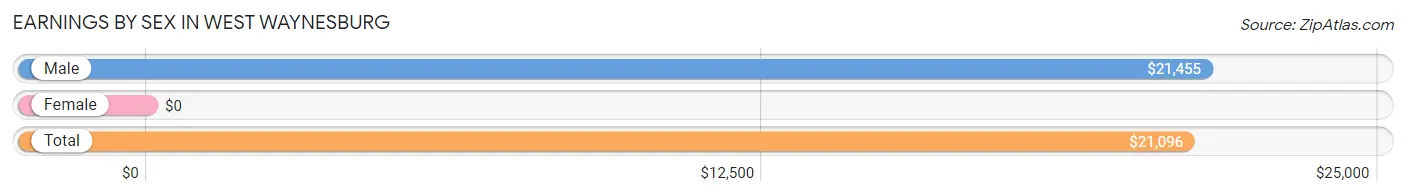
Earnings by Sex in West Waynesburg
| Sex | Number | Average Earnings |
| Male | 255 (80.2%) | $21,455 |
| Female | 63 (19.8%) | $0 |
| Total | 318 (100.0%) | $21,096 |
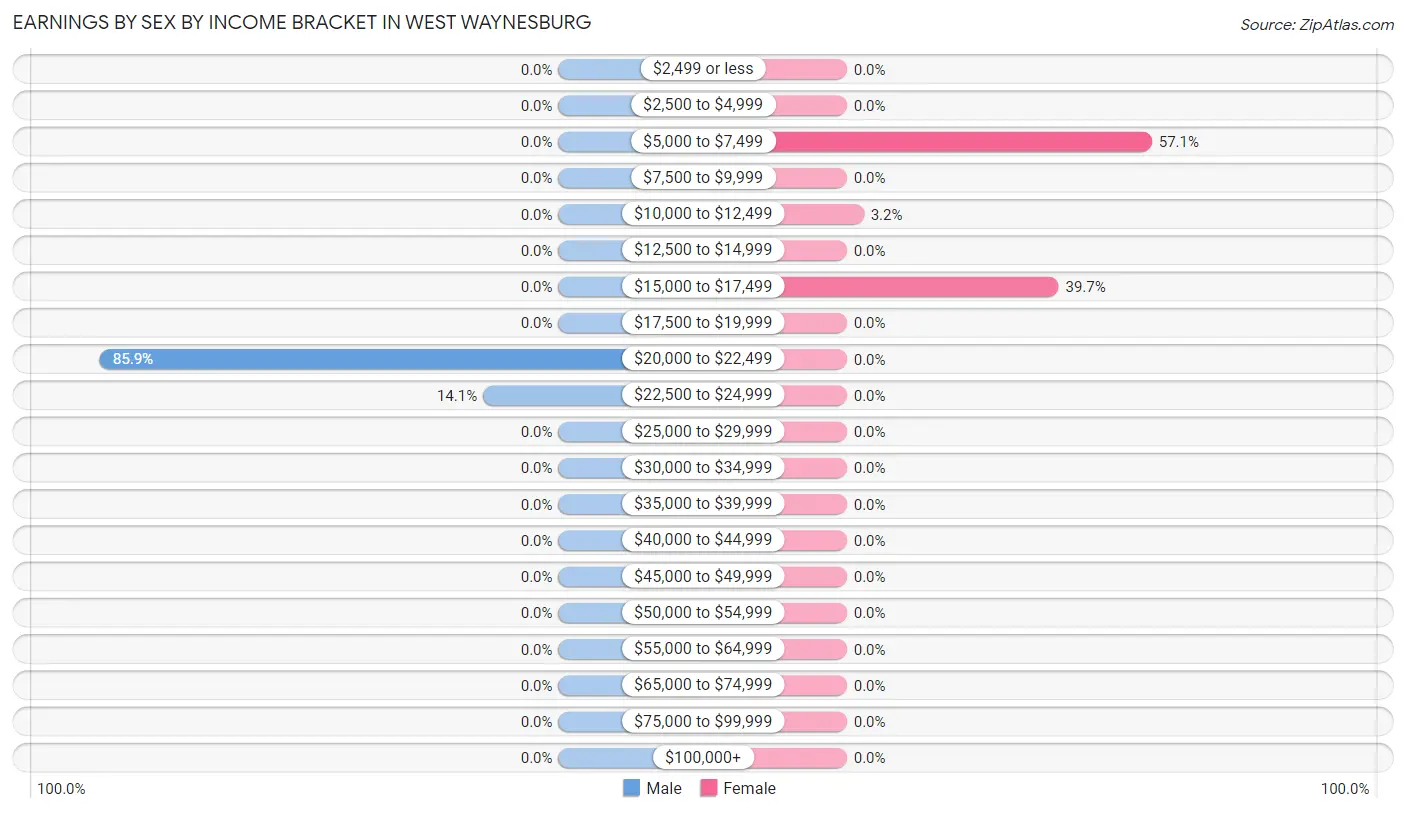
Earnings by Sex by Income Bracket in West Waynesburg
The most common earnings brackets in West Waynesburg are $20,000 to $22,499 for men (219 | 85.9%) and $5,000 to $7,499 for women (36 | 57.1%).
| Income | Male | Female |
| $2,499 or less | 0 (0.0%) | 0 (0.0%) |
| $2,500 to $4,999 | 0 (0.0%) | 0 (0.0%) |
| $5,000 to $7,499 | 0 (0.0%) | 36 (57.1%) |
| $7,500 to $9,999 | 0 (0.0%) | 0 (0.0%) |
| $10,000 to $12,499 | 0 (0.0%) | 2 (3.2%) |
| $12,500 to $14,999 | 0 (0.0%) | 0 (0.0%) |
| $15,000 to $17,499 | 0 (0.0%) | 25 (39.7%) |
| $17,500 to $19,999 | 0 (0.0%) | 0 (0.0%) |
| $20,000 to $22,499 | 219 (85.9%) | 0 (0.0%) |
| $22,500 to $24,999 | 36 (14.1%) | 0 (0.0%) |
| $25,000 to $29,999 | 0 (0.0%) | 0 (0.0%) |
| $30,000 to $34,999 | 0 (0.0%) | 0 (0.0%) |
| $35,000 to $39,999 | 0 (0.0%) | 0 (0.0%) |
| $40,000 to $44,999 | 0 (0.0%) | 0 (0.0%) |
| $45,000 to $49,999 | 0 (0.0%) | 0 (0.0%) |
| $50,000 to $54,999 | 0 (0.0%) | 0 (0.0%) |
| $55,000 to $64,999 | 0 (0.0%) | 0 (0.0%) |
| $65,000 to $74,999 | 0 (0.0%) | 0 (0.0%) |
| $75,000 to $99,999 | 0 (0.0%) | 0 (0.0%) |
| $100,000+ | 0 (0.0%) | 0 (0.0%) |
| Total | 255 (100.0%) | 63 (100.0%) |
Earnings by Sex by Educational Attainment in West Waynesburg
| Educational Attainment | Male Income | Female Income |
| Less than High School | - | - |
| High School Diploma | - | - |
| College or Associate's Degree | - | - |
| Bachelor's Degree | - | - |
| Graduate Degree | - | - |
| Total | - | - |
Family Income in West Waynesburg
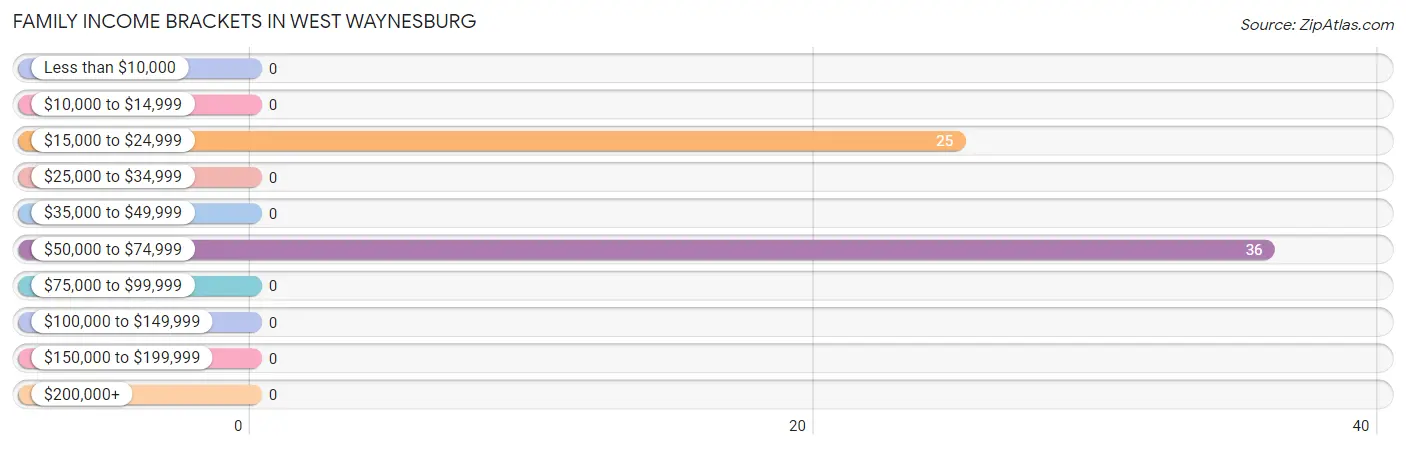
Family Income Brackets in West Waynesburg
According to the West Waynesburg family income data, there are 36 families falling into the $50,000 to $74,999 income range, which is the most common income bracket and makes up 59.0% of all families.
| Income Bracket | # Families | % Families |
| Less than $10,000 | 0 | 0.0% |
| $10,000 to $14,999 | 0 | 0.0% |
| $15,000 to $24,999 | 25 | 41.0% |
| $25,000 to $34,999 | 0 | 0.0% |
| $35,000 to $49,999 | 0 | 0.0% |
| $50,000 to $74,999 | 36 | 59.0% |
| $75,000 to $99,999 | 0 | 0.0% |
| $100,000 to $149,999 | 0 | 0.0% |
| $150,000 to $199,999 | 0 | 0.0% |
| $200,000+ | 0 | 0.0% |
Family Income by Famaliy Size in West Waynesburg
| Income Bracket | # Families | Median Income |
| 2-Person Families | 25 (41.0%) | $0 |
| 3-Person Families | 0 (0.0%) | $0 |
| 4-Person Families | 36 (59.0%) | $0 |
| 5-Person Families | 0 (0.0%) | $0 |
| 6-Person Families | 0 (0.0%) | $0 |
| 7+ Person Families | 0 (0.0%) | $0 |
| Total | 61 (100.0%) | $0 |
Family Income by Number of Earners in West Waynesburg
| Number of Earners | # Families | Median Income |
| No Earners | 0 (0.0%) | $0 |
| 1 Earner | 25 (41.0%) | $0 |
| 2 Earners | 0 (0.0%) | $0 |
| 3+ Earners | 36 (59.0%) | $0 |
| Total | 61 (100.0%) | $0 |
Household Income in West Waynesburg
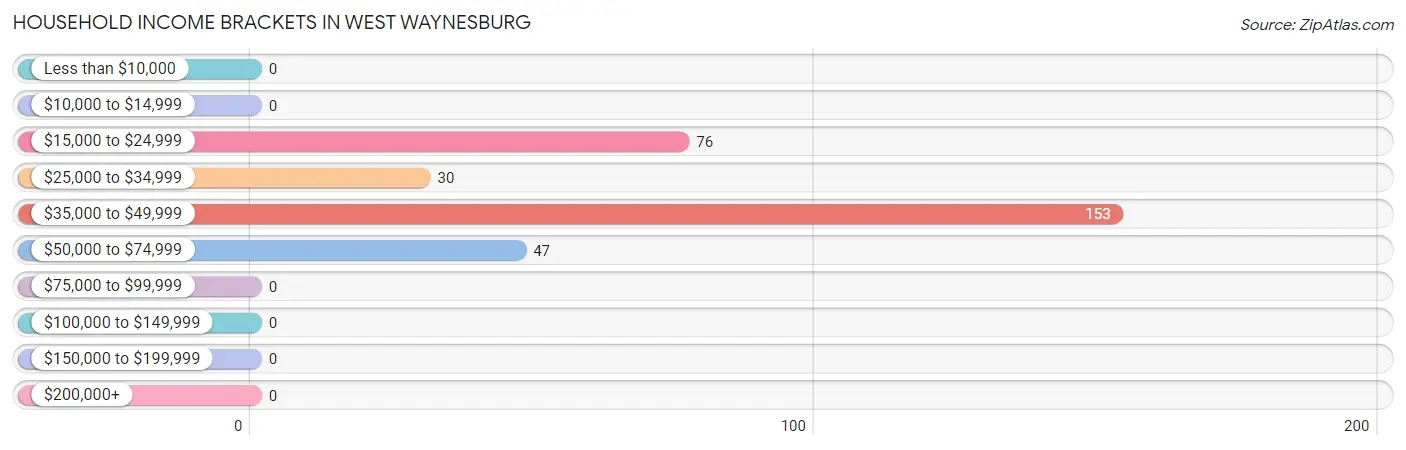
Household Income Brackets in West Waynesburg
With 153 households falling in the category, the $35,000 to $49,999 income range is the most frequent in West Waynesburg, accounting for 50.0% of all households.
| Income Bracket | # Households | % Households |
| Less than $10,000 | 0 | 0.0% |
| $10,000 to $14,999 | 0 | 0.0% |
| $15,000 to $24,999 | 76 | 24.8% |
| $25,000 to $34,999 | 30 | 9.8% |
| $35,000 to $49,999 | 153 | 50.0% |
| $50,000 to $74,999 | 47 | 15.4% |
| $75,000 to $99,999 | 0 | 0.0% |
| $100,000 to $149,999 | 0 | 0.0% |
| $150,000 to $199,999 | 0 | 0.0% |
| $200,000+ | 0 | 0.0% |
Household Income by Householder Age in West Waynesburg
The median household income in West Waynesburg is $38,268, with the highest median household income of $26,083 found in the 65+ years age bracket for the primary householder. A total of 56 households (18.3%) fall into this category. Meanwhile, the 15 to 24 years age bracket for the primary householder has the lowest median household income of $0, with 61 households (19.9%) in this group.
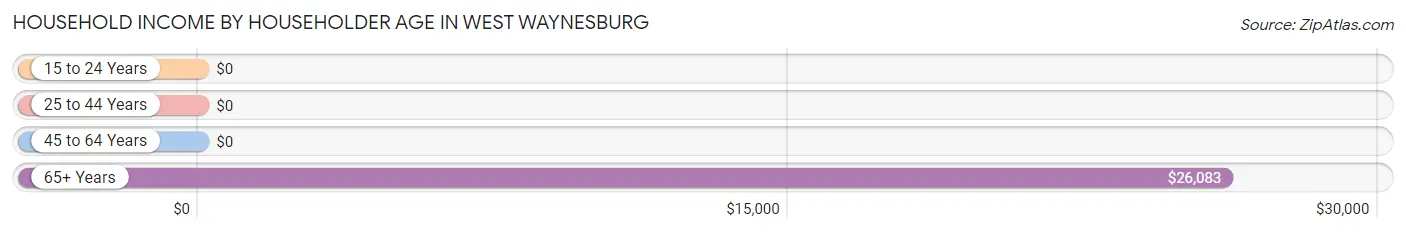
| Income Bracket | # Households | Median Income |
| 15 to 24 Years | 61 (19.9%) | $0 |
| 25 to 44 Years | 153 (50.0%) | $0 |
| 45 to 64 Years | 36 (11.8%) | $0 |
| 65+ Years | 56 (18.3%) | $26,083 |
| Total | 306 (100.0%) | $38,268 |
Poverty in West Waynesburg
Income Below Poverty by Sex and Age in West Waynesburg
With 16.6% poverty level for males and 54.0% for females among the residents of West Waynesburg, under 5 year old males and 18 to 24 year old females are the most vulnerable to poverty, with 12 males (100.0%) and 25 females (100.0%) in their respective age groups living below the poverty level.
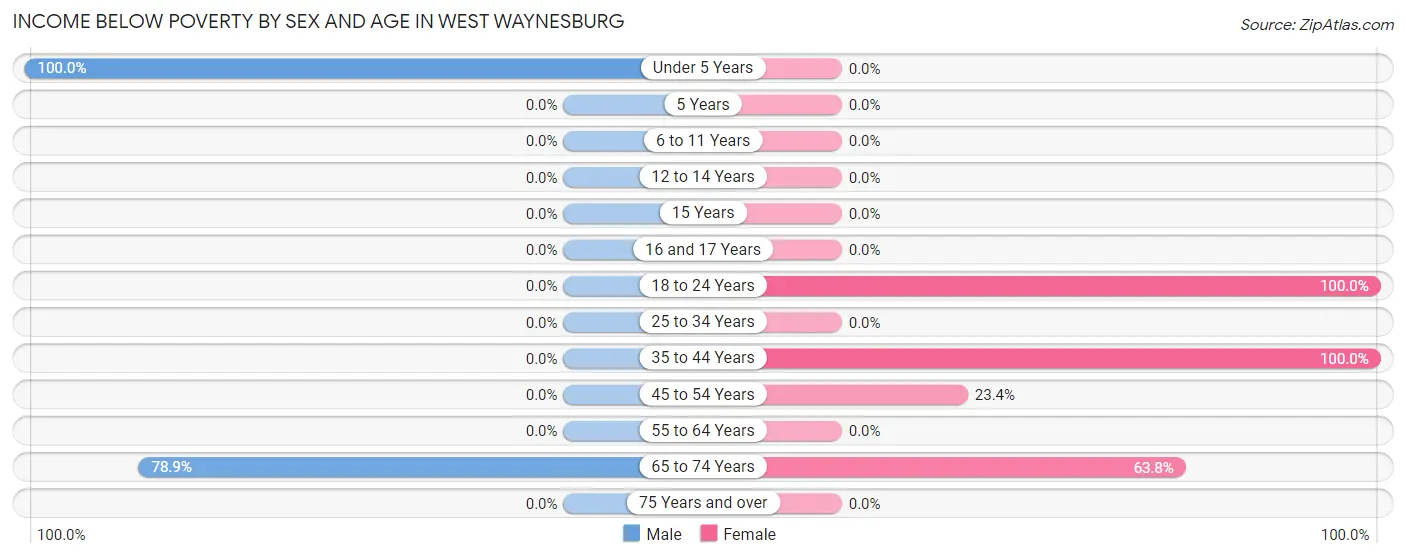
| Age Bracket | Male | Female |
| Under 5 Years | 12 (100.0%) | 0 (0.0%) |
| 5 Years | 0 (0.0%) | 0 (0.0%) |
| 6 to 11 Years | 0 (0.0%) | 0 (0.0%) |
| 12 to 14 Years | 0 (0.0%) | 0 (0.0%) |
| 15 Years | 0 (0.0%) | 0 (0.0%) |
| 16 and 17 Years | 0 (0.0%) | 0 (0.0%) |
| 18 to 24 Years | 0 (0.0%) | 25 (100.0%) |
| 25 to 34 Years | 0 (0.0%) | 0 (0.0%) |
| 35 to 44 Years | 0 (0.0%) | 2 (100.0%) |
| 45 to 54 Years | 0 (0.0%) | 11 (23.4%) |
| 55 to 64 Years | 0 (0.0%) | 0 (0.0%) |
| 65 to 74 Years | 41 (78.8%) | 30 (63.8%) |
| 75 Years and over | 0 (0.0%) | 0 (0.0%) |
| Total | 53 (16.6%) | 68 (54.0%) |
Income Above Poverty by Sex and Age in West Waynesburg
According to the poverty statistics in West Waynesburg, males aged 18 to 24 years and females aged 75 years and over are the age groups that are most secure financially, with 100.0% of males and 100.0% of females in these age groups living above the poverty line.
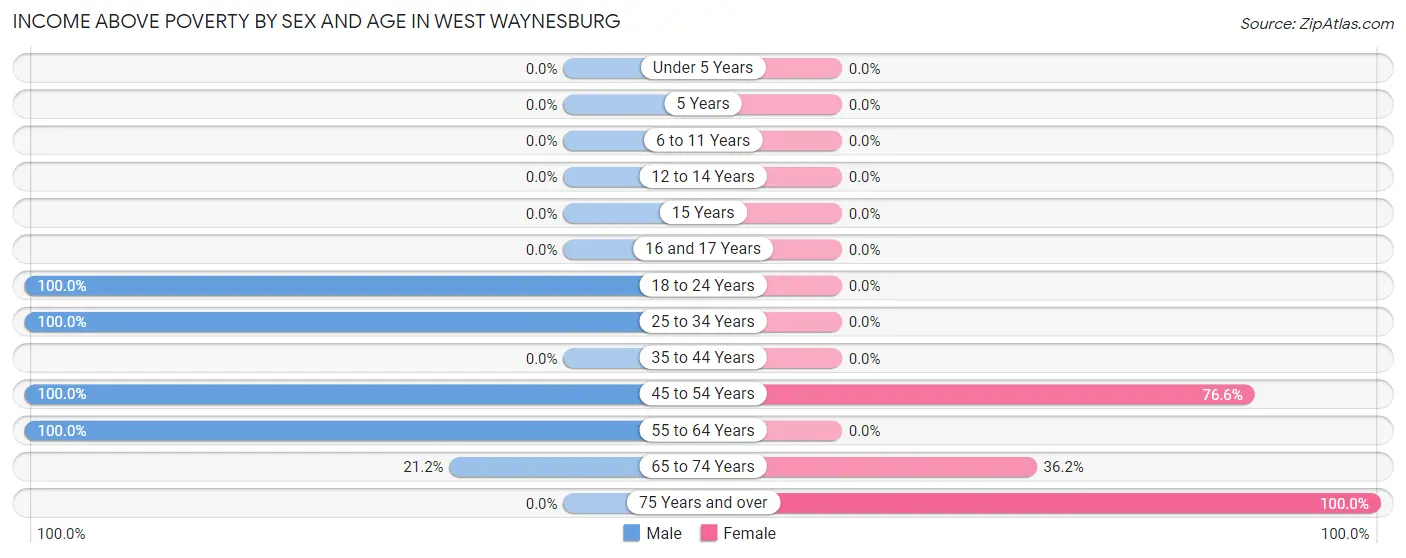
| Age Bracket | Male | Female |
| Under 5 Years | 0 (0.0%) | 0 (0.0%) |
| 5 Years | 0 (0.0%) | 0 (0.0%) |
| 6 to 11 Years | 0 (0.0%) | 0 (0.0%) |
| 12 to 14 Years | 0 (0.0%) | 0 (0.0%) |
| 15 Years | 0 (0.0%) | 0 (0.0%) |
| 16 and 17 Years | 0 (0.0%) | 0 (0.0%) |
| 18 to 24 Years | 36 (100.0%) | 0 (0.0%) |
| 25 to 34 Years | 153 (100.0%) | 0 (0.0%) |
| 35 to 44 Years | 0 (0.0%) | 0 (0.0%) |
| 45 to 54 Years | 28 (100.0%) | 36 (76.6%) |
| 55 to 64 Years | 38 (100.0%) | 0 (0.0%) |
| 65 to 74 Years | 11 (21.1%) | 17 (36.2%) |
| 75 Years and over | 0 (0.0%) | 5 (100.0%) |
| Total | 266 (83.4%) | 58 (46.0%) |
Income Below Poverty Among Married-Couple Families in West Waynesburg
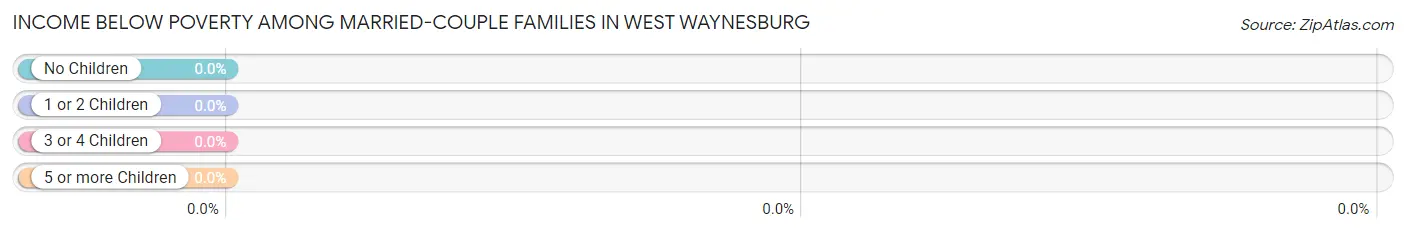
| Children | Above Poverty | Below Poverty |
| No Children | 36 (100.0%) | 0 (0.0%) |
| 1 or 2 Children | 0 (0.0%) | 0 (0.0%) |
| 3 or 4 Children | 0 (0.0%) | 0 (0.0%) |
| 5 or more Children | 0 (0.0%) | 0 (0.0%) |
| Total | 36 (100.0%) | 0 (0.0%) |
Income Below Poverty Among Single-Parent Households in West Waynesburg
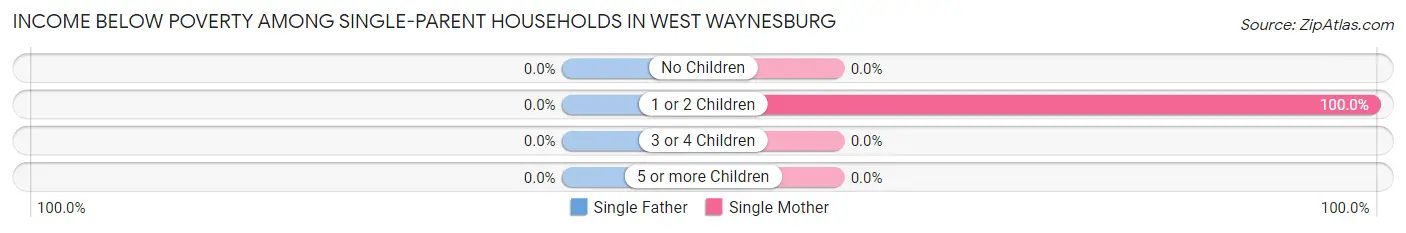
| Children | Single Father | Single Mother |
| No Children | 0 (0.0%) | 0 (0.0%) |
| 1 or 2 Children | 0 (0.0%) | 25 (100.0%) |
| 3 or 4 Children | 0 (0.0%) | 0 (0.0%) |
| 5 or more Children | 0 (0.0%) | 0 (0.0%) |
| Total | 0 (0.0%) | 25 (100.0%) |
Income Below Poverty Among Married-Couple vs Single-Parent Households in West Waynesburg
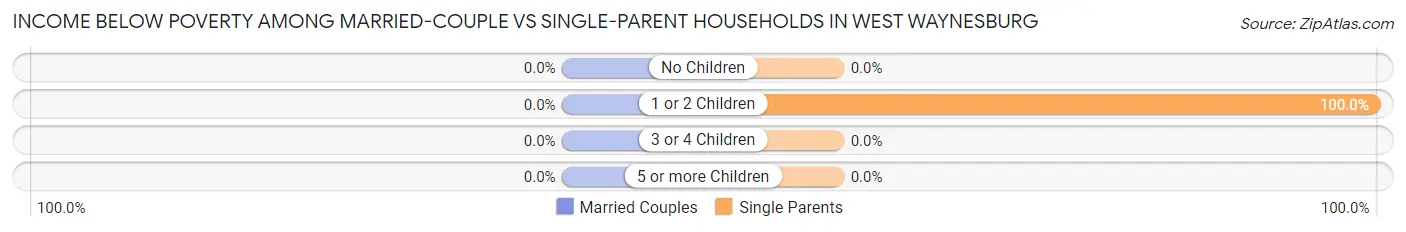
| Children | Married-Couple Families | Single-Parent Households |
| No Children | 0 (0.0%) | 0 (0.0%) |
| 1 or 2 Children | 0 (0.0%) | 25 (100.0%) |
| 3 or 4 Children | 0 (0.0%) | 0 (0.0%) |
| 5 or more Children | 0 (0.0%) | 0 (0.0%) |
| Total | 0 (0.0%) | 25 (100.0%) |
Race in West Waynesburg
The most populous races in West Waynesburg are White / Caucasian (290 | 64.0%), and Two or more Races (163 | 36.0%).
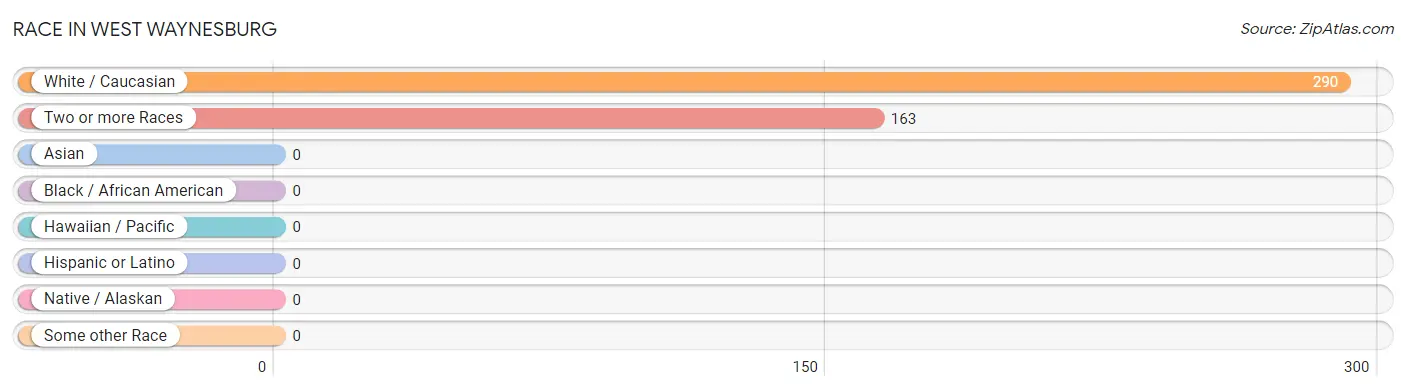
| Race | # Population | % Population |
| Asian | 0 | 0.0% |
| Black / African American | 0 | 0.0% |
| Hawaiian / Pacific | 0 | 0.0% |
| Hispanic or Latino | 0 | 0.0% |
| Native / Alaskan | 0 | 0.0% |
| White / Caucasian | 290 | 64.0% |
| Two or more Races | 163 | 36.0% |
| Some other Race | 0 | 0.0% |
| Total | 453 | 100.0% |
Ancestry in West Waynesburg
The most populous ancestries reported in West Waynesburg are Irish (163 | 36.0%), American (119 | 26.3%), English (42 | 9.3%), Dutch (30 | 6.6%), and German (30 | 6.6%), together accounting for 84.8% of all West Waynesburg residents.
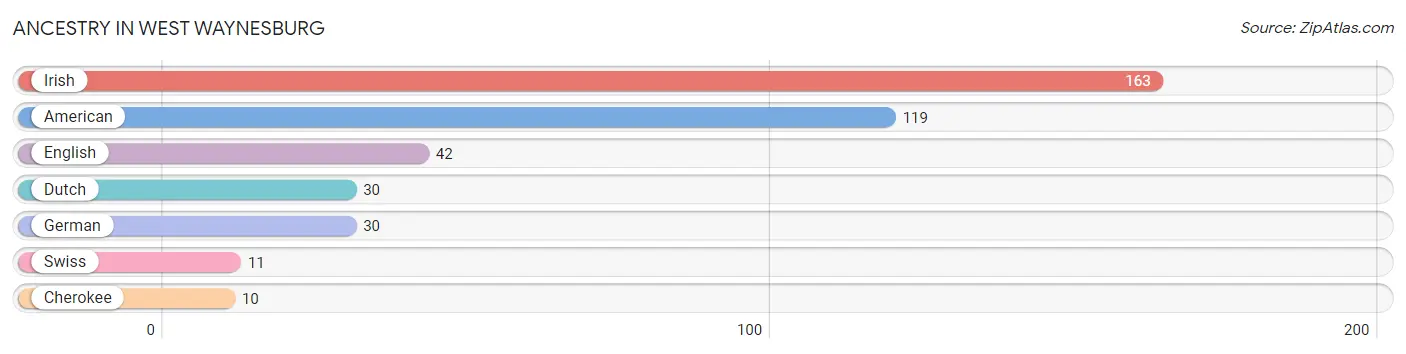
| Ancestry | # Population | % Population |
| American | 119 | 26.3% |
| Cherokee | 10 | 2.2% |
| Dutch | 30 | 6.6% |
| English | 42 | 9.3% |
| German | 30 | 6.6% |
| Irish | 163 | 36.0% |
| Swiss | 11 | 2.4% | View All 7 Rows |
Immigrants in West Waynesburg

| Immigration Origin | # Population | % Population | View All 0 Rows |
Sex and Age in West Waynesburg
Sex and Age in West Waynesburg
The most populous age groups in West Waynesburg are 25 to 29 Years (153 | 47.4%) for men and 70 to 74 Years (47 | 36.1%) for women.
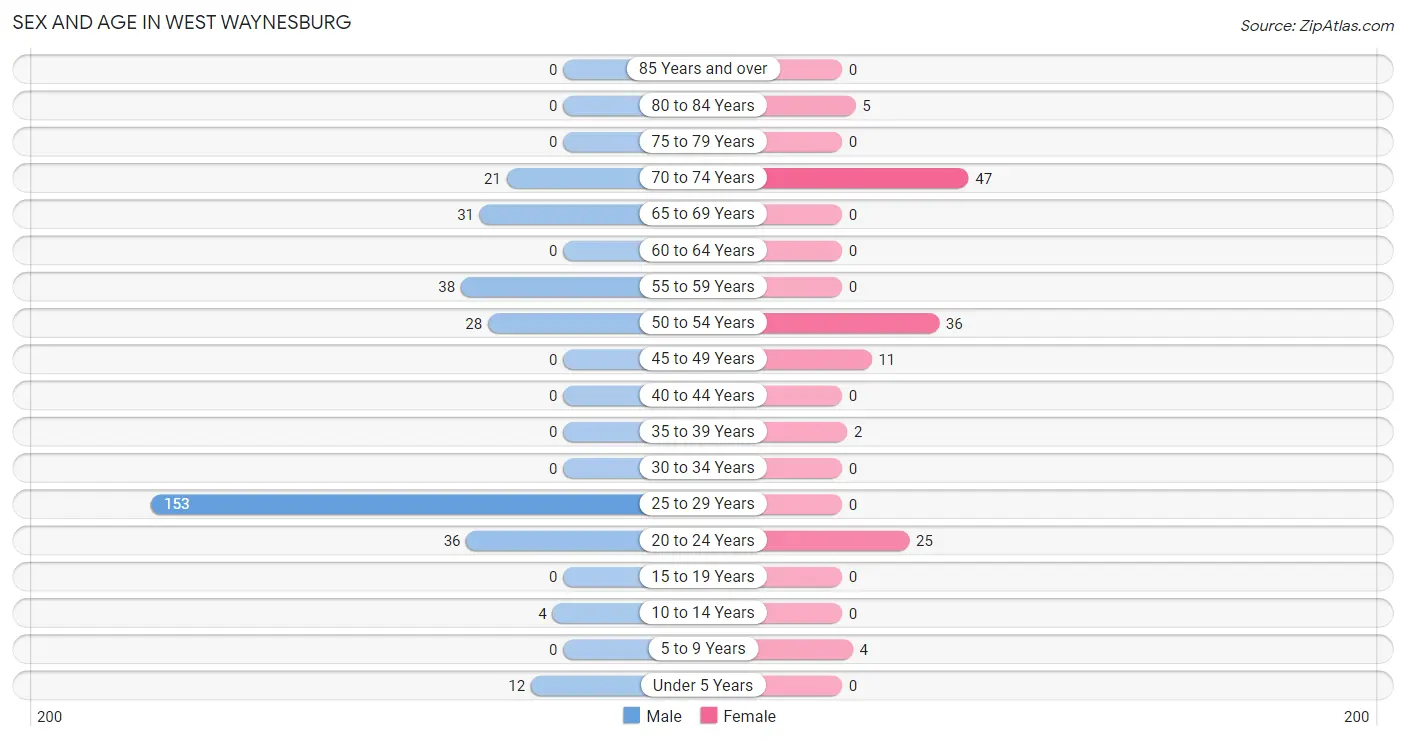
| Age Bracket | Male | Female |
| Under 5 Years | 12 (3.7%) | 0 (0.0%) |
| 5 to 9 Years | 0 (0.0%) | 4 (3.1%) |
| 10 to 14 Years | 4 (1.2%) | 0 (0.0%) |
| 15 to 19 Years | 0 (0.0%) | 0 (0.0%) |
| 20 to 24 Years | 36 (11.2%) | 25 (19.2%) |
| 25 to 29 Years | 153 (47.4%) | 0 (0.0%) |
| 30 to 34 Years | 0 (0.0%) | 0 (0.0%) |
| 35 to 39 Years | 0 (0.0%) | 2 (1.5%) |
| 40 to 44 Years | 0 (0.0%) | 0 (0.0%) |
| 45 to 49 Years | 0 (0.0%) | 11 (8.5%) |
| 50 to 54 Years | 28 (8.7%) | 36 (27.7%) |
| 55 to 59 Years | 38 (11.8%) | 0 (0.0%) |
| 60 to 64 Years | 0 (0.0%) | 0 (0.0%) |
| 65 to 69 Years | 31 (9.6%) | 0 (0.0%) |
| 70 to 74 Years | 21 (6.5%) | 47 (36.1%) |
| 75 to 79 Years | 0 (0.0%) | 0 (0.0%) |
| 80 to 84 Years | 0 (0.0%) | 5 (3.8%) |
| 85 Years and over | 0 (0.0%) | 0 (0.0%) |
| Total | 323 (100.0%) | 130 (100.0%) |
Families and Households in West Waynesburg
Median Family Size in West Waynesburg
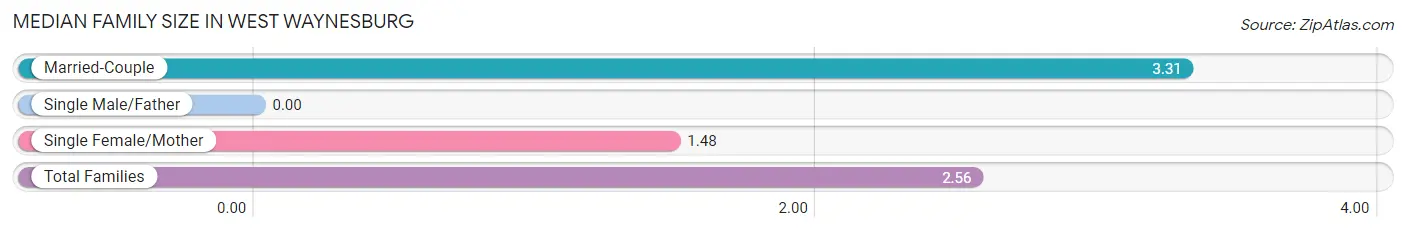
| Family Type | # Families | Family Size |
| Married-Couple | 36 (59.0%) | 3.31 |
| Single Male/Father | 0 (0.0%) | - |
| Single Female/Mother | 25 (41.0%) | 1.48 |
| Total Families | 61 (100.0%) | 2.56 |
Median Household Size in West Waynesburg
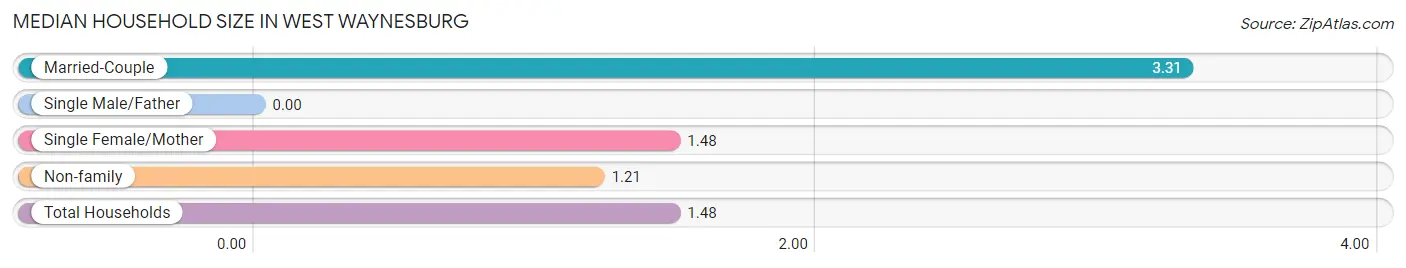
| Household Type | # Households | Household Size |
| Married-Couple | 36 (11.8%) | 3.31 |
| Single Male/Father | 0 (0.0%) | - |
| Single Female/Mother | 25 (8.2%) | 1.48 |
| Non-family | 245 (80.1%) | 1.21 |
| Total Households | 306 (100.0%) | 1.48 |
Household Size by Marriage Status in West Waynesburg
Out of a total of 306 households in West Waynesburg, 61 (19.9%) are family households, while 245 (80.1%) are nonfamily households. The most numerous type of family households are 4-person households, comprising 36, and the most common type of nonfamily households are 4-person households, comprising 153.
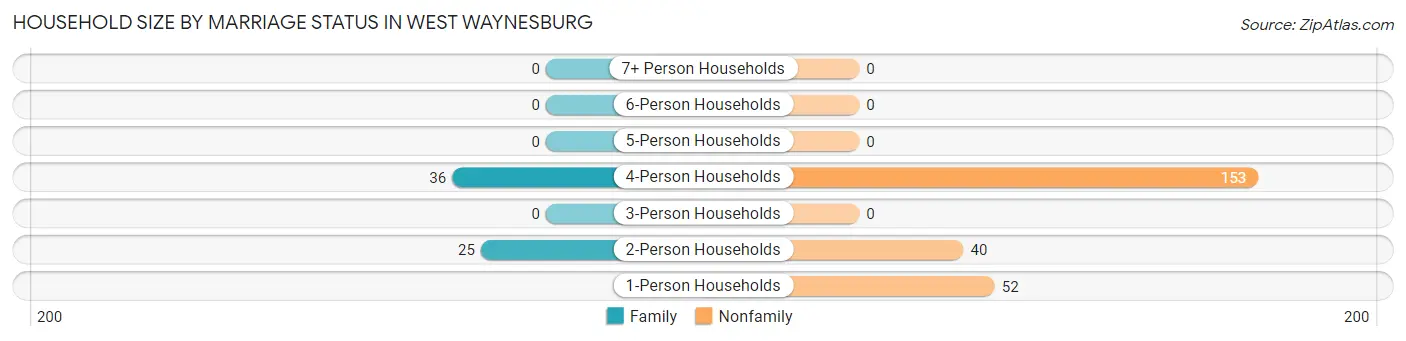
| Household Size | Family Households | Nonfamily Households |
| 1-Person Households | - | 52 (17.0%) |
| 2-Person Households | 25 (8.2%) | 40 (13.1%) |
| 3-Person Households | 0 (0.0%) | 0 (0.0%) |
| 4-Person Households | 36 (11.8%) | 153 (50.0%) |
| 5-Person Households | 0 (0.0%) | 0 (0.0%) |
| 6-Person Households | 0 (0.0%) | 0 (0.0%) |
| 7+ Person Households | 0 (0.0%) | 0 (0.0%) |
| Total | 61 (19.9%) | 245 (80.1%) |
Female Fertility in West Waynesburg
Fertility by Age in West Waynesburg
| Age Bracket | Women with Births | Births / 1,000 Women |
| 15 to 19 years | 0 (0.0%) | 0.0 |
| 20 to 34 years | 0 (0.0%) | 0.0 |
| 35 to 50 years | 0 (0.0%) | 0.0 |
| Total | 0 (0.0%) | 0.0 |
Fertility by Age by Marriage Status in West Waynesburg
| Age Bracket | Married | Unmarried |
| 15 to 19 years | 0 (0.0%) | 0 (0.0%) |
| 20 to 34 years | 0 (0.0%) | 0 (0.0%) |
| 35 to 50 years | 0 (0.0%) | 0 (0.0%) |
| Total | 0 (0.0%) | 0 (0.0%) |
Fertility by Education in West Waynesburg
| Educational Attainment | Women with Births | Births / 1,000 Women |
| Less than High School | 0 (0.0%) | 0.0 |
| High School Diploma | 0 (0.0%) | 0.0 |
| College or Associate's Degree | 0 (0.0%) | 0.0 |
| Bachelor's Degree | 0 (0.0%) | 0.0 |
| Graduate Degree | 0 (0.0%) | 0.0 |
| Total | 0 (0.0%) | 0.0 |
Fertility by Education by Marriage Status in West Waynesburg
| Educational Attainment | Married | Unmarried |
| Less than High School | 0 (0.0%) | 0 (0.0%) |
| High School Diploma | 0 (0.0%) | 0 (0.0%) |
| College or Associate's Degree | 0 (0.0%) | 0 (0.0%) |
| Bachelor's Degree | 0 (0.0%) | 0 (0.0%) |
| Graduate Degree | 0 (0.0%) | 0 (0.0%) |
| Total | 0 (0.0%) | 0 (0.0%) |
Employment Characteristics in West Waynesburg
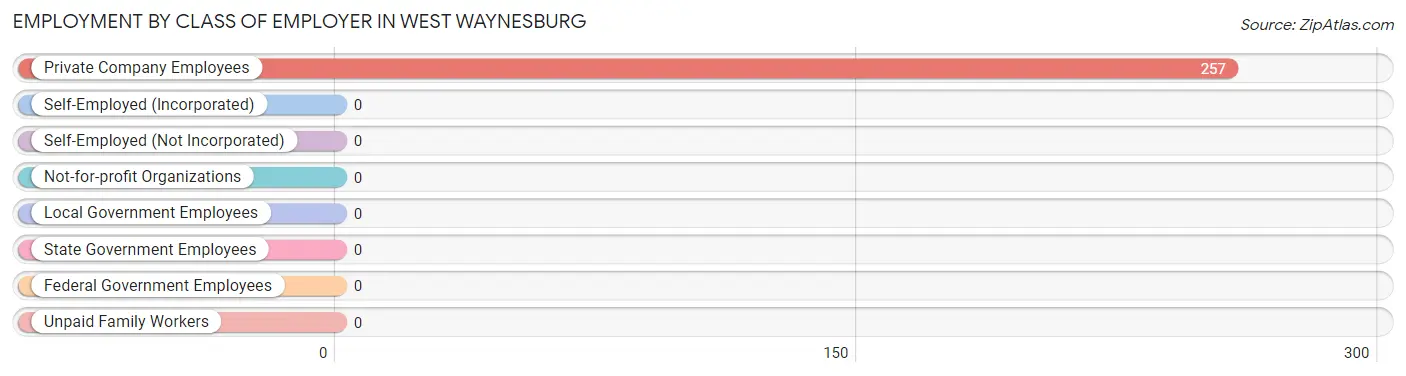
Employment by Class of Employer in West Waynesburg
Among the 257 employed individuals in West Waynesburg, , and private company employees (257 | 100.0%) make up the most common classes of employment.
| Employer Class | # Employees | % Employees |
| Private Company Employees | 257 | 100.0% |
| Self-Employed (Incorporated) | 0 | 0.0% |
| Self-Employed (Not Incorporated) | 0 | 0.0% |
| Not-for-profit Organizations | 0 | 0.0% |
| Local Government Employees | 0 | 0.0% |
| State Government Employees | 0 | 0.0% |
| Federal Government Employees | 0 | 0.0% |
| Unpaid Family Workers | 0 | 0.0% |
| Total | 257 | 100.0% |
Employment Status by Age in West Waynesburg
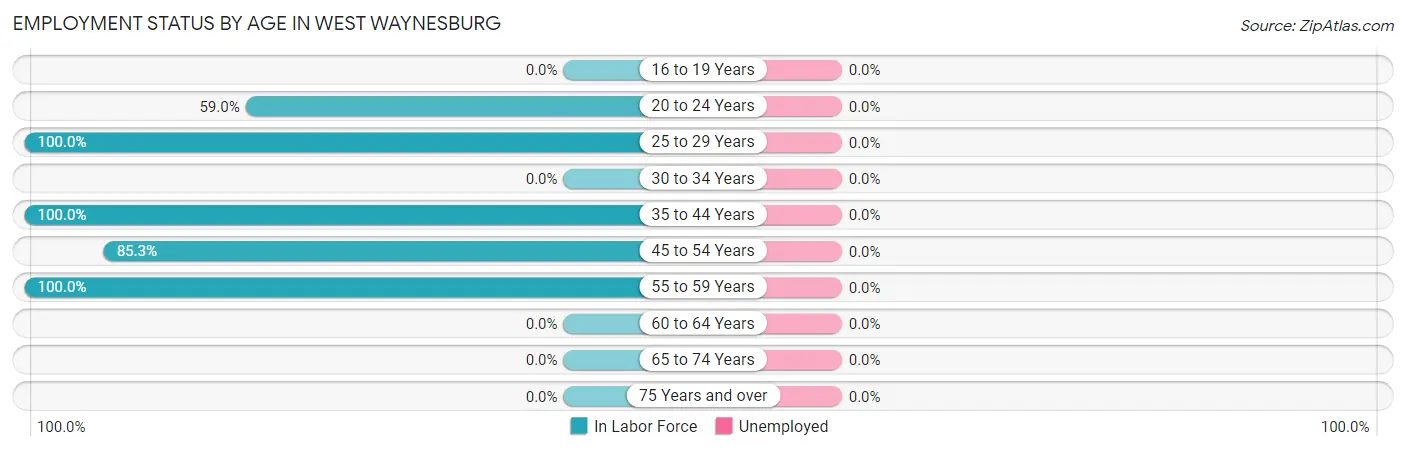
| Age Bracket | In Labor Force | Unemployed |
| 16 to 19 Years | 0 (0.0%) | 0 (0.0%) |
| 20 to 24 Years | 36 (59.0%) | 0 (0.0%) |
| 25 to 29 Years | 153 (100.0%) | 0 (0.0%) |
| 30 to 34 Years | 0 (0.0%) | 0 (0.0%) |
| 35 to 44 Years | 2 (100.0%) | 0 (0.0%) |
| 45 to 54 Years | 64 (85.3%) | 0 (0.0%) |
| 55 to 59 Years | 38 (100.0%) | 0 (0.0%) |
| 60 to 64 Years | 0 (0.0%) | 0 (0.0%) |
| 65 to 74 Years | 0 (0.0%) | 0 (0.0%) |
| 75 Years and over | 0 (0.0%) | 0 (0.0%) |
| Total | 293 (67.7%) | 0 (0.0%) |
Employment Status by Educational Attainment in West Waynesburg
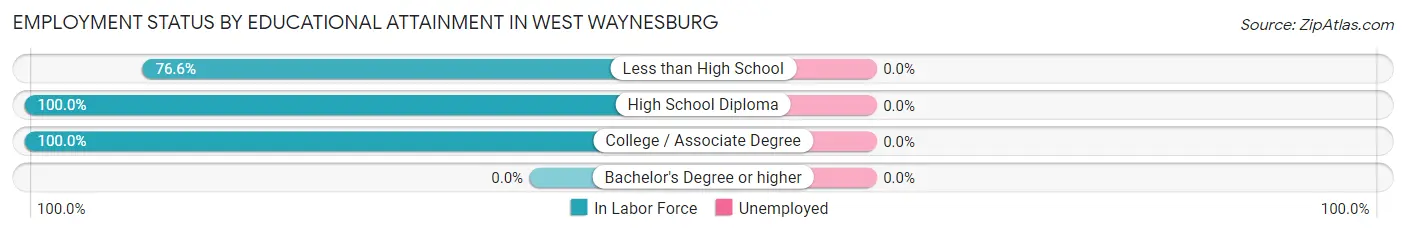
| Educational Attainment | In Labor Force | Unemployed |
| Less than High School | 36 (76.6%) | 0 (0.0%) |
| High School Diploma | 68 (100.0%) | 0 (0.0%) |
| College / Associate Degree | 153 (100.0%) | 0 (0.0%) |
| Bachelor's Degree or higher | 0 (0.0%) | 0 (0.0%) |
| Total | 257 (95.9%) | 0 (0.0%) |
Employment Occupations by Sex in West Waynesburg
Management, Business, Science and Arts Occupations
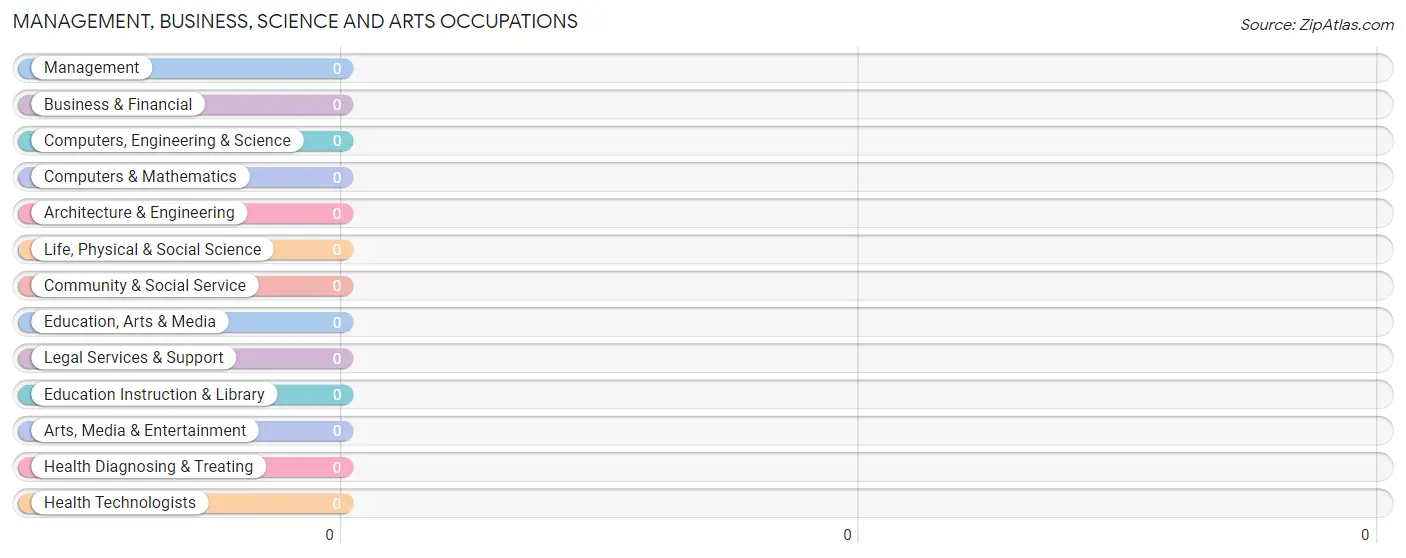
Management, Business, Science and Arts Occupations by Sex
| Occupation | Male | Female |
| Management | 0 (0.0%) | 0 (0.0%) |
| Business & Financial | 0 (0.0%) | 0 (0.0%) |
| Computers, Engineering & Science | 0 (0.0%) | 0 (0.0%) |
| Computers & Mathematics | 0 (0.0%) | 0 (0.0%) |
| Architecture & Engineering | 0 (0.0%) | 0 (0.0%) |
| Life, Physical & Social Science | 0 (0.0%) | 0 (0.0%) |
| Community & Social Service | 0 (0.0%) | 0 (0.0%) |
| Education, Arts & Media | 0 (0.0%) | 0 (0.0%) |
| Legal Services & Support | 0 (0.0%) | 0 (0.0%) |
| Education Instruction & Library | 0 (0.0%) | 0 (0.0%) |
| Arts, Media & Entertainment | 0 (0.0%) | 0 (0.0%) |
| Health Diagnosing & Treating | 0 (0.0%) | 0 (0.0%) |
| Health Technologists | 0 (0.0%) | 0 (0.0%) |
| Total (Category) | 0 (0.0%) | 0 (0.0%) |
| Total (Overall) | 255 (87.0%) | 38 (13.0%) |
Services Occupations
The most common Services occupations in West Waynesburg are Food Preparation & Serving (189 | 64.5%), and Cleaning & Maintenance (66 | 22.5%).
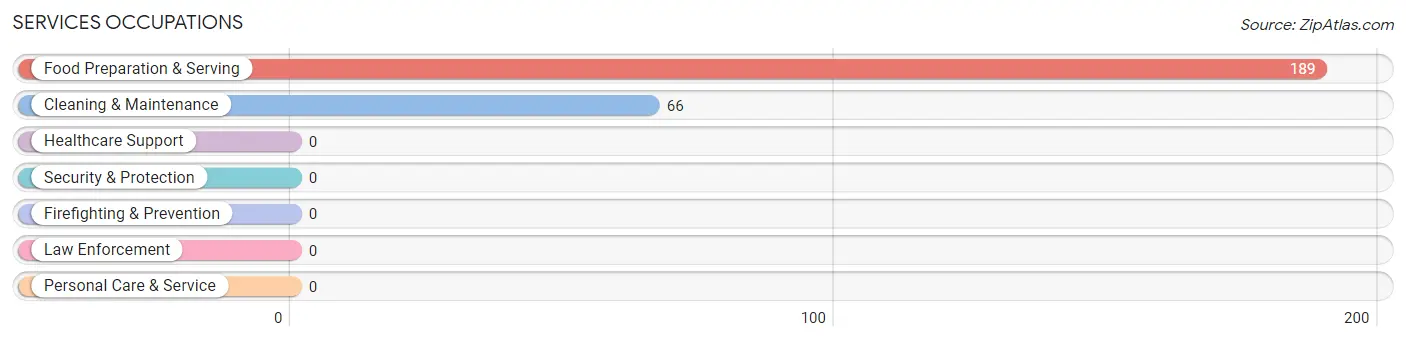
Services Occupations by Sex
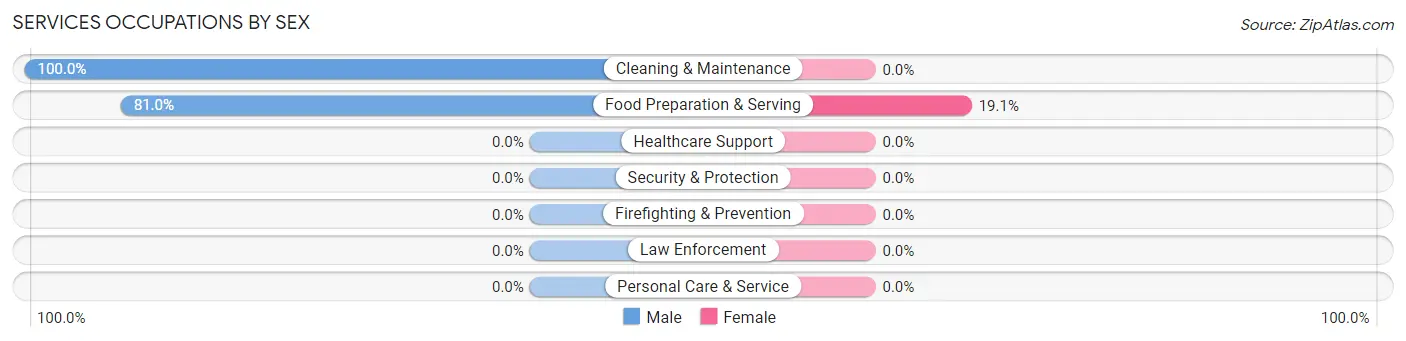
| Occupation | Male | Female |
| Healthcare Support | 0 (0.0%) | 0 (0.0%) |
| Security & Protection | 0 (0.0%) | 0 (0.0%) |
| Firefighting & Prevention | 0 (0.0%) | 0 (0.0%) |
| Law Enforcement | 0 (0.0%) | 0 (0.0%) |
| Food Preparation & Serving | 153 (80.9%) | 36 (19.1%) |
| Cleaning & Maintenance | 66 (100.0%) | 0 (0.0%) |
| Personal Care & Service | 0 (0.0%) | 0 (0.0%) |
| Total (Category) | 219 (85.9%) | 36 (14.1%) |
| Total (Overall) | 255 (87.0%) | 38 (13.0%) |
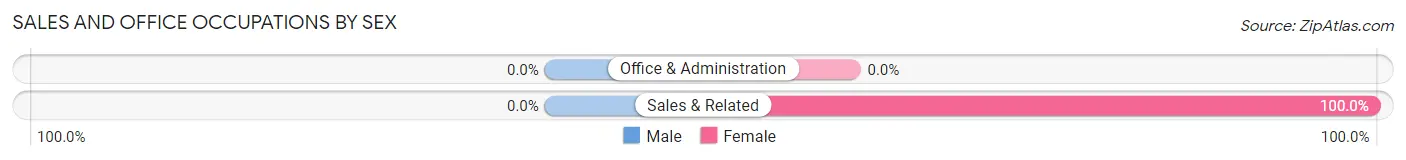
Sales and Office Occupations
The most common Sales and Office occupations in West Waynesburg are , and Sales & Related (2 | 0.7%).
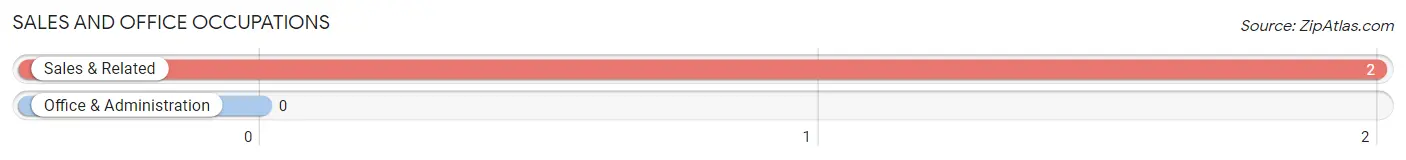
Sales and Office Occupations by Sex
| Occupation | Male | Female |
| Sales & Related | 0 (0.0%) | 2 (100.0%) |
| Office & Administration | 0 (0.0%) | 0 (0.0%) |
| Total (Category) | 0 (0.0%) | 2 (100.0%) |
| Total (Overall) | 255 (87.0%) | 38 (13.0%) |
Natural Resources, Construction and Maintenance Occupations
The most common Natural Resources, Construction and Maintenance occupations in West Waynesburg are , and Installation, Maintenance & Repair (36 | 12.3%).
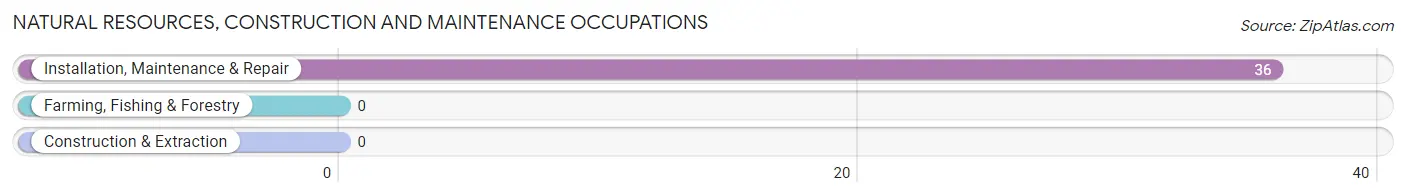
Natural Resources, Construction and Maintenance Occupations by Sex
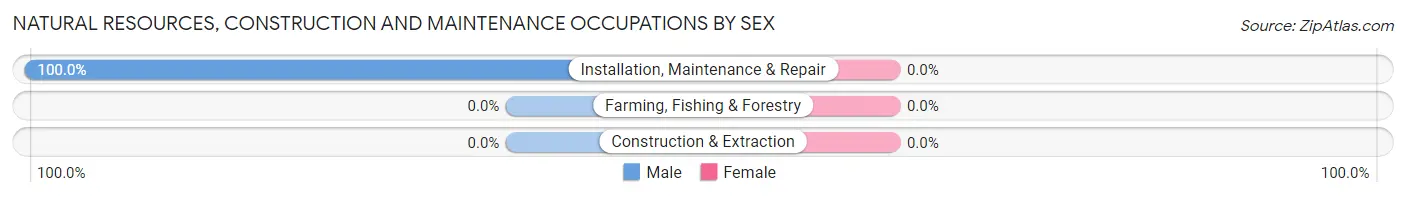
| Occupation | Male | Female |
| Farming, Fishing & Forestry | 0 (0.0%) | 0 (0.0%) |
| Construction & Extraction | 0 (0.0%) | 0 (0.0%) |
| Installation, Maintenance & Repair | 36 (100.0%) | 0 (0.0%) |
| Total (Category) | 36 (100.0%) | 0 (0.0%) |
| Total (Overall) | 255 (87.0%) | 38 (13.0%) |
Production, Transportation and Moving Occupations
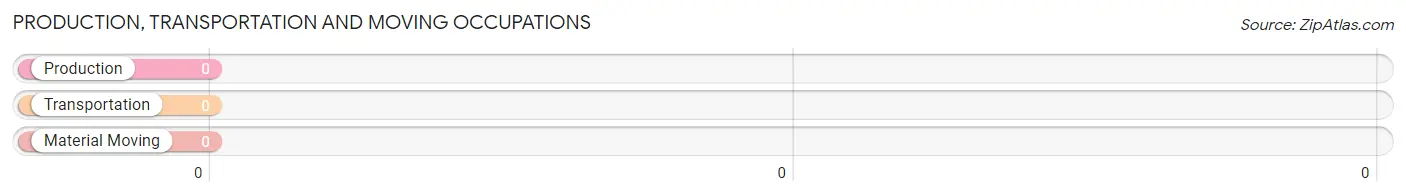
Production, Transportation and Moving Occupations by Sex
| Occupation | Male | Female |
| Production | 0 (0.0%) | 0 (0.0%) |
| Transportation | 0 (0.0%) | 0 (0.0%) |
| Material Moving | 0 (0.0%) | 0 (0.0%) |
| Total (Category) | 0 (0.0%) | 0 (0.0%) |
| Total (Overall) | 255 (87.0%) | 38 (13.0%) |
Employment Industries by Sex in West Waynesburg
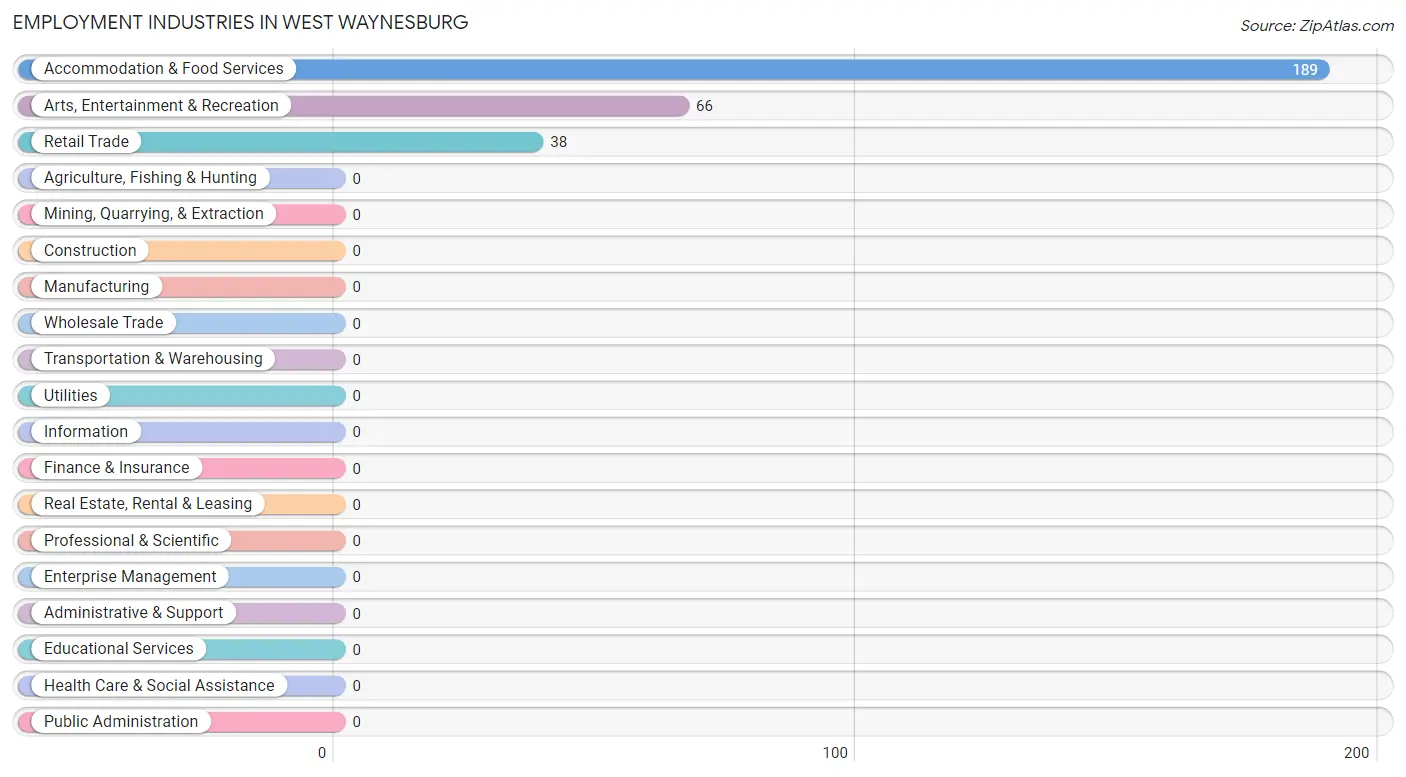
Employment Industries in West Waynesburg
The major employment industries in West Waynesburg include Accommodation & Food Services (189 | 64.5%), Arts, Entertainment & Recreation (66 | 22.5%), and Retail Trade (38 | 13.0%).
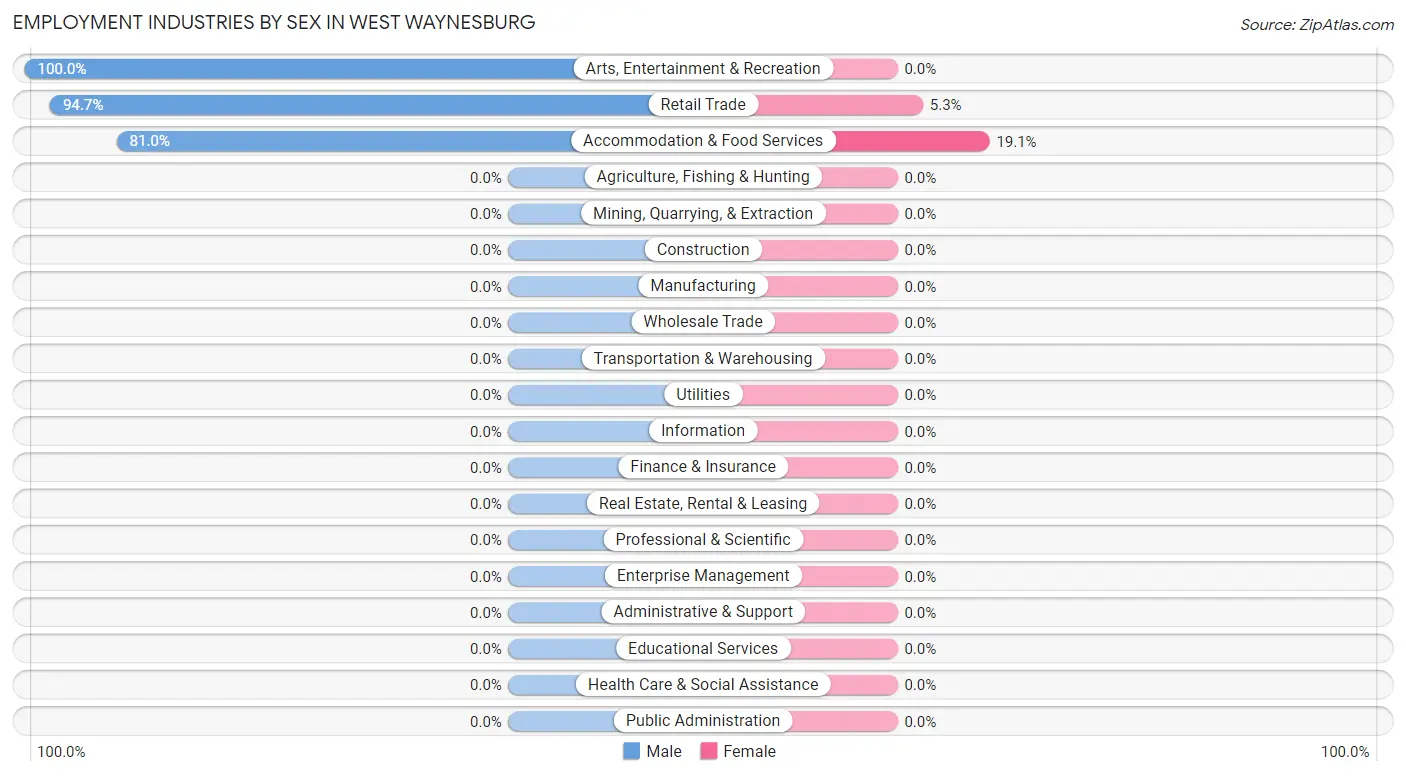
Employment Industries by Sex in West Waynesburg
The West Waynesburg industries that see more men than women are Arts, Entertainment & Recreation (100.0%), Retail Trade (94.7%), and Accommodation & Food Services (80.9%), whereas the industries that tend to have a higher number of women are Accommodation & Food Services (19.1%), and Retail Trade (5.3%).
| Industry | Male | Female |
| Agriculture, Fishing & Hunting | 0 (0.0%) | 0 (0.0%) |
| Mining, Quarrying, & Extraction | 0 (0.0%) | 0 (0.0%) |
| Construction | 0 (0.0%) | 0 (0.0%) |
| Manufacturing | 0 (0.0%) | 0 (0.0%) |
| Wholesale Trade | 0 (0.0%) | 0 (0.0%) |
| Retail Trade | 36 (94.7%) | 2 (5.3%) |
| Transportation & Warehousing | 0 (0.0%) | 0 (0.0%) |
| Utilities | 0 (0.0%) | 0 (0.0%) |
| Information | 0 (0.0%) | 0 (0.0%) |
| Finance & Insurance | 0 (0.0%) | 0 (0.0%) |
| Real Estate, Rental & Leasing | 0 (0.0%) | 0 (0.0%) |
| Professional & Scientific | 0 (0.0%) | 0 (0.0%) |
| Enterprise Management | 0 (0.0%) | 0 (0.0%) |
| Administrative & Support | 0 (0.0%) | 0 (0.0%) |
| Educational Services | 0 (0.0%) | 0 (0.0%) |
| Health Care & Social Assistance | 0 (0.0%) | 0 (0.0%) |
| Arts, Entertainment & Recreation | 66 (100.0%) | 0 (0.0%) |
| Accommodation & Food Services | 153 (80.9%) | 36 (19.1%) |
| Public Administration | 0 (0.0%) | 0 (0.0%) |
| Total | 255 (87.0%) | 38 (13.0%) |
Education in West Waynesburg
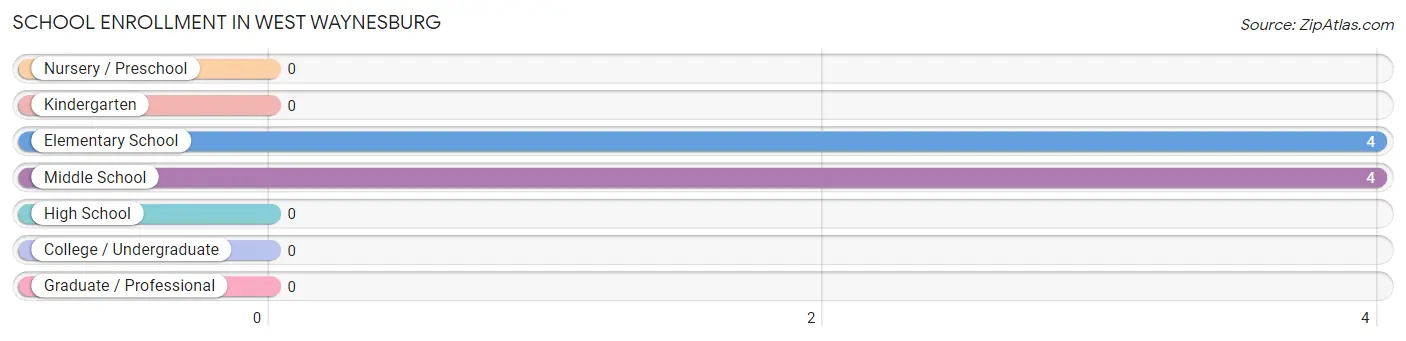
School Enrollment in West Waynesburg
The most common levels of schooling among the 8 students in West Waynesburg are elementary school (4 | 50.0%), and middle school (4 | 50.0%).
| School Level | # Students | % Students |
| Nursery / Preschool | 0 | 0.0% |
| Kindergarten | 0 | 0.0% |
| Elementary School | 4 | 50.0% |
| Middle School | 4 | 50.0% |
| High School | 0 | 0.0% |
| College / Undergraduate | 0 | 0.0% |
| Graduate / Professional | 0 | 0.0% |
| Total | 8 | 100.0% |
School Enrollment by Age by Funding Source in West Waynesburg
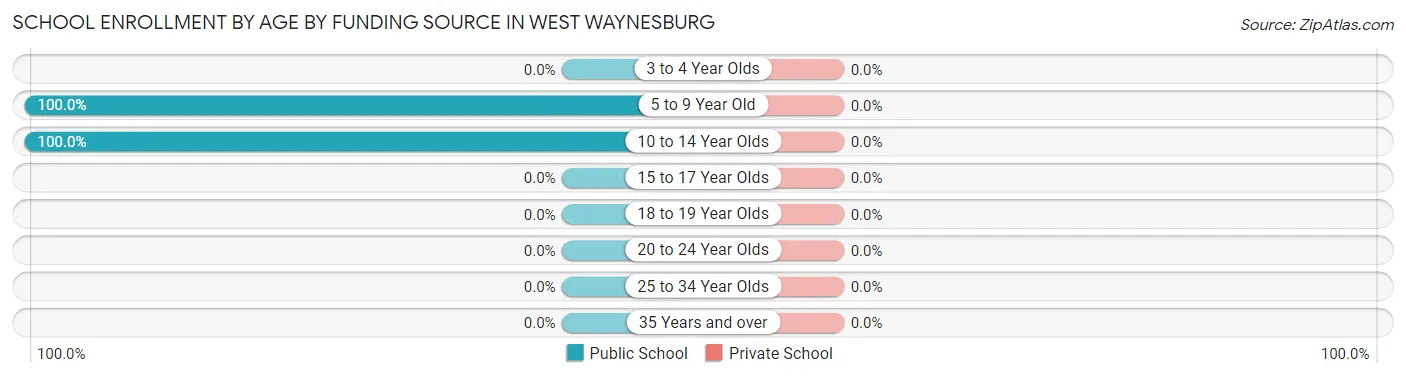
| Age Bracket | Public School | Private School |
| 3 to 4 Year Olds | 0 (0.0%) | 0 (0.0%) |
| 5 to 9 Year Old | 4 (100.0%) | 0 (0.0%) |
| 10 to 14 Year Olds | 4 (100.0%) | 0 (0.0%) |
| 15 to 17 Year Olds | 0 (0.0%) | 0 (0.0%) |
| 18 to 19 Year Olds | 0 (0.0%) | 0 (0.0%) |
| 20 to 24 Year Olds | 0 (0.0%) | 0 (0.0%) |
| 25 to 34 Year Olds | 0 (0.0%) | 0 (0.0%) |
| 35 Years and over | 0 (0.0%) | 0 (0.0%) |
| Total | 8 (100.0%) | 0 (0.0%) |
Educational Attainment by Field of Study in West Waynesburg
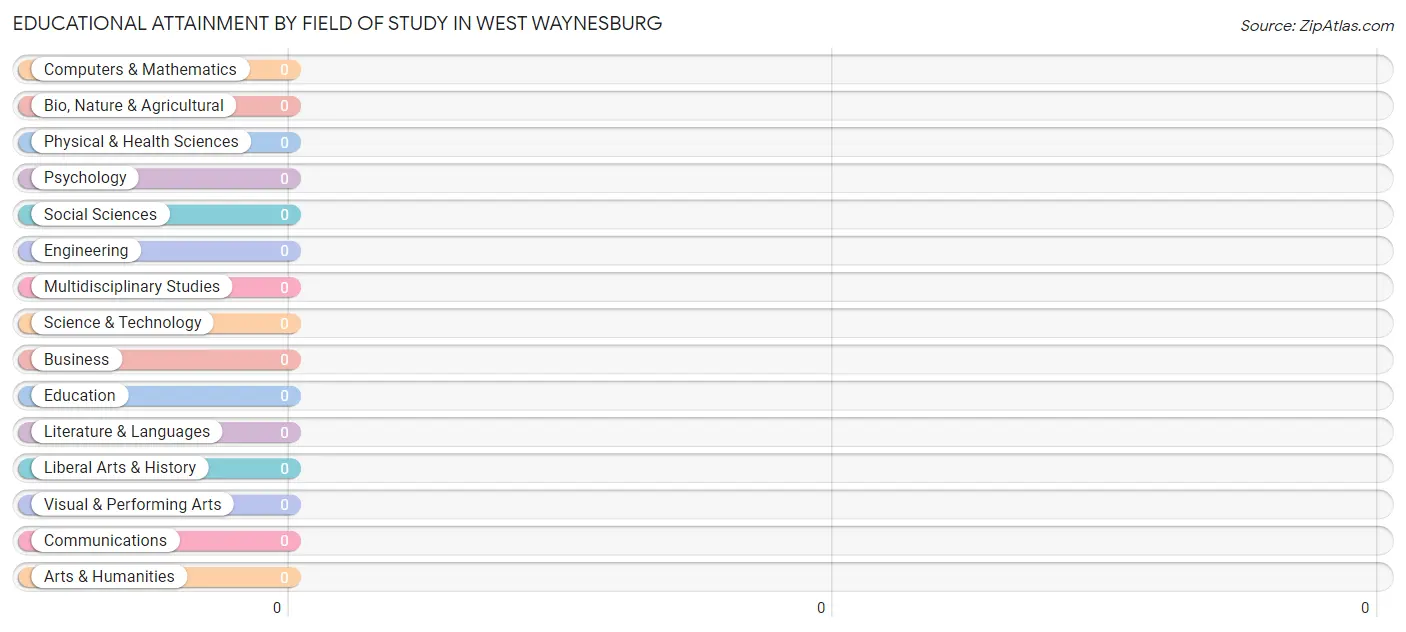
| Field of Study | # Graduates | % Graduates |
| Computers & Mathematics | 0 | 0.0% |
| Bio, Nature & Agricultural | 0 | 0.0% |
| Physical & Health Sciences | 0 | 0.0% |
| Psychology | 0 | 0.0% |
| Social Sciences | 0 | 0.0% |
| Engineering | 0 | 0.0% |
| Multidisciplinary Studies | 0 | 0.0% |
| Science & Technology | 0 | 0.0% |
| Business | 0 | 0.0% |
| Education | 0 | 0.0% |
| Literature & Languages | 0 | 0.0% |
| Liberal Arts & History | 0 | 0.0% |
| Visual & Performing Arts | 0 | 0.0% |
| Communications | 0 | 0.0% |
| Arts & Humanities | 0 | 0.0% |
| Total | 0 | 0.0% |
Transportation & Commute in West Waynesburg
Vehicle Availability by Sex in West Waynesburg
The most prevalent vehicle ownership categories in West Waynesburg are males with 2 vehicles (153, accounting for 60.0%) and females with 2 vehicles (2, making up 7,650.0%).
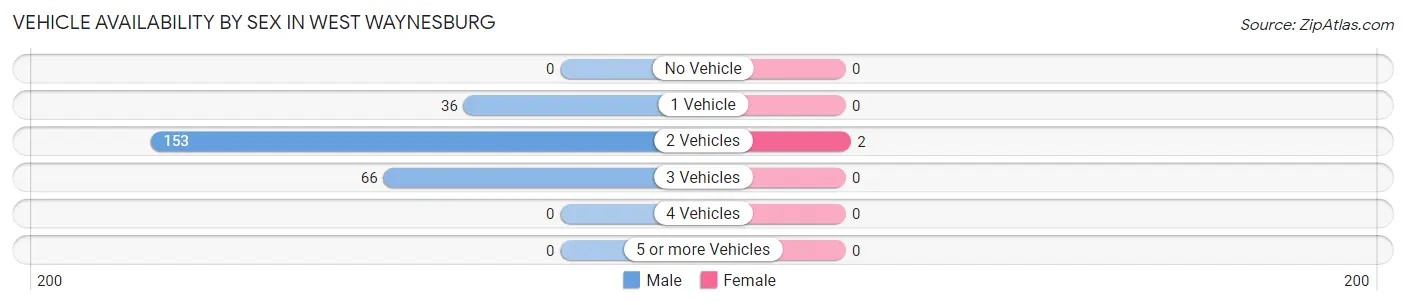
| Vehicles Available | Male | Female |
| No Vehicle | 0 (0.0%) | 0 (0.0%) |
| 1 Vehicle | 36 (14.1%) | 0 (0.0%) |
| 2 Vehicles | 153 (60.0%) | 2 (100.0%) |
| 3 Vehicles | 66 (25.9%) | 0 (0.0%) |
| 4 Vehicles | 0 (0.0%) | 0 (0.0%) |
| 5 or more Vehicles | 0 (0.0%) | 0 (0.0%) |
| Total | 255 (100.0%) | 2 (100.0%) |
Commute Time in West Waynesburg
The most frequently occuring commute durations in West Waynesburg are 10 to 14 minutes (153 commuters, 59.5%), 60 to 89 minutes (66 commuters, 25.7%), and 30 to 34 minutes (36 commuters, 14.0%).
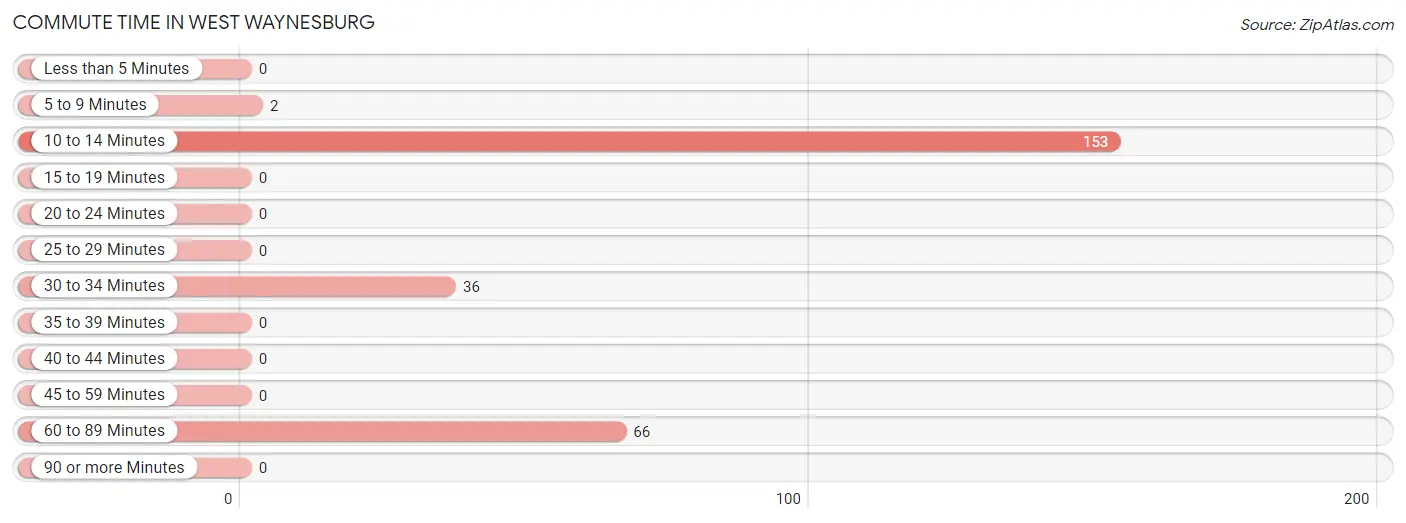
| Commute Time | # Commuters | % Commuters |
| Less than 5 Minutes | 0 | 0.0% |
| 5 to 9 Minutes | 2 | 0.8% |
| 10 to 14 Minutes | 153 | 59.5% |
| 15 to 19 Minutes | 0 | 0.0% |
| 20 to 24 Minutes | 0 | 0.0% |
| 25 to 29 Minutes | 0 | 0.0% |
| 30 to 34 Minutes | 36 | 14.0% |
| 35 to 39 Minutes | 0 | 0.0% |
| 40 to 44 Minutes | 0 | 0.0% |
| 45 to 59 Minutes | 0 | 0.0% |
| 60 to 89 Minutes | 66 | 25.7% |
| 90 or more Minutes | 0 | 0.0% |
Commute Time by Sex in West Waynesburg
The most common commute times in West Waynesburg are 10 to 14 minutes (153 commuters, 60.0%) for males and 5 to 9 minutes (2 commuters, 100.0%) for females.
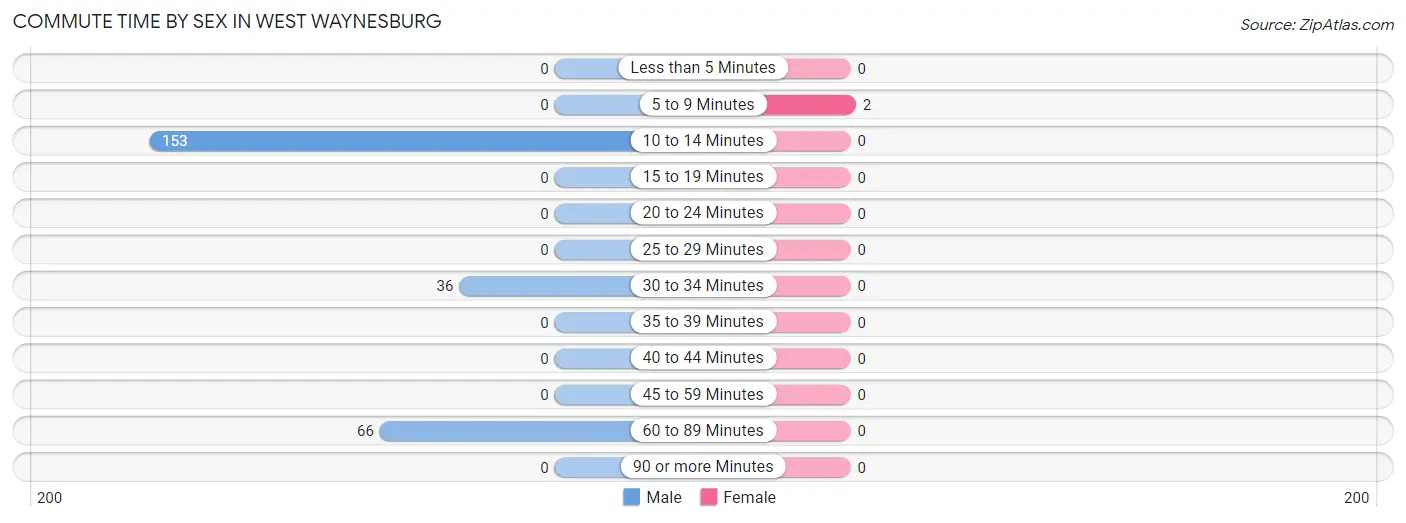
| Commute Time | Male | Female |
| Less than 5 Minutes | 0 (0.0%) | 0 (0.0%) |
| 5 to 9 Minutes | 0 (0.0%) | 2 (100.0%) |
| 10 to 14 Minutes | 153 (60.0%) | 0 (0.0%) |
| 15 to 19 Minutes | 0 (0.0%) | 0 (0.0%) |
| 20 to 24 Minutes | 0 (0.0%) | 0 (0.0%) |
| 25 to 29 Minutes | 0 (0.0%) | 0 (0.0%) |
| 30 to 34 Minutes | 36 (14.1%) | 0 (0.0%) |
| 35 to 39 Minutes | 0 (0.0%) | 0 (0.0%) |
| 40 to 44 Minutes | 0 (0.0%) | 0 (0.0%) |
| 45 to 59 Minutes | 0 (0.0%) | 0 (0.0%) |
| 60 to 89 Minutes | 66 (25.9%) | 0 (0.0%) |
| 90 or more Minutes | 0 (0.0%) | 0 (0.0%) |
Time of Departure to Work by Sex in West Waynesburg
The most frequent times of departure to work in West Waynesburg are 4:00 PM to 11:59 PM (153, 60.0%) for males and 8:30 AM to 8:59 AM (2, 100.0%) for females.
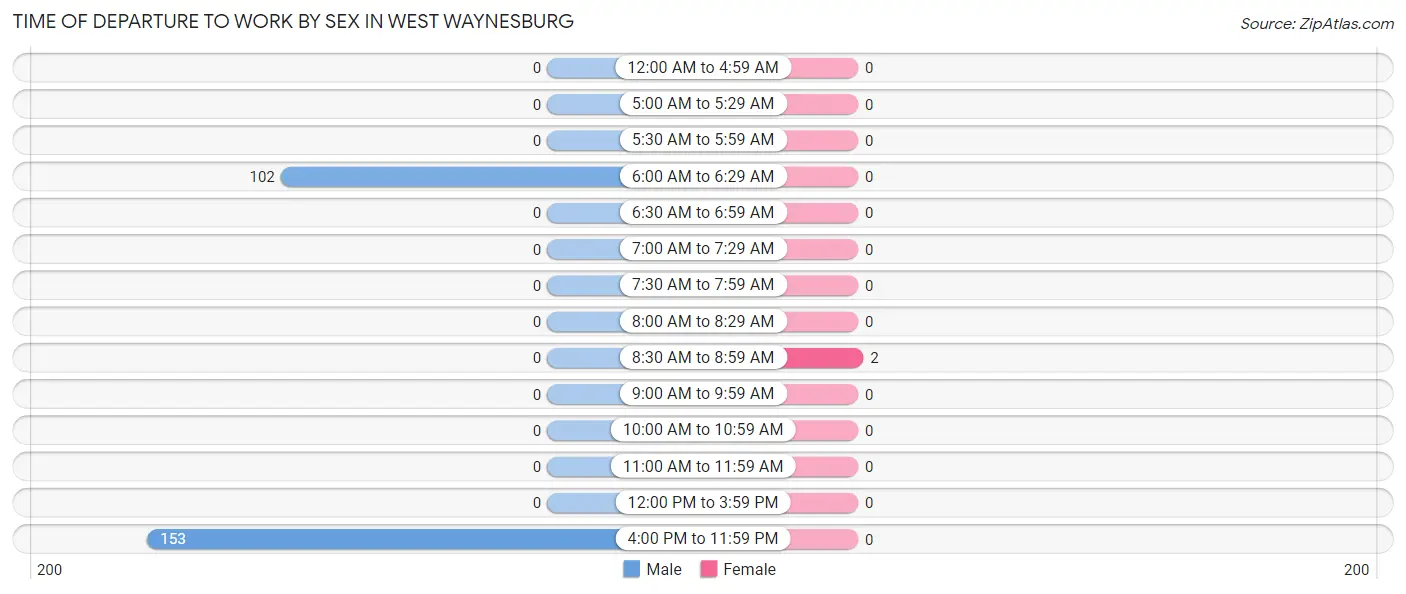
| Time of Departure | Male | Female |
| 12:00 AM to 4:59 AM | 0 (0.0%) | 0 (0.0%) |
| 5:00 AM to 5:29 AM | 0 (0.0%) | 0 (0.0%) |
| 5:30 AM to 5:59 AM | 0 (0.0%) | 0 (0.0%) |
| 6:00 AM to 6:29 AM | 102 (40.0%) | 0 (0.0%) |
| 6:30 AM to 6:59 AM | 0 (0.0%) | 0 (0.0%) |
| 7:00 AM to 7:29 AM | 0 (0.0%) | 0 (0.0%) |
| 7:30 AM to 7:59 AM | 0 (0.0%) | 0 (0.0%) |
| 8:00 AM to 8:29 AM | 0 (0.0%) | 0 (0.0%) |
| 8:30 AM to 8:59 AM | 0 (0.0%) | 2 (100.0%) |
| 9:00 AM to 9:59 AM | 0 (0.0%) | 0 (0.0%) |
| 10:00 AM to 10:59 AM | 0 (0.0%) | 0 (0.0%) |
| 11:00 AM to 11:59 AM | 0 (0.0%) | 0 (0.0%) |
| 12:00 PM to 3:59 PM | 0 (0.0%) | 0 (0.0%) |
| 4:00 PM to 11:59 PM | 153 (60.0%) | 0 (0.0%) |
| Total | 255 (100.0%) | 2 (100.0%) |
Housing Occupancy in West Waynesburg
Occupancy by Ownership in West Waynesburg
Of the total 306 dwellings in West Waynesburg, owner-occupied units account for 118 (38.6%), while renter-occupied units make up 188 (61.4%).
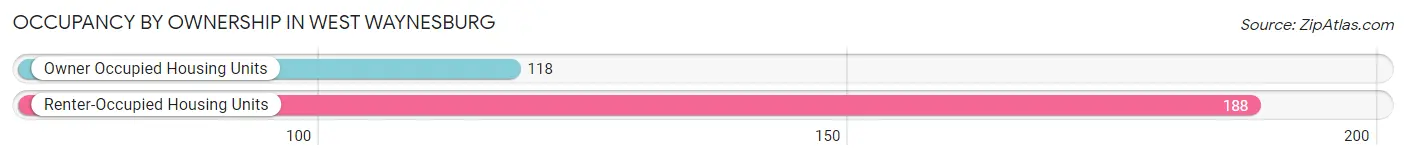
| Occupancy | # Housing Units | % Housing Units |
| Owner Occupied Housing Units | 118 | 38.6% |
| Renter-Occupied Housing Units | 188 | 61.4% |
| Total Occupied Housing Units | 306 | 100.0% |
Occupancy by Household Size in West Waynesburg
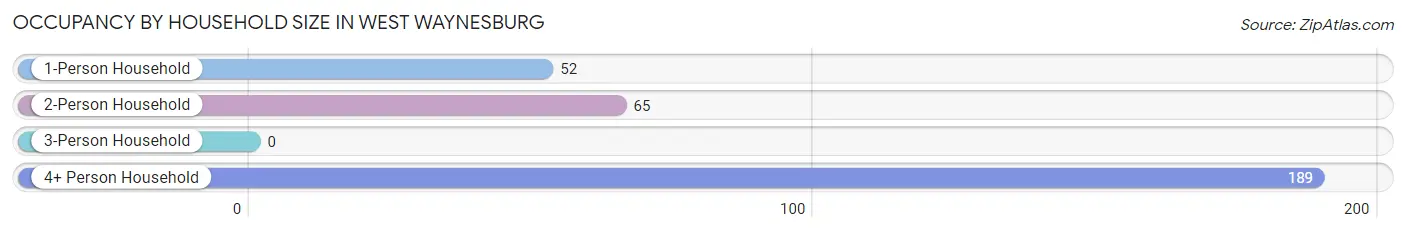
| Household Size | # Housing Units | % Housing Units |
| 1-Person Household | 52 | 17.0% |
| 2-Person Household | 65 | 21.2% |
| 3-Person Household | 0 | 0.0% |
| 4+ Person Household | 189 | 61.8% |
| Total Housing Units | 306 | 100.0% |
Occupancy by Ownership by Household Size in West Waynesburg
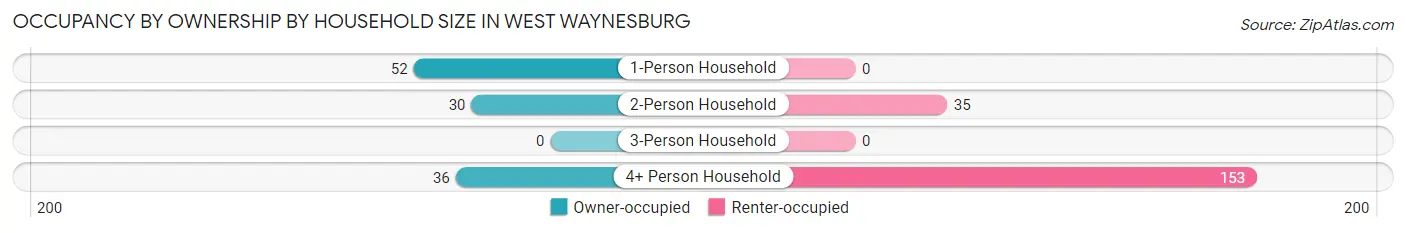
| Household Size | Owner-occupied | Renter-occupied |
| 1-Person Household | 52 (100.0%) | 0 (0.0%) |
| 2-Person Household | 30 (46.2%) | 35 (53.8%) |
| 3-Person Household | 0 (0.0%) | 0 (0.0%) |
| 4+ Person Household | 36 (19.1%) | 153 (80.9%) |
| Total Housing Units | 118 (38.6%) | 188 (61.4%) |
Occupancy by Educational Attainment in West Waynesburg
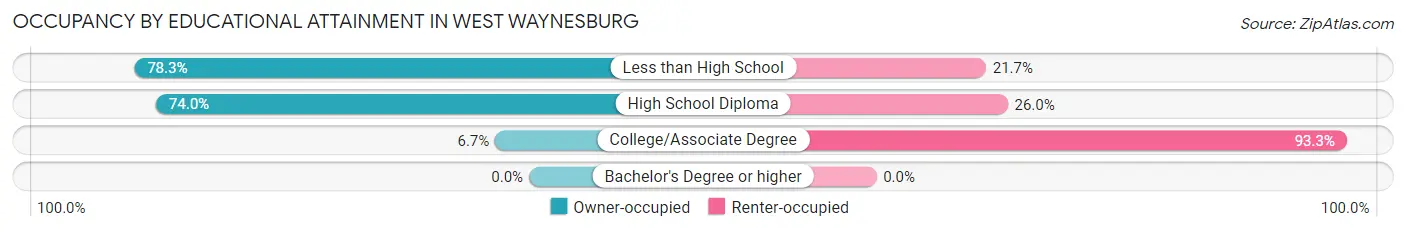
| Household Size | Owner-occupied | Renter-occupied |
| Less than High School | 36 (78.3%) | 10 (21.7%) |
| High School Diploma | 71 (74.0%) | 25 (26.0%) |
| College/Associate Degree | 11 (6.7%) | 153 (93.3%) |
| Bachelor's Degree or higher | 0 (0.0%) | 0 (0.0%) |
Occupancy by Age of Householder in West Waynesburg
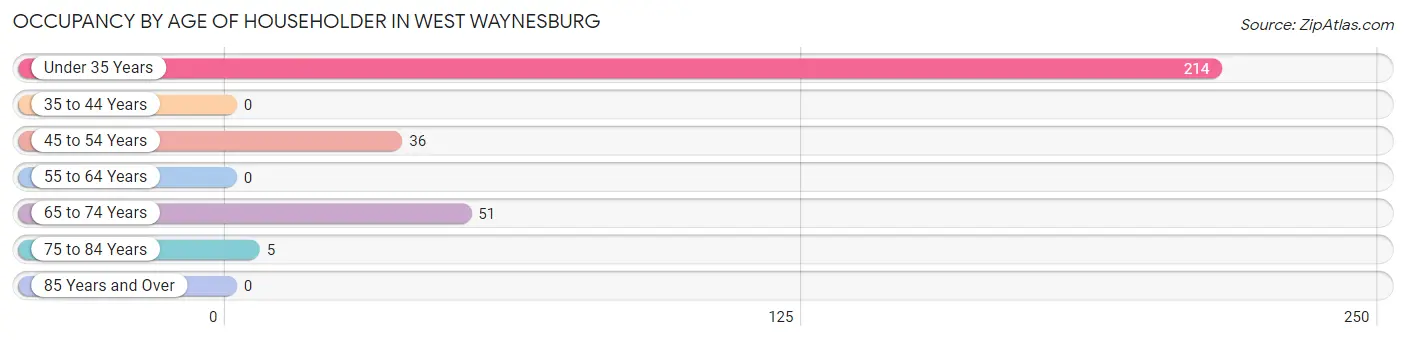
| Age Bracket | # Households | % Households |
| Under 35 Years | 214 | 69.9% |
| 35 to 44 Years | 0 | 0.0% |
| 45 to 54 Years | 36 | 11.8% |
| 55 to 64 Years | 0 | 0.0% |
| 65 to 74 Years | 51 | 16.7% |
| 75 to 84 Years | 5 | 1.6% |
| 85 Years and Over | 0 | 0.0% |
| Total | 306 | 100.0% |
Housing Finances in West Waynesburg
Median Income by Occupancy in West Waynesburg
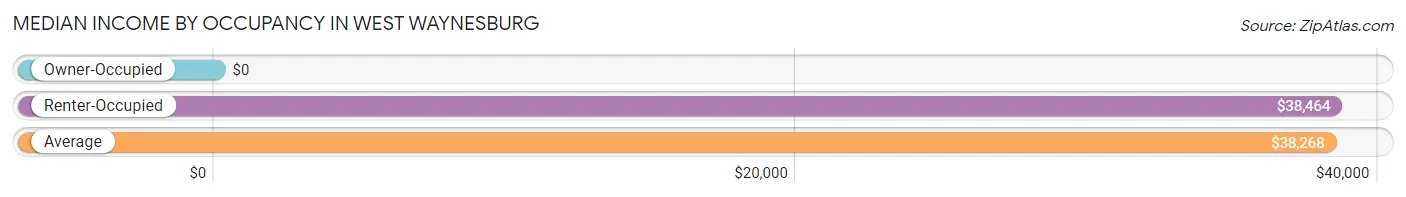
| Occupancy Type | # Households | Median Income |
| Owner-Occupied | 118 (38.6%) | $0 |
| Renter-Occupied | 188 (61.4%) | $38,464 |
| Average | 306 (100.0%) | $38,268 |
Occupancy by Householder Income Bracket in West Waynesburg
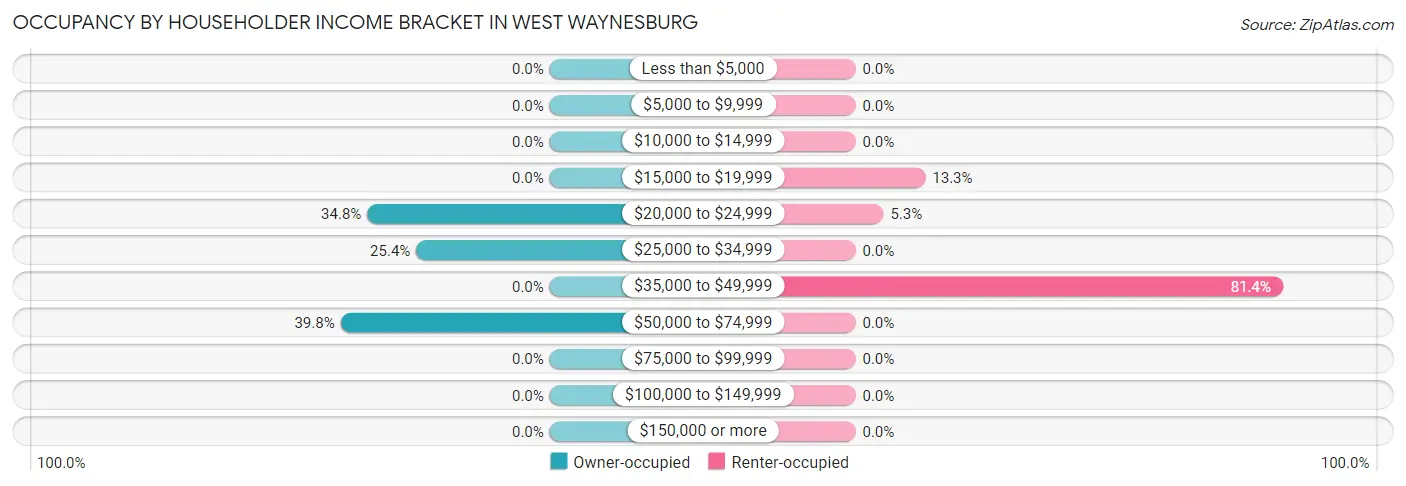
| Income Bracket | Owner-occupied | Renter-occupied |
| Less than $5,000 | 0 (0.0%) | 0 (0.0%) |
| $5,000 to $9,999 | 0 (0.0%) | 0 (0.0%) |
| $10,000 to $14,999 | 0 (0.0%) | 0 (0.0%) |
| $15,000 to $19,999 | 0 (0.0%) | 25 (13.3%) |
| $20,000 to $24,999 | 41 (34.7%) | 10 (5.3%) |
| $25,000 to $34,999 | 30 (25.4%) | 0 (0.0%) |
| $35,000 to $49,999 | 0 (0.0%) | 153 (81.4%) |
| $50,000 to $74,999 | 47 (39.8%) | 0 (0.0%) |
| $75,000 to $99,999 | 0 (0.0%) | 0 (0.0%) |
| $100,000 to $149,999 | 0 (0.0%) | 0 (0.0%) |
| $150,000 or more | 0 (0.0%) | 0 (0.0%) |
| Total | 118 (100.0%) | 188 (100.0%) |
Monthly Housing Cost Tiers in West Waynesburg
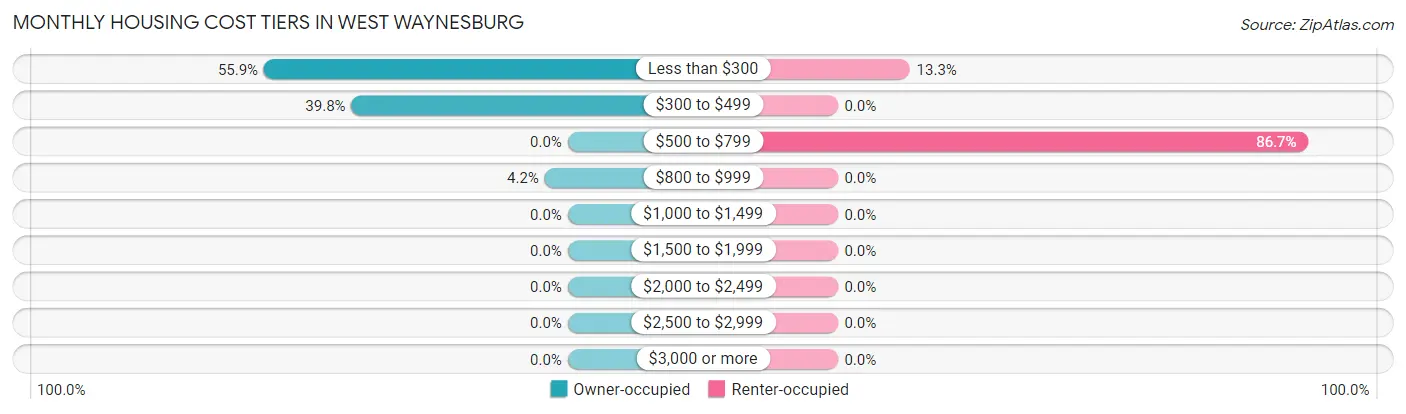
| Monthly Cost | Owner-occupied | Renter-occupied |
| Less than $300 | 66 (55.9%) | 25 (13.3%) |
| $300 to $499 | 47 (39.8%) | 0 (0.0%) |
| $500 to $799 | 0 (0.0%) | 163 (86.7%) |
| $800 to $999 | 5 (4.2%) | 0 (0.0%) |
| $1,000 to $1,499 | 0 (0.0%) | 0 (0.0%) |
| $1,500 to $1,999 | 0 (0.0%) | 0 (0.0%) |
| $2,000 to $2,499 | 0 (0.0%) | 0 (0.0%) |
| $2,500 to $2,999 | 0 (0.0%) | 0 (0.0%) |
| $3,000 or more | 0 (0.0%) | 0 (0.0%) |
| Total | 118 (100.0%) | 188 (100.0%) |
Physical Housing Characteristics in West Waynesburg
Housing Structures in West Waynesburg
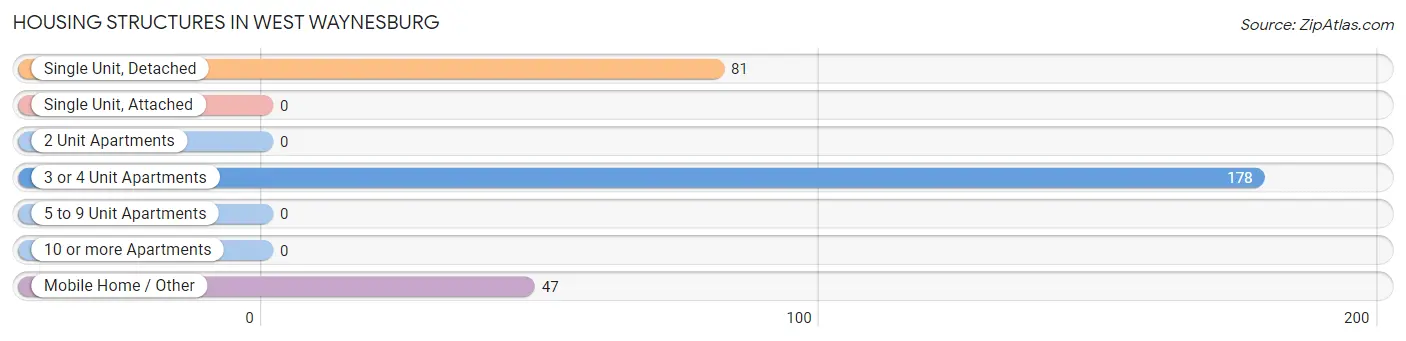
| Structure Type | # Housing Units | % Housing Units |
| Single Unit, Detached | 81 | 26.5% |
| Single Unit, Attached | 0 | 0.0% |
| 2 Unit Apartments | 0 | 0.0% |
| 3 or 4 Unit Apartments | 178 | 58.2% |
| 5 to 9 Unit Apartments | 0 | 0.0% |
| 10 or more Apartments | 0 | 0.0% |
| Mobile Home / Other | 47 | 15.4% |
| Total | 306 | 100.0% |
Housing Structures by Occupancy in West Waynesburg
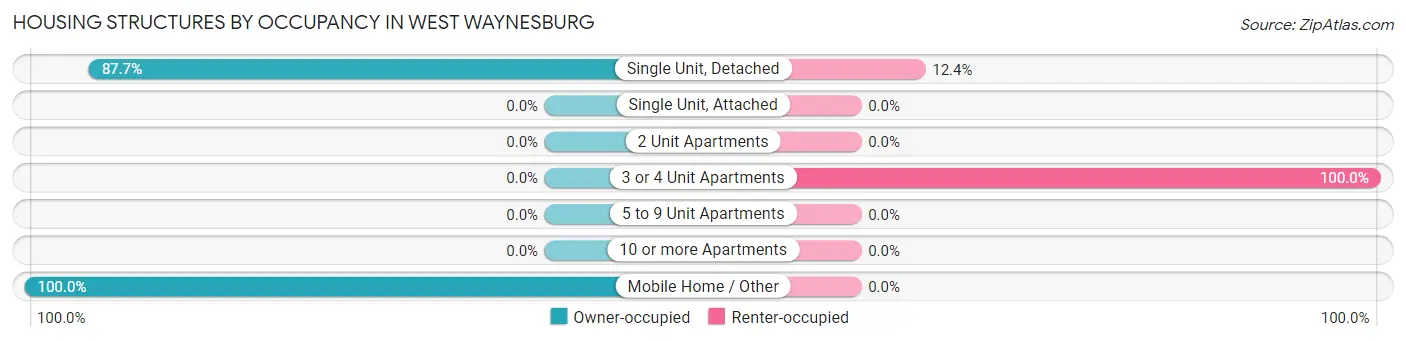
| Structure Type | Owner-occupied | Renter-occupied |
| Single Unit, Detached | 71 (87.6%) | 10 (12.3%) |
| Single Unit, Attached | 0 (0.0%) | 0 (0.0%) |
| 2 Unit Apartments | 0 (0.0%) | 0 (0.0%) |
| 3 or 4 Unit Apartments | 0 (0.0%) | 178 (100.0%) |
| 5 to 9 Unit Apartments | 0 (0.0%) | 0 (0.0%) |
| 10 or more Apartments | 0 (0.0%) | 0 (0.0%) |
| Mobile Home / Other | 47 (100.0%) | 0 (0.0%) |
| Total | 118 (38.6%) | 188 (61.4%) |
Housing Structures by Number of Rooms in West Waynesburg
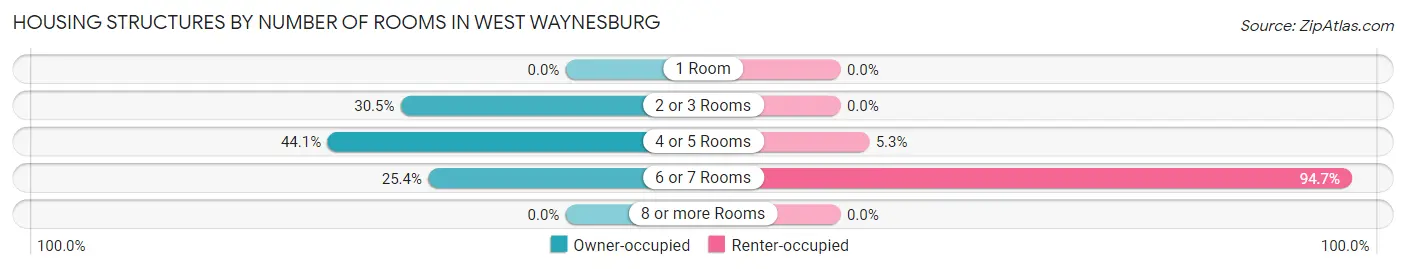
| Number of Rooms | Owner-occupied | Renter-occupied |
| 1 Room | 0 (0.0%) | 0 (0.0%) |
| 2 or 3 Rooms | 36 (30.5%) | 0 (0.0%) |
| 4 or 5 Rooms | 52 (44.1%) | 10 (5.3%) |
| 6 or 7 Rooms | 30 (25.4%) | 178 (94.7%) |
| 8 or more Rooms | 0 (0.0%) | 0 (0.0%) |
| Total | 118 (100.0%) | 188 (100.0%) |
Housing Structure by Heating Type in West Waynesburg
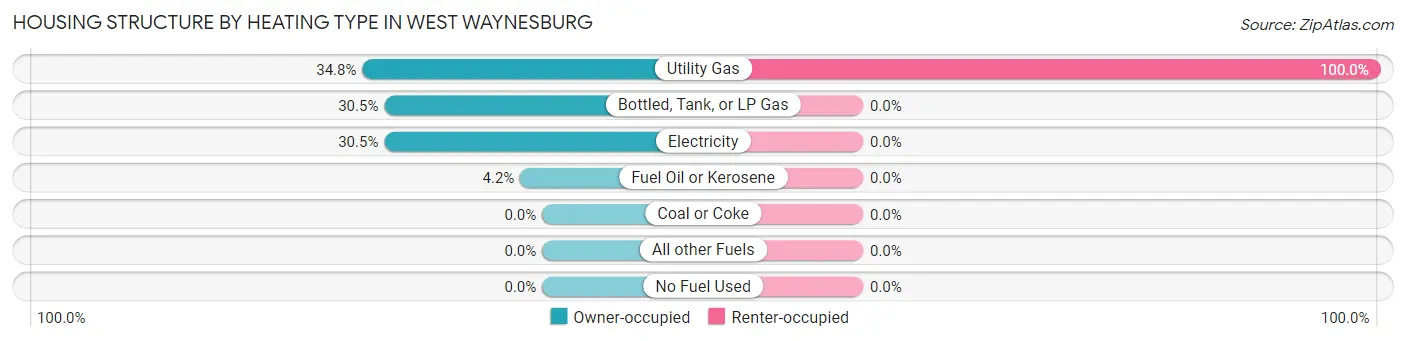
| Heating Type | Owner-occupied | Renter-occupied |
| Utility Gas | 41 (34.7%) | 188 (100.0%) |
| Bottled, Tank, or LP Gas | 36 (30.5%) | 0 (0.0%) |
| Electricity | 36 (30.5%) | 0 (0.0%) |
| Fuel Oil or Kerosene | 5 (4.2%) | 0 (0.0%) |
| Coal or Coke | 0 (0.0%) | 0 (0.0%) |
| All other Fuels | 0 (0.0%) | 0 (0.0%) |
| No Fuel Used | 0 (0.0%) | 0 (0.0%) |
| Total | 118 (100.0%) | 188 (100.0%) |
Household Vehicle Usage in West Waynesburg
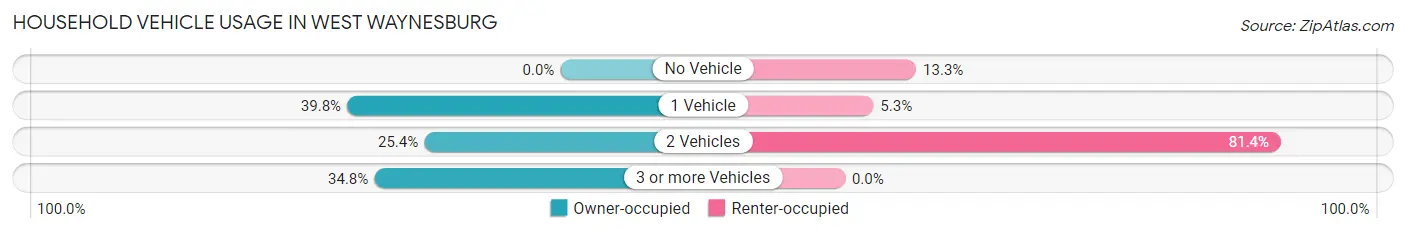
| Vehicles per Household | Owner-occupied | Renter-occupied |
| No Vehicle | 0 (0.0%) | 25 (13.3%) |
| 1 Vehicle | 47 (39.8%) | 10 (5.3%) |
| 2 Vehicles | 30 (25.4%) | 153 (81.4%) |
| 3 or more Vehicles | 41 (34.7%) | 0 (0.0%) |
| Total | 118 (100.0%) | 188 (100.0%) |
Real Estate & Mortgages in West Waynesburg
Real Estate and Mortgage Overview in West Waynesburg
| Characteristic | Without Mortgage | With Mortgage |
| Housing Units | 113 | 5 |
| Median Property Value | - | - |
| Median Household Income | - | - |
| Monthly Housing Costs | $284 | $0 |
| Real Estate Taxes | $714 | $0 |
Property Value by Mortgage Status in West Waynesburg
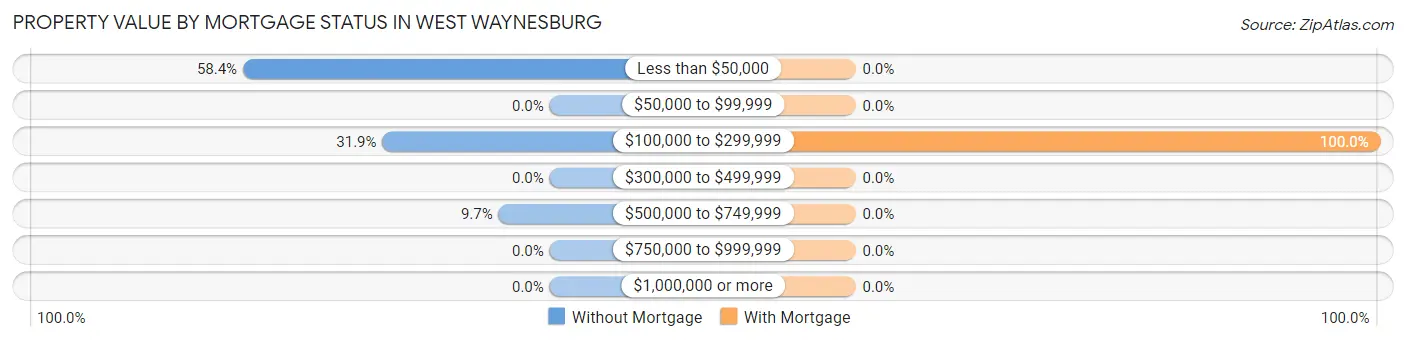
| Property Value | Without Mortgage | With Mortgage |
| Less than $50,000 | 66 (58.4%) | 0 (0.0%) |
| $50,000 to $99,999 | 0 (0.0%) | 0 (0.0%) |
| $100,000 to $299,999 | 36 (31.9%) | 5 (100.0%) |
| $300,000 to $499,999 | 0 (0.0%) | 0 (0.0%) |
| $500,000 to $749,999 | 11 (9.7%) | 0 (0.0%) |
| $750,000 to $999,999 | 0 (0.0%) | 0 (0.0%) |
| $1,000,000 or more | 0 (0.0%) | 0 (0.0%) |
| Total | 113 (100.0%) | 5 (100.0%) |
Household Income by Mortgage Status in West Waynesburg
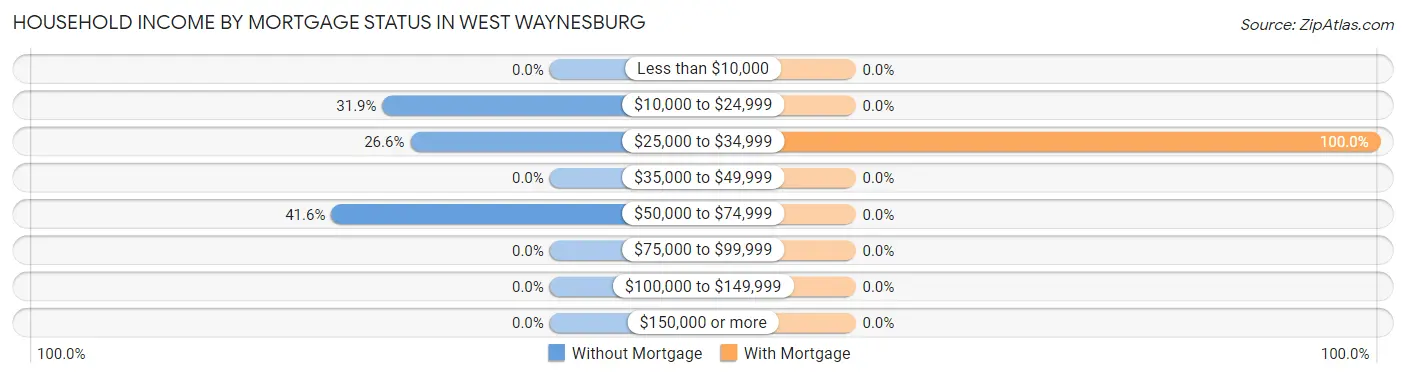
| Household Income | Without Mortgage | With Mortgage |
| Less than $10,000 | 0 (0.0%) | 0 (0.0%) |
| $10,000 to $24,999 | 36 (31.9%) | 0 (0.0%) |
| $25,000 to $34,999 | 30 (26.6%) | 5 (100.0%) |
| $35,000 to $49,999 | 0 (0.0%) | 0 (0.0%) |
| $50,000 to $74,999 | 47 (41.6%) | 0 (0.0%) |
| $75,000 to $99,999 | 0 (0.0%) | 0 (0.0%) |
| $100,000 to $149,999 | 0 (0.0%) | 0 (0.0%) |
| $150,000 or more | 0 (0.0%) | 0 (0.0%) |
| Total | 113 (100.0%) | 5 (100.0%) |
Property Value to Household Income Ratio in West Waynesburg
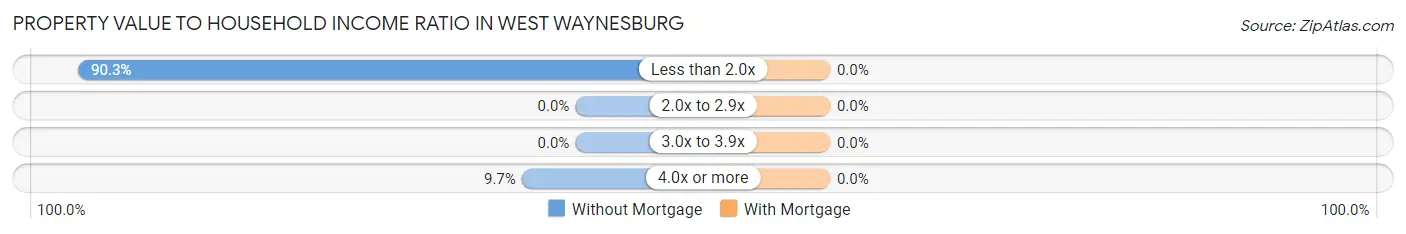
| Value-to-Income Ratio | Without Mortgage | With Mortgage |
| Less than 2.0x | 102 (90.3%) | 0 (0.0%) |
| 2.0x to 2.9x | 0 (0.0%) | 0 (0.0%) |
| 3.0x to 3.9x | 0 (0.0%) | 0 (0.0%) |
| 4.0x or more | 11 (9.7%) | 0 (0.0%) |
| Total | 113 (100.0%) | 5 (100.0%) |
Real Estate Taxes by Mortgage Status in West Waynesburg
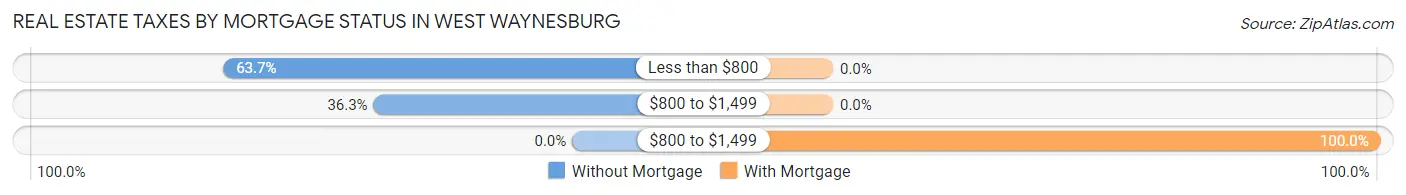
| Property Taxes | Without Mortgage | With Mortgage |
| Less than $800 | 72 (63.7%) | 0 (0.0%) |
| $800 to $1,499 | 41 (36.3%) | 0 (0.0%) |
| $800 to $1,499 | 0 (0.0%) | 5 (100.0%) |
| Total | 113 (100.0%) | 5 (100.0%) |
Health & Disability in West Waynesburg
Health Insurance Coverage by Age in West Waynesburg
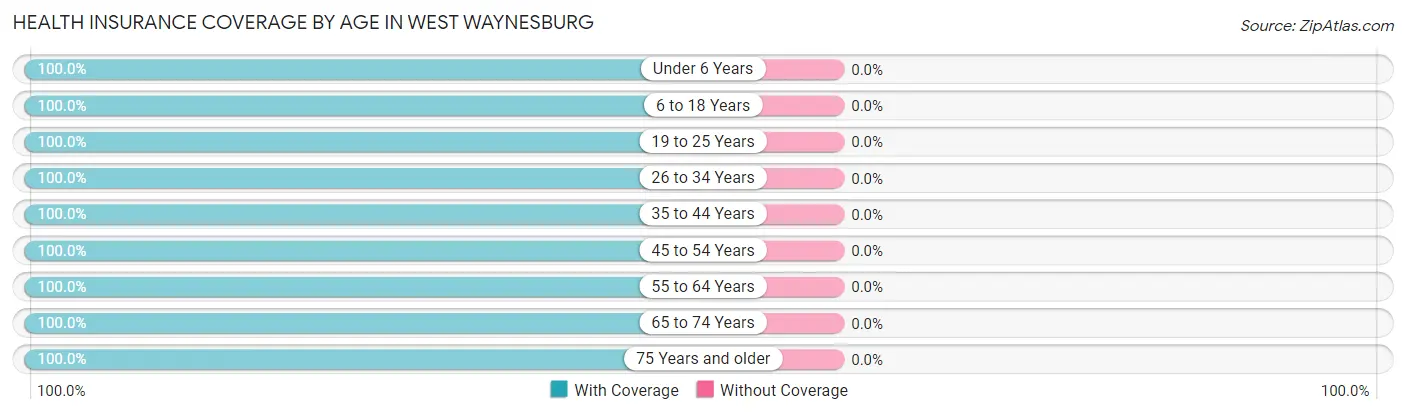
| Age Bracket | With Coverage | Without Coverage |
| Under 6 Years | 12 (100.0%) | 0 (0.0%) |
| 6 to 18 Years | 8 (100.0%) | 0 (0.0%) |
| 19 to 25 Years | 61 (100.0%) | 0 (0.0%) |
| 26 to 34 Years | 153 (100.0%) | 0 (0.0%) |
| 35 to 44 Years | 2 (100.0%) | 0 (0.0%) |
| 45 to 54 Years | 75 (100.0%) | 0 (0.0%) |
| 55 to 64 Years | 38 (100.0%) | 0 (0.0%) |
| 65 to 74 Years | 99 (100.0%) | 0 (0.0%) |
| 75 Years and older | 5 (100.0%) | 0 (0.0%) |
| Total | 453 (100.0%) | 0 (0.0%) |
Health Insurance Coverage by Citizenship Status in West Waynesburg
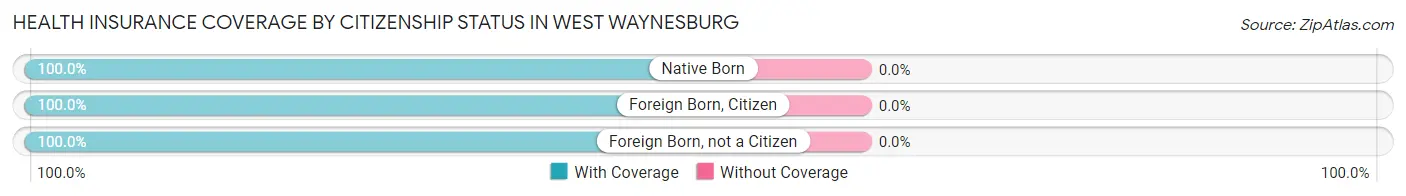
| Citizenship Status | With Coverage | Without Coverage |
| Native Born | 12 (100.0%) | 0 (0.0%) |
| Foreign Born, Citizen | 8 (100.0%) | 0 (0.0%) |
| Foreign Born, not a Citizen | 61 (100.0%) | 0 (0.0%) |
Health Insurance Coverage by Household Income in West Waynesburg
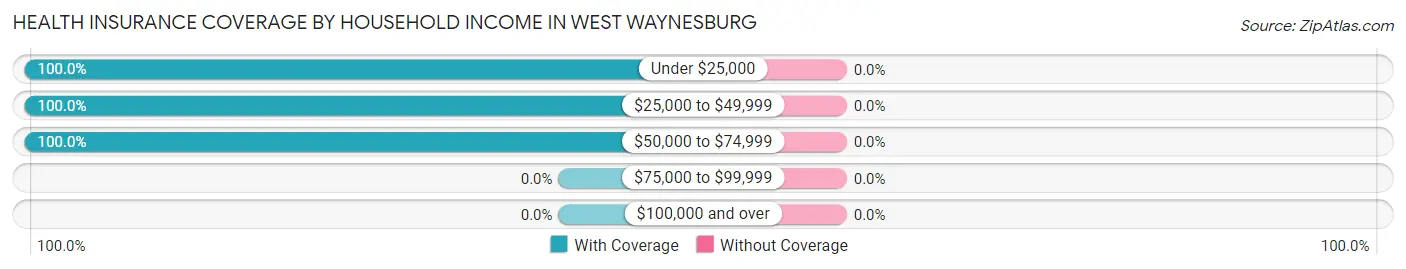
| Household Income | With Coverage | Without Coverage |
| Under $25,000 | 99 (100.0%) | 0 (0.0%) |
| $25,000 to $49,999 | 224 (100.0%) | 0 (0.0%) |
| $50,000 to $74,999 | 130 (100.0%) | 0 (0.0%) |
| $75,000 to $99,999 | 0 (0.0%) | 0 (0.0%) |
| $100,000 and over | 0 (0.0%) | 0 (0.0%) |
Public vs Private Health Insurance Coverage by Age in West Waynesburg
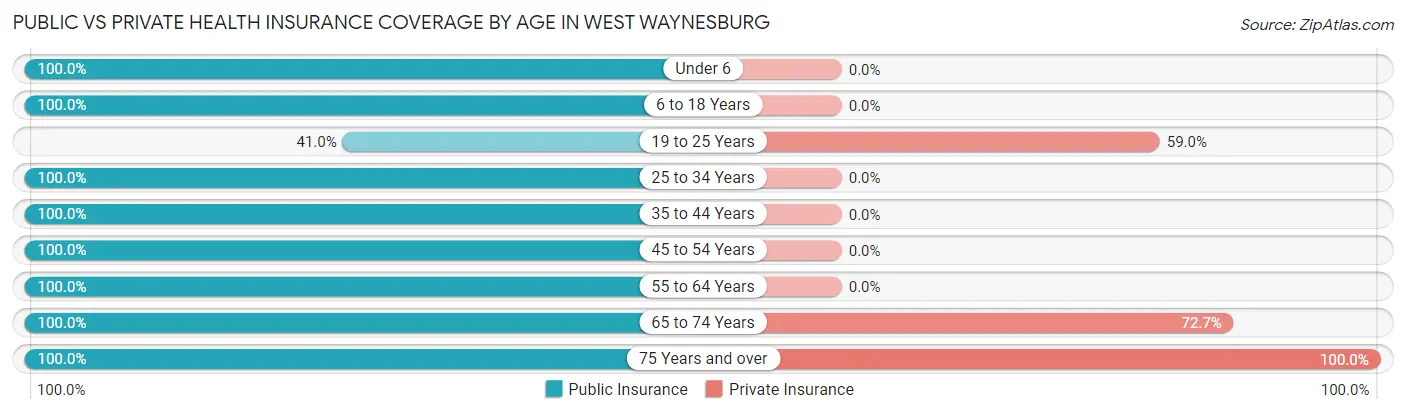
| Age Bracket | Public Insurance | Private Insurance |
| Under 6 | 12 (100.0%) | 0 (0.0%) |
| 6 to 18 Years | 8 (100.0%) | 0 (0.0%) |
| 19 to 25 Years | 25 (41.0%) | 36 (59.0%) |
| 25 to 34 Years | 153 (100.0%) | 0 (0.0%) |
| 35 to 44 Years | 2 (100.0%) | 0 (0.0%) |
| 45 to 54 Years | 75 (100.0%) | 0 (0.0%) |
| 55 to 64 Years | 38 (100.0%) | 0 (0.0%) |
| 65 to 74 Years | 99 (100.0%) | 72 (72.7%) |
| 75 Years and over | 5 (100.0%) | 5 (100.0%) |
| Total | 417 (92.0%) | 113 (24.9%) |
Disability Status by Sex by Age in West Waynesburg
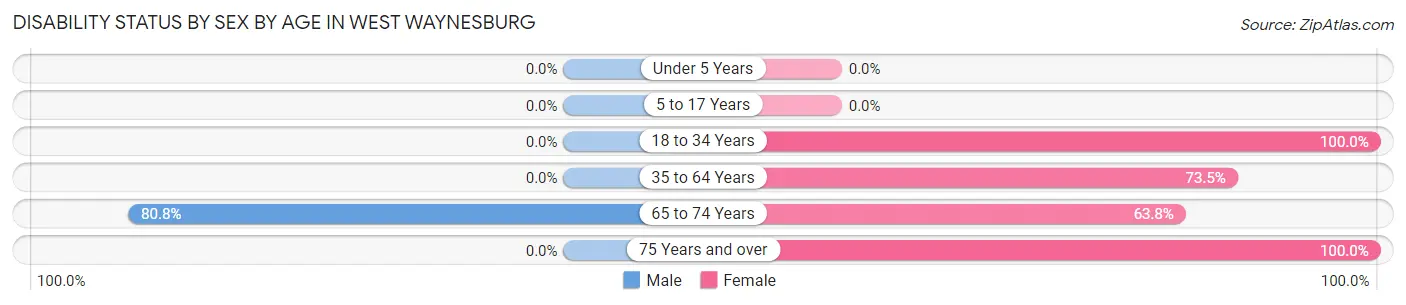
| Age Bracket | Male | Female |
| Under 5 Years | 0 (0.0%) | 0 (0.0%) |
| 5 to 17 Years | 0 (0.0%) | 0 (0.0%) |
| 18 to 34 Years | 0 (0.0%) | 25 (100.0%) |
| 35 to 64 Years | 0 (0.0%) | 36 (73.5%) |
| 65 to 74 Years | 42 (80.8%) | 30 (63.8%) |
| 75 Years and over | 0 (0.0%) | 5 (100.0%) |
Disability Class by Sex by Age in West Waynesburg
Disability Class: Hearing Difficulty
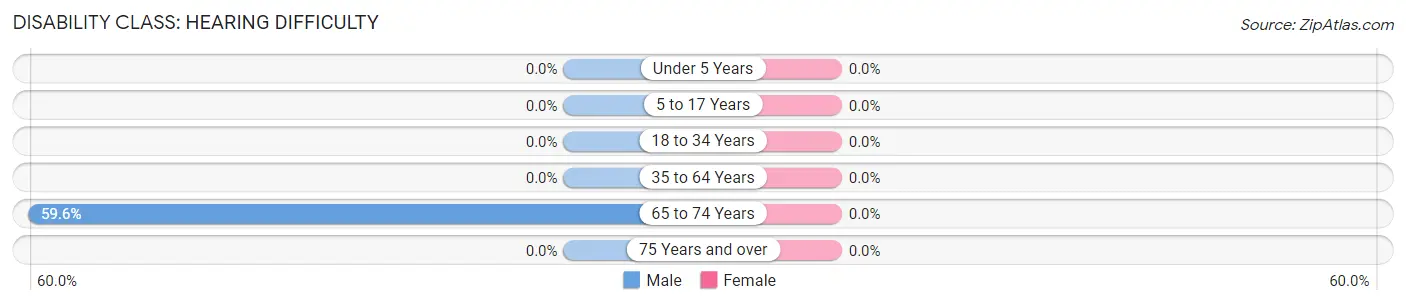
| Age Bracket | Male | Female |
| Under 5 Years | 0 (0.0%) | 0 (0.0%) |
| 5 to 17 Years | 0 (0.0%) | 0 (0.0%) |
| 18 to 34 Years | 0 (0.0%) | 0 (0.0%) |
| 35 to 64 Years | 0 (0.0%) | 0 (0.0%) |
| 65 to 74 Years | 31 (59.6%) | 0 (0.0%) |
| 75 Years and over | 0 (0.0%) | 0 (0.0%) |
Disability Class: Vision Difficulty
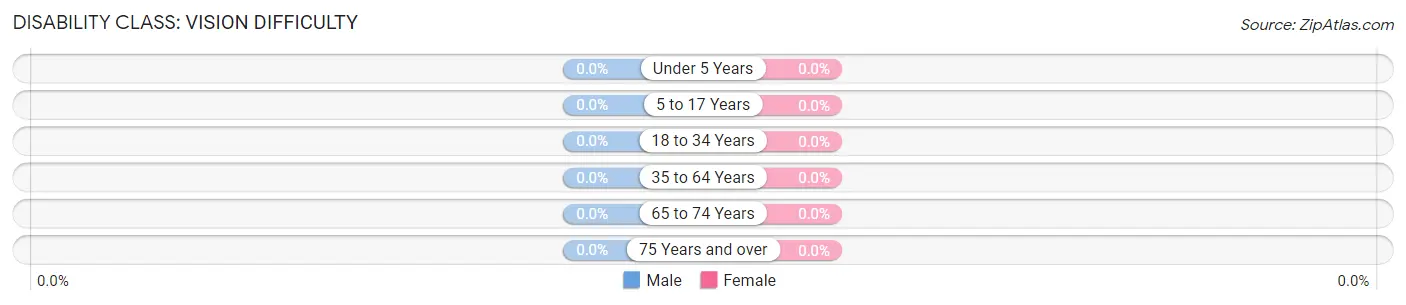
| Age Bracket | Male | Female |
| Under 5 Years | 0 (0.0%) | 0 (0.0%) |
| 5 to 17 Years | 0 (0.0%) | 0 (0.0%) |
| 18 to 34 Years | 0 (0.0%) | 0 (0.0%) |
| 35 to 64 Years | 0 (0.0%) | 0 (0.0%) |
| 65 to 74 Years | 0 (0.0%) | 0 (0.0%) |
| 75 Years and over | 0 (0.0%) | 0 (0.0%) |
Disability Class: Cognitive Difficulty
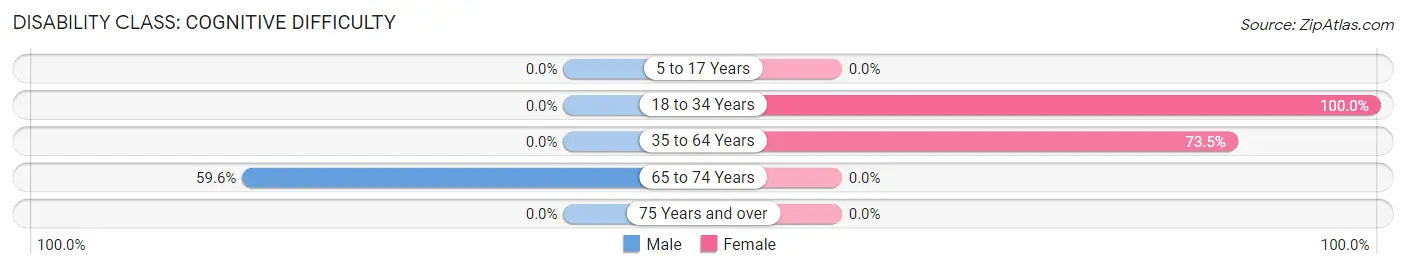
| Age Bracket | Male | Female |
| 5 to 17 Years | 0 (0.0%) | 0 (0.0%) |
| 18 to 34 Years | 0 (0.0%) | 25 (100.0%) |
| 35 to 64 Years | 0 (0.0%) | 36 (73.5%) |
| 65 to 74 Years | 31 (59.6%) | 0 (0.0%) |
| 75 Years and over | 0 (0.0%) | 0 (0.0%) |
Disability Class: Ambulatory Difficulty
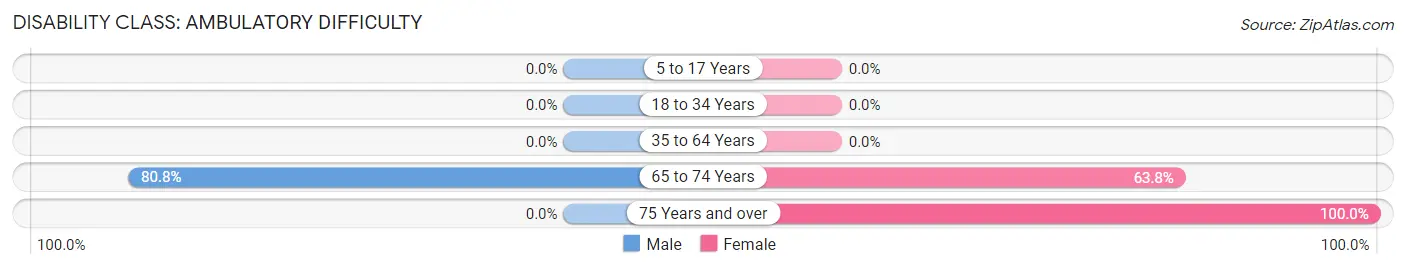
| Age Bracket | Male | Female |
| 5 to 17 Years | 0 (0.0%) | 0 (0.0%) |
| 18 to 34 Years | 0 (0.0%) | 0 (0.0%) |
| 35 to 64 Years | 0 (0.0%) | 0 (0.0%) |
| 65 to 74 Years | 42 (80.8%) | 30 (63.8%) |
| 75 Years and over | 0 (0.0%) | 5 (100.0%) |
Disability Class: Self-Care Difficulty
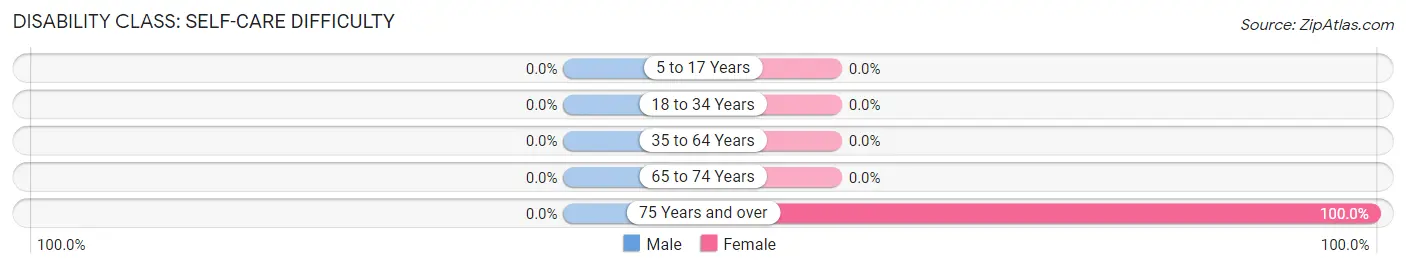
| Age Bracket | Male | Female |
| 5 to 17 Years | 0 (0.0%) | 0 (0.0%) |
| 18 to 34 Years | 0 (0.0%) | 0 (0.0%) |
| 35 to 64 Years | 0 (0.0%) | 0 (0.0%) |
| 65 to 74 Years | 0 (0.0%) | 0 (0.0%) |
| 75 Years and over | 0 (0.0%) | 5 (100.0%) |
Technology Access in West Waynesburg
Computing Device Access in West Waynesburg
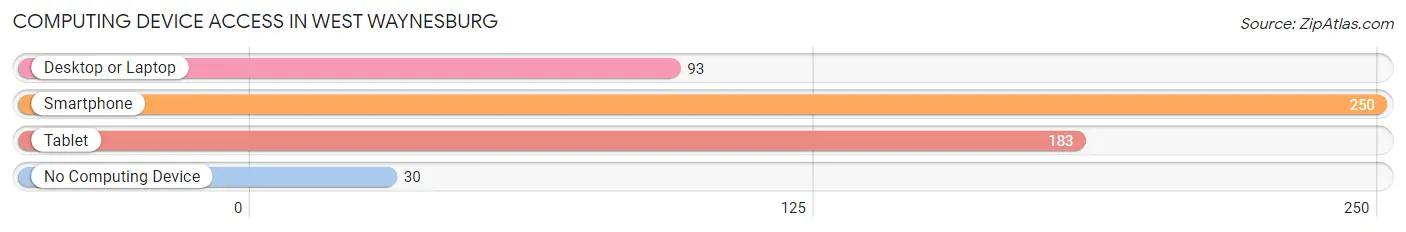
| Device Type | # Households | % Households |
| Desktop or Laptop | 93 | 30.4% |
| Smartphone | 250 | 81.7% |
| Tablet | 183 | 59.8% |
| No Computing Device | 30 | 9.8% |
| Total | 306 | 100.0% |
Internet Access in West Waynesburg
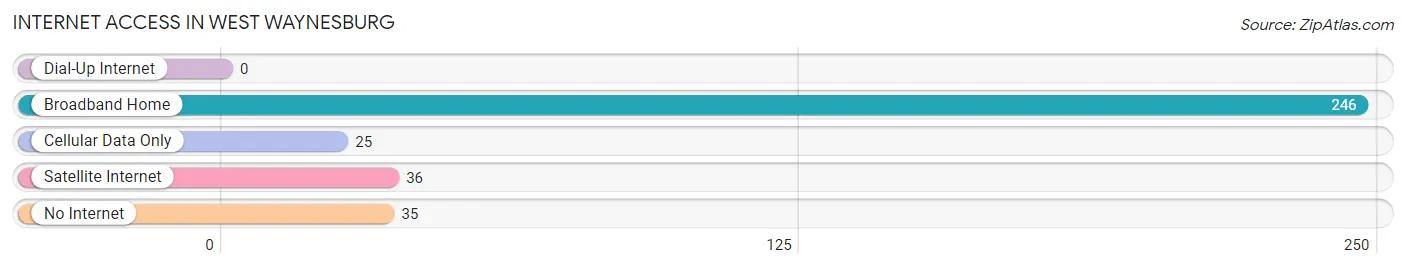
| Internet Type | # Households | % Households |
| Dial-Up Internet | 0 | 0.0% |
| Broadband Home | 246 | 80.4% |
| Cellular Data Only | 25 | 8.2% |
| Satellite Internet | 36 | 11.8% |
| No Internet | 35 | 11.4% |
| Total | 306 | 100.0% |
West Waynesburg Summary
Waynesburg is a borough located in Greene County, Pennsylvania, United States. It is situated in the southwestern corner of the state, approximately 50 miles south of Pittsburgh. The population was 4,176 at the 2010 census.
History
Waynesburg was founded in 1796 by Colonel John Hardin, a Revolutionary War veteran. The town was named after General Mad Anthony Wayne, who had served in the Revolutionary War. The town was incorporated in 1820.
In the early 19th century, Waynesburg was a major stop on the National Road, which connected the east coast to the west. The road was a major transportation route for settlers heading west.
Geography
Waynesburg is located at 39°53'45"N 80°11'45"W (39.895833, -80.195833). According to the United States Census Bureau, the borough has a total area of 1.2 square miles (3.1 km2), all of it land.
Economy
Waynesburg is home to several businesses, including a hospital, a bank, a grocery store, a pharmacy, and several restaurants. The borough is also home to Waynesburg University, a private liberal arts college.
Demographics
As of the census of 2000, there were 4,184 people, 1,619 households, and 1,039 families residing in the borough. The population density was 3,521.2 people per square mile (1,364.2/km2). There were 1,788 housing units at an average density of 1,496.2 per square mile (577.2/km2). The racial makeup of the borough was 97.90% White, 0.86% African American, 0.14% Native American, 0.48% Asian, 0.02% Pacific Islander, 0.19% from other races, and 0.41% from two or more races. Hispanic or Latino of any race were 0.48% of the population.
There were 1,619 households, out of which 28.2% had children under the age of 18 living with them, 48.2% were married couples living together, 12.2% had a female householder with no husband present, and 35.3% were non-families. 30.7% of all households were made up of individuals, and 14.2% had someone living alone who was 65 years of age or older. The average household size was 2.37 and the average family size was 2.94.
In the borough the population was spread out, with 21.7% under the age of 18, 13.2% from 18 to 24, 25.2% from 25 to 44, 22.2% from 45 to 64, and 17.7% who were 65 years of age or older. The median age was 38 years. For every 100 females, there were 87.2 males. For every 100 females age 18 and over, there were 82.7 males.
The median income for a household in the borough was $27,917, and the median income for a family was $35,938. Males had a median income of $30,000 versus $20,972 for females. The per capita income for the borough was $14,945. About 11.2% of families and 14.7% of the population were below the poverty line, including 19.2% of those under age 18 and 11.2% of those age 65 or over.
Common Questions
What is Per Capita Income in West Waynesburg?
Per Capita income in West Waynesburg is $20,546.
What is the Median Household income in West Waynesburg?
Median Household Income in West Waynesburg is $38,268.
What is Inequality or Gini Index in West Waynesburg?
Inequality or Gini Index in West Waynesburg is 0.21.
What is the Total Population of West Waynesburg?
Total Population of West Waynesburg is 453.
What is the Total Male Population of West Waynesburg?
Total Male Population of West Waynesburg is 323.
What is the Total Female Population of West Waynesburg?
Total Female Population of West Waynesburg is 130.
What is the Ratio of Males per 100 Females in West Waynesburg?
There are 248.46 Males per 100 Females in West Waynesburg.
What is the Ratio of Females per 100 Males in West Waynesburg?
There are 40.25 Females per 100 Males in West Waynesburg.
What is the Median Population Age in West Waynesburg?
Median Population Age in West Waynesburg is 30.0 Years.
What is the Average Family Size in West Waynesburg
Average Family Size in West Waynesburg is 2.6 People.
What is the Average Household Size in West Waynesburg
Average Household Size in West Waynesburg is 1.5 People.
How Large is the Labor Force in West Waynesburg?
There are 293 People in the Labor Forcein in West Waynesburg.
What is the Percentage of People in the Labor Force in West Waynesburg?
67.7% of People are in the Labor Force in West Waynesburg.