Farmington, PA Map & Demographics
Farmington Map
Farmington Overview
$8,384
PER CAPITA INCOME
$73,981
AVG HOUSEHOLD INCOME
0.40
INEQUALITY / GINI INDEX
971
TOTAL POPULATION
444
MALE POPULATION
527
FEMALE POPULATION
84.25
MALES / 100 FEMALES
118.69
FEMALES / 100 MALES
32.4
MEDIAN AGE
2.9
AVG FAMILY SIZE
2.2
AVG HOUSEHOLD SIZE
106
LABOR FORCE [ PEOPLE ]
14.5%
PERCENT IN LABOR FORCE
5.7%
UNEMPLOYMENT RATE
Farmington Zip Codes
Farmington Area Codes
Income in Farmington
Income Overview in Farmington
| Characteristic | Number | Measure |
| Per Capita Income | 971 | $8,384 |
| Median Family Income | 41 | $0 |
| Mean Family Income | 41 | $93,839 |
| Median Household Income | 68 | $73,981 |
| Mean Household Income | 68 | $86,271 |
| Income Deficit | 41 | $0 |
| Wage / Income Gap (%) | 971 | 0.00% |
| Wage / Income Gap ($) | 971 | 100.00¢ per $1 |
| Gini / Inequality Index | 971 | 0.40 |
Earnings by Sex in Farmington
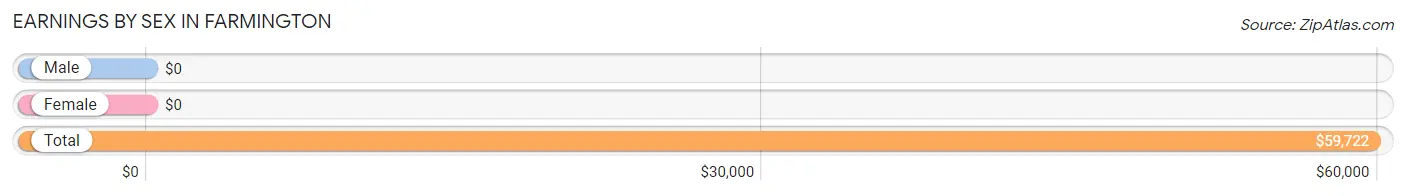
| Sex | Number | Average Earnings |
| Male | 51 (51.0%) | $0 |
| Female | 49 (49.0%) | $0 |
| Total | 100 (100.0%) | $59,722 |
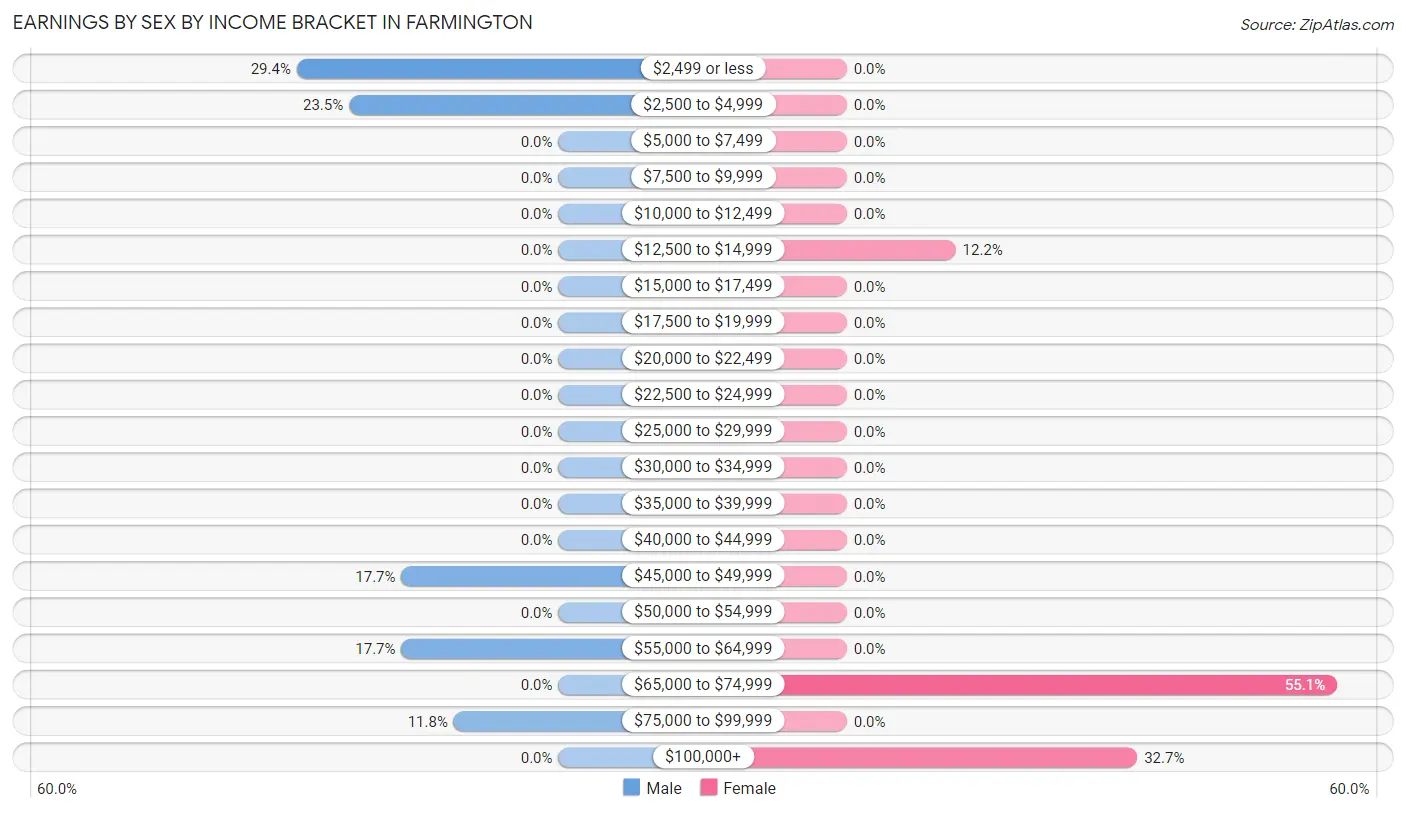
Earnings by Sex by Income Bracket in Farmington
The most common earnings brackets in Farmington are $2,499 or less for men (15 | 29.4%) and $65,000 to $74,999 for women (27 | 55.1%).
| Income | Male | Female |
| $2,499 or less | 15 (29.4%) | 0 (0.0%) |
| $2,500 to $4,999 | 12 (23.5%) | 0 (0.0%) |
| $5,000 to $7,499 | 0 (0.0%) | 0 (0.0%) |
| $7,500 to $9,999 | 0 (0.0%) | 0 (0.0%) |
| $10,000 to $12,499 | 0 (0.0%) | 0 (0.0%) |
| $12,500 to $14,999 | 0 (0.0%) | 6 (12.2%) |
| $15,000 to $17,499 | 0 (0.0%) | 0 (0.0%) |
| $17,500 to $19,999 | 0 (0.0%) | 0 (0.0%) |
| $20,000 to $22,499 | 0 (0.0%) | 0 (0.0%) |
| $22,500 to $24,999 | 0 (0.0%) | 0 (0.0%) |
| $25,000 to $29,999 | 0 (0.0%) | 0 (0.0%) |
| $30,000 to $34,999 | 0 (0.0%) | 0 (0.0%) |
| $35,000 to $39,999 | 0 (0.0%) | 0 (0.0%) |
| $40,000 to $44,999 | 0 (0.0%) | 0 (0.0%) |
| $45,000 to $49,999 | 9 (17.6%) | 0 (0.0%) |
| $50,000 to $54,999 | 0 (0.0%) | 0 (0.0%) |
| $55,000 to $64,999 | 9 (17.6%) | 0 (0.0%) |
| $65,000 to $74,999 | 0 (0.0%) | 27 (55.1%) |
| $75,000 to $99,999 | 6 (11.8%) | 0 (0.0%) |
| $100,000+ | 0 (0.0%) | 16 (32.7%) |
| Total | 51 (100.0%) | 49 (100.0%) |
Earnings by Sex by Educational Attainment in Farmington
| Educational Attainment | Male Income | Female Income |
| Less than High School | - | - |
| High School Diploma | - | - |
| College or Associate's Degree | - | - |
| Bachelor's Degree | - | - |
| Graduate Degree | - | - |
| Total | - | - |
Family Income in Farmington
Family Income Brackets in Farmington
According to the Farmington family income data, there are 18 families falling into the $10,000 to $14,999 income range, which is the most common income bracket and makes up 43.9% of all families.
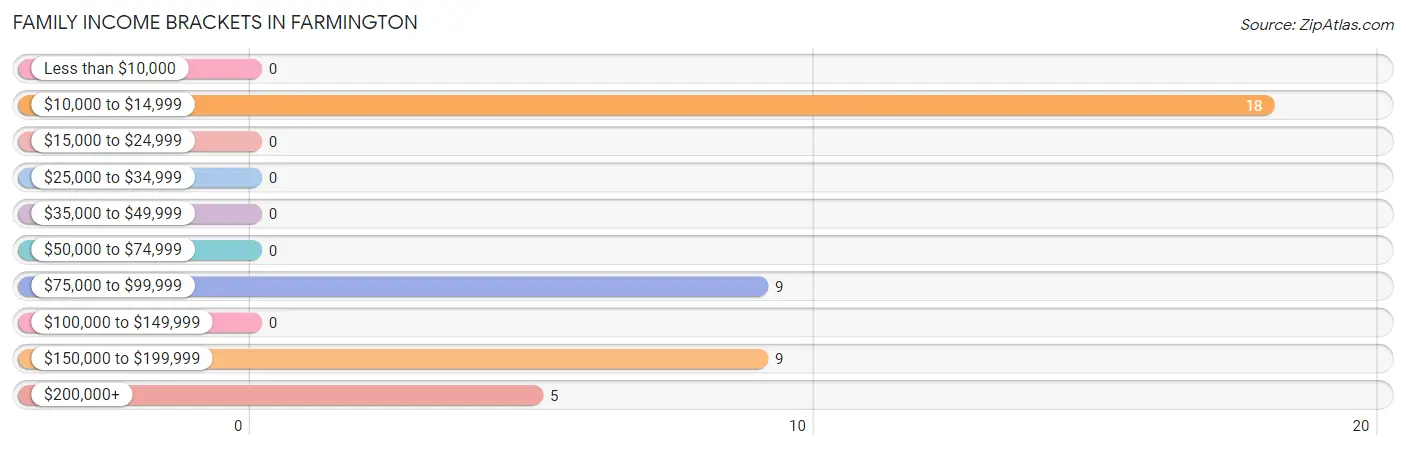
| Income Bracket | # Families | % Families |
| Less than $10,000 | 0 | 0.0% |
| $10,000 to $14,999 | 18 | 43.9% |
| $15,000 to $24,999 | 0 | 0.0% |
| $25,000 to $34,999 | 0 | 0.0% |
| $35,000 to $49,999 | 0 | 0.0% |
| $50,000 to $74,999 | 0 | 0.0% |
| $75,000 to $99,999 | 9 | 22.0% |
| $100,000 to $149,999 | 0 | 0.0% |
| $150,000 to $199,999 | 9 | 22.0% |
| $200,000+ | 5 | 12.2% |
Family Income by Famaliy Size in Farmington
| Income Bracket | # Families | Median Income |
| 2-Person Families | 27 (65.8%) | $0 |
| 3-Person Families | 5 (12.2%) | $0 |
| 4-Person Families | 0 (0.0%) | $0 |
| 5-Person Families | 9 (22.0%) | $0 |
| 6-Person Families | 0 (0.0%) | $0 |
| 7+ Person Families | 0 (0.0%) | $0 |
| Total | 41 (100.0%) | $0 |
Family Income by Number of Earners in Farmington
| Number of Earners | # Families | Median Income |
| No Earners | 9 (22.0%) | $0 |
| 1 Earner | 18 (43.9%) | $0 |
| 2 Earners | 14 (34.2%) | $0 |
| 3+ Earners | 0 (0.0%) | $0 |
| Total | 41 (100.0%) | $0 |
Household Income in Farmington
Household Income Brackets in Farmington
With 27 households falling in the category, the $50,000 to $74,999 income range is the most frequent in Farmington, accounting for 39.7% of all households.
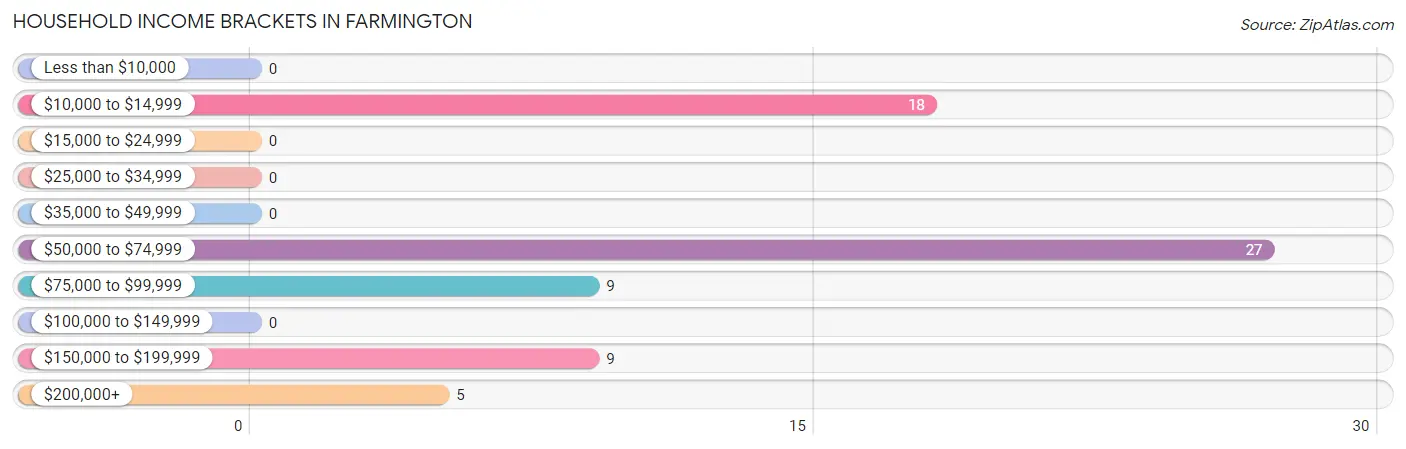
| Income Bracket | # Households | % Households |
| Less than $10,000 | 0 | 0.0% |
| $10,000 to $14,999 | 18 | 26.5% |
| $15,000 to $24,999 | 0 | 0.0% |
| $25,000 to $34,999 | 0 | 0.0% |
| $35,000 to $49,999 | 0 | 0.0% |
| $50,000 to $74,999 | 27 | 39.7% |
| $75,000 to $99,999 | 9 | 13.2% |
| $100,000 to $149,999 | 0 | 0.0% |
| $150,000 to $199,999 | 9 | 13.2% |
| $200,000+ | 5 | 7.4% |
Household Income by Householder Age in Farmington
The median household income in Farmington is $73,981, with the highest median household income of $183,611 found in the 45 to 64 years age bracket for the primary householder. A total of 20 households (29.4%) fall into this category. Meanwhile, the 15 to 24 years age bracket for the primary householder has the lowest median household income of $0, with 27 households (39.7%) in this group.
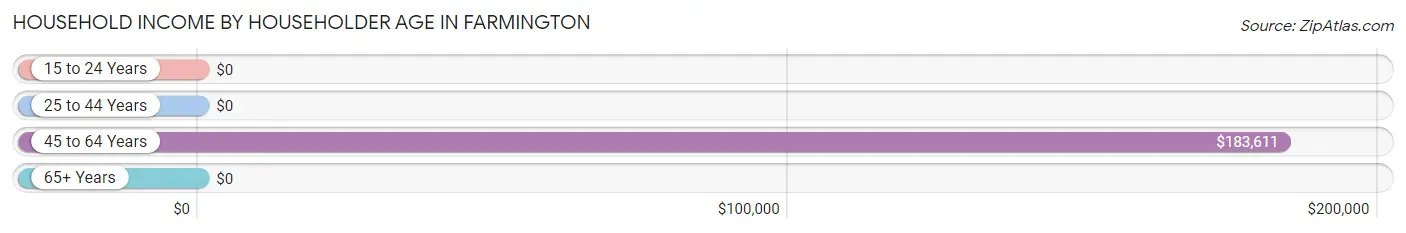
| Income Bracket | # Households | Median Income |
| 15 to 24 Years | 27 (39.7%) | $0 |
| 25 to 44 Years | 0 (0.0%) | $0 |
| 45 to 64 Years | 20 (29.4%) | $183,611 |
| 65+ Years | 21 (30.9%) | $0 |
| Total | 68 (100.0%) | $73,981 |
Poverty in Farmington
Income Below Poverty by Sex and Age in Farmington
With 86.9% poverty level for males and 80.7% for females among the residents of Farmington, 18 to 24 year old males and 25 to 34 year old females are the most vulnerable to poverty, with 54 males (100.0%) and 56 females (100.0%) in their respective age groups living below the poverty level.
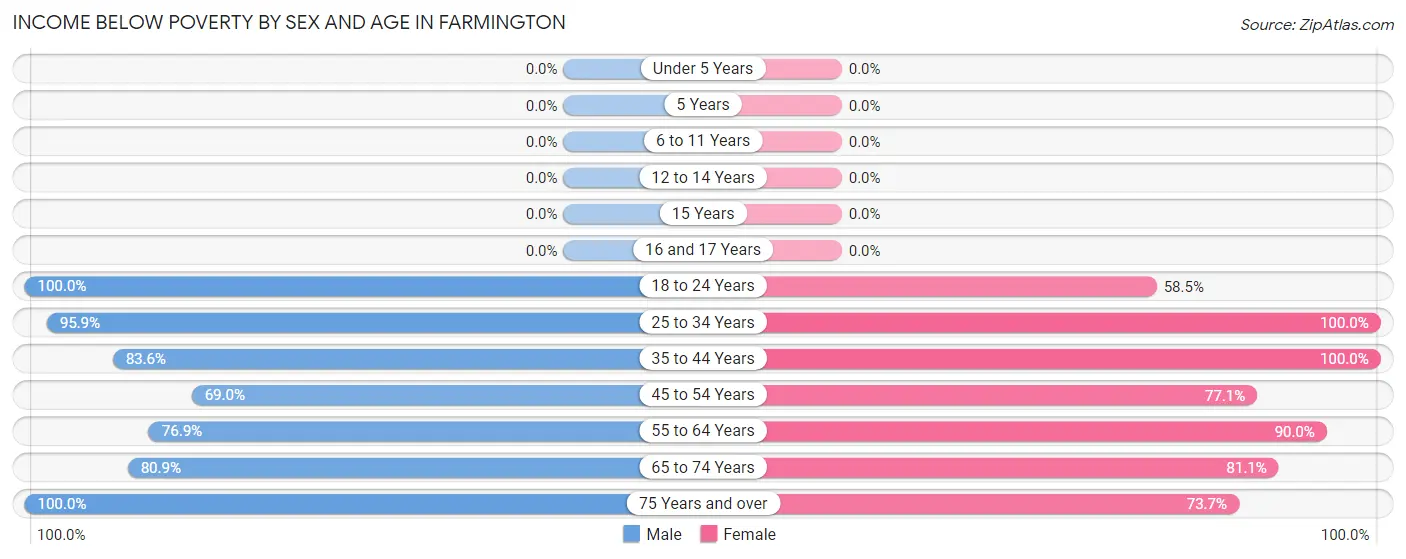
| Age Bracket | Male | Female |
| Under 5 Years | 0 (0.0%) | 0 (0.0%) |
| 5 Years | 0 (0.0%) | 0 (0.0%) |
| 6 to 11 Years | 0 (0.0%) | 0 (0.0%) |
| 12 to 14 Years | 0 (0.0%) | 0 (0.0%) |
| 15 Years | 0 (0.0%) | 0 (0.0%) |
| 16 and 17 Years | 0 (0.0%) | 0 (0.0%) |
| 18 to 24 Years | 54 (100.0%) | 38 (58.5%) |
| 25 to 34 Years | 116 (95.9%) | 56 (100.0%) |
| 35 to 44 Years | 46 (83.6%) | 67 (100.0%) |
| 45 to 54 Years | 20 (69.0%) | 37 (77.1%) |
| 55 to 64 Years | 20 (76.9%) | 45 (90.0%) |
| 65 to 74 Years | 38 (80.8%) | 30 (81.1%) |
| 75 Years and over | 24 (100.0%) | 28 (73.7%) |
| Total | 318 (86.9%) | 301 (80.7%) |
Income Above Poverty by Sex and Age in Farmington
According to the poverty statistics in Farmington, males aged 12 to 14 years and females aged 16 and 17 years are the age groups that are most secure financially, with 100.0% of males and 100.0% of females in these age groups living above the poverty line.
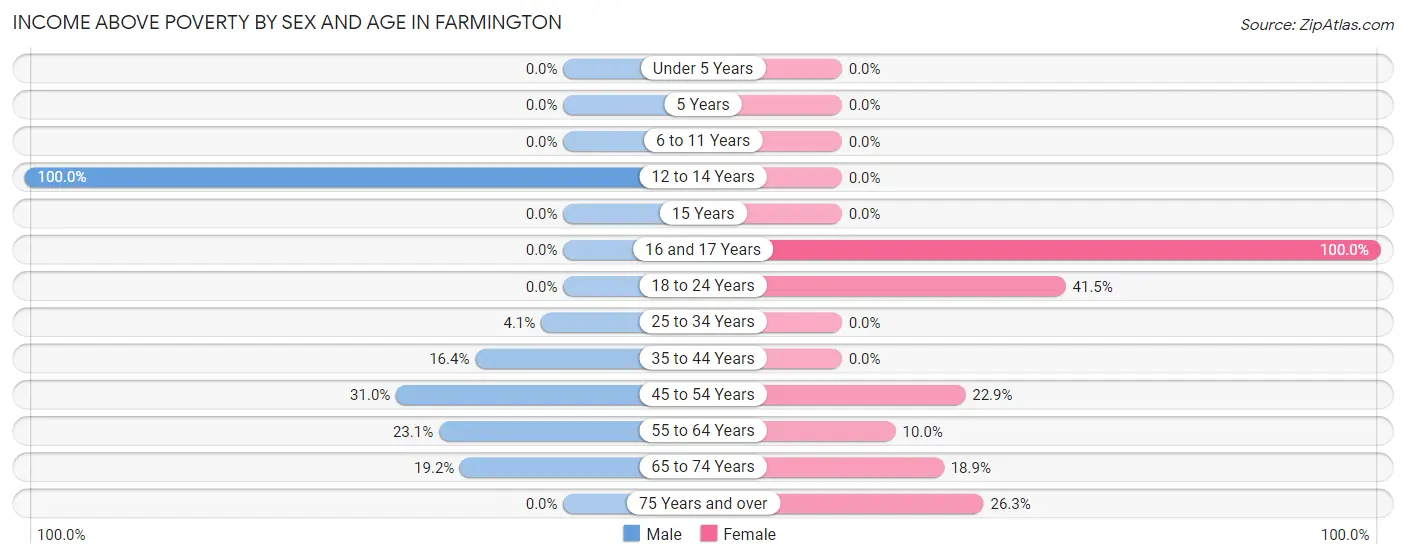
| Age Bracket | Male | Female |
| Under 5 Years | 0 (0.0%) | 0 (0.0%) |
| 5 Years | 0 (0.0%) | 0 (0.0%) |
| 6 to 11 Years | 0 (0.0%) | 0 (0.0%) |
| 12 to 14 Years | 10 (100.0%) | 0 (0.0%) |
| 15 Years | 0 (0.0%) | 0 (0.0%) |
| 16 and 17 Years | 0 (0.0%) | 12 (100.0%) |
| 18 to 24 Years | 0 (0.0%) | 27 (41.5%) |
| 25 to 34 Years | 5 (4.1%) | 0 (0.0%) |
| 35 to 44 Years | 9 (16.4%) | 0 (0.0%) |
| 45 to 54 Years | 9 (31.0%) | 11 (22.9%) |
| 55 to 64 Years | 6 (23.1%) | 5 (10.0%) |
| 65 to 74 Years | 9 (19.2%) | 7 (18.9%) |
| 75 Years and over | 0 (0.0%) | 10 (26.3%) |
| Total | 48 (13.1%) | 72 (19.3%) |
Income Below Poverty Among Married-Couple Families in Farmington
The poverty statistics for married-couple families in Farmington show that 34.3% or 12 of the total 35 families live below the poverty line. Families with no children have the highest poverty rate of 46.2%, comprising of 12 families. On the other hand, families with 1 or 2 children have the lowest poverty rate of 0.0%, which includes 0 families.
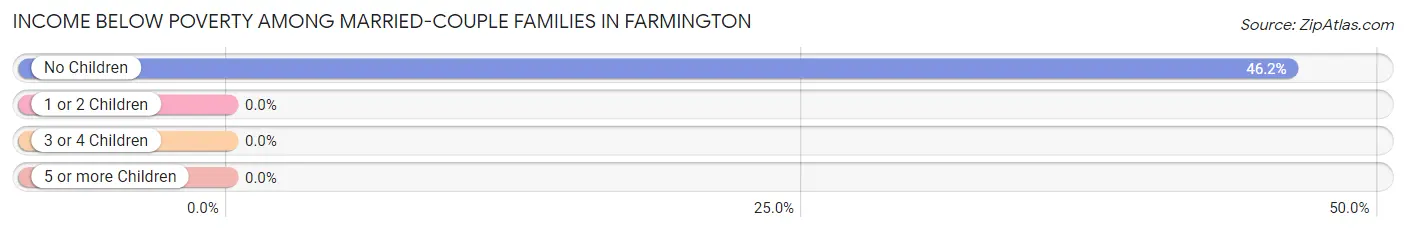
| Children | Above Poverty | Below Poverty |
| No Children | 14 (53.8%) | 12 (46.2%) |
| 1 or 2 Children | 9 (100.0%) | 0 (0.0%) |
| 3 or 4 Children | 0 (0.0%) | 0 (0.0%) |
| 5 or more Children | 0 (0.0%) | 0 (0.0%) |
| Total | 23 (65.7%) | 12 (34.3%) |
Income Below Poverty Among Single-Parent Households in Farmington
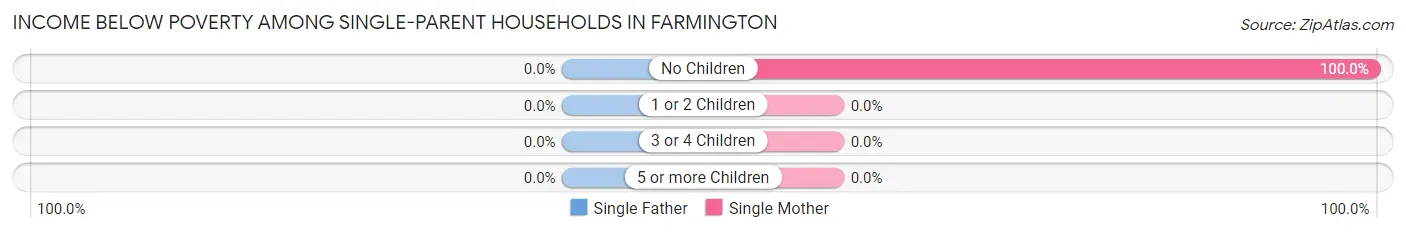
| Children | Single Father | Single Mother |
| No Children | 0 (0.0%) | 6 (100.0%) |
| 1 or 2 Children | 0 (0.0%) | 0 (0.0%) |
| 3 or 4 Children | 0 (0.0%) | 0 (0.0%) |
| 5 or more Children | 0 (0.0%) | 0 (0.0%) |
| Total | 0 (0.0%) | 6 (100.0%) |
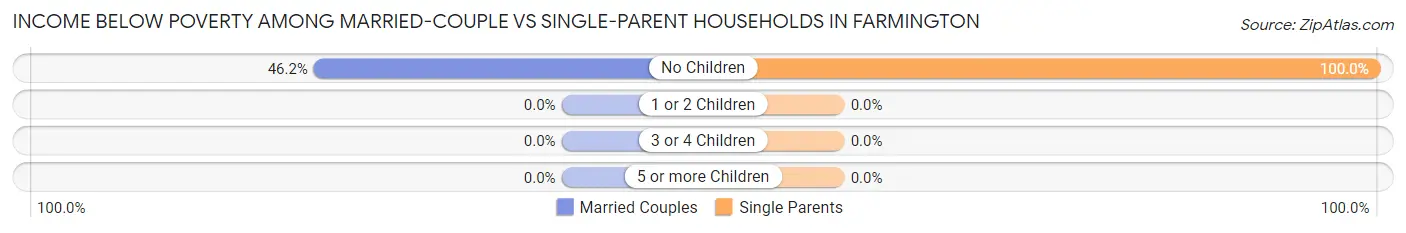
Income Below Poverty Among Married-Couple vs Single-Parent Households in Farmington
The poverty data for Farmington shows that 12 of the married-couple family households (34.3%) and 6 of the single-parent households (100.0%) are living below the poverty level. Within the married-couple family households, those with no children have the highest poverty rate, with 12 households (46.2%) falling below the poverty line. Among the single-parent households, those with no children have the highest poverty rate, with 6 household (100.0%) living below poverty.
| Children | Married-Couple Families | Single-Parent Households |
| No Children | 12 (46.2%) | 6 (100.0%) |
| 1 or 2 Children | 0 (0.0%) | 0 (0.0%) |
| 3 or 4 Children | 0 (0.0%) | 0 (0.0%) |
| 5 or more Children | 0 (0.0%) | 0 (0.0%) |
| Total | 12 (34.3%) | 6 (100.0%) |
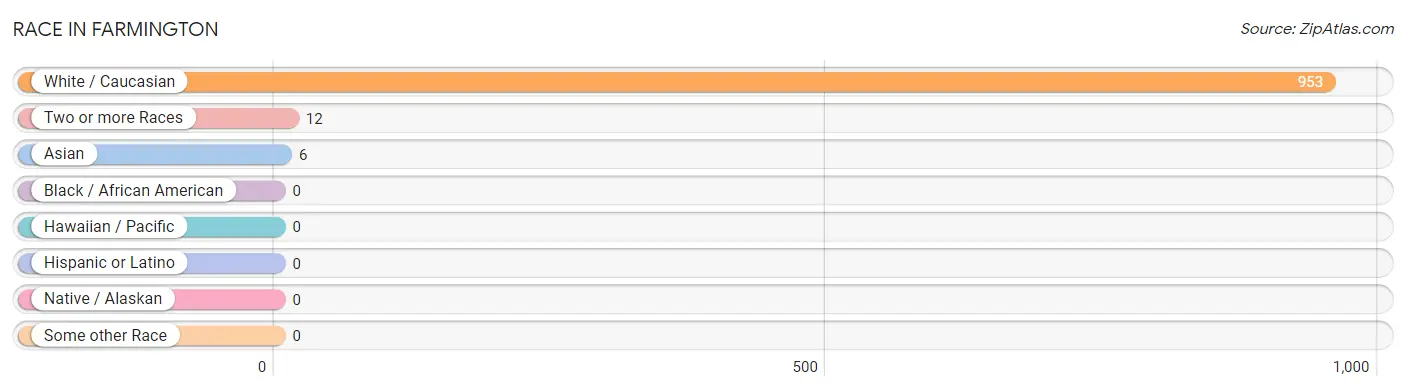
Race in Farmington
The most populous races in Farmington are White / Caucasian (953 | 98.2%), Two or more Races (12 | 1.2%), and Asian (6 | 0.6%).
| Race | # Population | % Population |
| Asian | 6 | 0.6% |
| Black / African American | 0 | 0.0% |
| Hawaiian / Pacific | 0 | 0.0% |
| Hispanic or Latino | 0 | 0.0% |
| Native / Alaskan | 0 | 0.0% |
| White / Caucasian | 953 | 98.2% |
| Two or more Races | 12 | 1.2% |
| Some other Race | 0 | 0.0% |
| Total | 971 | 100.0% |
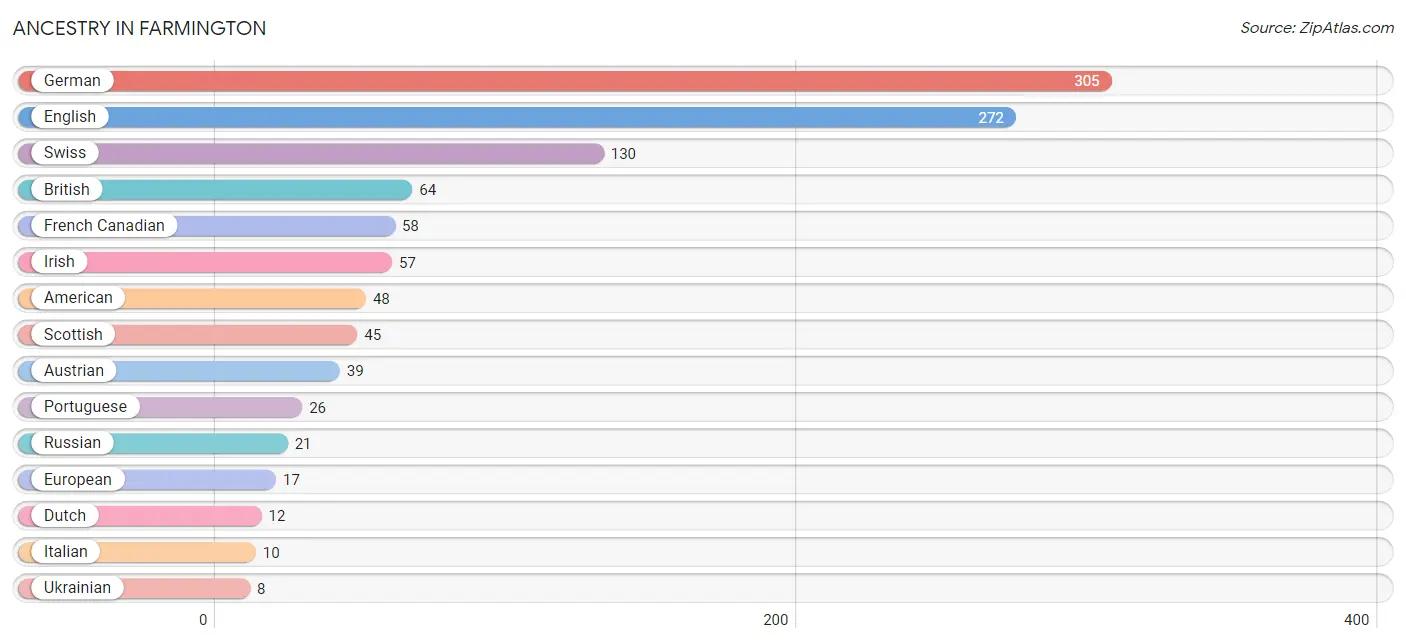
Ancestry in Farmington
The most populous ancestries reported in Farmington are German (305 | 31.4%), English (272 | 28.0%), Swiss (130 | 13.4%), British (64 | 6.6%), and French Canadian (58 | 6.0%), together accounting for 85.4% of all Farmington residents.
| Ancestry | # Population | % Population |
| American | 48 | 4.9% |
| Austrian | 39 | 4.0% |
| British | 64 | 6.6% |
| Burmese | 6 | 0.6% |
| Dutch | 12 | 1.2% |
| English | 272 | 28.0% |
| European | 17 | 1.8% |
| French Canadian | 58 | 6.0% |
| German | 305 | 31.4% |
| Irish | 57 | 5.9% |
| Italian | 10 | 1.0% |
| Portuguese | 26 | 2.7% |
| Russian | 21 | 2.2% |
| Scottish | 45 | 4.6% |
| Swiss | 130 | 13.4% |
| Ukrainian | 8 | 0.8% | View All 16 Rows |
Immigrants in Farmington
The most numerous immigrant groups reported in Farmington came from Europe (68 | 7.0%), Northern Europe (68 | 7.0%), Latin America (24 | 2.5%), South America (24 | 2.5%), and Asia (6 | 0.6%), together accounting for 19.6% of all Farmington residents.
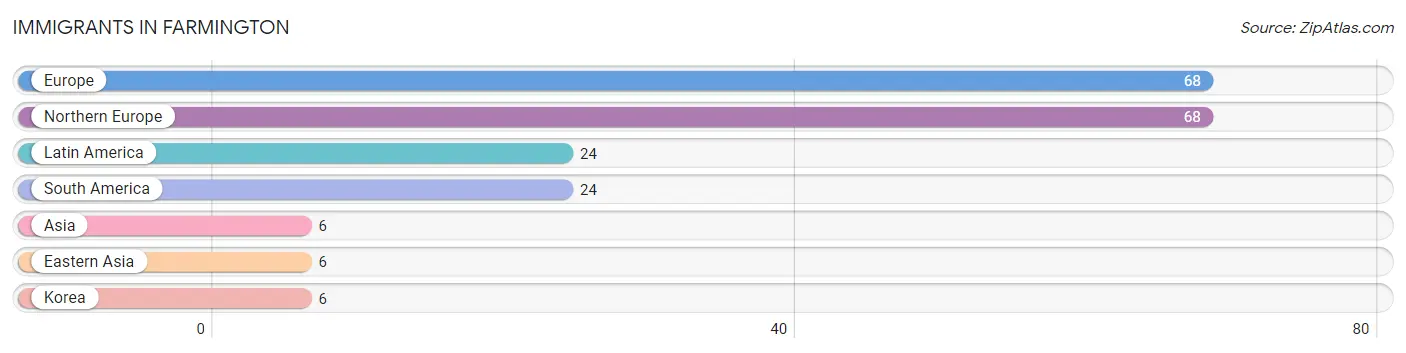
| Immigration Origin | # Population | % Population |
| Asia | 6 | 0.6% |
| Eastern Asia | 6 | 0.6% |
| Europe | 68 | 7.0% |
| Korea | 6 | 0.6% |
| Latin America | 24 | 2.5% |
| Northern Europe | 68 | 7.0% |
| South America | 24 | 2.5% | View All 7 Rows |
Sex and Age in Farmington
Sex and Age in Farmington
The most populous age groups in Farmington are 30 to 34 Years (65 | 14.6%) for men and 5 to 9 Years (71 | 13.5%) for women.
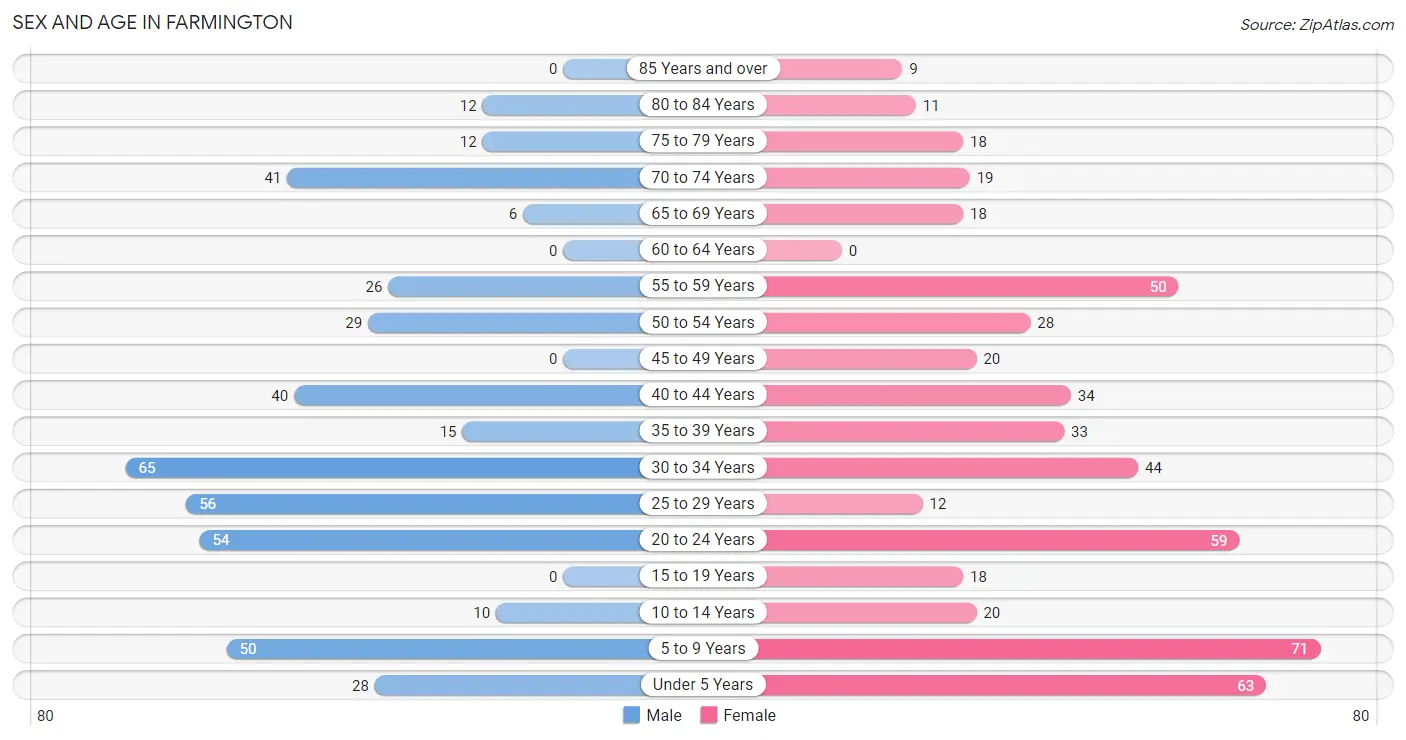
| Age Bracket | Male | Female |
| Under 5 Years | 28 (6.3%) | 63 (11.9%) |
| 5 to 9 Years | 50 (11.3%) | 71 (13.5%) |
| 10 to 14 Years | 10 (2.2%) | 20 (3.8%) |
| 15 to 19 Years | 0 (0.0%) | 18 (3.4%) |
| 20 to 24 Years | 54 (12.2%) | 59 (11.2%) |
| 25 to 29 Years | 56 (12.6%) | 12 (2.3%) |
| 30 to 34 Years | 65 (14.6%) | 44 (8.4%) |
| 35 to 39 Years | 15 (3.4%) | 33 (6.3%) |
| 40 to 44 Years | 40 (9.0%) | 34 (6.5%) |
| 45 to 49 Years | 0 (0.0%) | 20 (3.8%) |
| 50 to 54 Years | 29 (6.5%) | 28 (5.3%) |
| 55 to 59 Years | 26 (5.9%) | 50 (9.5%) |
| 60 to 64 Years | 0 (0.0%) | 0 (0.0%) |
| 65 to 69 Years | 6 (1.3%) | 18 (3.4%) |
| 70 to 74 Years | 41 (9.2%) | 19 (3.6%) |
| 75 to 79 Years | 12 (2.7%) | 18 (3.4%) |
| 80 to 84 Years | 12 (2.7%) | 11 (2.1%) |
| 85 Years and over | 0 (0.0%) | 9 (1.7%) |
| Total | 444 (100.0%) | 527 (100.0%) |
Families and Households in Farmington
Median Family Size in Farmington
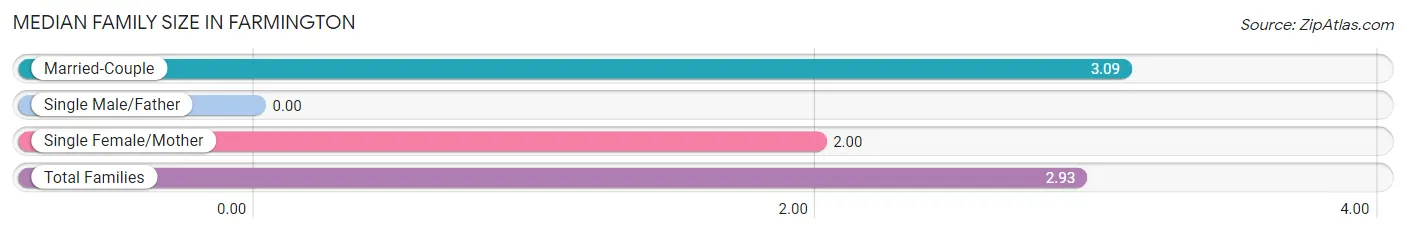
| Family Type | # Families | Family Size |
| Married-Couple | 35 (85.4%) | 3.09 |
| Single Male/Father | 0 (0.0%) | - |
| Single Female/Mother | 6 (14.6%) | 2.00 |
| Total Families | 41 (100.0%) | 2.93 |
Median Household Size in Farmington
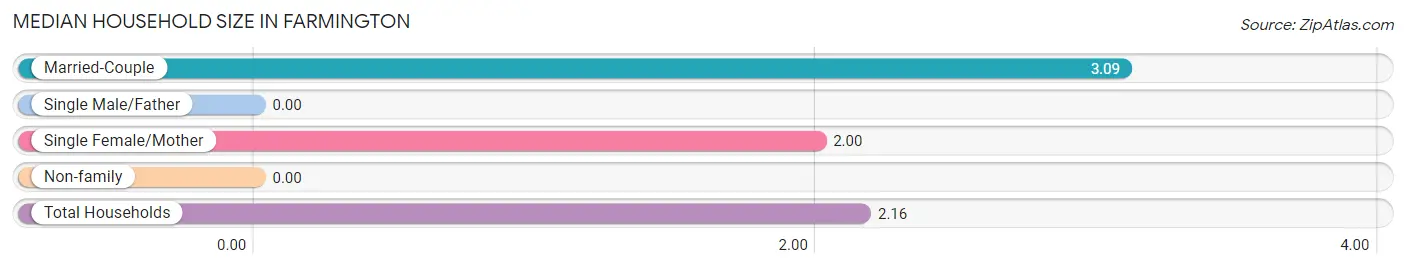
| Household Type | # Households | Household Size |
| Married-Couple | 35 (51.5%) | 3.09 |
| Single Male/Father | 0 (0.0%) | - |
| Single Female/Mother | 6 (8.8%) | 2.00 |
| Non-family | 27 (39.7%) | - |
| Total Households | 68 (100.0%) | 2.16 |
Household Size by Marriage Status in Farmington
Out of a total of 68 households in Farmington, 41 (60.3%) are family households, while 27 (39.7%) are nonfamily households. The most numerous type of family households are 2-person households, comprising 27, and the most common type of nonfamily households are 1-person households, comprising 27.
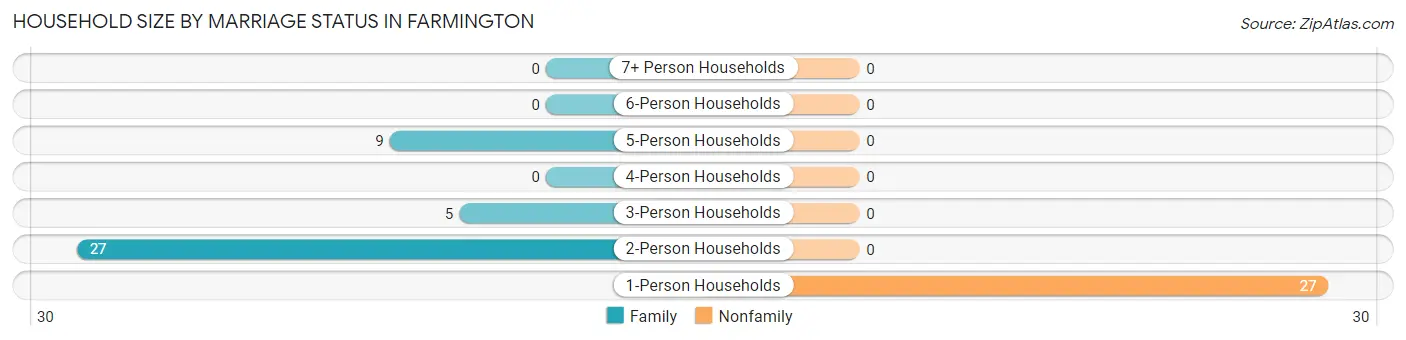
| Household Size | Family Households | Nonfamily Households |
| 1-Person Households | - | 27 (39.7%) |
| 2-Person Households | 27 (39.7%) | 0 (0.0%) |
| 3-Person Households | 5 (7.3%) | 0 (0.0%) |
| 4-Person Households | 0 (0.0%) | 0 (0.0%) |
| 5-Person Households | 9 (13.2%) | 0 (0.0%) |
| 6-Person Households | 0 (0.0%) | 0 (0.0%) |
| 7+ Person Households | 0 (0.0%) | 0 (0.0%) |
| Total | 41 (60.3%) | 27 (39.7%) |
Female Fertility in Farmington
Fertility by Age in Farmington
Average fertility rate in Farmington is 95.0 births per 1,000 women. Women in the age bracket of 35 to 50 years have the highest fertility rate with 121.0 births per 1,000 women. Women in the age bracket of 35 to 50 years acount for 54.5% of all women with births.
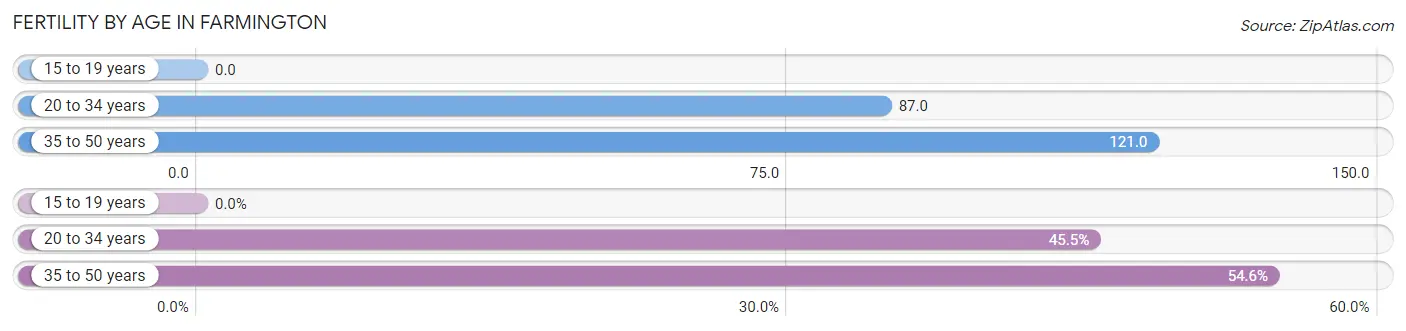
| Age Bracket | Women with Births | Births / 1,000 Women |
| 15 to 19 years | 0 (0.0%) | 0.0 |
| 20 to 34 years | 10 (45.5%) | 87.0 |
| 35 to 50 years | 12 (54.5%) | 121.0 |
| Total | 22 (100.0%) | 95.0 |
Fertility by Age by Marriage Status in Farmington
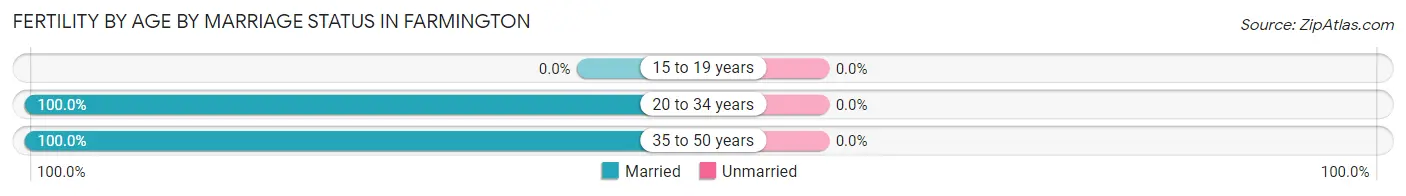
| Age Bracket | Married | Unmarried |
| 15 to 19 years | 0 (0.0%) | 0 (0.0%) |
| 20 to 34 years | 10 (100.0%) | 0 (0.0%) |
| 35 to 50 years | 12 (100.0%) | 0 (0.0%) |
| Total | 22 (100.0%) | 0 (0.0%) |
Fertility by Education in Farmington
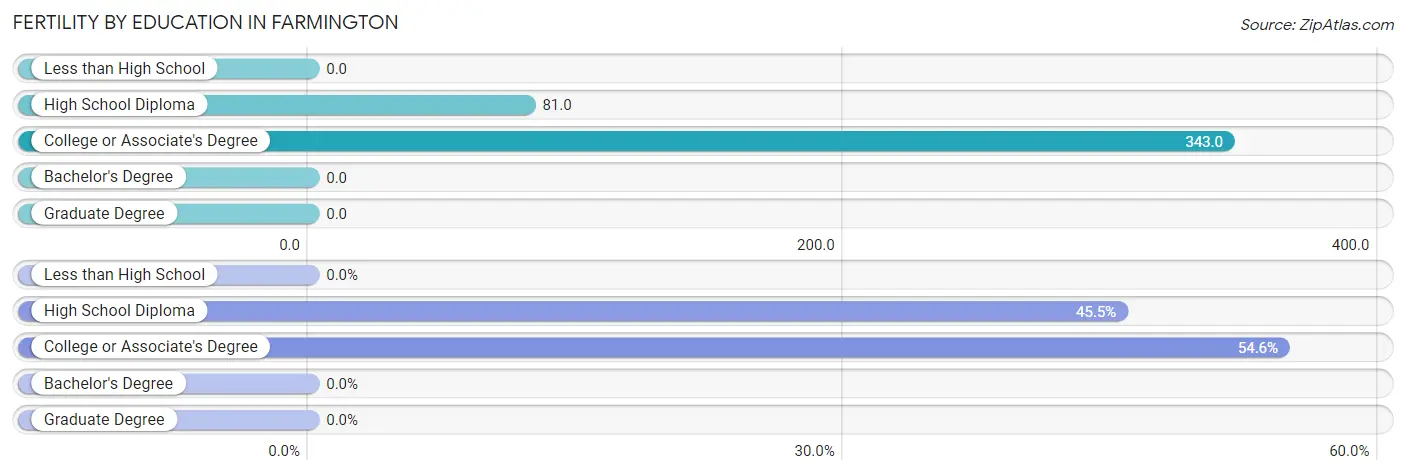
| Educational Attainment | Women with Births | Births / 1,000 Women |
| Less than High School | 0 (0.0%) | 0.0 |
| High School Diploma | 10 (45.5%) | 81.0 |
| College or Associate's Degree | 12 (54.5%) | 343.0 |
| Bachelor's Degree | 0 (0.0%) | 0.0 |
| Graduate Degree | 0 (0.0%) | 0.0 |
| Total | 22 (100.0%) | 95.0 |
Fertility by Education by Marriage Status in Farmington
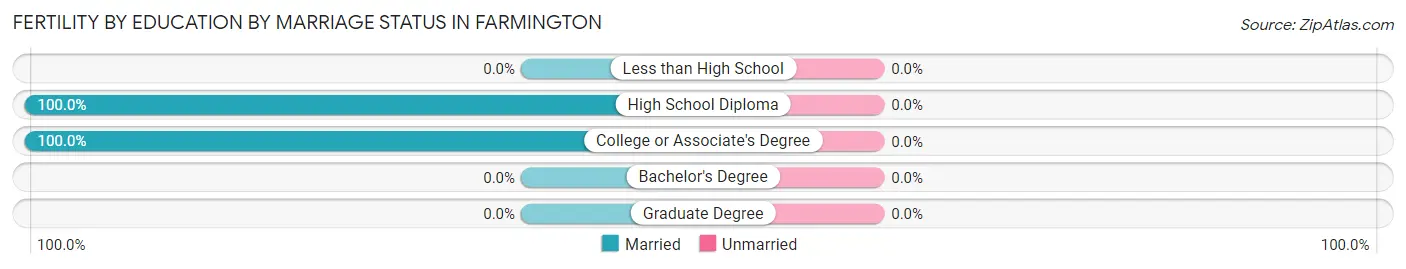
| Educational Attainment | Married | Unmarried |
| Less than High School | 0 (0.0%) | 0 (0.0%) |
| High School Diploma | 10 (100.0%) | 0 (0.0%) |
| College or Associate's Degree | 12 (100.0%) | 0 (0.0%) |
| Bachelor's Degree | 0 (0.0%) | 0 (0.0%) |
| Graduate Degree | 0 (0.0%) | 0 (0.0%) |
| Total | 22 (100.0%) | 0 (0.0%) |
Employment Characteristics in Farmington
Employment by Class of Employer in Farmington
Among the 91 employed individuals in Farmington, private company employees (73 | 80.2%), and self-employed (not incorporated) (18 | 19.8%) make up the most common classes of employment.
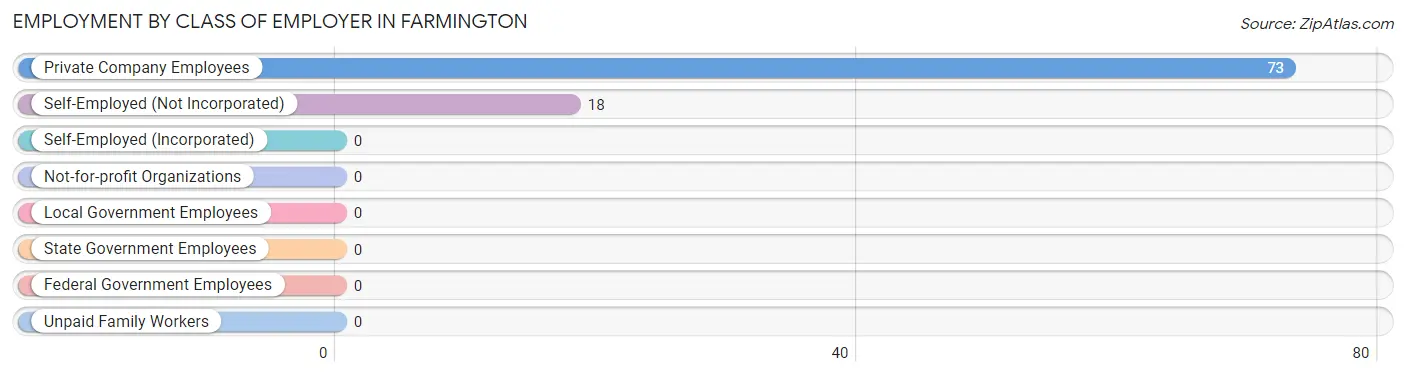
| Employer Class | # Employees | % Employees |
| Private Company Employees | 73 | 80.2% |
| Self-Employed (Incorporated) | 0 | 0.0% |
| Self-Employed (Not Incorporated) | 18 | 19.8% |
| Not-for-profit Organizations | 0 | 0.0% |
| Local Government Employees | 0 | 0.0% |
| State Government Employees | 0 | 0.0% |
| Federal Government Employees | 0 | 0.0% |
| Unpaid Family Workers | 0 | 0.0% |
| Total | 91 | 100.0% |
Employment Status by Age in Farmington
According to the labor force statistics for Farmington, out of the total population over 16 years of age (729), 14.5% or 106 individuals are in the labor force, with 5.7% or 6 of them unemployed. The age group with the highest labor force participation rate is 55 to 59 years, with 38.2% or 29 individuals in the labor force. Within the labor force, the 16 to 19 years age range has the highest percentage of unemployed individuals, with 100.0% or 6 of them being unemployed.
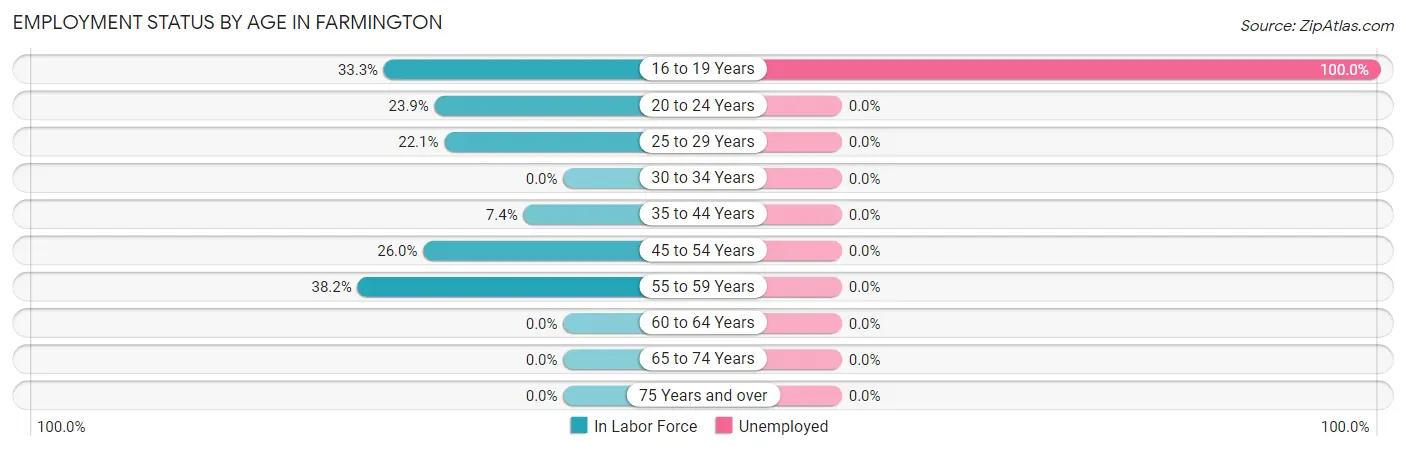
| Age Bracket | In Labor Force | Unemployed |
| 16 to 19 Years | 6 (33.3%) | 6 (100.0%) |
| 20 to 24 Years | 27 (23.9%) | 0 (0.0%) |
| 25 to 29 Years | 15 (22.1%) | 0 (0.0%) |
| 30 to 34 Years | 0 (0.0%) | 0 (0.0%) |
| 35 to 44 Years | 9 (7.4%) | 0 (0.0%) |
| 45 to 54 Years | 20 (26.0%) | 0 (0.0%) |
| 55 to 59 Years | 29 (38.2%) | 0 (0.0%) |
| 60 to 64 Years | 0 (0.0%) | 0 (0.0%) |
| 65 to 74 Years | 0 (0.0%) | 0 (0.0%) |
| 75 Years and over | 0 (0.0%) | 0 (0.0%) |
| Total | 106 (14.5%) | 6 (5.7%) |
Employment Status by Educational Attainment in Farmington
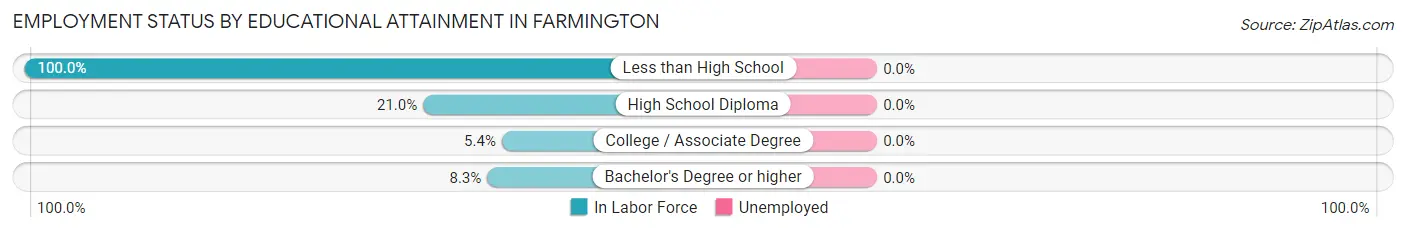
| Educational Attainment | In Labor Force | Unemployed |
| Less than High School | 12 (100.0%) | 0 (0.0%) |
| High School Diploma | 45 (21.0%) | 0 (0.0%) |
| College / Associate Degree | 5 (5.4%) | 0 (0.0%) |
| Bachelor's Degree or higher | 11 (8.3%) | 0 (0.0%) |
| Total | 73 (16.2%) | 0 (0.0%) |
Employment Occupations by Sex in Farmington
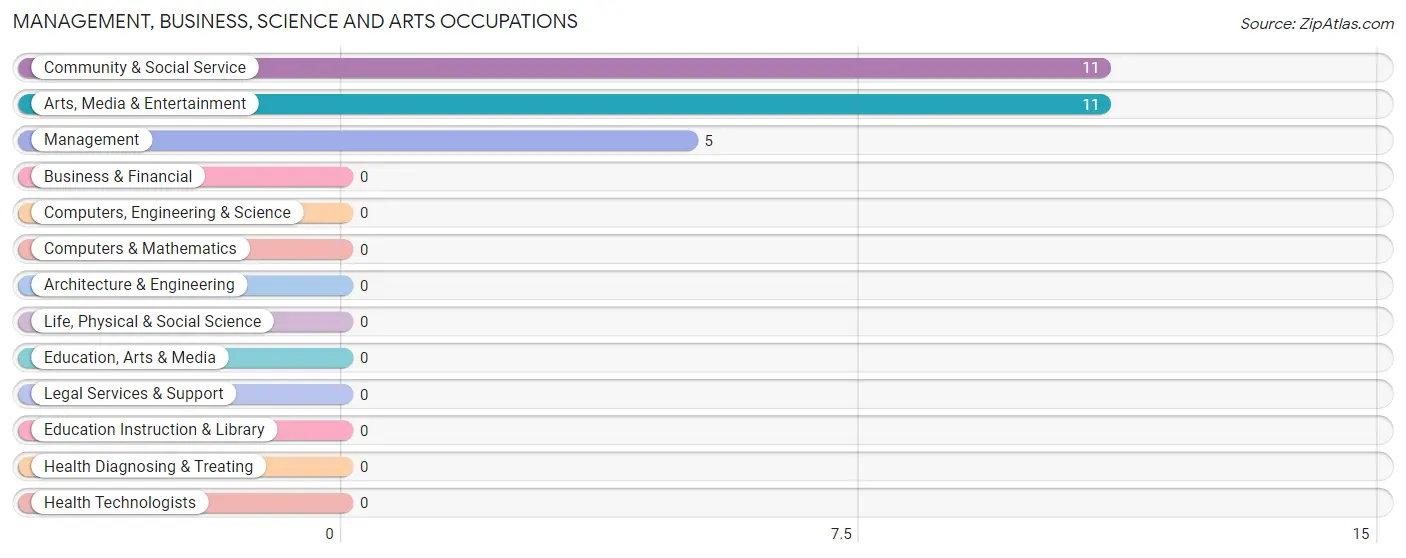
Management, Business, Science and Arts Occupations
The most common Management, Business, Science and Arts occupations in Farmington are Community & Social Service (11 | 11.0%), Arts, Media & Entertainment (11 | 11.0%), and Management (5 | 5.0%).
Management, Business, Science and Arts Occupations by Sex
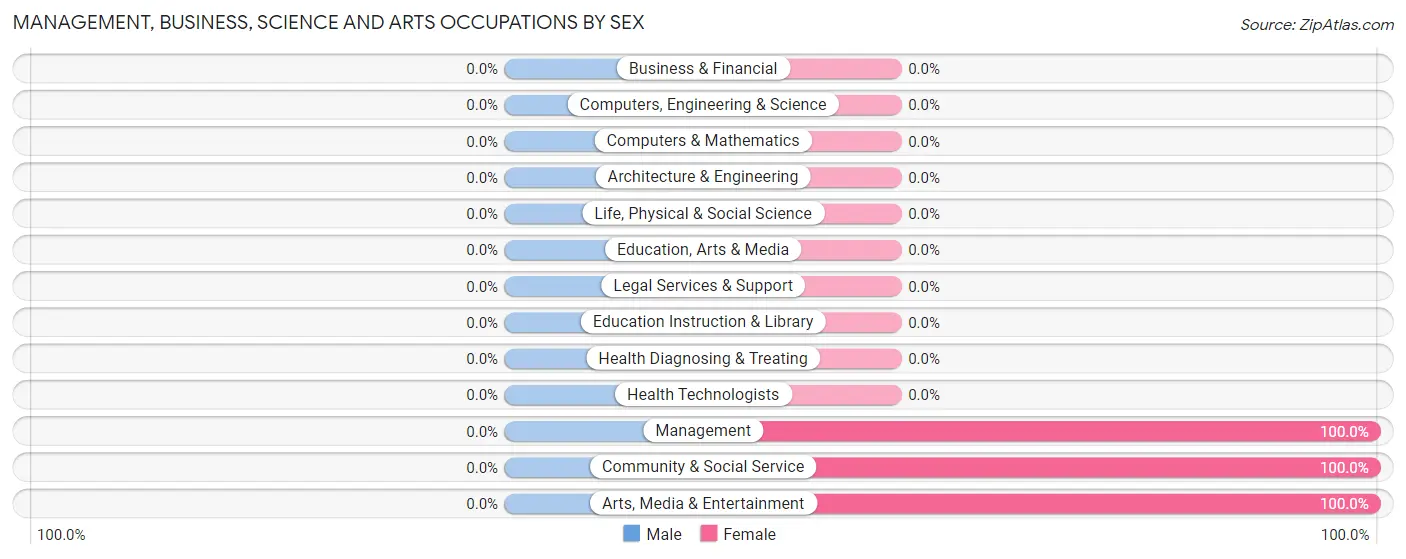
| Occupation | Male | Female |
| Management | 0 (0.0%) | 5 (100.0%) |
| Business & Financial | 0 (0.0%) | 0 (0.0%) |
| Computers, Engineering & Science | 0 (0.0%) | 0 (0.0%) |
| Computers & Mathematics | 0 (0.0%) | 0 (0.0%) |
| Architecture & Engineering | 0 (0.0%) | 0 (0.0%) |
| Life, Physical & Social Science | 0 (0.0%) | 0 (0.0%) |
| Community & Social Service | 0 (0.0%) | 11 (100.0%) |
| Education, Arts & Media | 0 (0.0%) | 0 (0.0%) |
| Legal Services & Support | 0 (0.0%) | 0 (0.0%) |
| Education Instruction & Library | 0 (0.0%) | 0 (0.0%) |
| Arts, Media & Entertainment | 0 (0.0%) | 11 (100.0%) |
| Health Diagnosing & Treating | 0 (0.0%) | 0 (0.0%) |
| Health Technologists | 0 (0.0%) | 0 (0.0%) |
| Total (Category) | 0 (0.0%) | 16 (100.0%) |
| Total (Overall) | 51 (51.0%) | 49 (49.0%) |
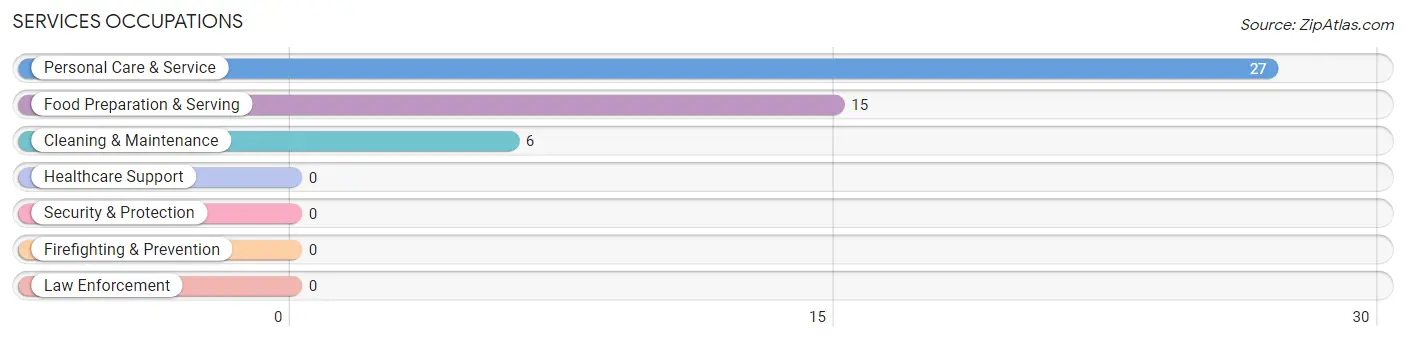
Services Occupations
The most common Services occupations in Farmington are Personal Care & Service (27 | 27.0%), Food Preparation & Serving (15 | 15.0%), and Cleaning & Maintenance (6 | 6.0%).
Services Occupations by Sex
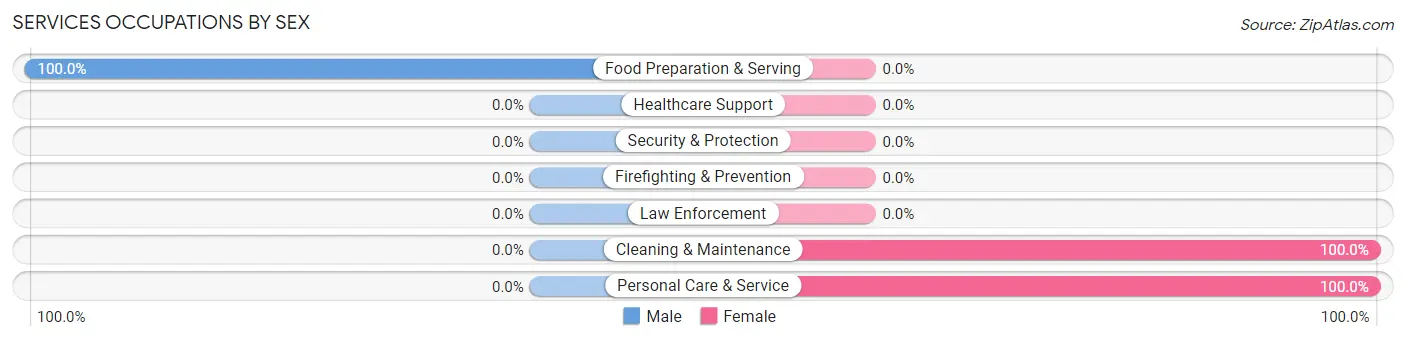
| Occupation | Male | Female |
| Healthcare Support | 0 (0.0%) | 0 (0.0%) |
| Security & Protection | 0 (0.0%) | 0 (0.0%) |
| Firefighting & Prevention | 0 (0.0%) | 0 (0.0%) |
| Law Enforcement | 0 (0.0%) | 0 (0.0%) |
| Food Preparation & Serving | 15 (100.0%) | 0 (0.0%) |
| Cleaning & Maintenance | 0 (0.0%) | 6 (100.0%) |
| Personal Care & Service | 0 (0.0%) | 27 (100.0%) |
| Total (Category) | 15 (31.2%) | 33 (68.8%) |
| Total (Overall) | 51 (51.0%) | 49 (49.0%) |
Sales and Office Occupations
The most common Sales and Office occupations in Farmington are , and Sales & Related (9 | 9.0%).
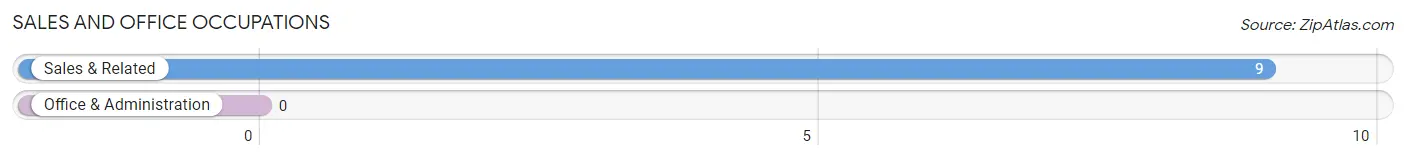
Sales and Office Occupations by Sex

| Occupation | Male | Female |
| Sales & Related | 9 (100.0%) | 0 (0.0%) |
| Office & Administration | 0 (0.0%) | 0 (0.0%) |
| Total (Category) | 9 (100.0%) | 0 (0.0%) |
| Total (Overall) | 51 (51.0%) | 49 (49.0%) |
Natural Resources, Construction and Maintenance Occupations
The most common Natural Resources, Construction and Maintenance occupations in Farmington are , and Installation, Maintenance & Repair (12 | 12.0%).
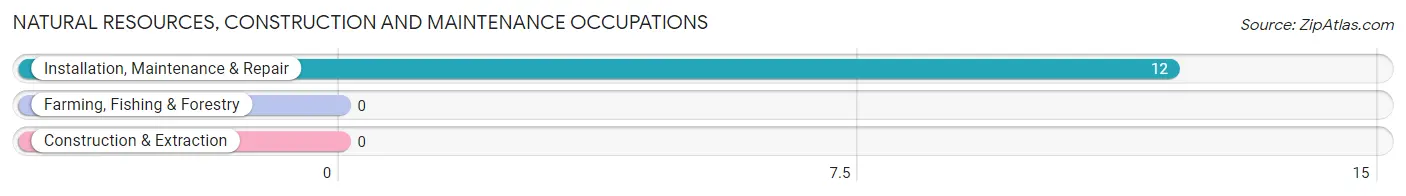
Natural Resources, Construction and Maintenance Occupations by Sex
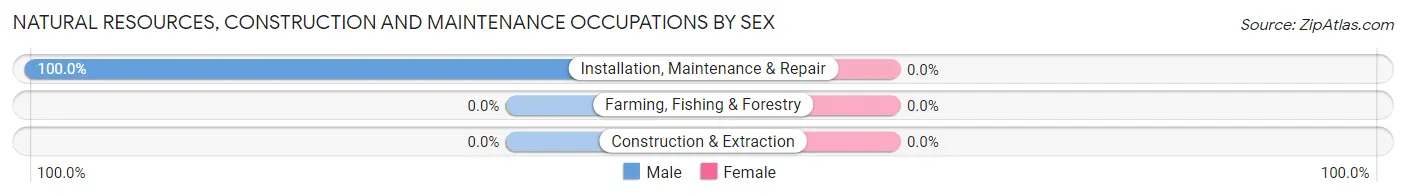
| Occupation | Male | Female |
| Farming, Fishing & Forestry | 0 (0.0%) | 0 (0.0%) |
| Construction & Extraction | 0 (0.0%) | 0 (0.0%) |
| Installation, Maintenance & Repair | 12 (100.0%) | 0 (0.0%) |
| Total (Category) | 12 (100.0%) | 0 (0.0%) |
| Total (Overall) | 51 (51.0%) | 49 (49.0%) |
Production, Transportation and Moving Occupations
The most common Production, Transportation and Moving occupations in Farmington are Production (9 | 9.0%), and Transportation (6 | 6.0%).
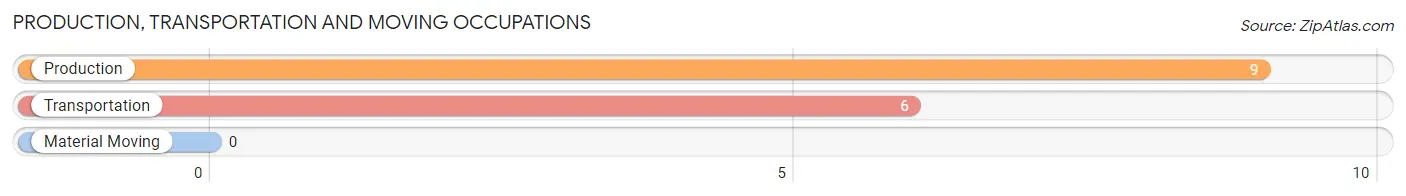
Production, Transportation and Moving Occupations by Sex
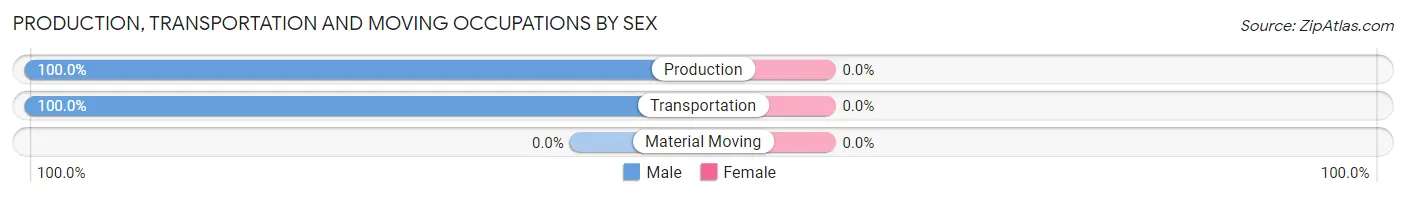
| Occupation | Male | Female |
| Production | 9 (100.0%) | 0 (0.0%) |
| Transportation | 6 (100.0%) | 0 (0.0%) |
| Material Moving | 0 (0.0%) | 0 (0.0%) |
| Total (Category) | 15 (100.0%) | 0 (0.0%) |
| Total (Overall) | 51 (51.0%) | 49 (49.0%) |
Employment Industries by Sex in Farmington
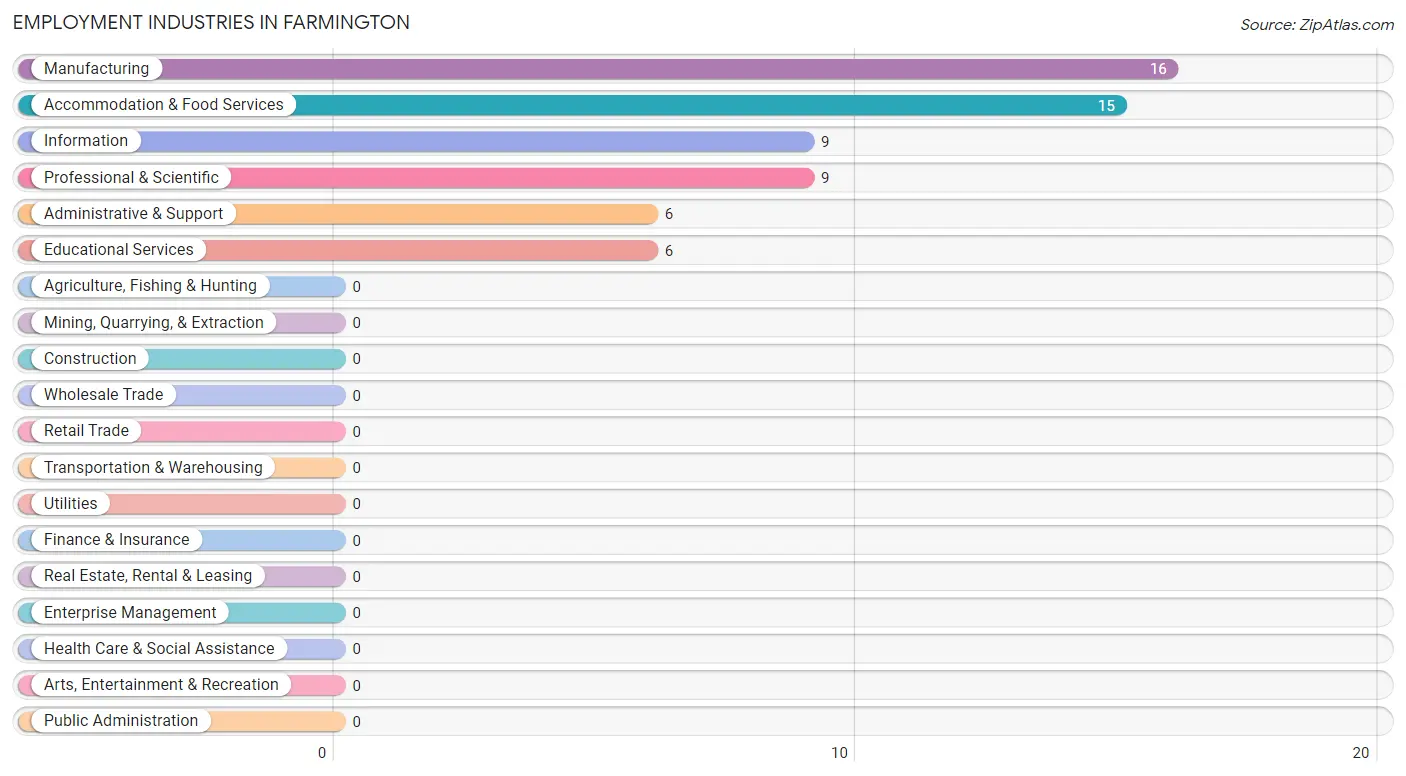
Employment Industries in Farmington
The major employment industries in Farmington include Manufacturing (16 | 16.0%), Accommodation & Food Services (15 | 15.0%), Information (9 | 9.0%), Professional & Scientific (9 | 9.0%), and Administrative & Support (6 | 6.0%).
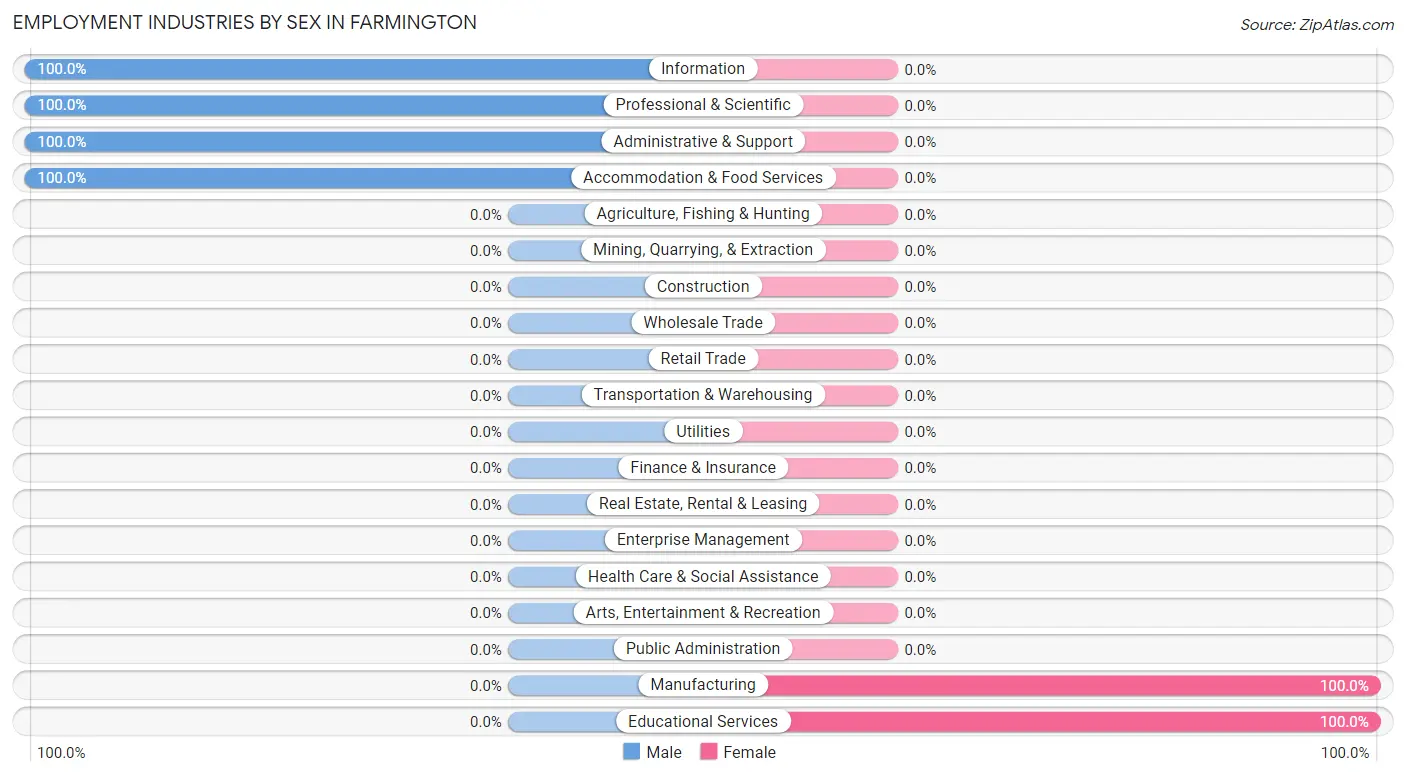
Employment Industries by Sex in Farmington
The Farmington industries that see more men than women are Information (100.0%), Professional & Scientific (100.0%), and Administrative & Support (100.0%), whereas the industries that tend to have a higher number of women are Manufacturing (100.0%), and Educational Services (100.0%).
| Industry | Male | Female |
| Agriculture, Fishing & Hunting | 0 (0.0%) | 0 (0.0%) |
| Mining, Quarrying, & Extraction | 0 (0.0%) | 0 (0.0%) |
| Construction | 0 (0.0%) | 0 (0.0%) |
| Manufacturing | 0 (0.0%) | 16 (100.0%) |
| Wholesale Trade | 0 (0.0%) | 0 (0.0%) |
| Retail Trade | 0 (0.0%) | 0 (0.0%) |
| Transportation & Warehousing | 0 (0.0%) | 0 (0.0%) |
| Utilities | 0 (0.0%) | 0 (0.0%) |
| Information | 9 (100.0%) | 0 (0.0%) |
| Finance & Insurance | 0 (0.0%) | 0 (0.0%) |
| Real Estate, Rental & Leasing | 0 (0.0%) | 0 (0.0%) |
| Professional & Scientific | 9 (100.0%) | 0 (0.0%) |
| Enterprise Management | 0 (0.0%) | 0 (0.0%) |
| Administrative & Support | 6 (100.0%) | 0 (0.0%) |
| Educational Services | 0 (0.0%) | 6 (100.0%) |
| Health Care & Social Assistance | 0 (0.0%) | 0 (0.0%) |
| Arts, Entertainment & Recreation | 0 (0.0%) | 0 (0.0%) |
| Accommodation & Food Services | 15 (100.0%) | 0 (0.0%) |
| Public Administration | 0 (0.0%) | 0 (0.0%) |
| Total | 51 (51.0%) | 49 (49.0%) |
Education in Farmington
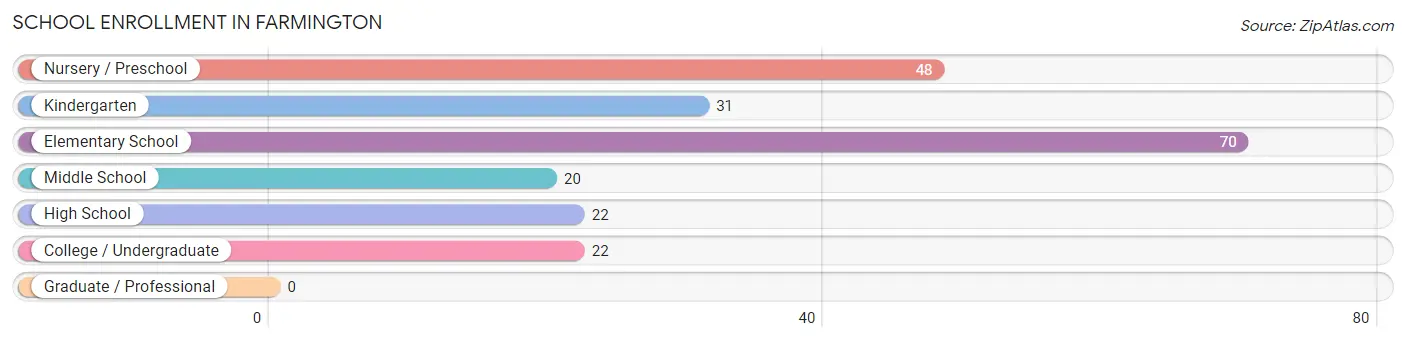
School Enrollment in Farmington
The most common levels of schooling among the 213 students in Farmington are elementary school (70 | 32.9%), nursery / preschool (48 | 22.5%), and kindergarten (31 | 14.5%).
| School Level | # Students | % Students |
| Nursery / Preschool | 48 | 22.5% |
| Kindergarten | 31 | 14.5% |
| Elementary School | 70 | 32.9% |
| Middle School | 20 | 9.4% |
| High School | 22 | 10.3% |
| College / Undergraduate | 22 | 10.3% |
| Graduate / Professional | 0 | 0.0% |
| Total | 213 | 100.0% |
School Enrollment by Age by Funding Source in Farmington
Out of a total of 213 students who are enrolled in schools in Farmington, 169 (79.3%) attend a private institution, while the remaining 44 (20.7%) are enrolled in public schools. The age group of 3 to 4 year olds has the highest likelihood of being enrolled in private schools, with 28 (100.0% in the age bracket) enrolled. Conversely, the age group of 15 to 17 year olds has the lowest likelihood of being enrolled in a private school, with 12 (100.0% in the age bracket) attending a public institution.
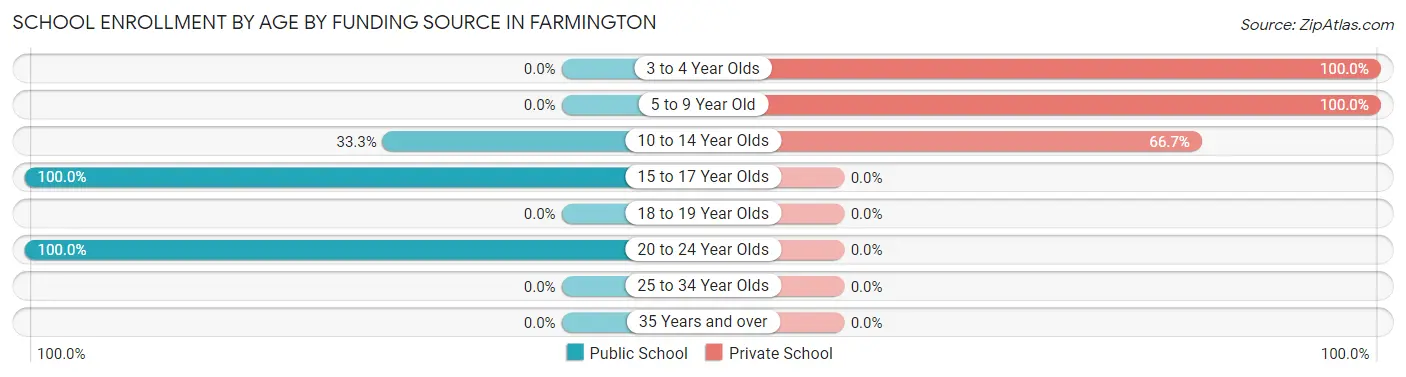
| Age Bracket | Public School | Private School |
| 3 to 4 Year Olds | 0 (0.0%) | 28 (100.0%) |
| 5 to 9 Year Old | 0 (0.0%) | 121 (100.0%) |
| 10 to 14 Year Olds | 10 (33.3%) | 20 (66.7%) |
| 15 to 17 Year Olds | 12 (100.0%) | 0 (0.0%) |
| 18 to 19 Year Olds | 0 (0.0%) | 0 (0.0%) |
| 20 to 24 Year Olds | 22 (100.0%) | 0 (0.0%) |
| 25 to 34 Year Olds | 0 (0.0%) | 0 (0.0%) |
| 35 Years and over | 0 (0.0%) | 0 (0.0%) |
| Total | 44 (20.7%) | 169 (79.3%) |
Educational Attainment by Field of Study in Farmington
Education (101 | 47.9%), engineering (24 | 11.4%), liberal arts & history (18 | 8.5%), literature & languages (17 | 8.1%), and science & technology (15 | 7.1%) are the most common fields of study among 211 individuals in Farmington who have obtained a bachelor's degree or higher.
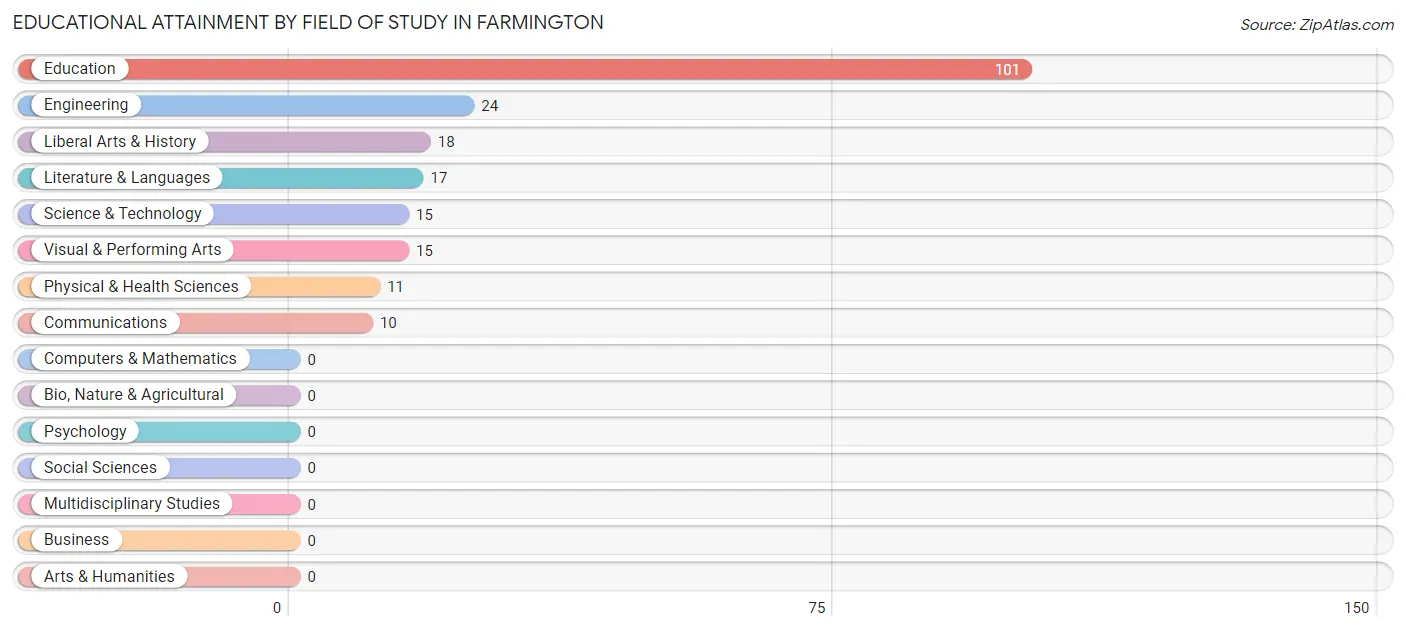
| Field of Study | # Graduates | % Graduates |
| Computers & Mathematics | 0 | 0.0% |
| Bio, Nature & Agricultural | 0 | 0.0% |
| Physical & Health Sciences | 11 | 5.2% |
| Psychology | 0 | 0.0% |
| Social Sciences | 0 | 0.0% |
| Engineering | 24 | 11.4% |
| Multidisciplinary Studies | 0 | 0.0% |
| Science & Technology | 15 | 7.1% |
| Business | 0 | 0.0% |
| Education | 101 | 47.9% |
| Literature & Languages | 17 | 8.1% |
| Liberal Arts & History | 18 | 8.5% |
| Visual & Performing Arts | 15 | 7.1% |
| Communications | 10 | 4.7% |
| Arts & Humanities | 0 | 0.0% |
| Total | 211 | 100.0% |
Transportation & Commute in Farmington
Vehicle Availability by Sex in Farmington
The most prevalent vehicle ownership categories in Farmington are males with 4 vehicles (15, accounting for 55.6%) and females with 4 vehicles (16, making up 30.6%).
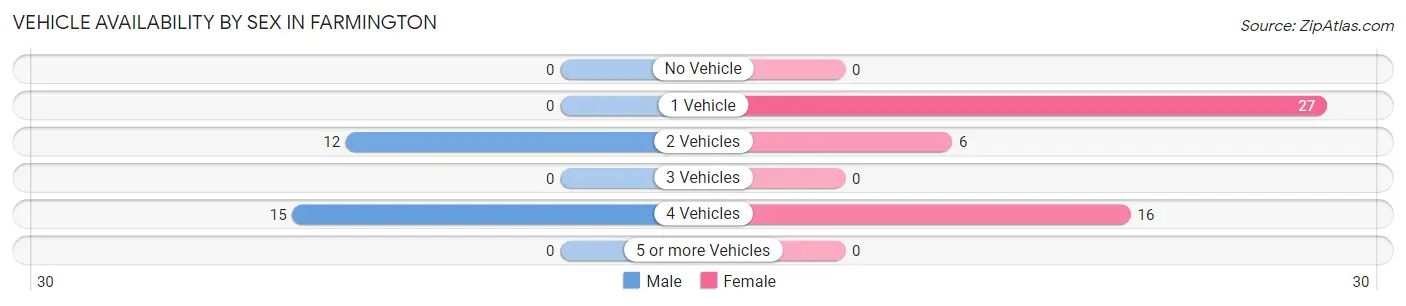
| Vehicles Available | Male | Female |
| No Vehicle | 0 (0.0%) | 0 (0.0%) |
| 1 Vehicle | 0 (0.0%) | 27 (55.1%) |
| 2 Vehicles | 12 (44.4%) | 6 (12.2%) |
| 3 Vehicles | 0 (0.0%) | 0 (0.0%) |
| 4 Vehicles | 15 (55.6%) | 16 (32.7%) |
| 5 or more Vehicles | 0 (0.0%) | 0 (0.0%) |
| Total | 27 (100.0%) | 49 (100.0%) |
Commute Time in Farmington
The most frequently occuring commute durations in Farmington are 5 to 9 minutes (27 commuters, 34.2%), 30 to 34 minutes (15 commuters, 19.0%), and 45 to 59 minutes (11 commuters, 13.9%).
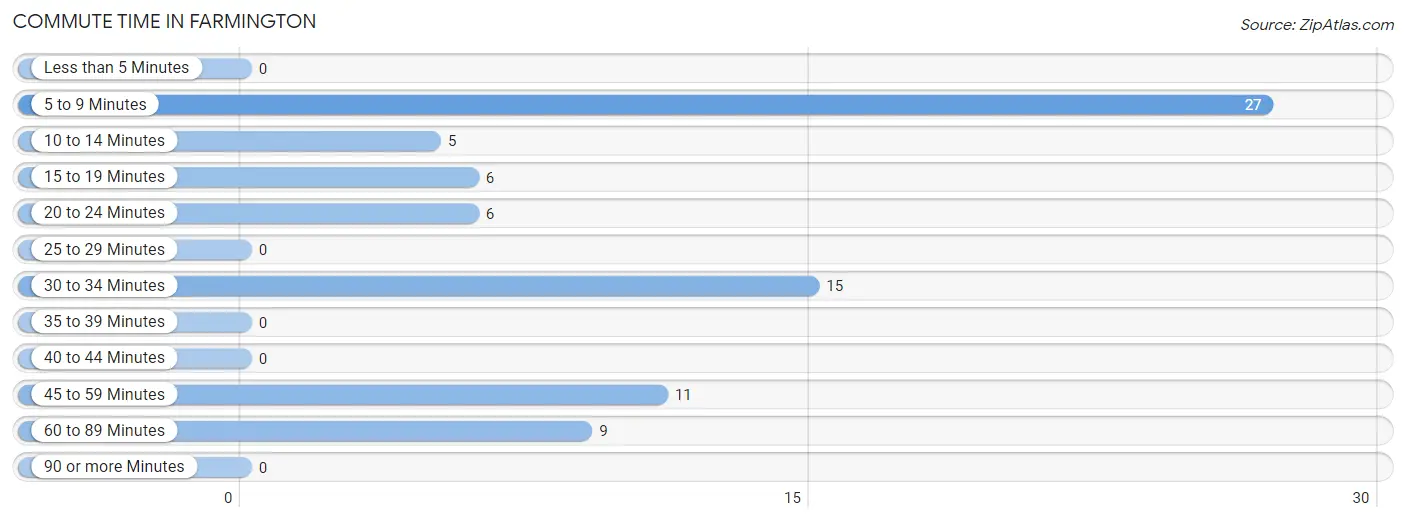
| Commute Time | # Commuters | % Commuters |
| Less than 5 Minutes | 0 | 0.0% |
| 5 to 9 Minutes | 27 | 34.2% |
| 10 to 14 Minutes | 5 | 6.3% |
| 15 to 19 Minutes | 6 | 7.6% |
| 20 to 24 Minutes | 6 | 7.6% |
| 25 to 29 Minutes | 0 | 0.0% |
| 30 to 34 Minutes | 15 | 19.0% |
| 35 to 39 Minutes | 0 | 0.0% |
| 40 to 44 Minutes | 0 | 0.0% |
| 45 to 59 Minutes | 11 | 13.9% |
| 60 to 89 Minutes | 9 | 11.4% |
| 90 or more Minutes | 0 | 0.0% |
Commute Time by Sex in Farmington
The most common commute times in Farmington are 30 to 34 minutes (15 commuters, 50.0%) for males and 5 to 9 minutes (27 commuters, 55.1%) for females.
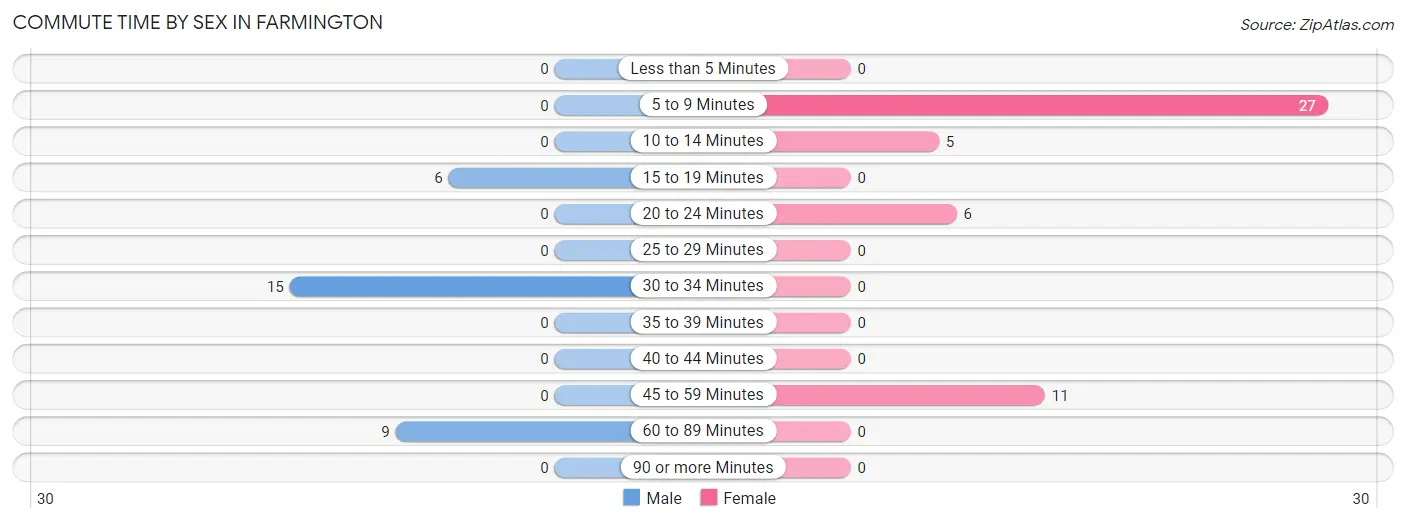
| Commute Time | Male | Female |
| Less than 5 Minutes | 0 (0.0%) | 0 (0.0%) |
| 5 to 9 Minutes | 0 (0.0%) | 27 (55.1%) |
| 10 to 14 Minutes | 0 (0.0%) | 5 (10.2%) |
| 15 to 19 Minutes | 6 (20.0%) | 0 (0.0%) |
| 20 to 24 Minutes | 0 (0.0%) | 6 (12.2%) |
| 25 to 29 Minutes | 0 (0.0%) | 0 (0.0%) |
| 30 to 34 Minutes | 15 (50.0%) | 0 (0.0%) |
| 35 to 39 Minutes | 0 (0.0%) | 0 (0.0%) |
| 40 to 44 Minutes | 0 (0.0%) | 0 (0.0%) |
| 45 to 59 Minutes | 0 (0.0%) | 11 (22.5%) |
| 60 to 89 Minutes | 9 (30.0%) | 0 (0.0%) |
| 90 or more Minutes | 0 (0.0%) | 0 (0.0%) |
Time of Departure to Work by Sex in Farmington
The most frequent times of departure to work in Farmington are 12:00 PM to 3:59 PM (15, 50.0%) for males and 6:30 AM to 6:59 AM (38, 77.5%) for females.
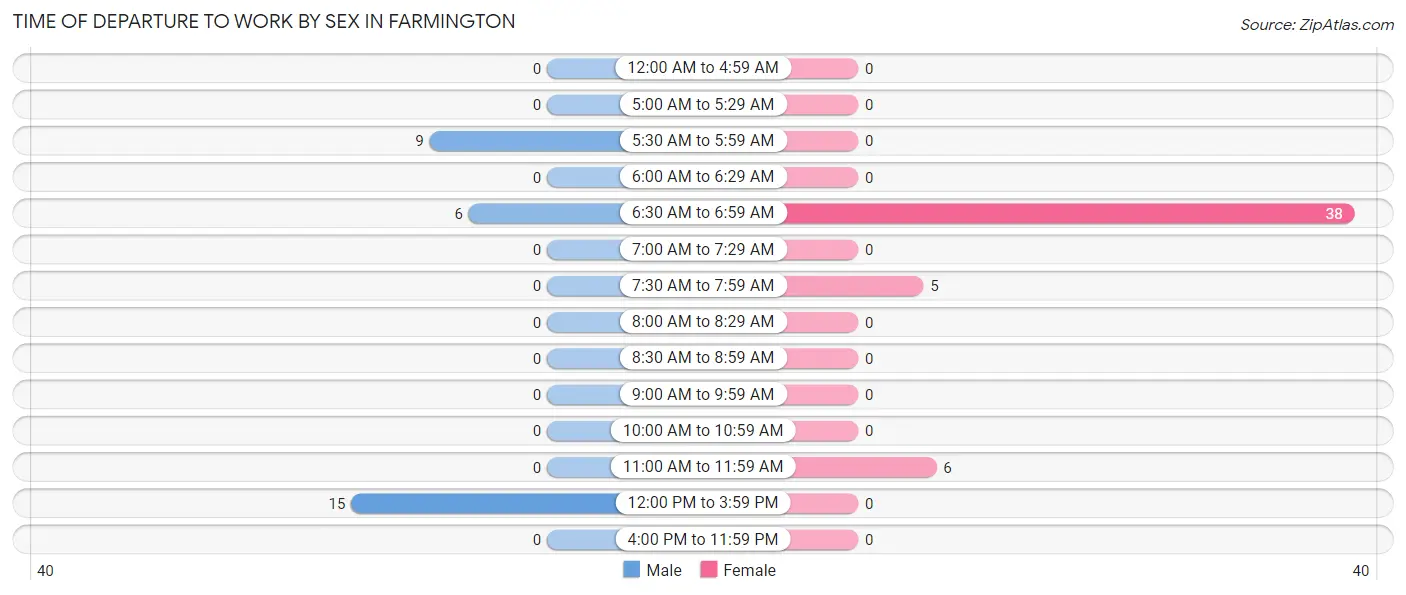
| Time of Departure | Male | Female |
| 12:00 AM to 4:59 AM | 0 (0.0%) | 0 (0.0%) |
| 5:00 AM to 5:29 AM | 0 (0.0%) | 0 (0.0%) |
| 5:30 AM to 5:59 AM | 9 (30.0%) | 0 (0.0%) |
| 6:00 AM to 6:29 AM | 0 (0.0%) | 0 (0.0%) |
| 6:30 AM to 6:59 AM | 6 (20.0%) | 38 (77.5%) |
| 7:00 AM to 7:29 AM | 0 (0.0%) | 0 (0.0%) |
| 7:30 AM to 7:59 AM | 0 (0.0%) | 5 (10.2%) |
| 8:00 AM to 8:29 AM | 0 (0.0%) | 0 (0.0%) |
| 8:30 AM to 8:59 AM | 0 (0.0%) | 0 (0.0%) |
| 9:00 AM to 9:59 AM | 0 (0.0%) | 0 (0.0%) |
| 10:00 AM to 10:59 AM | 0 (0.0%) | 0 (0.0%) |
| 11:00 AM to 11:59 AM | 0 (0.0%) | 6 (12.2%) |
| 12:00 PM to 3:59 PM | 15 (50.0%) | 0 (0.0%) |
| 4:00 PM to 11:59 PM | 0 (0.0%) | 0 (0.0%) |
| Total | 30 (100.0%) | 49 (100.0%) |
Housing Occupancy in Farmington
Occupancy by Ownership in Farmington
Of the total 68 dwellings in Farmington, owner-occupied units account for 68 (100.0%), while renter-occupied units make up 0 (0.0%).
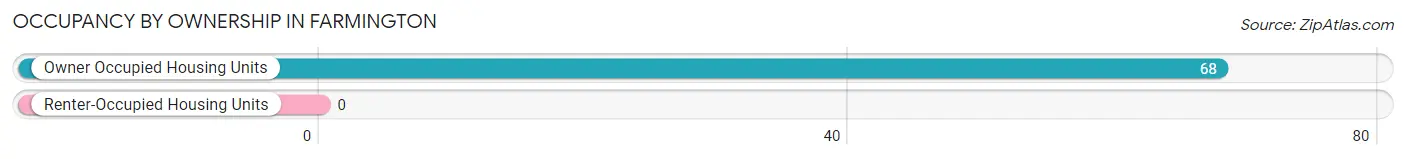
| Occupancy | # Housing Units | % Housing Units |
| Owner Occupied Housing Units | 68 | 100.0% |
| Renter-Occupied Housing Units | 0 | 0.0% |
| Total Occupied Housing Units | 68 | 100.0% |
Occupancy by Household Size in Farmington
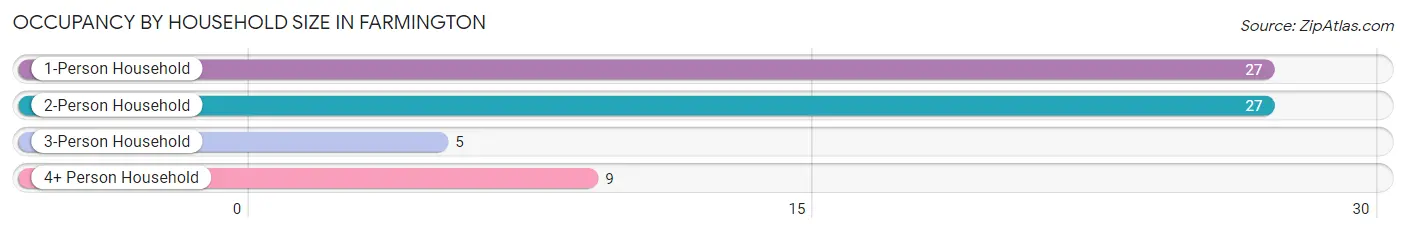
| Household Size | # Housing Units | % Housing Units |
| 1-Person Household | 27 | 39.7% |
| 2-Person Household | 27 | 39.7% |
| 3-Person Household | 5 | 7.3% |
| 4+ Person Household | 9 | 13.2% |
| Total Housing Units | 68 | 100.0% |
Occupancy by Ownership by Household Size in Farmington
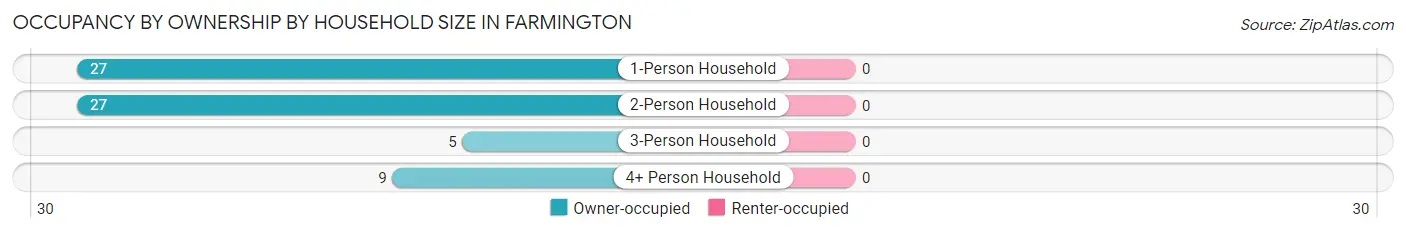
| Household Size | Owner-occupied | Renter-occupied |
| 1-Person Household | 27 (100.0%) | 0 (0.0%) |
| 2-Person Household | 27 (100.0%) | 0 (0.0%) |
| 3-Person Household | 5 (100.0%) | 0 (0.0%) |
| 4+ Person Household | 9 (100.0%) | 0 (0.0%) |
| Total Housing Units | 68 (100.0%) | 0 (0.0%) |
Occupancy by Educational Attainment in Farmington
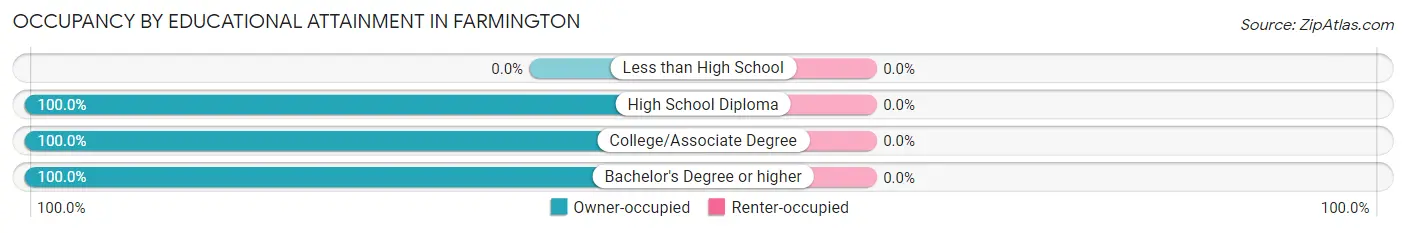
| Household Size | Owner-occupied | Renter-occupied |
| Less than High School | 0 (0.0%) | 0 (0.0%) |
| High School Diploma | 54 (100.0%) | 0 (0.0%) |
| College/Associate Degree | 5 (100.0%) | 0 (0.0%) |
| Bachelor's Degree or higher | 9 (100.0%) | 0 (0.0%) |
Occupancy by Age of Householder in Farmington
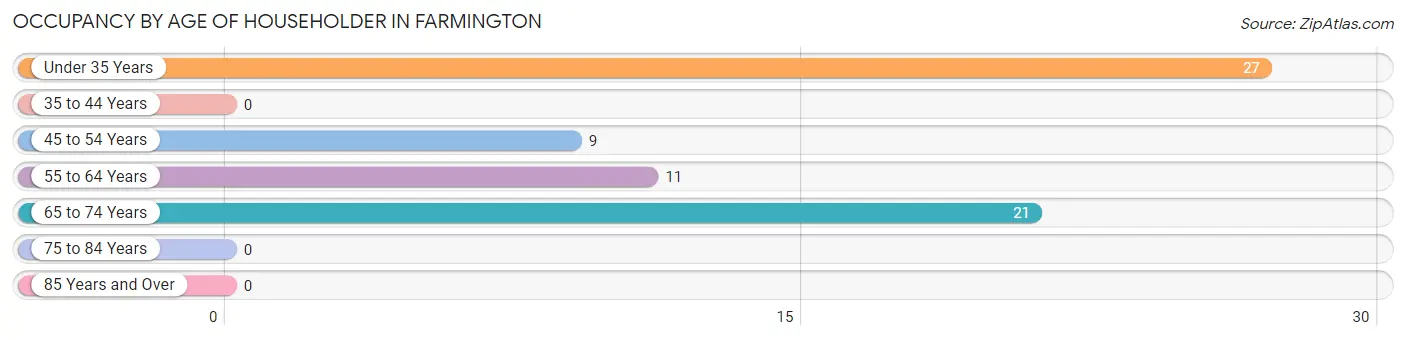
| Age Bracket | # Households | % Households |
| Under 35 Years | 27 | 39.7% |
| 35 to 44 Years | 0 | 0.0% |
| 45 to 54 Years | 9 | 13.2% |
| 55 to 64 Years | 11 | 16.2% |
| 65 to 74 Years | 21 | 30.9% |
| 75 to 84 Years | 0 | 0.0% |
| 85 Years and Over | 0 | 0.0% |
| Total | 68 | 100.0% |
Housing Finances in Farmington
Median Income by Occupancy in Farmington
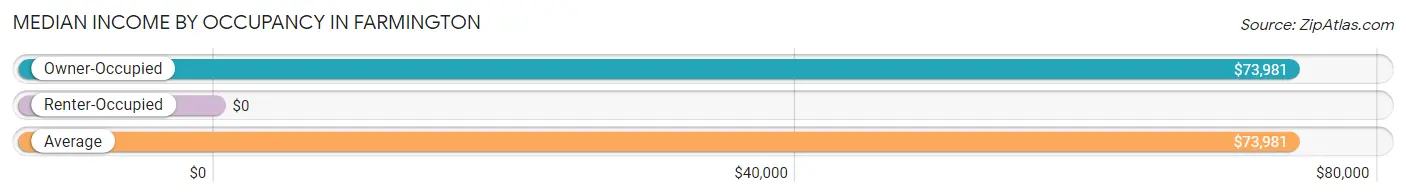
| Occupancy Type | # Households | Median Income |
| Owner-Occupied | 68 (100.0%) | $73,981 |
| Renter-Occupied | 0 (0.0%) | $0 |
| Average | 68 (100.0%) | $73,981 |
Occupancy by Householder Income Bracket in Farmington
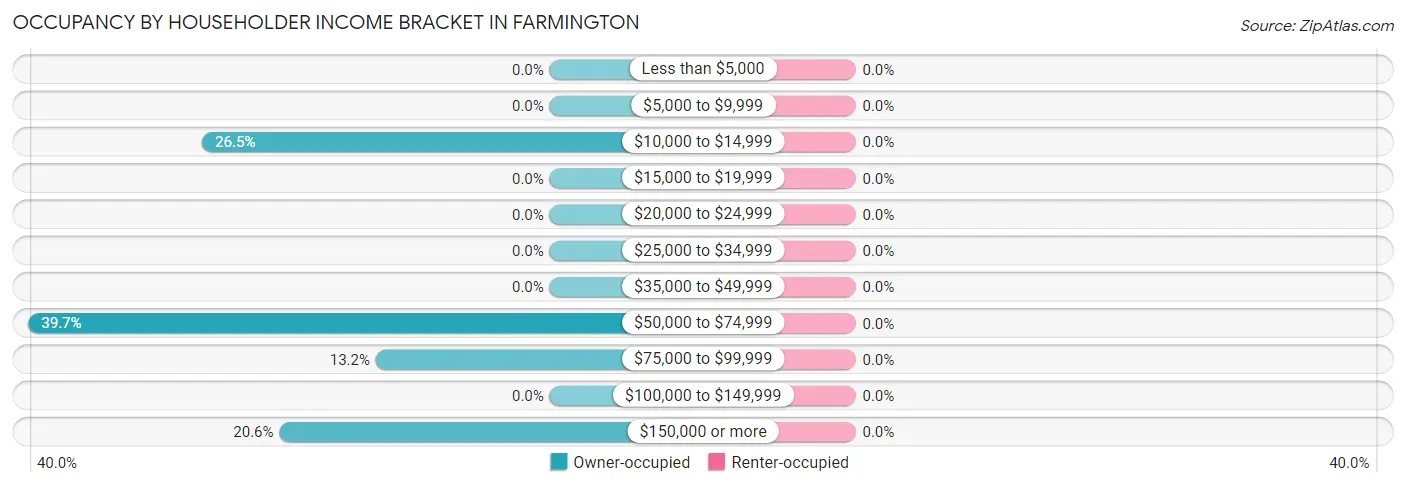
| Income Bracket | Owner-occupied | Renter-occupied |
| Less than $5,000 | 0 (0.0%) | 0 (0.0%) |
| $5,000 to $9,999 | 0 (0.0%) | 0 (0.0%) |
| $10,000 to $14,999 | 18 (26.5%) | 0 (0.0%) |
| $15,000 to $19,999 | 0 (0.0%) | 0 (0.0%) |
| $20,000 to $24,999 | 0 (0.0%) | 0 (0.0%) |
| $25,000 to $34,999 | 0 (0.0%) | 0 (0.0%) |
| $35,000 to $49,999 | 0 (0.0%) | 0 (0.0%) |
| $50,000 to $74,999 | 27 (39.7%) | 0 (0.0%) |
| $75,000 to $99,999 | 9 (13.2%) | 0 (0.0%) |
| $100,000 to $149,999 | 0 (0.0%) | 0 (0.0%) |
| $150,000 or more | 14 (20.6%) | 0 (0.0%) |
| Total | 68 (100.0%) | 0 (0.0%) |
Monthly Housing Cost Tiers in Farmington
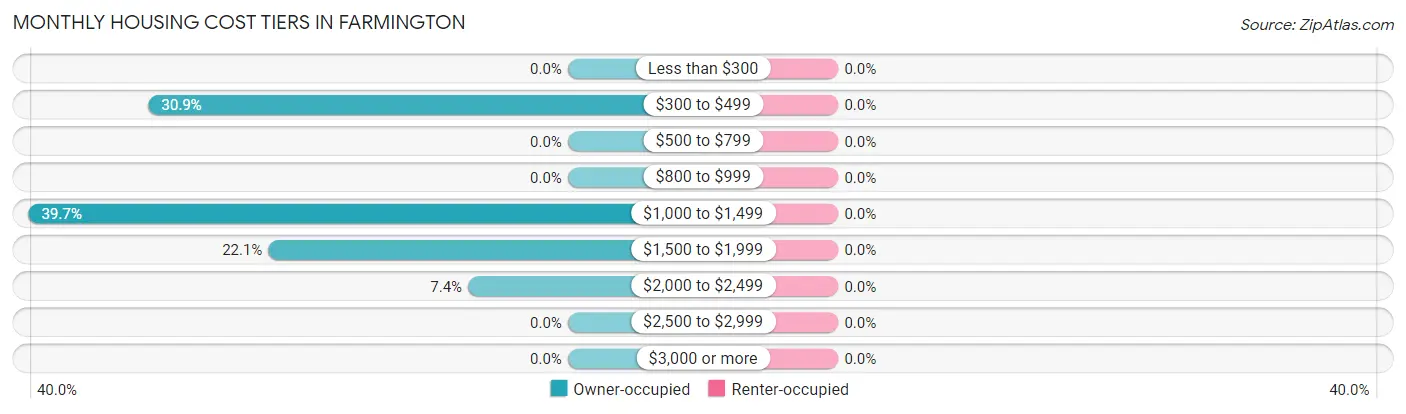
| Monthly Cost | Owner-occupied | Renter-occupied |
| Less than $300 | 0 (0.0%) | 0 (0.0%) |
| $300 to $499 | 21 (30.9%) | 0 (0.0%) |
| $500 to $799 | 0 (0.0%) | 0 (0.0%) |
| $800 to $999 | 0 (0.0%) | 0 (0.0%) |
| $1,000 to $1,499 | 27 (39.7%) | 0 (0.0%) |
| $1,500 to $1,999 | 15 (22.1%) | 0 (0.0%) |
| $2,000 to $2,499 | 5 (7.3%) | 0 (0.0%) |
| $2,500 to $2,999 | 0 (0.0%) | 0 (0.0%) |
| $3,000 or more | 0 (0.0%) | 0 (0.0%) |
| Total | 68 (100.0%) | 0 (0.0%) |
Physical Housing Characteristics in Farmington
Housing Structures in Farmington
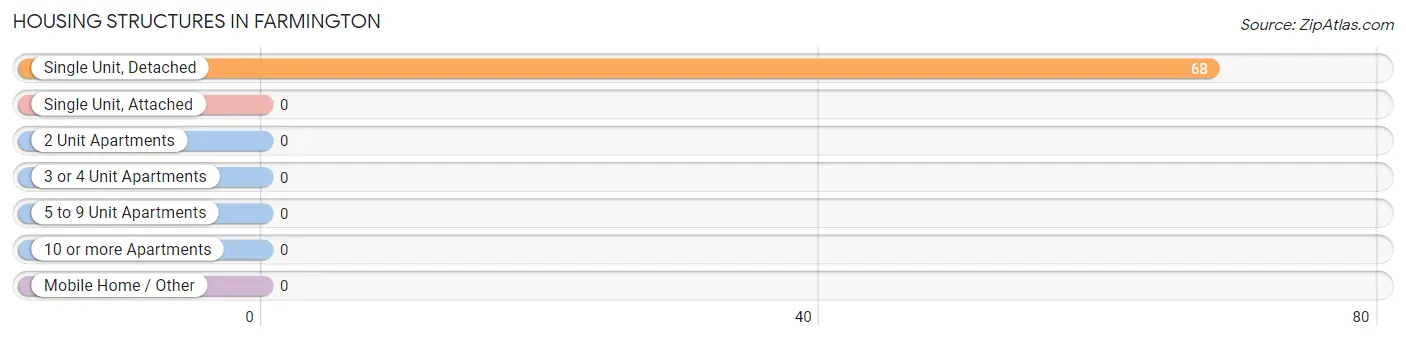
| Structure Type | # Housing Units | % Housing Units |
| Single Unit, Detached | 68 | 100.0% |
| Single Unit, Attached | 0 | 0.0% |
| 2 Unit Apartments | 0 | 0.0% |
| 3 or 4 Unit Apartments | 0 | 0.0% |
| 5 to 9 Unit Apartments | 0 | 0.0% |
| 10 or more Apartments | 0 | 0.0% |
| Mobile Home / Other | 0 | 0.0% |
| Total | 68 | 100.0% |
Housing Structures by Occupancy in Farmington
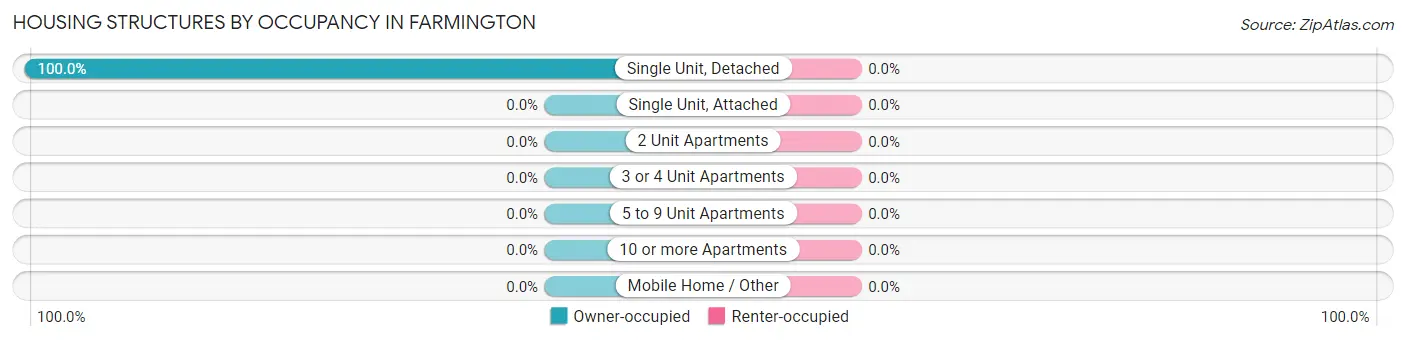
| Structure Type | Owner-occupied | Renter-occupied |
| Single Unit, Detached | 68 (100.0%) | 0 (0.0%) |
| Single Unit, Attached | 0 (0.0%) | 0 (0.0%) |
| 2 Unit Apartments | 0 (0.0%) | 0 (0.0%) |
| 3 or 4 Unit Apartments | 0 (0.0%) | 0 (0.0%) |
| 5 to 9 Unit Apartments | 0 (0.0%) | 0 (0.0%) |
| 10 or more Apartments | 0 (0.0%) | 0 (0.0%) |
| Mobile Home / Other | 0 (0.0%) | 0 (0.0%) |
| Total | 68 (100.0%) | 0 (0.0%) |
Housing Structures by Number of Rooms in Farmington
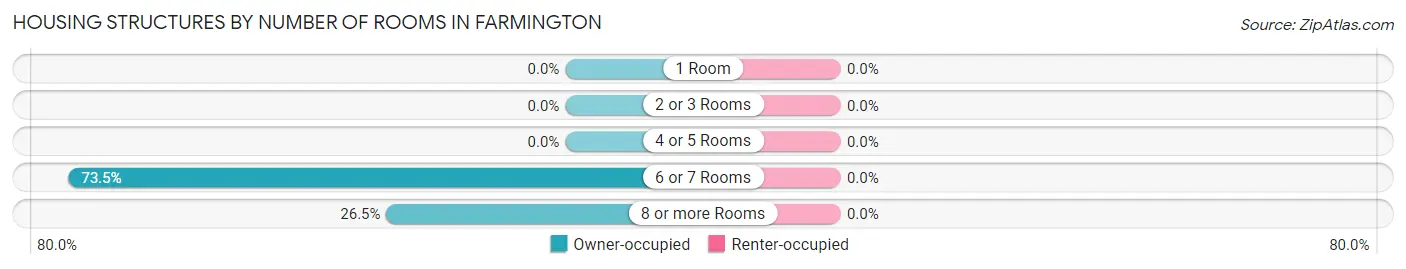
| Number of Rooms | Owner-occupied | Renter-occupied |
| 1 Room | 0 (0.0%) | 0 (0.0%) |
| 2 or 3 Rooms | 0 (0.0%) | 0 (0.0%) |
| 4 or 5 Rooms | 0 (0.0%) | 0 (0.0%) |
| 6 or 7 Rooms | 50 (73.5%) | 0 (0.0%) |
| 8 or more Rooms | 18 (26.5%) | 0 (0.0%) |
| Total | 68 (100.0%) | 0 (0.0%) |
Housing Structure by Heating Type in Farmington
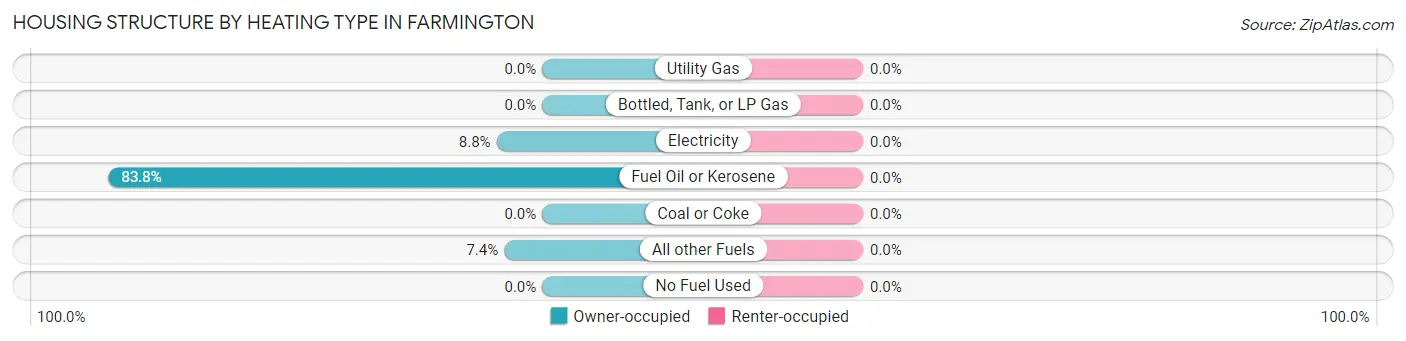
| Heating Type | Owner-occupied | Renter-occupied |
| Utility Gas | 0 (0.0%) | 0 (0.0%) |
| Bottled, Tank, or LP Gas | 0 (0.0%) | 0 (0.0%) |
| Electricity | 6 (8.8%) | 0 (0.0%) |
| Fuel Oil or Kerosene | 57 (83.8%) | 0 (0.0%) |
| Coal or Coke | 0 (0.0%) | 0 (0.0%) |
| All other Fuels | 5 (7.3%) | 0 (0.0%) |
| No Fuel Used | 0 (0.0%) | 0 (0.0%) |
| Total | 68 (100.0%) | 0 (0.0%) |
Household Vehicle Usage in Farmington
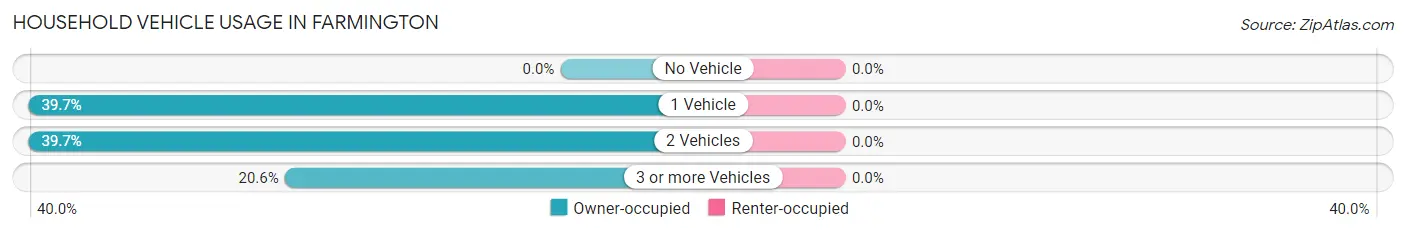
| Vehicles per Household | Owner-occupied | Renter-occupied |
| No Vehicle | 0 (0.0%) | 0 (0.0%) |
| 1 Vehicle | 27 (39.7%) | 0 (0.0%) |
| 2 Vehicles | 27 (39.7%) | 0 (0.0%) |
| 3 or more Vehicles | 14 (20.6%) | 0 (0.0%) |
| Total | 68 (100.0%) | 0 (0.0%) |
Real Estate & Mortgages in Farmington
Real Estate and Mortgage Overview in Farmington
| Characteristic | Without Mortgage | With Mortgage |
| Housing Units | 21 | 47 |
| Median Property Value | - | - |
| Median Household Income | - | - |
| Monthly Housing Costs | - | - |
| Real Estate Taxes | - | - |
Property Value by Mortgage Status in Farmington
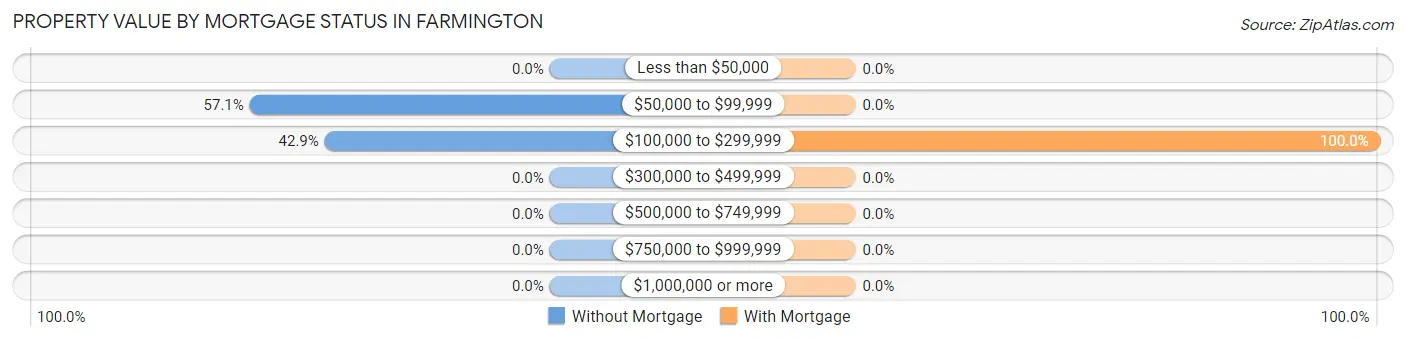
| Property Value | Without Mortgage | With Mortgage |
| Less than $50,000 | 0 (0.0%) | 0 (0.0%) |
| $50,000 to $99,999 | 12 (57.1%) | 0 (0.0%) |
| $100,000 to $299,999 | 9 (42.9%) | 47 (100.0%) |
| $300,000 to $499,999 | 0 (0.0%) | 0 (0.0%) |
| $500,000 to $749,999 | 0 (0.0%) | 0 (0.0%) |
| $750,000 to $999,999 | 0 (0.0%) | 0 (0.0%) |
| $1,000,000 or more | 0 (0.0%) | 0 (0.0%) |
| Total | 21 (100.0%) | 47 (100.0%) |
Household Income by Mortgage Status in Farmington
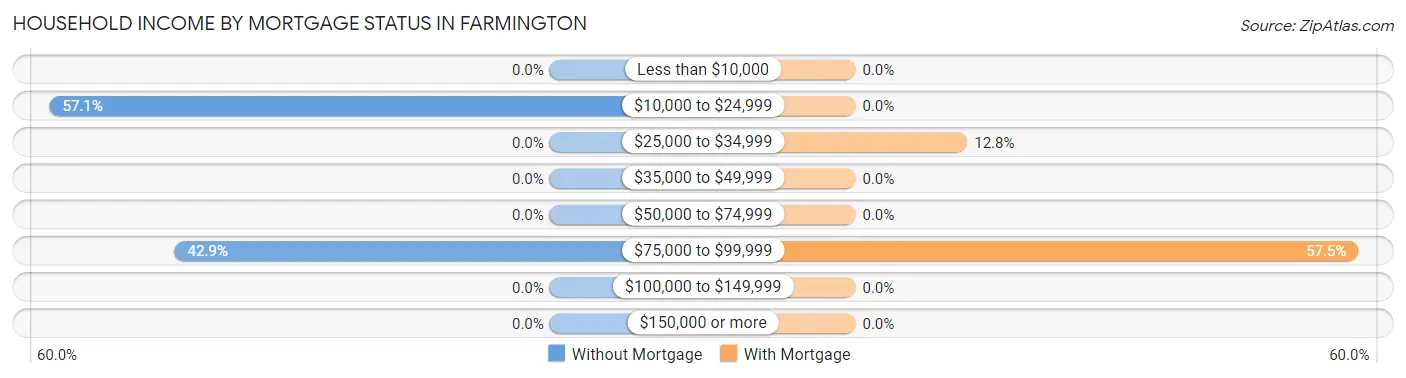
| Household Income | Without Mortgage | With Mortgage |
| Less than $10,000 | 0 (0.0%) | 0 (0.0%) |
| $10,000 to $24,999 | 12 (57.1%) | 0 (0.0%) |
| $25,000 to $34,999 | 0 (0.0%) | 6 (12.8%) |
| $35,000 to $49,999 | 0 (0.0%) | 0 (0.0%) |
| $50,000 to $74,999 | 0 (0.0%) | 0 (0.0%) |
| $75,000 to $99,999 | 9 (42.9%) | 27 (57.5%) |
| $100,000 to $149,999 | 0 (0.0%) | 0 (0.0%) |
| $150,000 or more | 0 (0.0%) | 0 (0.0%) |
| Total | 21 (100.0%) | 47 (100.0%) |
Property Value to Household Income Ratio in Farmington
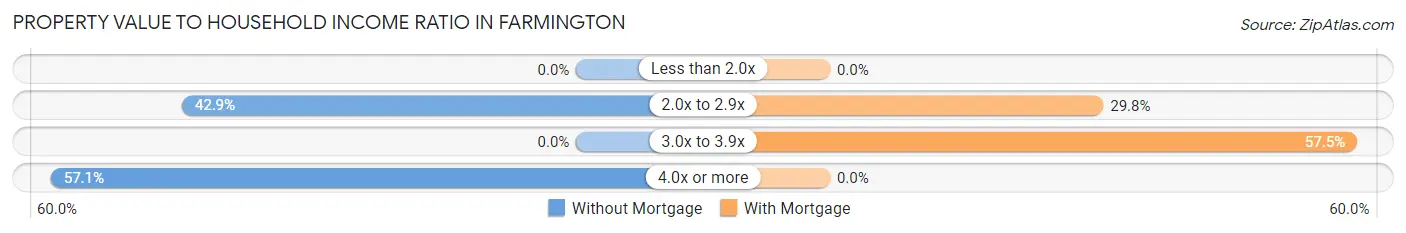
| Value-to-Income Ratio | Without Mortgage | With Mortgage |
| Less than 2.0x | 0 (0.0%) | 0 (0.0%) |
| 2.0x to 2.9x | 9 (42.9%) | 14 (29.8%) |
| 3.0x to 3.9x | 0 (0.0%) | 27 (57.5%) |
| 4.0x or more | 12 (57.1%) | 0 (0.0%) |
| Total | 21 (100.0%) | 47 (100.0%) |
Real Estate Taxes by Mortgage Status in Farmington
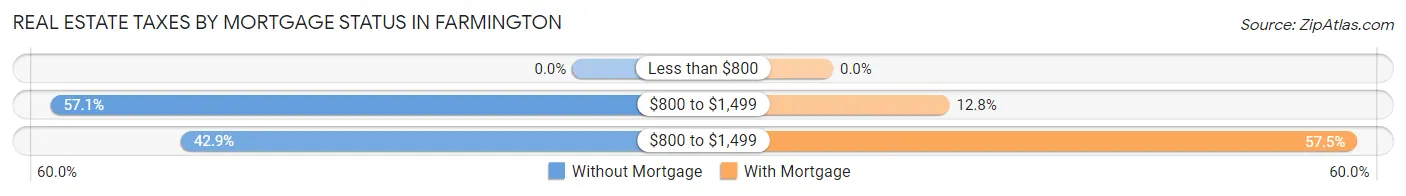
| Property Taxes | Without Mortgage | With Mortgage |
| Less than $800 | 0 (0.0%) | 0 (0.0%) |
| $800 to $1,499 | 12 (57.1%) | 6 (12.8%) |
| $800 to $1,499 | 9 (42.9%) | 27 (57.5%) |
| Total | 21 (100.0%) | 47 (100.0%) |
Health & Disability in Farmington
Health Insurance Coverage by Age in Farmington
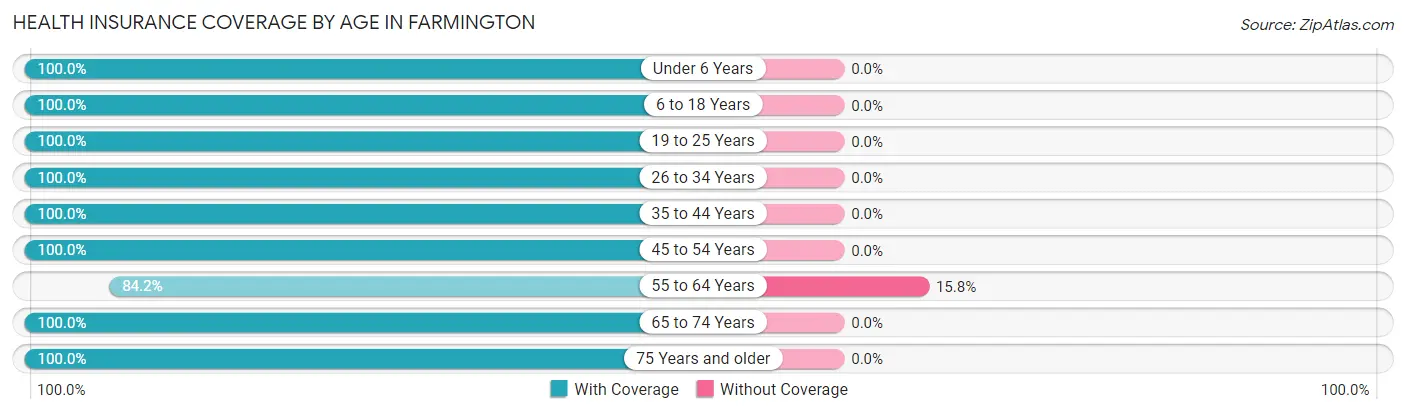
| Age Bracket | With Coverage | Without Coverage |
| Under 6 Years | 134 (100.0%) | 0 (0.0%) |
| 6 to 18 Years | 120 (100.0%) | 0 (0.0%) |
| 19 to 25 Years | 139 (100.0%) | 0 (0.0%) |
| 26 to 34 Years | 157 (100.0%) | 0 (0.0%) |
| 35 to 44 Years | 122 (100.0%) | 0 (0.0%) |
| 45 to 54 Years | 77 (100.0%) | 0 (0.0%) |
| 55 to 64 Years | 64 (84.2%) | 12 (15.8%) |
| 65 to 74 Years | 84 (100.0%) | 0 (0.0%) |
| 75 Years and older | 62 (100.0%) | 0 (0.0%) |
| Total | 959 (98.8%) | 12 (1.2%) |
Health Insurance Coverage by Citizenship Status in Farmington
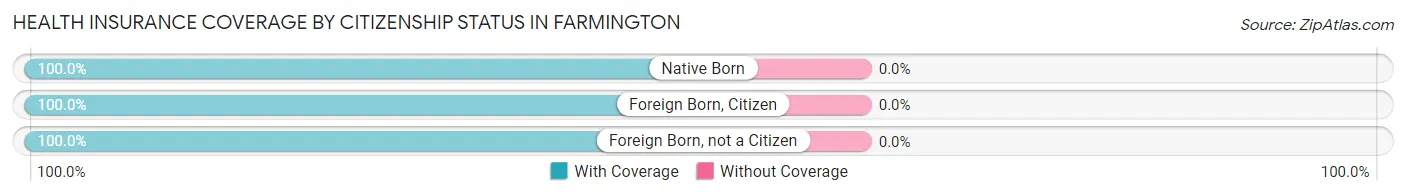
| Citizenship Status | With Coverage | Without Coverage |
| Native Born | 134 (100.0%) | 0 (0.0%) |
| Foreign Born, Citizen | 120 (100.0%) | 0 (0.0%) |
| Foreign Born, not a Citizen | 139 (100.0%) | 0 (0.0%) |
Health Insurance Coverage by Household Income in Farmington
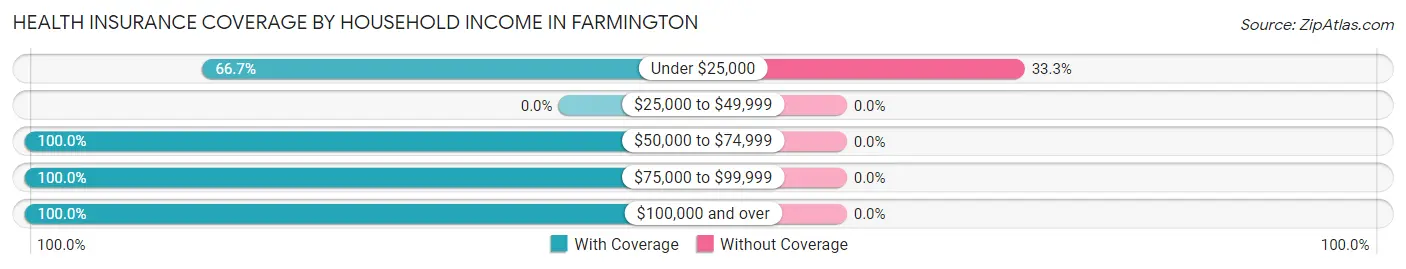
| Household Income | With Coverage | Without Coverage |
| Under $25,000 | 24 (66.7%) | 12 (33.3%) |
| $25,000 to $49,999 | 0 (0.0%) | 0 (0.0%) |
| $50,000 to $74,999 | 27 (100.0%) | 0 (0.0%) |
| $75,000 to $99,999 | 19 (100.0%) | 0 (0.0%) |
| $100,000 and over | 65 (100.0%) | 0 (0.0%) |
Public vs Private Health Insurance Coverage by Age in Farmington
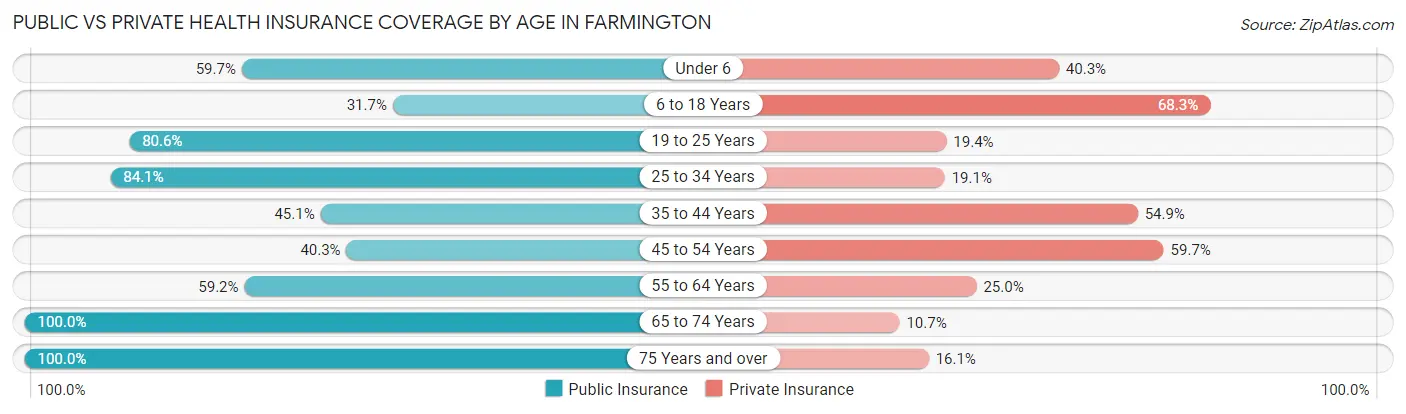
| Age Bracket | Public Insurance | Private Insurance |
| Under 6 | 80 (59.7%) | 54 (40.3%) |
| 6 to 18 Years | 38 (31.7%) | 82 (68.3%) |
| 19 to 25 Years | 112 (80.6%) | 27 (19.4%) |
| 25 to 34 Years | 132 (84.1%) | 30 (19.1%) |
| 35 to 44 Years | 55 (45.1%) | 67 (54.9%) |
| 45 to 54 Years | 31 (40.3%) | 46 (59.7%) |
| 55 to 64 Years | 45 (59.2%) | 19 (25.0%) |
| 65 to 74 Years | 84 (100.0%) | 9 (10.7%) |
| 75 Years and over | 62 (100.0%) | 10 (16.1%) |
| Total | 639 (65.8%) | 344 (35.4%) |
Disability Status by Sex by Age in Farmington
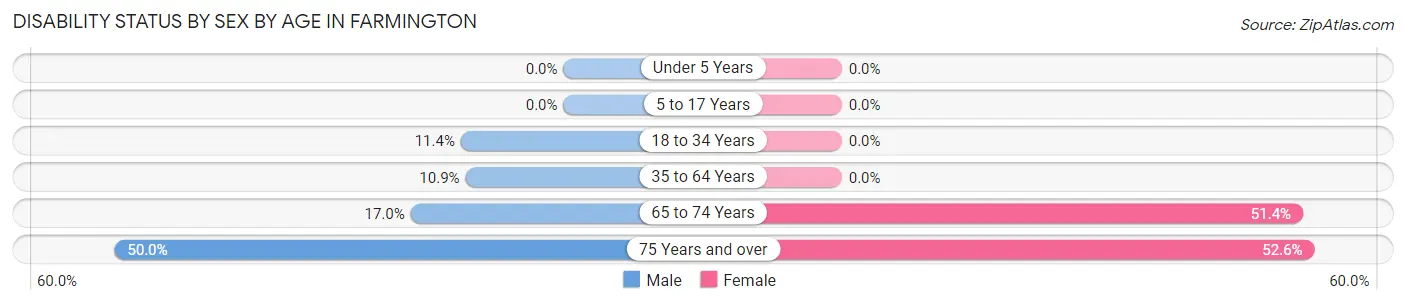
| Age Bracket | Male | Female |
| Under 5 Years | 0 (0.0%) | 0 (0.0%) |
| 5 to 17 Years | 0 (0.0%) | 0 (0.0%) |
| 18 to 34 Years | 20 (11.4%) | 0 (0.0%) |
| 35 to 64 Years | 12 (10.9%) | 0 (0.0%) |
| 65 to 74 Years | 8 (17.0%) | 19 (51.3%) |
| 75 Years and over | 12 (50.0%) | 20 (52.6%) |
Disability Class by Sex by Age in Farmington
Disability Class: Hearing Difficulty
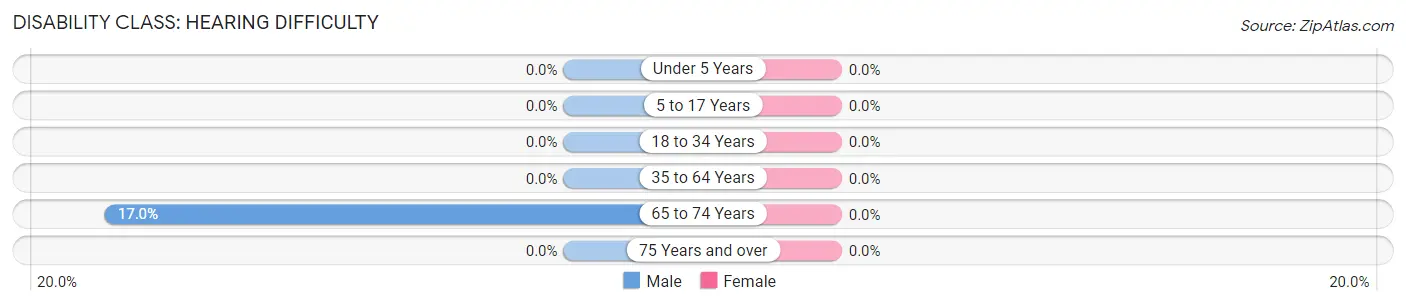
| Age Bracket | Male | Female |
| Under 5 Years | 0 (0.0%) | 0 (0.0%) |
| 5 to 17 Years | 0 (0.0%) | 0 (0.0%) |
| 18 to 34 Years | 0 (0.0%) | 0 (0.0%) |
| 35 to 64 Years | 0 (0.0%) | 0 (0.0%) |
| 65 to 74 Years | 8 (17.0%) | 0 (0.0%) |
| 75 Years and over | 0 (0.0%) | 0 (0.0%) |
Disability Class: Vision Difficulty
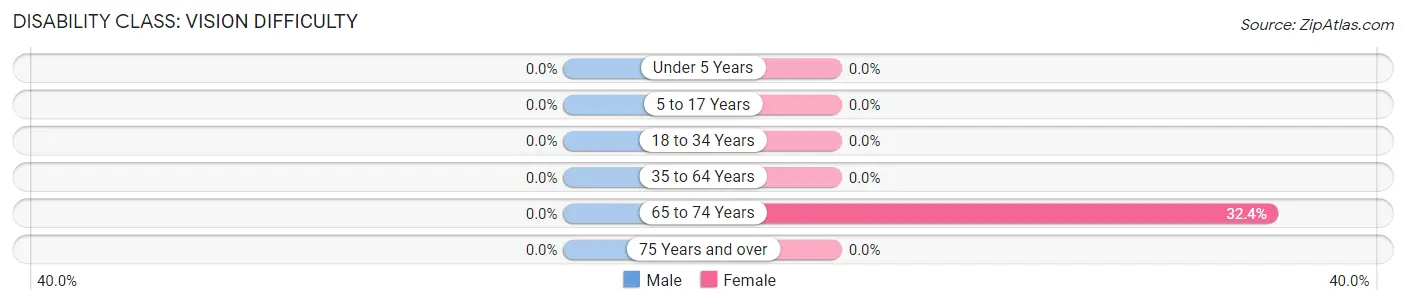
| Age Bracket | Male | Female |
| Under 5 Years | 0 (0.0%) | 0 (0.0%) |
| 5 to 17 Years | 0 (0.0%) | 0 (0.0%) |
| 18 to 34 Years | 0 (0.0%) | 0 (0.0%) |
| 35 to 64 Years | 0 (0.0%) | 0 (0.0%) |
| 65 to 74 Years | 0 (0.0%) | 12 (32.4%) |
| 75 Years and over | 0 (0.0%) | 0 (0.0%) |
Disability Class: Cognitive Difficulty
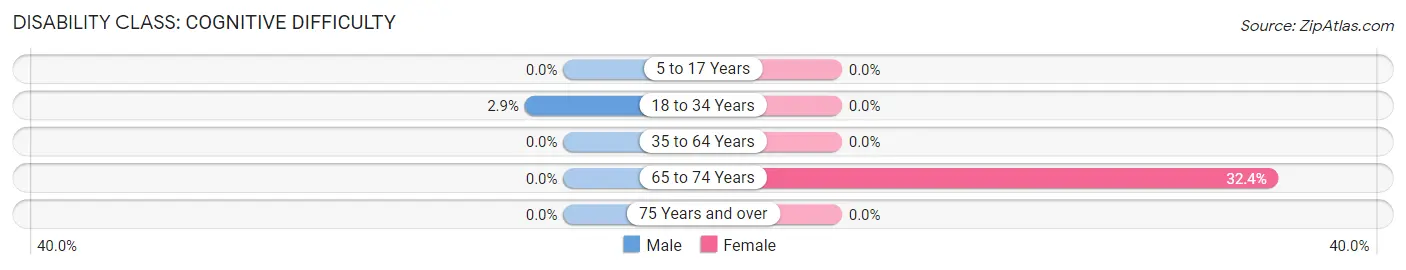
| Age Bracket | Male | Female |
| 5 to 17 Years | 0 (0.0%) | 0 (0.0%) |
| 18 to 34 Years | 5 (2.9%) | 0 (0.0%) |
| 35 to 64 Years | 0 (0.0%) | 0 (0.0%) |
| 65 to 74 Years | 0 (0.0%) | 12 (32.4%) |
| 75 Years and over | 0 (0.0%) | 0 (0.0%) |
Disability Class: Ambulatory Difficulty
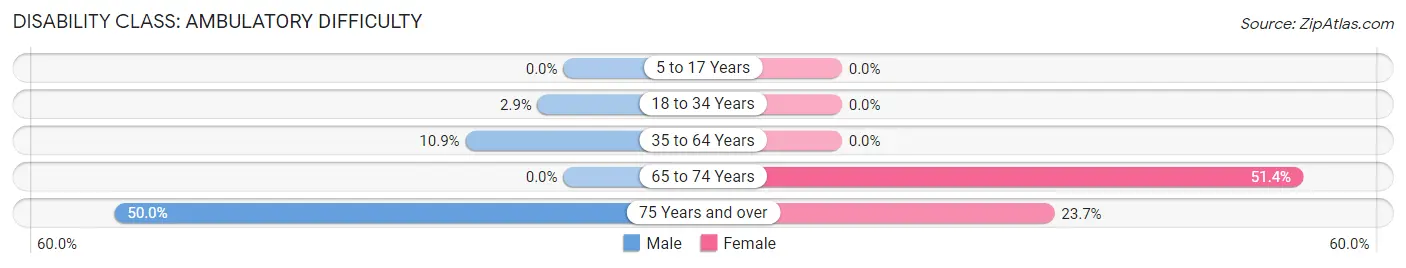
| Age Bracket | Male | Female |
| 5 to 17 Years | 0 (0.0%) | 0 (0.0%) |
| 18 to 34 Years | 5 (2.9%) | 0 (0.0%) |
| 35 to 64 Years | 12 (10.9%) | 0 (0.0%) |
| 65 to 74 Years | 0 (0.0%) | 19 (51.3%) |
| 75 Years and over | 12 (50.0%) | 9 (23.7%) |
Disability Class: Self-Care Difficulty
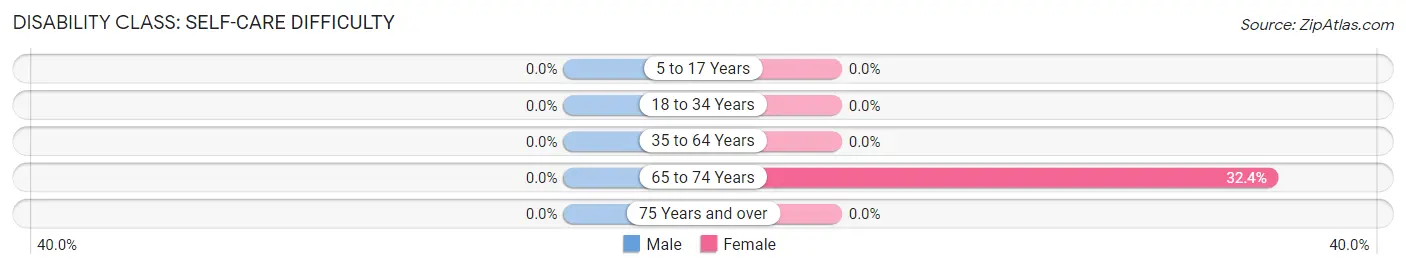
| Age Bracket | Male | Female |
| 5 to 17 Years | 0 (0.0%) | 0 (0.0%) |
| 18 to 34 Years | 0 (0.0%) | 0 (0.0%) |
| 35 to 64 Years | 0 (0.0%) | 0 (0.0%) |
| 65 to 74 Years | 0 (0.0%) | 12 (32.4%) |
| 75 Years and over | 0 (0.0%) | 0 (0.0%) |
Technology Access in Farmington
Computing Device Access in Farmington
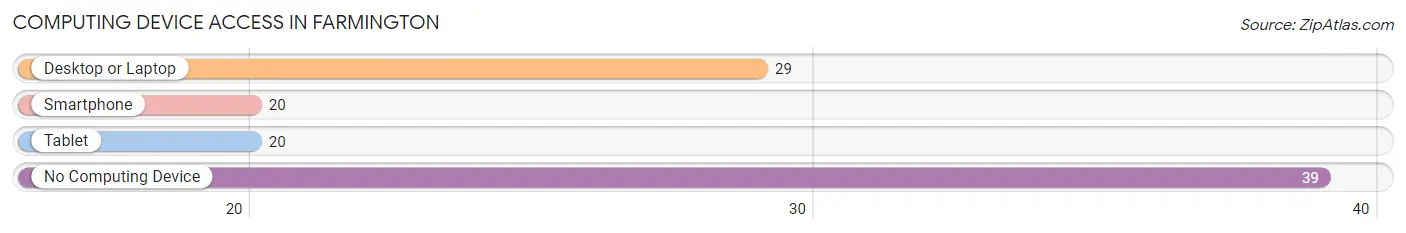
| Device Type | # Households | % Households |
| Desktop or Laptop | 29 | 42.6% |
| Smartphone | 20 | 29.4% |
| Tablet | 20 | 29.4% |
| No Computing Device | 39 | 57.4% |
| Total | 68 | 100.0% |
Internet Access in Farmington
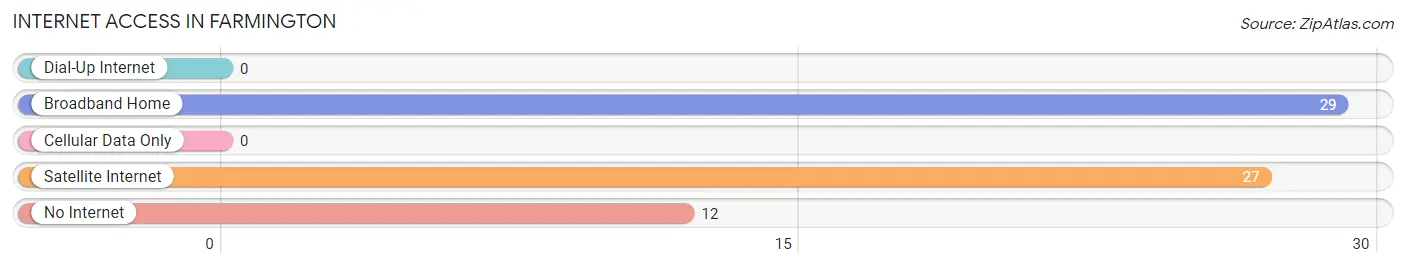
| Internet Type | # Households | % Households |
| Dial-Up Internet | 0 | 0.0% |
| Broadband Home | 29 | 42.6% |
| Cellular Data Only | 0 | 0.0% |
| Satellite Internet | 27 | 39.7% |
| No Internet | 12 | 17.6% |
| Total | 68 | 100.0% |
Farmington Summary
History
The history of Farmington, Pennsylvania dates back to the late 1700s when the area was first settled by European settlers. The town was originally known as “Farmington” due to its agricultural nature. The town was officially incorporated in 1817 and has since grown to become a thriving community.
The town of Farmington was originally part of the larger township of Farmington Township, which was established in 1788. The township was divided into two parts in 1817, with the northern part becoming Farmington Borough. The town was named after the original settler, John Farmington, who had purchased the land from the local Native Americans.
The town of Farmington has a rich history of industry and commerce. In the early 1800s, the town was home to several mills, including a sawmill, gristmill, and a woolen mill. The town also had a tannery, a blacksmith shop, and a general store.
In the late 1800s, the town began to experience a period of growth and development. The railroad arrived in 1871, connecting the town to the larger cities of Pittsburgh and Philadelphia. This allowed for increased trade and commerce, as well as the growth of the local economy.
The town of Farmington continued to grow and develop throughout the 20th century. In the 1950s, the town experienced a period of suburbanization, as many people moved from the city to the suburbs. This led to the development of new housing developments, shopping centers, and other amenities.
Geography
Farmington is located in Washington County, Pennsylvania, approximately 30 miles south of Pittsburgh. The town is situated in the foothills of the Allegheny Mountains and is surrounded by rolling hills and farmland. The town is located along the Monongahela River, which provides a scenic backdrop for the town.
The town of Farmington covers an area of 2.3 square miles and has a population of approximately 2,500 people. The town is located at an elevation of 1,000 feet above sea level and has a humid continental climate.
Economy
The economy of Farmington is largely based on agriculture and tourism. The town is home to several farms, which produce a variety of crops, including corn, soybeans, wheat, and hay. The town is also home to several wineries, which produce a variety of wines.
The town is also home to several small businesses, including restaurants, retail stores, and professional services. The town is also home to several manufacturing companies, which produce a variety of products, including furniture, clothing, and electronics.
Demographics
As of the 2010 census, the population of Farmington was 2,500 people. The town has a median age of 44.7 years and a median household income of $50,000. The town is predominantly white, with 92.2% of the population identifying as white. The town also has a small Hispanic population, with 4.4% of the population identifying as Hispanic or Latino.
Conclusion
Farmington, Pennsylvania is a small town with a rich history and a vibrant economy. The town is home to several farms, wineries, and small businesses, which provide employment opportunities for the local population. The town is also home to a diverse population, with a median age of 44.7 years and a median household income of $50,000. The town is predominantly white, with 92.2% of the population identifying as white. The town also has a small Hispanic population, with 4.4% of the population identifying as Hispanic or Latino.
Common Questions
What is Per Capita Income in Farmington?
Per Capita income in Farmington is $8,384.
What is the Median Household income in Farmington?
Median Household Income in Farmington is $73,981.
What is Inequality or Gini Index in Farmington?
Inequality or Gini Index in Farmington is 0.40.
What is the Total Population of Farmington?
Total Population of Farmington is 971.
What is the Total Male Population of Farmington?
Total Male Population of Farmington is 444.
What is the Total Female Population of Farmington?
Total Female Population of Farmington is 527.
What is the Ratio of Males per 100 Females in Farmington?
There are 84.25 Males per 100 Females in Farmington.
What is the Ratio of Females per 100 Males in Farmington?
There are 118.69 Females per 100 Males in Farmington.
What is the Median Population Age in Farmington?
Median Population Age in Farmington is 32.4 Years.
What is the Average Family Size in Farmington
Average Family Size in Farmington is 2.9 People.
What is the Average Household Size in Farmington
Average Household Size in Farmington is 2.2 People.
How Large is the Labor Force in Farmington?
There are 106 People in the Labor Forcein in Farmington.
What is the Percentage of People in the Labor Force in Farmington?
14.5% of People are in the Labor Force in Farmington.
What is the Unemployment Rate in Farmington?
Unemployment Rate in Farmington is 5.7%.