Cities with the Largest Carpatho Rusyn Community in Pennsylvania
RELATED REPORTS & OPTIONS
Carpatho Rusyn
Pennsylvania
Compare Cities
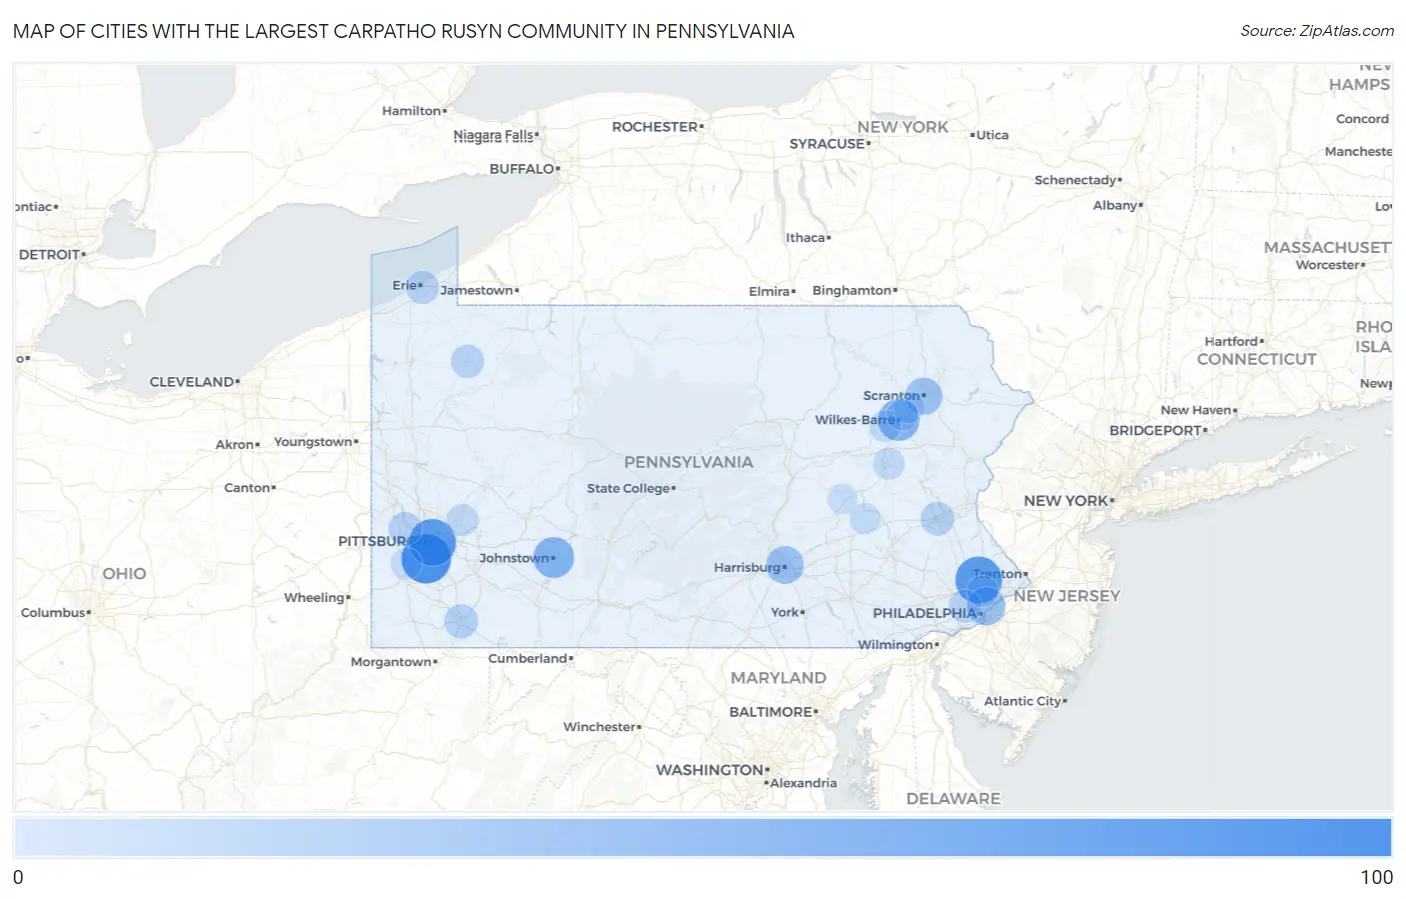
Map of Cities with the Largest Carpatho Rusyn Community in Pennsylvania
0
100
Cities with the Largest Carpatho Rusyn Community in Pennsylvania
| City | Carpatho Rusyn | vs State | vs National | |
| 1. | Bethel Park | 95 | 2,540(3.74%)#1 | 8,669(1.10%)#7 |
| 2. | Pittsburgh | 83 | 2,540(3.27%)#2 | 8,669(0.96%)#10 |
| 3. | Maple Glen | 82 | 2,540(3.23%)#3 | 8,669(0.95%)#11 |
| 4. | Beaver Borough | 59 | 2,540(2.32%)#4 | 8,669(0.68%)#19 |
| 5. | West Mifflin Borough | 57 | 2,540(2.24%)#5 | 8,669(0.66%)#21 |
| 6. | Plum Borough | 56 | 2,540(2.20%)#6 | 8,669(0.65%)#22 |
| 7. | Wilkes Barre | 55 | 2,540(2.17%)#7 | 8,669(0.63%)#23 |
| 8. | Economy Borough | 55 | 2,540(2.17%)#8 | 8,669(0.63%)#24 |
| 9. | Johnstown | 52 | 2,540(2.05%)#9 | 8,669(0.60%)#26 |
| 10. | Wyoming Borough | 42 | 2,540(1.65%)#10 | 8,669(0.48%)#32 |
| 11. | Philadelphia | 40 | 2,540(1.57%)#11 | 8,669(0.46%)#34 |
| 12. | Greenville Borough | 39 | 2,540(1.54%)#12 | 8,669(0.45%)#36 |
| 13. | Harrisburg | 37 | 2,540(1.46%)#13 | 8,669(0.43%)#39 |
| 14. | Scranton | 34 | 2,540(1.34%)#14 | 8,669(0.39%)#45 |
| 15. | Forest Hills Borough | 29 | 2,540(1.14%)#15 | 8,669(0.33%)#56 |
| 16. | St Clair Borough | 28 | 2,540(1.10%)#16 | 8,669(0.32%)#58 |
| 17. | Palmyra Borough | 26 | 2,540(1.02%)#17 | 8,669(0.30%)#69 |
| 18. | Clarks Summit Borough | 25 | 2,540(0.98%)#18 | 8,669(0.29%)#70 |
| 19. | Carlisle Borough | 23 | 2,540(0.91%)#19 | 8,669(0.27%)#79 |
| 20. | Mount Pleasant Borough | 23 | 2,540(0.91%)#20 | 8,669(0.27%)#82 |
| 21. | State College Borough | 20 | 2,540(0.79%)#21 | 8,669(0.23%)#94 |
| 22. | Mount Joy Borough | 20 | 2,540(0.79%)#22 | 8,669(0.23%)#96 |
| 23. | Brookhaven Borough | 19 | 2,540(0.75%)#23 | 8,669(0.22%)#102 |
| 24. | Uniontown | 18 | 2,540(0.71%)#24 | 8,669(0.21%)#110 |
| 25. | Malvern Borough | 17 | 2,540(0.67%)#25 | 8,669(0.20%)#121 |
| 26. | Geistown Borough | 17 | 2,540(0.67%)#26 | 8,669(0.20%)#122 |
| 27. | Cetronia | 17 | 2,540(0.67%)#27 | 8,669(0.20%)#123 |
| 28. | Carnot Moon | 16 | 2,540(0.63%)#28 | 8,669(0.18%)#130 |
| 29. | Erie | 15 | 2,540(0.59%)#29 | 8,669(0.17%)#135 |
| 30. | Wilkinsburg Borough | 15 | 2,540(0.59%)#30 | 8,669(0.17%)#137 |
| 31. | Titusville | 15 | 2,540(0.59%)#31 | 8,669(0.17%)#143 |
| 32. | Ardmore | 13 | 2,540(0.51%)#32 | 8,669(0.15%)#156 |
| 33. | Archbald Borough | 13 | 2,540(0.51%)#33 | 8,669(0.15%)#160 |
| 34. | Baldwin Borough | 11 | 2,540(0.43%)#34 | 8,669(0.13%)#184 |
| 35. | Nesquehoning Borough | 11 | 2,540(0.43%)#35 | 8,669(0.13%)#189 |
| 36. | Ford City Borough | 11 | 2,540(0.43%)#36 | 8,669(0.13%)#190 |
| 37. | Derry Borough | 11 | 2,540(0.43%)#37 | 8,669(0.13%)#191 |
| 38. | Kingston Borough | 10 | 2,540(0.39%)#38 | 8,669(0.12%)#207 |
| 39. | Crafton Borough | 10 | 2,540(0.39%)#39 | 8,669(0.12%)#211 |
| 40. | Lower Burrell | 9 | 2,540(0.35%)#40 | 8,669(0.10%)#227 |
| 41. | Greencastle Borough | 9 | 2,540(0.35%)#41 | 8,669(0.10%)#229 |
| 42. | Bedford Borough | 9 | 2,540(0.35%)#42 | 8,669(0.10%)#230 |
| 43. | Dupont Borough | 9 | 2,540(0.35%)#43 | 8,669(0.10%)#231 |
| 44. | Hazleton | 8 | 2,540(0.31%)#44 | 8,669(0.09%)#235 |
| 45. | Nanticoke | 8 | 2,540(0.31%)#45 | 8,669(0.09%)#242 |
| 46. | Canonsburg Borough | 8 | 2,540(0.31%)#46 | 8,669(0.09%)#244 |
| 47. | Bala Cynwyd | 8 | 2,540(0.31%)#47 | 8,669(0.09%)#245 |
| 48. | Pleasant Hills Borough | 8 | 2,540(0.31%)#48 | 8,669(0.09%)#246 |
| 49. | Millvale Borough | 8 | 2,540(0.31%)#49 | 8,669(0.09%)#248 |
| 50. | Perryopolis Borough | 8 | 2,540(0.31%)#50 | 8,669(0.09%)#250 |
| 51. | Falls Creek Borough | 8 | 2,540(0.31%)#51 | 8,669(0.09%)#251 |
| 52. | Swissvale Borough | 7 | 2,540(0.28%)#52 | 8,669(0.08%)#261 |
| 53. | Aldan Borough | 7 | 2,540(0.28%)#53 | 8,669(0.08%)#263 |
| 54. | Rankin Borough | 7 | 2,540(0.28%)#54 | 8,669(0.08%)#265 |
| 55. | Paint Borough | 7 | 2,540(0.28%)#55 | 8,669(0.08%)#266 |
| 56. | Rosslyn Farms Borough | 7 | 2,540(0.28%)#56 | 8,669(0.08%)#268 |
| 57. | Allenport Borough | 7 | 2,540(0.28%)#57 | 8,669(0.08%)#269 |
| 58. | Pittston | 6 | 2,540(0.24%)#58 | 8,669(0.07%)#284 |
| 59. | Muse | 6 | 2,540(0.24%)#59 | 8,669(0.07%)#288 |
| 60. | Georgetown Cdp Luzerne County | 6 | 2,540(0.24%)#60 | 8,669(0.07%)#289 |
| 61. | Cheswick Borough | 6 | 2,540(0.24%)#61 | 8,669(0.07%)#290 |
| 62. | Roscoe Borough | 6 | 2,540(0.24%)#62 | 8,669(0.07%)#291 |
| 63. | Glenside | 5 | 2,540(0.20%)#63 | 8,669(0.06%)#299 |
| 64. | Chestnut Hill | 5 | 2,540(0.20%)#64 | 8,669(0.06%)#300 |
| 65. | Plains | 5 | 2,540(0.20%)#65 | 8,669(0.06%)#301 |
| 66. | Lake Wynonah | 5 | 2,540(0.20%)#66 | 8,669(0.06%)#303 |
| 67. | Homestead Borough | 5 | 2,540(0.20%)#67 | 8,669(0.06%)#304 |
| 68. | Mcadoo Borough | 5 | 2,540(0.20%)#68 | 8,669(0.06%)#306 |
| 69. | South Coatesville Borough | 5 | 2,540(0.20%)#69 | 8,669(0.06%)#307 |
| 70. | West Homestead Borough | 5 | 2,540(0.20%)#70 | 8,669(0.06%)#308 |
| 71. | Southmont Borough | 4 | 2,540(0.16%)#71 | 8,669(0.05%)#314 |
| 72. | Whitaker Borough | 4 | 2,540(0.16%)#72 | 8,669(0.05%)#319 |
| 73. | Beaver Meadows Borough | 4 | 2,540(0.16%)#73 | 8,669(0.05%)#321 |
| 74. | Monroe Borough | 4 | 2,540(0.16%)#74 | 8,669(0.05%)#322 |
| 75. | Middleburg Borough | 3 | 2,540(0.12%)#75 | 8,669(0.03%)#329 |
| 76. | Osceola Mills Borough | 3 | 2,540(0.12%)#76 | 8,669(0.03%)#330 |
| 77. | Scalp Level Borough | 3 | 2,540(0.12%)#77 | 8,669(0.03%)#332 |
| 78. | Brownstown Borough | 3 | 2,540(0.12%)#78 | 8,669(0.03%)#333 |
| 79. | South Waverly Borough | 2 | 2,540(0.08%)#79 | 8,669(0.02%)#338 |
| 80. | West Middlesex Borough | 2 | 2,540(0.08%)#80 | 8,669(0.02%)#339 |
| 81. | Lincoln Borough | 2 | 2,540(0.08%)#81 | 8,669(0.02%)#341 |
| 82. | Laurel Run Borough | 2 | 2,540(0.08%)#82 | 8,669(0.02%)#343 |
| 83. | Beurys Lake | 2 | 2,540(0.08%)#83 | 8,669(0.02%)#345 |
| 84. | Homer City Borough | 1 | 2,540(0.04%)#84 | 8,669(0.01%)#346 |
| 85. | Chalfant Borough | 1 | 2,540(0.04%)#85 | 8,669(0.01%)#349 |
| 86. | Thornburg Borough | 1 | 2,540(0.04%)#86 | 8,669(0.01%)#350 |
Common Questions
What are the Top 10 Cities with the Largest Carpatho Rusyn Community in Pennsylvania?
Top 10 Cities with the Largest Carpatho Rusyn Community in Pennsylvania are:
#1
95
#2
83
#3
82
#4
55
#5
52
#6
40
#7
37
#8
34
#9
18
#10
17
What city has the Largest Carpatho Rusyn Community in Pennsylvania?
Bethel Park has the Largest Carpatho Rusyn Community in Pennsylvania with 95.
What is the Total Carpatho Rusyn Population in the State of Pennsylvania?
Total Carpatho Rusyn Population in Pennsylvania is 2,540.
What is the Total Carpatho Rusyn Population in the United States?
Total Carpatho Rusyn Population in the United States is 8,669.