Grampian borough, PA Map & Demographics
Grampian borough Overview
$24,541
PER CAPITA INCOME
$56,250
AVG FAMILY INCOME
$50,625
AVG HOUSEHOLD INCOME
0.48
INEQUALITY / GINI INDEX
482
TOTAL POPULATION
255
MALE POPULATION
227
FEMALE POPULATION
112.33
MALES / 100 FEMALES
89.02
FEMALES / 100 MALES
40.0
MEDIAN AGE
2.9
AVG FAMILY SIZE
2.6
AVG HOUSEHOLD SIZE
283
LABOR FORCE [ PEOPLE ]
71.5%
PERCENT IN LABOR FORCE
16.7%
UNEMPLOYMENT RATE
Income in Grampian borough
Income Overview in Grampian borough
Per Capita Income in Grampian borough is $24,541, while median incomes of families and households are $56,250 and $50,625 respectively.
| Characteristic | Number | Measure |
| Per Capita Income | 482 | $24,541 |
| Median Family Income | 137 | $56,250 |
| Mean Family Income | 137 | $71,048 |
| Median Household Income | 188 | $50,625 |
| Mean Household Income | 188 | $63,095 |
| Income Deficit | 137 | $0 |
| Wage / Income Gap (%) | 482 | 0.00% |
| Wage / Income Gap ($) | 482 | 100.00¢ per $1 |
| Gini / Inequality Index | 482 | 0.48 |
Earnings by Sex in Grampian borough
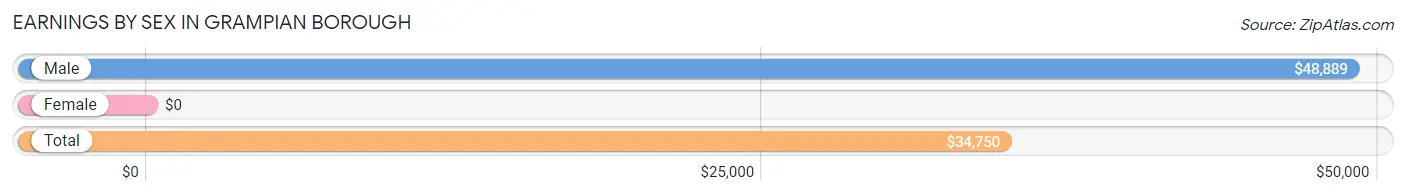
| Sex | Number | Average Earnings |
| Male | 112 (43.9%) | $48,889 |
| Female | 143 (56.1%) | $0 |
| Total | 255 (100.0%) | $34,750 |
Earnings by Sex by Income Bracket in Grampian borough
The most common earnings brackets in Grampian borough are $55,000 to $64,999 for men (16 | 14.3%) and $5,000 to $7,499 for women (42 | 29.4%).
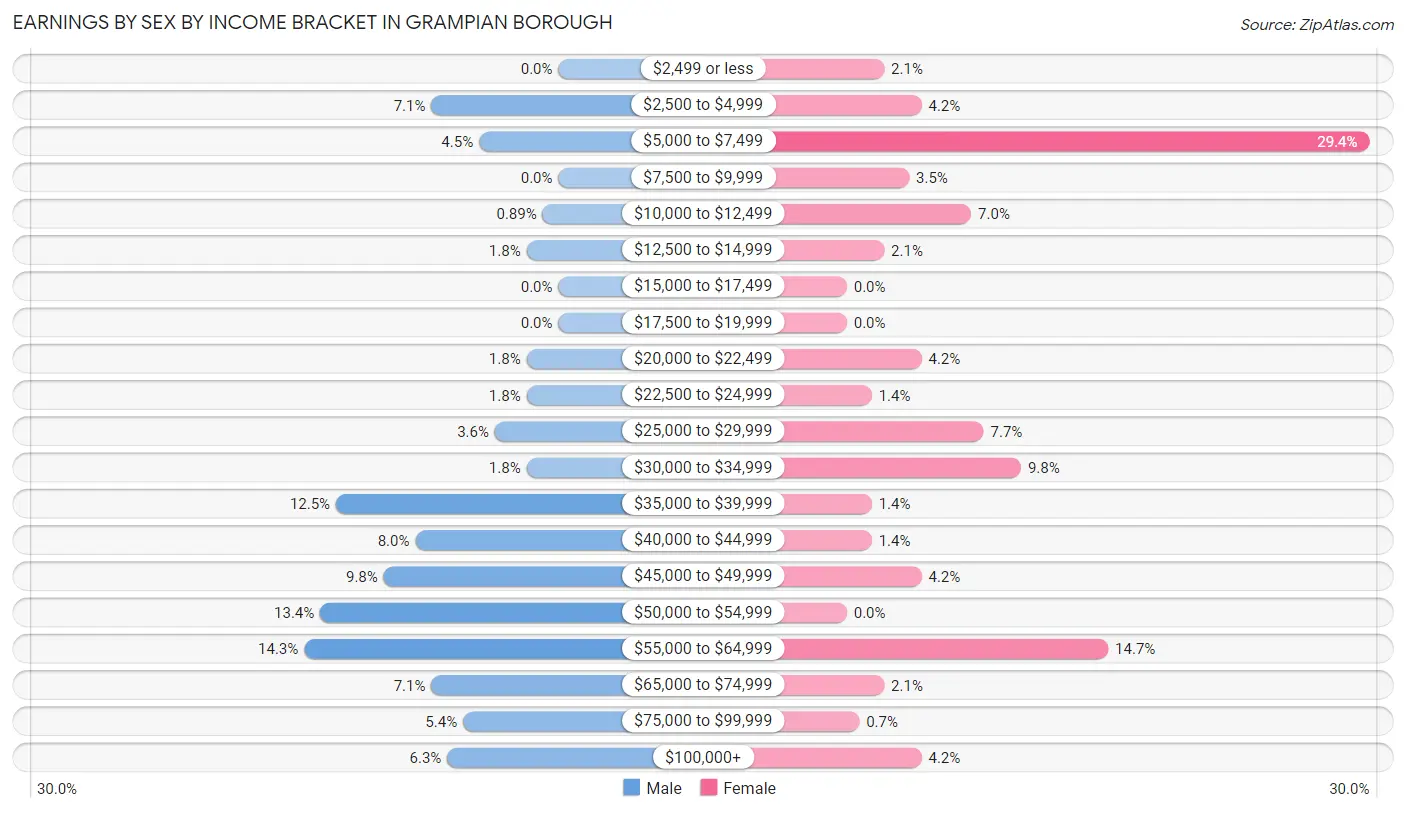
| Income | Male | Female |
| $2,499 or less | 0 (0.0%) | 3 (2.1%) |
| $2,500 to $4,999 | 8 (7.1%) | 6 (4.2%) |
| $5,000 to $7,499 | 5 (4.5%) | 42 (29.4%) |
| $7,500 to $9,999 | 0 (0.0%) | 5 (3.5%) |
| $10,000 to $12,499 | 1 (0.9%) | 10 (7.0%) |
| $12,500 to $14,999 | 2 (1.8%) | 3 (2.1%) |
| $15,000 to $17,499 | 0 (0.0%) | 0 (0.0%) |
| $17,500 to $19,999 | 0 (0.0%) | 0 (0.0%) |
| $20,000 to $22,499 | 2 (1.8%) | 6 (4.2%) |
| $22,500 to $24,999 | 2 (1.8%) | 2 (1.4%) |
| $25,000 to $29,999 | 4 (3.6%) | 11 (7.7%) |
| $30,000 to $34,999 | 2 (1.8%) | 14 (9.8%) |
| $35,000 to $39,999 | 14 (12.5%) | 2 (1.4%) |
| $40,000 to $44,999 | 9 (8.0%) | 2 (1.4%) |
| $45,000 to $49,999 | 11 (9.8%) | 6 (4.2%) |
| $50,000 to $54,999 | 15 (13.4%) | 0 (0.0%) |
| $55,000 to $64,999 | 16 (14.3%) | 21 (14.7%) |
| $65,000 to $74,999 | 8 (7.1%) | 3 (2.1%) |
| $75,000 to $99,999 | 6 (5.4%) | 1 (0.7%) |
| $100,000+ | 7 (6.2%) | 6 (4.2%) |
| Total | 112 (100.0%) | 143 (100.0%) |
Earnings by Sex by Educational Attainment in Grampian borough
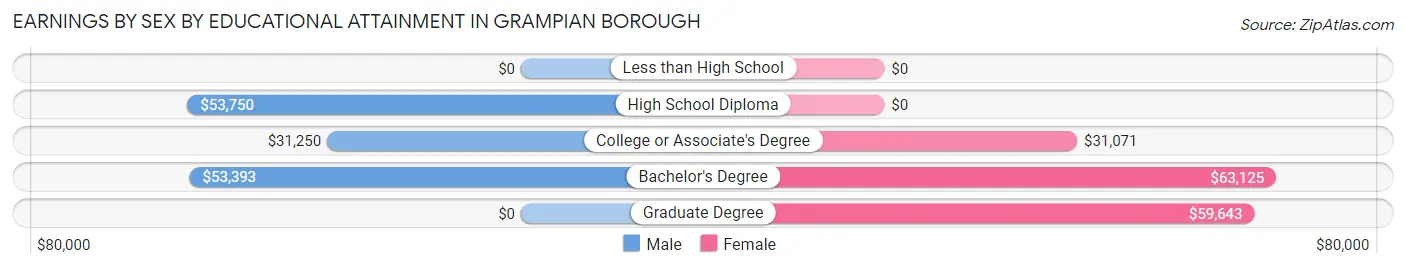
| Educational Attainment | Male Income | Female Income |
| Less than High School | - | - |
| High School Diploma | $53,750 | $0 |
| College or Associate's Degree | $31,250 | $31,071 |
| Bachelor's Degree | $53,393 | $63,125 |
| Graduate Degree | - | - |
| Total | $53,125 | $0 |
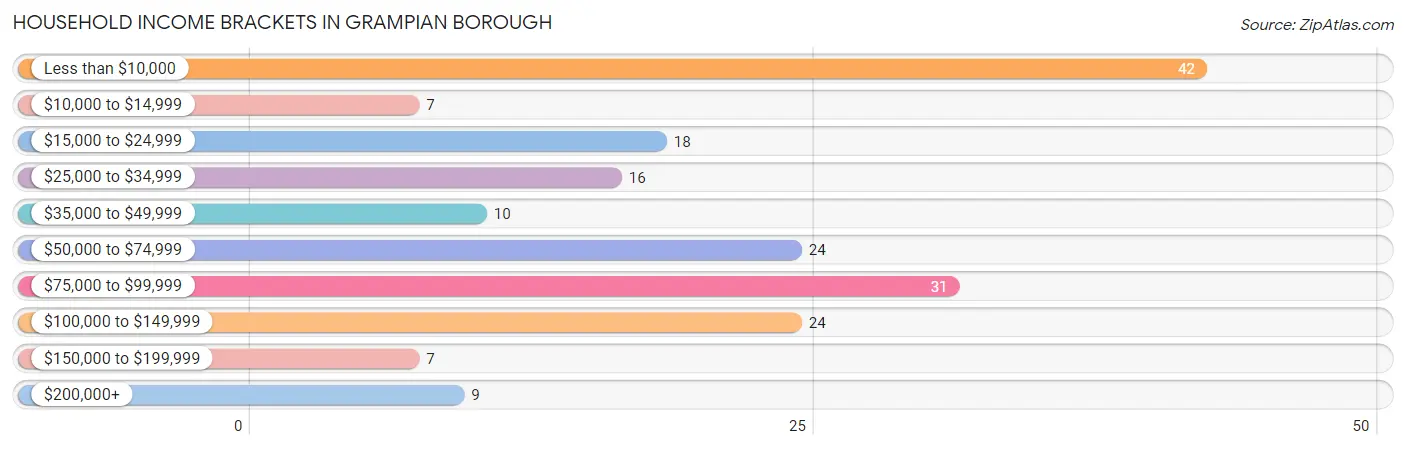
Family Income in Grampian borough
Family Income Brackets in Grampian borough
According to the Grampian borough family income data, there are 40 families falling into the less than $10,000 income range, which is the most common income bracket and makes up 29.2% of all families.
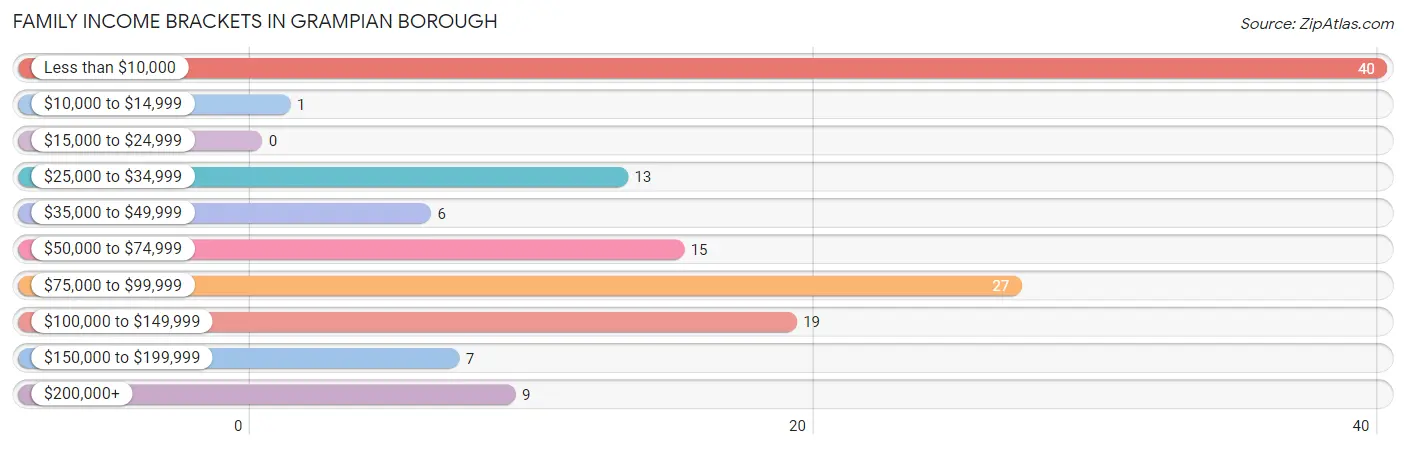
| Income Bracket | # Families | % Families |
| Less than $10,000 | 40 | 29.2% |
| $10,000 to $14,999 | 1 | 0.7% |
| $15,000 to $24,999 | 0 | 0.0% |
| $25,000 to $34,999 | 13 | 9.5% |
| $35,000 to $49,999 | 6 | 4.4% |
| $50,000 to $74,999 | 15 | 10.9% |
| $75,000 to $99,999 | 27 | 19.7% |
| $100,000 to $149,999 | 19 | 13.9% |
| $150,000 to $199,999 | 7 | 5.1% |
| $200,000+ | 9 | 6.6% |
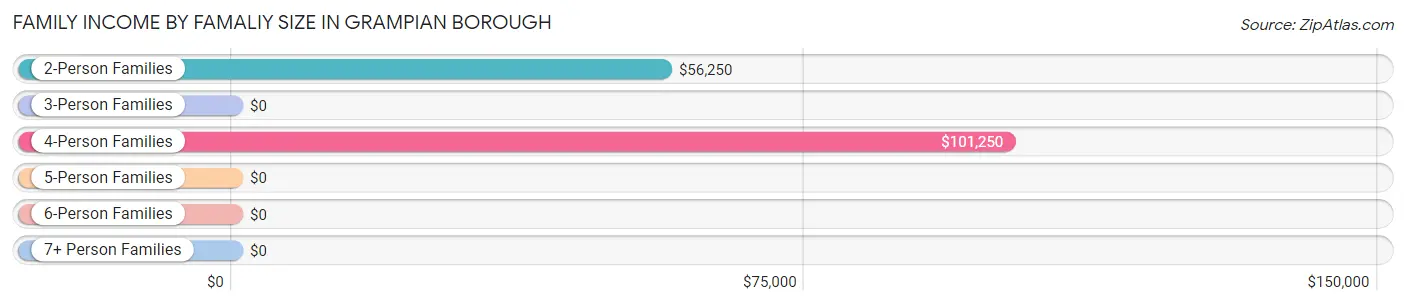
Family Income by Famaliy Size in Grampian borough
4-person families (31 | 22.6%) account for the highest median family income in Grampian borough with $101,250 per family, while 2-person families (36 | 26.3%) have the highest median income of $28,125 per family member.
| Income Bracket | # Families | Median Income |
| 2-Person Families | 36 (26.3%) | $56,250 |
| 3-Person Families | 62 (45.3%) | $0 |
| 4-Person Families | 31 (22.6%) | $101,250 |
| 5-Person Families | 6 (4.4%) | $0 |
| 6-Person Families | 2 (1.5%) | $0 |
| 7+ Person Families | 0 (0.0%) | $0 |
| Total | 137 (100.0%) | $56,250 |
Family Income by Number of Earners in Grampian borough
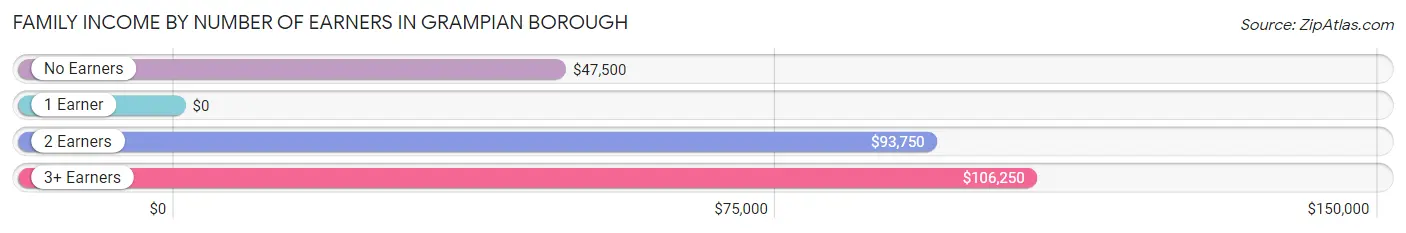
| Number of Earners | # Families | Median Income |
| No Earners | 14 (10.2%) | $47,500 |
| 1 Earner | 55 (40.2%) | $0 |
| 2 Earners | 40 (29.2%) | $93,750 |
| 3+ Earners | 28 (20.4%) | $106,250 |
| Total | 137 (100.0%) | $56,250 |
Household Income in Grampian borough
Household Income Brackets in Grampian borough
With 42 households falling in the category, the less than $10,000 income range is the most frequent in Grampian borough, accounting for 22.3% of all households. In contrast, only 7 households (3.7%) fall into the $10,000 to $14,999 income bracket, making it the least populous group.
| Income Bracket | # Households | % Households |
| Less than $10,000 | 42 | 22.3% |
| $10,000 to $14,999 | 7 | 3.7% |
| $15,000 to $24,999 | 18 | 9.6% |
| $25,000 to $34,999 | 16 | 8.5% |
| $35,000 to $49,999 | 10 | 5.3% |
| $50,000 to $74,999 | 24 | 12.8% |
| $75,000 to $99,999 | 31 | 16.5% |
| $100,000 to $149,999 | 24 | 12.8% |
| $150,000 to $199,999 | 7 | 3.7% |
| $200,000+ | 9 | 4.8% |
Household Income by Householder Age in Grampian borough
The median household income in Grampian borough is $50,625, with the highest median household income of $90,000 found in the 25 to 44 years age bracket for the primary householder. A total of 46 households (24.5%) fall into this category.
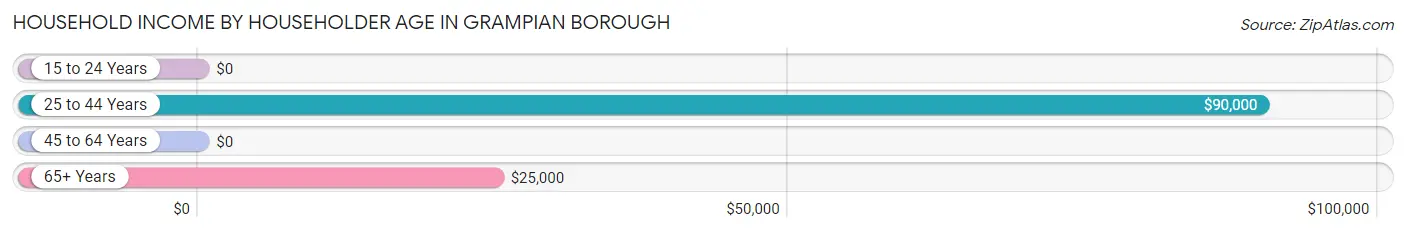
| Income Bracket | # Households | Median Income |
| 15 to 24 Years | 0 (0.0%) | $0 |
| 25 to 44 Years | 46 (24.5%) | $90,000 |
| 45 to 64 Years | 92 (48.9%) | $0 |
| 65+ Years | 50 (26.6%) | $25,000 |
| Total | 188 (100.0%) | $50,625 |
Poverty in Grampian borough
Income Below Poverty by Sex and Age in Grampian borough
With 20.9% poverty level for males and 21.6% for females among the residents of Grampian borough, 18 to 24 year old males and 45 to 54 year old females are the most vulnerable to poverty, with 40 males (67.8%) and 40 females (69.0%) in their respective age groups living below the poverty level.
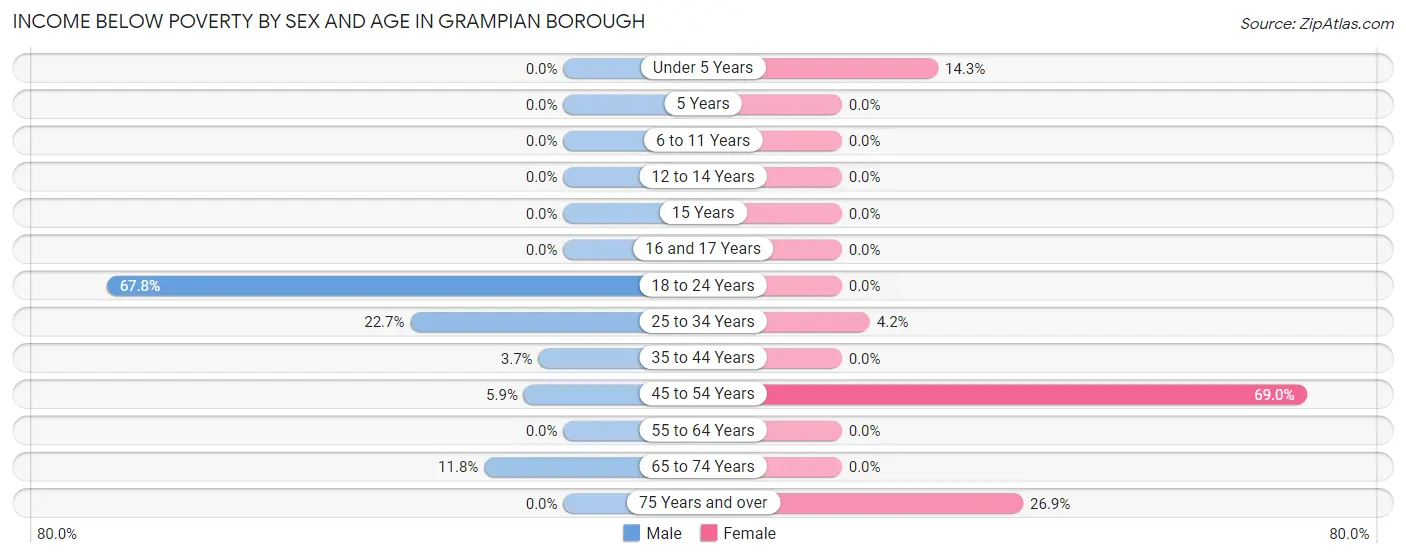
| Age Bracket | Male | Female |
| Under 5 Years | 0 (0.0%) | 1 (14.3%) |
| 5 Years | 0 (0.0%) | 0 (0.0%) |
| 6 to 11 Years | 0 (0.0%) | 0 (0.0%) |
| 12 to 14 Years | 0 (0.0%) | 0 (0.0%) |
| 15 Years | 0 (0.0%) | 0 (0.0%) |
| 16 and 17 Years | 0 (0.0%) | 0 (0.0%) |
| 18 to 24 Years | 40 (67.8%) | 0 (0.0%) |
| 25 to 34 Years | 5 (22.7%) | 1 (4.2%) |
| 35 to 44 Years | 1 (3.7%) | 0 (0.0%) |
| 45 to 54 Years | 2 (5.9%) | 40 (69.0%) |
| 55 to 64 Years | 0 (0.0%) | 0 (0.0%) |
| 65 to 74 Years | 4 (11.8%) | 0 (0.0%) |
| 75 Years and over | 0 (0.0%) | 7 (26.9%) |
| Total | 52 (20.9%) | 49 (21.6%) |
Income Above Poverty by Sex and Age in Grampian borough
According to the poverty statistics in Grampian borough, males aged under 5 years and females aged 5 years are the age groups that are most secure financially, with 100.0% of males and 100.0% of females in these age groups living above the poverty line.
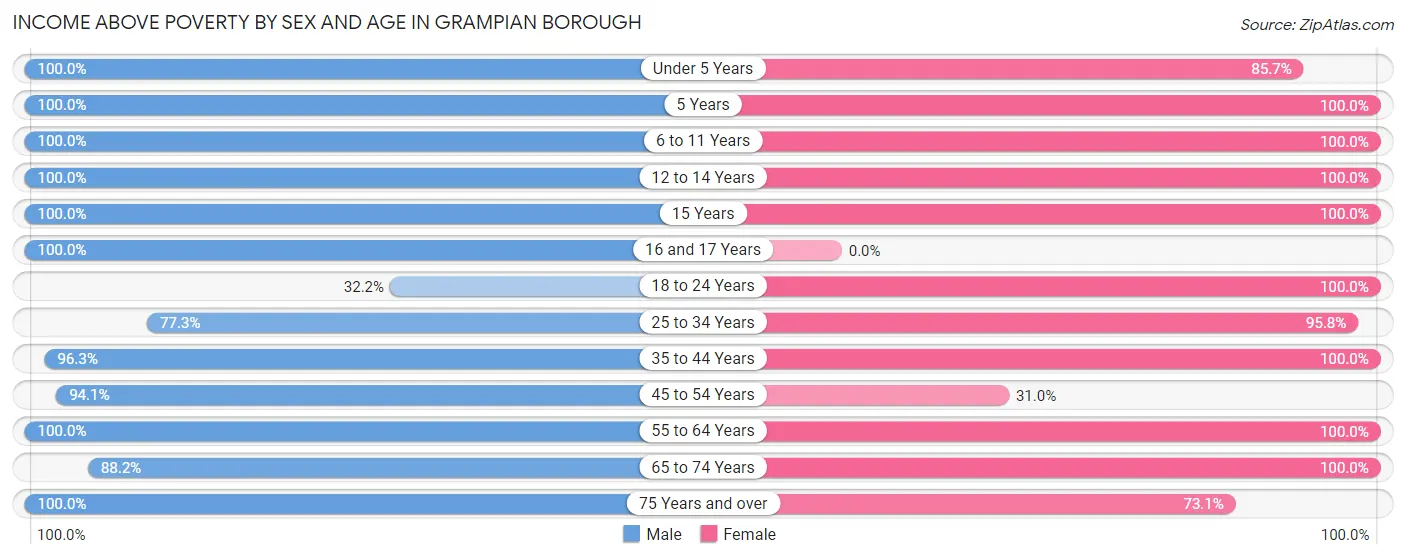
| Age Bracket | Male | Female |
| Under 5 Years | 2 (100.0%) | 6 (85.7%) |
| 5 Years | 4 (100.0%) | 2 (100.0%) |
| 6 to 11 Years | 33 (100.0%) | 23 (100.0%) |
| 12 to 14 Years | 2 (100.0%) | 5 (100.0%) |
| 15 Years | 1 (100.0%) | 1 (100.0%) |
| 16 and 17 Years | 3 (100.0%) | 0 (0.0%) |
| 18 to 24 Years | 19 (32.2%) | 19 (100.0%) |
| 25 to 34 Years | 17 (77.3%) | 23 (95.8%) |
| 35 to 44 Years | 26 (96.3%) | 32 (100.0%) |
| 45 to 54 Years | 32 (94.1%) | 18 (31.0%) |
| 55 to 64 Years | 24 (100.0%) | 17 (100.0%) |
| 65 to 74 Years | 30 (88.2%) | 13 (100.0%) |
| 75 Years and over | 4 (100.0%) | 19 (73.1%) |
| Total | 197 (79.1%) | 178 (78.4%) |
Income Below Poverty Among Married-Couple Families in Grampian borough
The poverty statistics for married-couple families in Grampian borough show that 1.2% or 1 of the total 85 families live below the poverty line. Families with no children have the highest poverty rate of 1.8%, comprising of 1 families. On the other hand, families with 1 or 2 children have the lowest poverty rate of 0.0%, which includes 0 families.
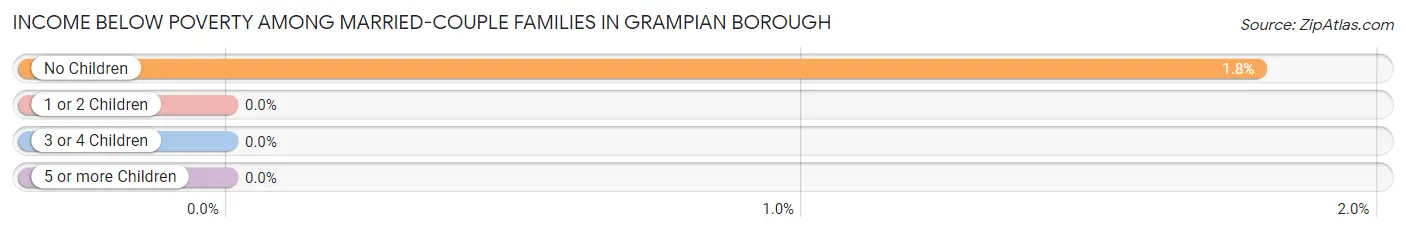
| Children | Above Poverty | Below Poverty |
| No Children | 55 (98.2%) | 1 (1.8%) |
| 1 or 2 Children | 27 (100.0%) | 0 (0.0%) |
| 3 or 4 Children | 2 (100.0%) | 0 (0.0%) |
| 5 or more Children | 0 (0.0%) | 0 (0.0%) |
| Total | 84 (98.8%) | 1 (1.2%) |
Income Below Poverty Among Single-Parent Households in Grampian borough
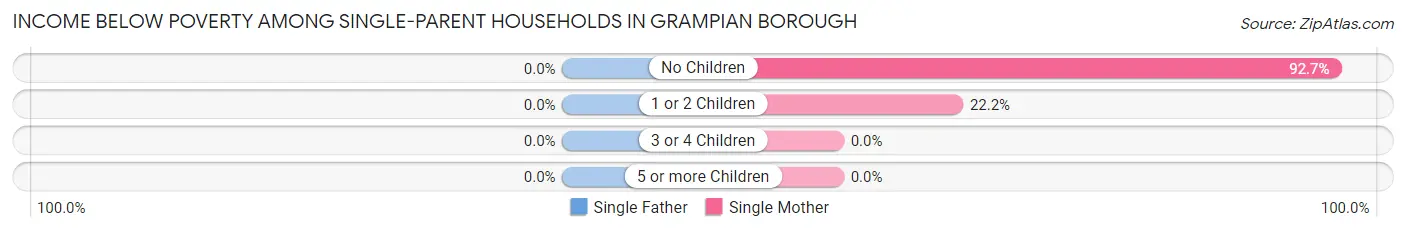
| Children | Single Father | Single Mother |
| No Children | 0 (0.0%) | 38 (92.7%) |
| 1 or 2 Children | 0 (0.0%) | 2 (22.2%) |
| 3 or 4 Children | 0 (0.0%) | 0 (0.0%) |
| 5 or more Children | 0 (0.0%) | 0 (0.0%) |
| Total | 0 (0.0%) | 40 (76.9%) |
Income Below Poverty Among Married-Couple vs Single-Parent Households in Grampian borough
The poverty data for Grampian borough shows that 1 of the married-couple family households (1.2%) and 40 of the single-parent households (76.9%) are living below the poverty level. Within the married-couple family households, those with no children have the highest poverty rate, with 1 households (1.8%) falling below the poverty line. Among the single-parent households, those with no children have the highest poverty rate, with 38 household (92.7%) living below poverty.
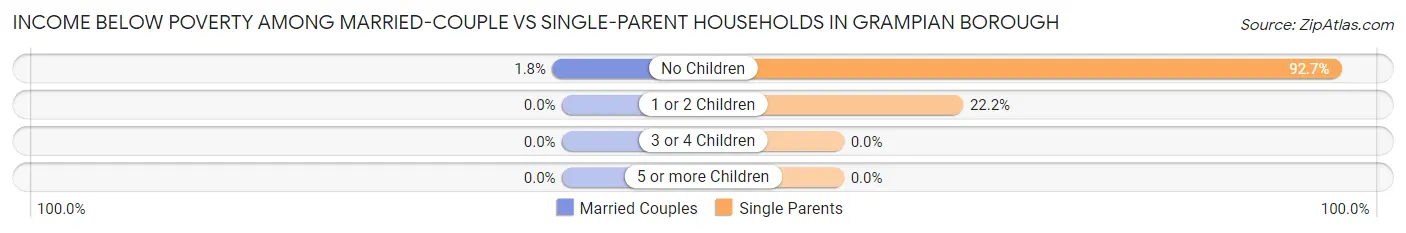
| Children | Married-Couple Families | Single-Parent Households |
| No Children | 1 (1.8%) | 38 (92.7%) |
| 1 or 2 Children | 0 (0.0%) | 2 (22.2%) |
| 3 or 4 Children | 0 (0.0%) | 0 (0.0%) |
| 5 or more Children | 0 (0.0%) | 0 (0.0%) |
| Total | 1 (1.2%) | 40 (76.9%) |
Race in Grampian borough
The most populous races in Grampian borough are White / Caucasian (480 | 99.6%), Asian (1 | 0.2%), and Two or more Races (1 | 0.2%).
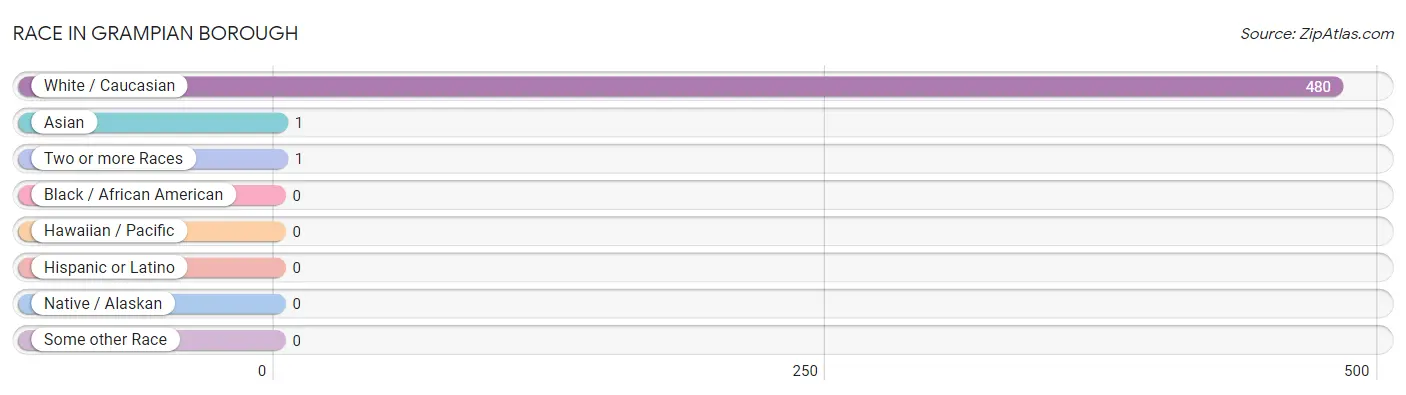
| Race | # Population | % Population |
| Asian | 1 | 0.2% |
| Black / African American | 0 | 0.0% |
| Hawaiian / Pacific | 0 | 0.0% |
| Hispanic or Latino | 0 | 0.0% |
| Native / Alaskan | 0 | 0.0% |
| White / Caucasian | 480 | 99.6% |
| Two or more Races | 1 | 0.2% |
| Some other Race | 0 | 0.0% |
| Total | 482 | 100.0% |
Ancestry in Grampian borough
The most populous ancestries reported in Grampian borough are German (120 | 24.9%), Irish (87 | 18.0%), American (45 | 9.3%), English (25 | 5.2%), and Swedish (11 | 2.3%), together accounting for 59.8% of all Grampian borough residents.
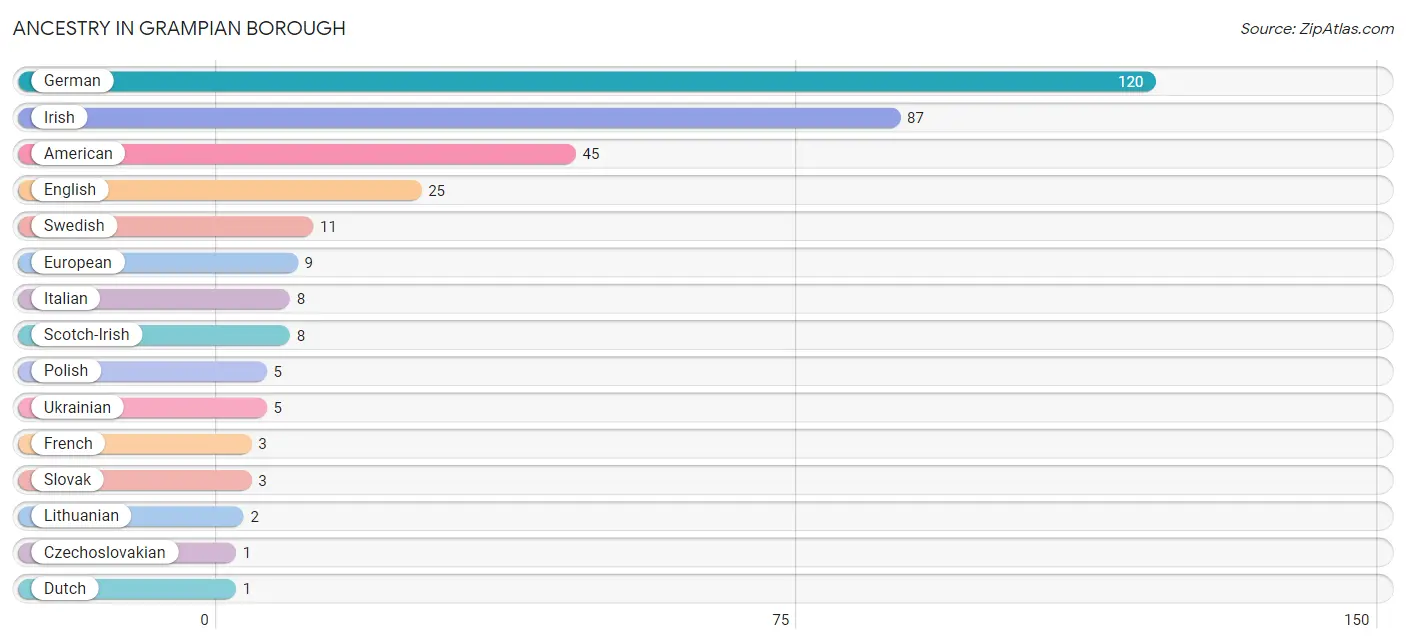
| Ancestry | # Population | % Population |
| American | 45 | 9.3% |
| Czechoslovakian | 1 | 0.2% |
| Dutch | 1 | 0.2% |
| English | 25 | 5.2% |
| European | 9 | 1.9% |
| French | 3 | 0.6% |
| French Canadian | 1 | 0.2% |
| German | 120 | 24.9% |
| Irish | 87 | 18.0% |
| Italian | 8 | 1.7% |
| Korean | 1 | 0.2% |
| Lithuanian | 2 | 0.4% |
| Polish | 5 | 1.0% |
| Scotch-Irish | 8 | 1.7% |
| Scottish | 1 | 0.2% |
| Slovak | 3 | 0.6% |
| Swedish | 11 | 2.3% |
| Ukrainian | 5 | 1.0% | View All 18 Rows |
Immigrants in Grampian borough
The most numerous immigrant groups reported in Grampian borough came from Eastern Europe (5 | 1.0%), Europe (5 | 1.0%), Ukraine (5 | 1.0%), Asia (1 | 0.2%), and Philippines (1 | 0.2%), together accounting for 3.5% of all Grampian borough residents.
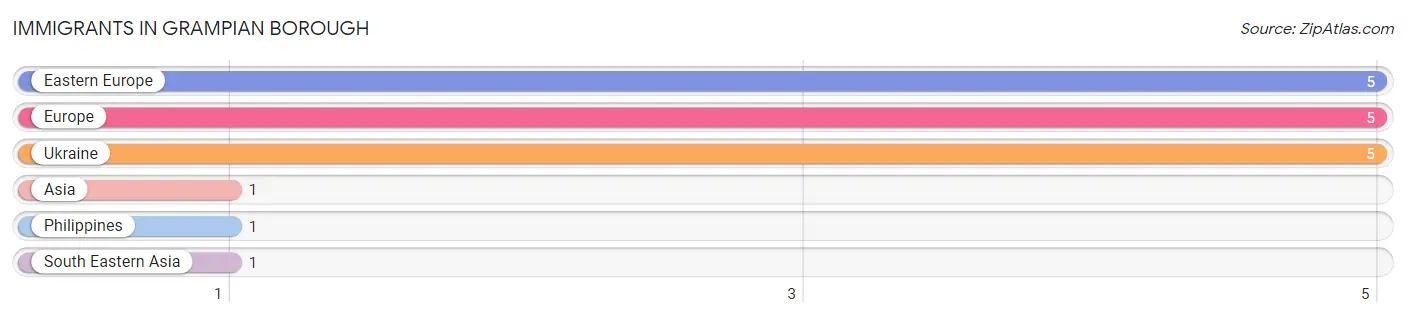
| Immigration Origin | # Population | % Population |
| Asia | 1 | 0.2% |
| Eastern Europe | 5 | 1.0% |
| Europe | 5 | 1.0% |
| Philippines | 1 | 0.2% |
| South Eastern Asia | 1 | 0.2% |
| Ukraine | 5 | 1.0% | View All 6 Rows |
Sex and Age in Grampian borough
Sex and Age in Grampian borough
The most populous age groups in Grampian borough are 15 to 19 Years (32 | 12.6%) for men and 50 to 54 Years (51 | 22.5%) for women.
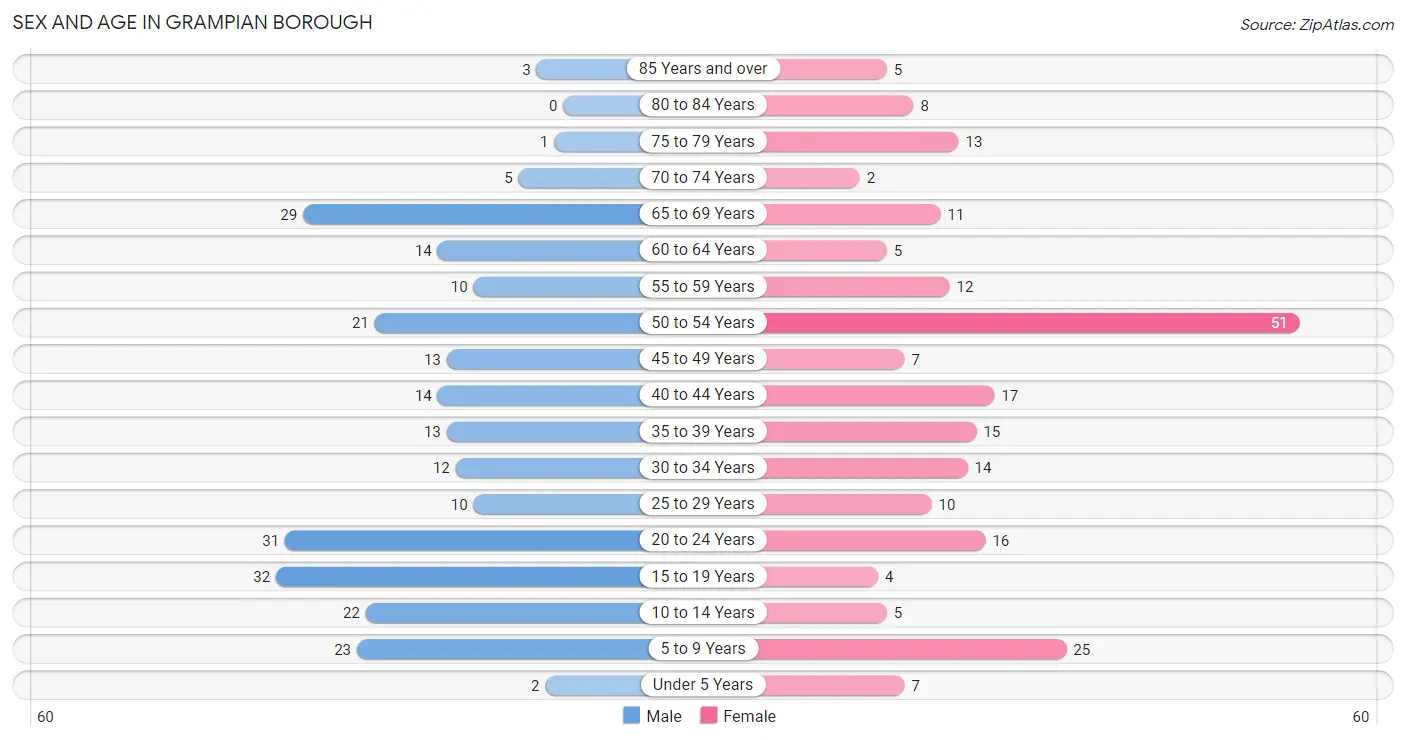
| Age Bracket | Male | Female |
| Under 5 Years | 2 (0.8%) | 7 (3.1%) |
| 5 to 9 Years | 23 (9.0%) | 25 (11.0%) |
| 10 to 14 Years | 22 (8.6%) | 5 (2.2%) |
| 15 to 19 Years | 32 (12.6%) | 4 (1.8%) |
| 20 to 24 Years | 31 (12.2%) | 16 (7.0%) |
| 25 to 29 Years | 10 (3.9%) | 10 (4.4%) |
| 30 to 34 Years | 12 (4.7%) | 14 (6.2%) |
| 35 to 39 Years | 13 (5.1%) | 15 (6.6%) |
| 40 to 44 Years | 14 (5.5%) | 17 (7.5%) |
| 45 to 49 Years | 13 (5.1%) | 7 (3.1%) |
| 50 to 54 Years | 21 (8.2%) | 51 (22.5%) |
| 55 to 59 Years | 10 (3.9%) | 12 (5.3%) |
| 60 to 64 Years | 14 (5.5%) | 5 (2.2%) |
| 65 to 69 Years | 29 (11.4%) | 11 (4.9%) |
| 70 to 74 Years | 5 (2.0%) | 2 (0.9%) |
| 75 to 79 Years | 1 (0.4%) | 13 (5.7%) |
| 80 to 84 Years | 0 (0.0%) | 8 (3.5%) |
| 85 Years and over | 3 (1.2%) | 5 (2.2%) |
| Total | 255 (100.0%) | 227 (100.0%) |
Families and Households in Grampian borough
Median Family Size in Grampian borough
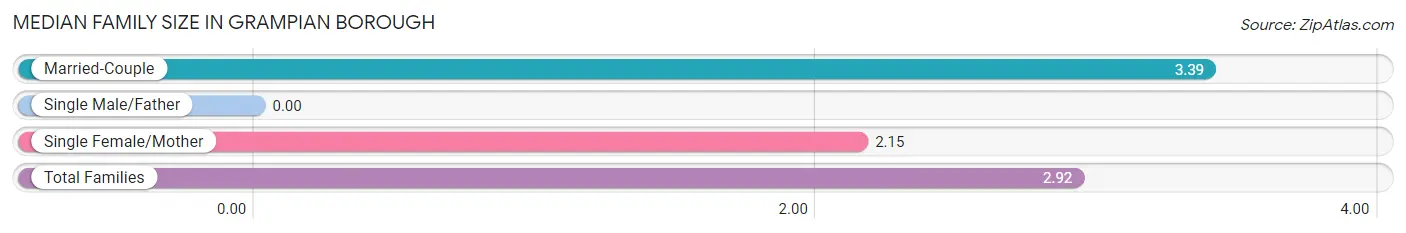
| Family Type | # Families | Family Size |
| Married-Couple | 85 (62.0%) | 3.39 |
| Single Male/Father | 0 (0.0%) | - |
| Single Female/Mother | 52 (38.0%) | 2.15 |
| Total Families | 137 (100.0%) | 2.92 |
Median Household Size in Grampian borough
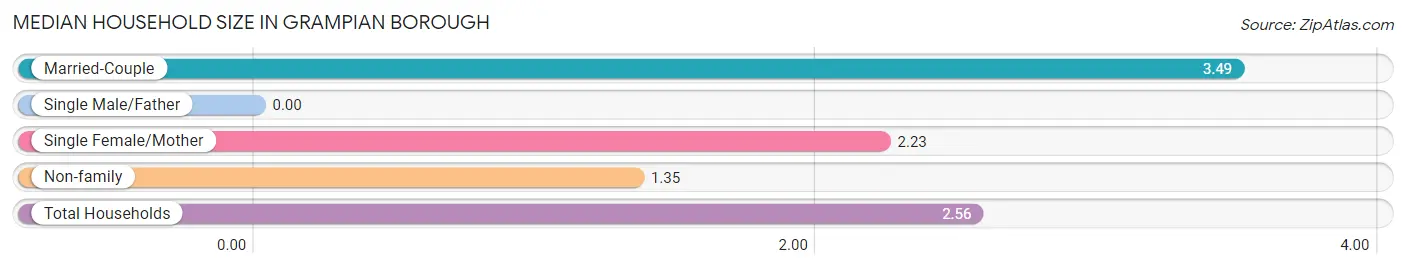
| Household Type | # Households | Household Size |
| Married-Couple | 85 (45.2%) | 3.49 |
| Single Male/Father | 0 (0.0%) | - |
| Single Female/Mother | 52 (27.7%) | 2.23 |
| Non-family | 51 (27.1%) | 1.35 |
| Total Households | 188 (100.0%) | 2.56 |
Household Size by Marriage Status in Grampian borough
Out of a total of 188 households in Grampian borough, 137 (72.9%) are family households, while 51 (27.1%) are nonfamily households. The most numerous type of family households are 3-person households, comprising 58, and the most common type of nonfamily households are 1-person households, comprising 39.
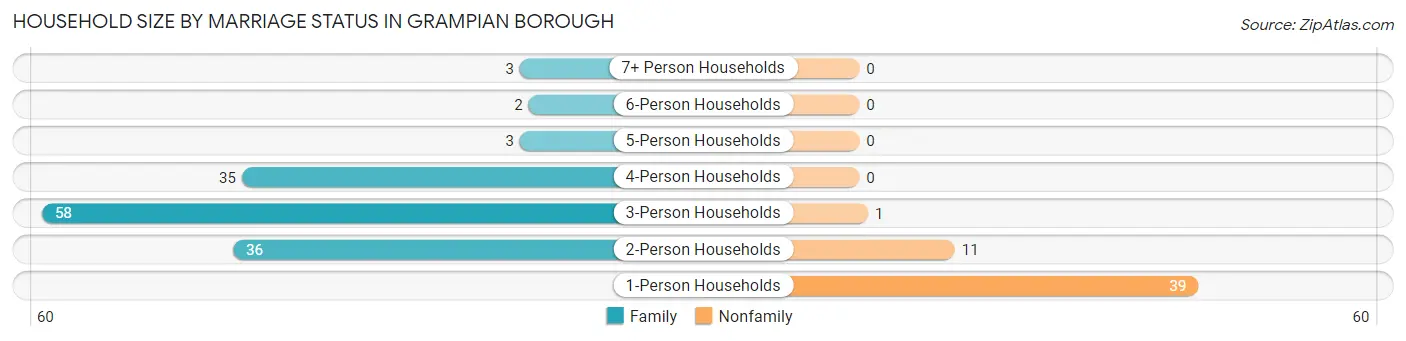
| Household Size | Family Households | Nonfamily Households |
| 1-Person Households | - | 39 (20.7%) |
| 2-Person Households | 36 (19.2%) | 11 (5.9%) |
| 3-Person Households | 58 (30.8%) | 1 (0.5%) |
| 4-Person Households | 35 (18.6%) | 0 (0.0%) |
| 5-Person Households | 3 (1.6%) | 0 (0.0%) |
| 6-Person Households | 2 (1.1%) | 0 (0.0%) |
| 7+ Person Households | 3 (1.6%) | 0 (0.0%) |
| Total | 137 (72.9%) | 51 (27.1%) |
Female Fertility in Grampian borough
Fertility by Age in Grampian borough
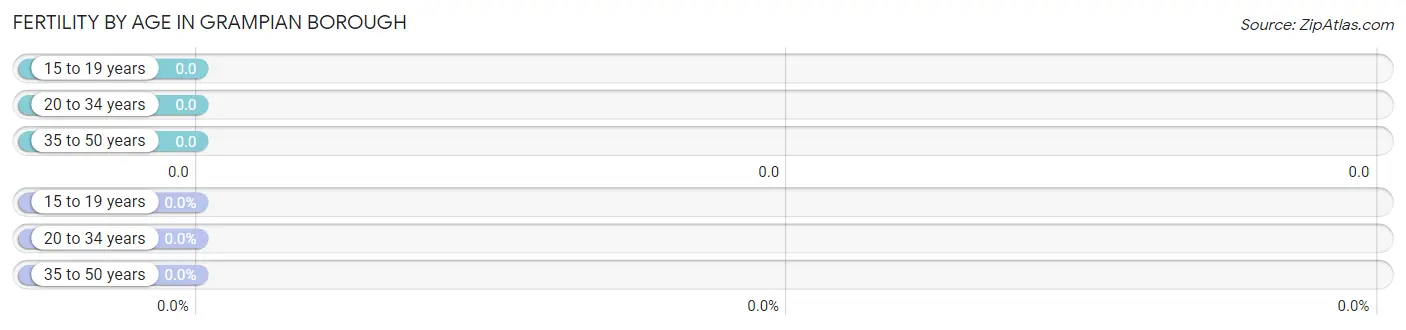
| Age Bracket | Women with Births | Births / 1,000 Women |
| 15 to 19 years | 0 (0.0%) | 0.0 |
| 20 to 34 years | 0 (0.0%) | 0.0 |
| 35 to 50 years | 0 (0.0%) | 0.0 |
| Total | 0 (0.0%) | 0.0 |
Fertility by Age by Marriage Status in Grampian borough
| Age Bracket | Married | Unmarried |
| 15 to 19 years | 0 (0.0%) | 0 (0.0%) |
| 20 to 34 years | 0 (0.0%) | 0 (0.0%) |
| 35 to 50 years | 0 (0.0%) | 0 (0.0%) |
| Total | 0 (0.0%) | 0 (0.0%) |
Fertility by Education in Grampian borough
| Educational Attainment | Women with Births | Births / 1,000 Women |
| Less than High School | 0 (0.0%) | 0.0 |
| High School Diploma | 0 (0.0%) | 0.0 |
| College or Associate's Degree | 0 (0.0%) | 0.0 |
| Bachelor's Degree | 0 (0.0%) | 0.0 |
| Graduate Degree | 0 (0.0%) | 0.0 |
| Total | 0 (0.0%) | 0.0 |
Fertility by Education by Marriage Status in Grampian borough
| Educational Attainment | Married | Unmarried |
| Less than High School | 0 (0.0%) | 0 (0.0%) |
| High School Diploma | 0 (0.0%) | 0 (0.0%) |
| College or Associate's Degree | 0 (0.0%) | 0 (0.0%) |
| Bachelor's Degree | 0 (0.0%) | 0 (0.0%) |
| Graduate Degree | 0 (0.0%) | 0 (0.0%) |
| Total | 0 (0.0%) | 0 (0.0%) |
Employment Characteristics in Grampian borough
Employment by Class of Employer in Grampian borough
Among the 236 employed individuals in Grampian borough, private company employees (165 | 69.9%), local government employees (22 | 9.3%), and not-for-profit organizations (21 | 8.9%) make up the most common classes of employment.
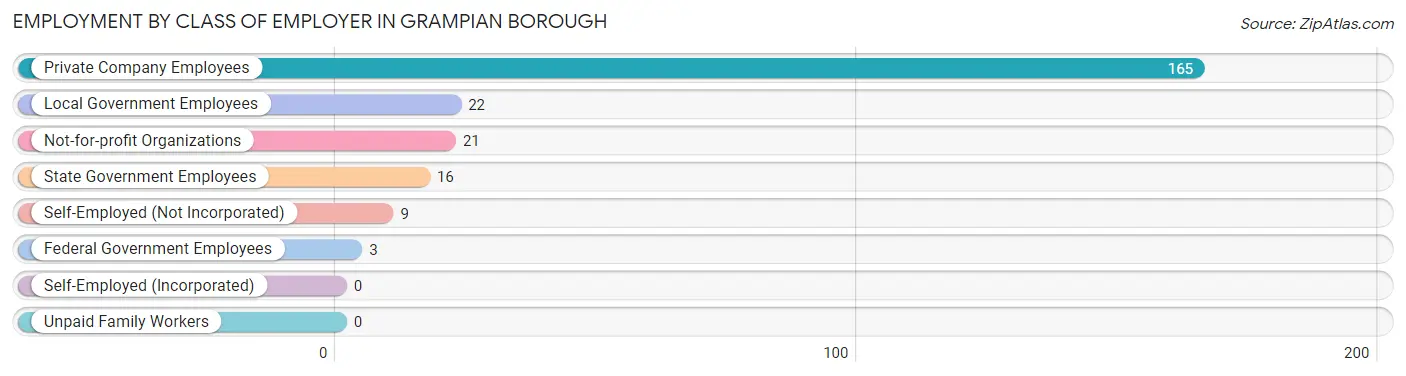
| Employer Class | # Employees | % Employees |
| Private Company Employees | 165 | 69.9% |
| Self-Employed (Incorporated) | 0 | 0.0% |
| Self-Employed (Not Incorporated) | 9 | 3.8% |
| Not-for-profit Organizations | 21 | 8.9% |
| Local Government Employees | 22 | 9.3% |
| State Government Employees | 16 | 6.8% |
| Federal Government Employees | 3 | 1.3% |
| Unpaid Family Workers | 0 | 0.0% |
| Total | 236 | 100.0% |
Employment Status by Age in Grampian borough
According to the labor force statistics for Grampian borough, out of the total population over 16 years of age (396), 71.5% or 283 individuals are in the labor force, with 16.7% or 47 of them unemployed. The age group with the highest labor force participation rate is 35 to 44 years, with 91.5% or 54 individuals in the labor force. Within the labor force, the 75 years and over age range has the highest percentage of unemployed individuals, with 100.0% or 8 of them being unemployed.
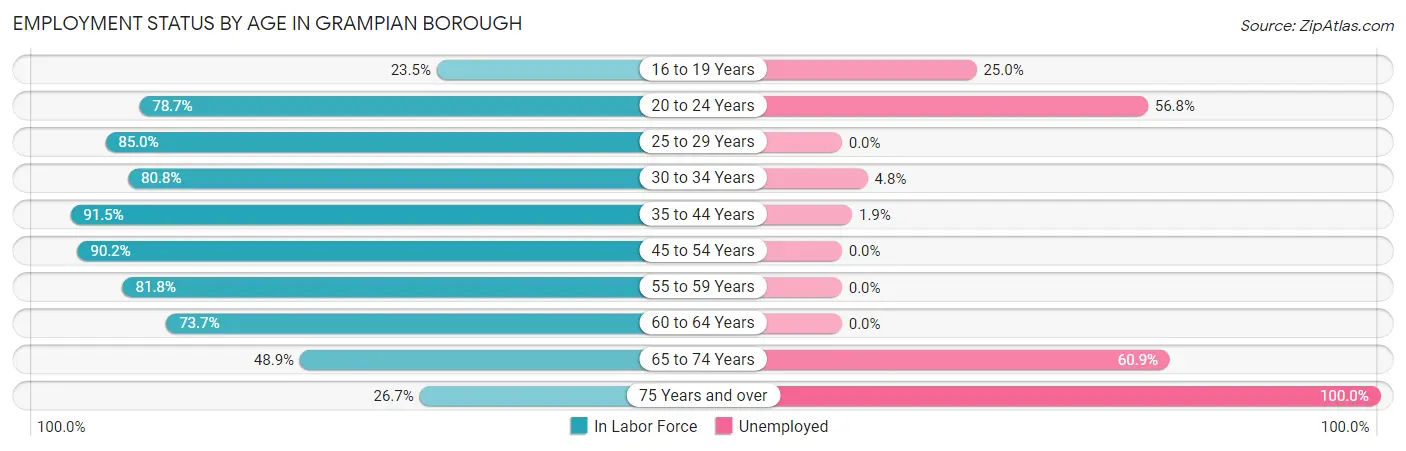
| Age Bracket | In Labor Force | Unemployed |
| 16 to 19 Years | 8 (23.5%) | 2 (25.0%) |
| 20 to 24 Years | 37 (78.7%) | 21 (56.8%) |
| 25 to 29 Years | 17 (85.0%) | 0 (0.0%) |
| 30 to 34 Years | 21 (80.8%) | 1 (4.8%) |
| 35 to 44 Years | 54 (91.5%) | 1 (1.9%) |
| 45 to 54 Years | 83 (90.2%) | 0 (0.0%) |
| 55 to 59 Years | 18 (81.8%) | 0 (0.0%) |
| 60 to 64 Years | 14 (73.7%) | 0 (0.0%) |
| 65 to 74 Years | 23 (48.9%) | 14 (60.9%) |
| 75 Years and over | 8 (26.7%) | 8 (100.0%) |
| Total | 283 (71.5%) | 47 (16.7%) |
Employment Status by Educational Attainment in Grampian borough
According to labor force statistics for Grampian borough, 87.0% of individuals (207) out of the total population between 25 and 64 years of age (238) are in the labor force, with 1.0% or 2 of them being unemployed. The group with the highest labor force participation rate are those with the educational attainment of bachelor's degree or higher, with 96.0% or 48 individuals in the labor force. Within the labor force, individuals with high school diploma education have the highest percentage of unemployment, with 1.6% or 2 of them being unemployed.
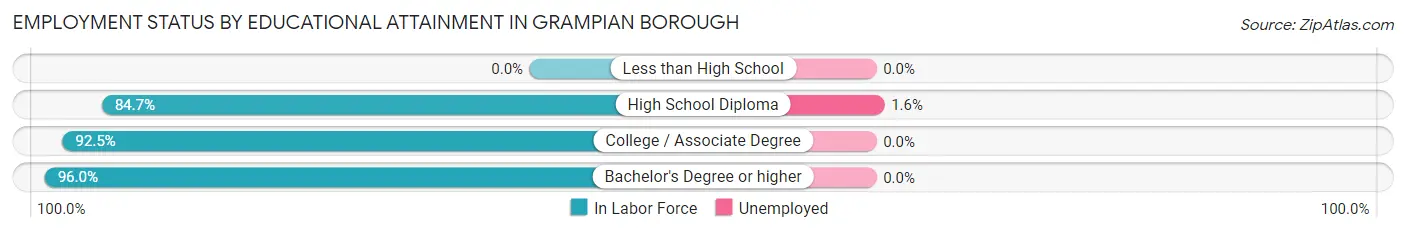
| Educational Attainment | In Labor Force | Unemployed |
| Less than High School | 0 (0.0%) | 0 (0.0%) |
| High School Diploma | 122 (84.7%) | 2 (1.6%) |
| College / Associate Degree | 37 (92.5%) | 0 (0.0%) |
| Bachelor's Degree or higher | 48 (96.0%) | 0 (0.0%) |
| Total | 207 (87.0%) | 2 (1.0%) |
Employment Occupations by Sex in Grampian borough
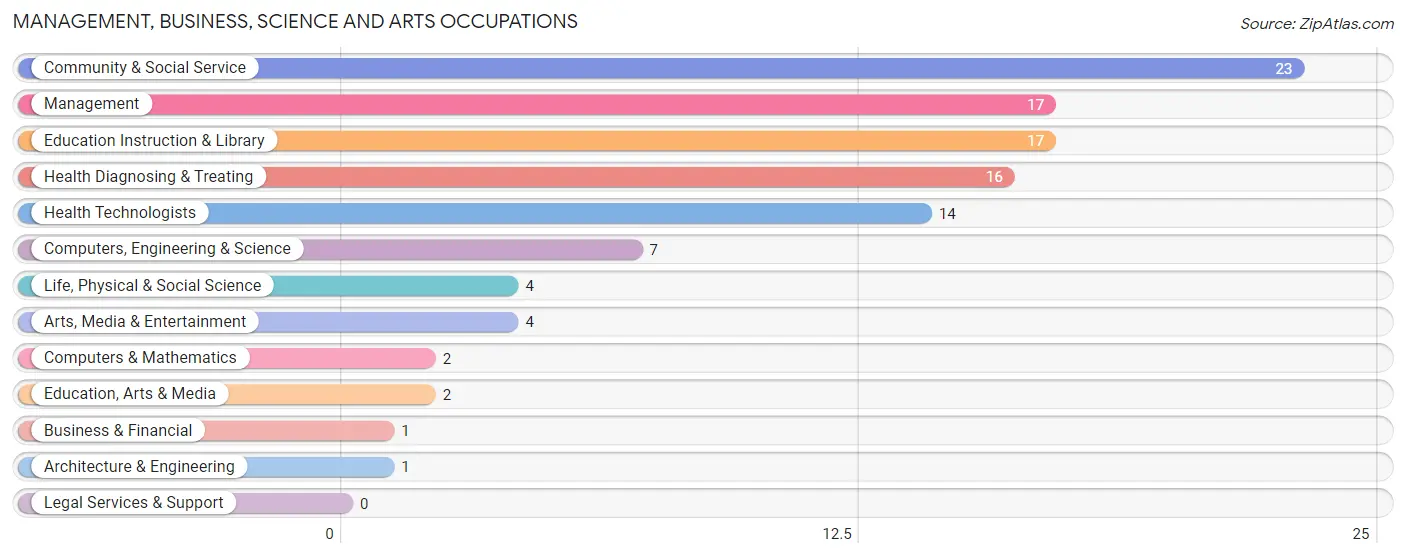
Management, Business, Science and Arts Occupations
The most common Management, Business, Science and Arts occupations in Grampian borough are Community & Social Service (23 | 9.8%), Management (17 | 7.3%), Education Instruction & Library (17 | 7.3%), Health Diagnosing & Treating (16 | 6.8%), and Health Technologists (14 | 6.0%).
Management, Business, Science and Arts Occupations by Sex
Within the Management, Business, Science and Arts occupations in Grampian borough, the most male-oriented occupations are Business & Financial (100.0%), Computers, Engineering & Science (100.0%), and Computers & Mathematics (100.0%), while the most female-oriented occupations are Education, Arts & Media (100.0%), Health Diagnosing & Treating (100.0%), and Health Technologists (100.0%).
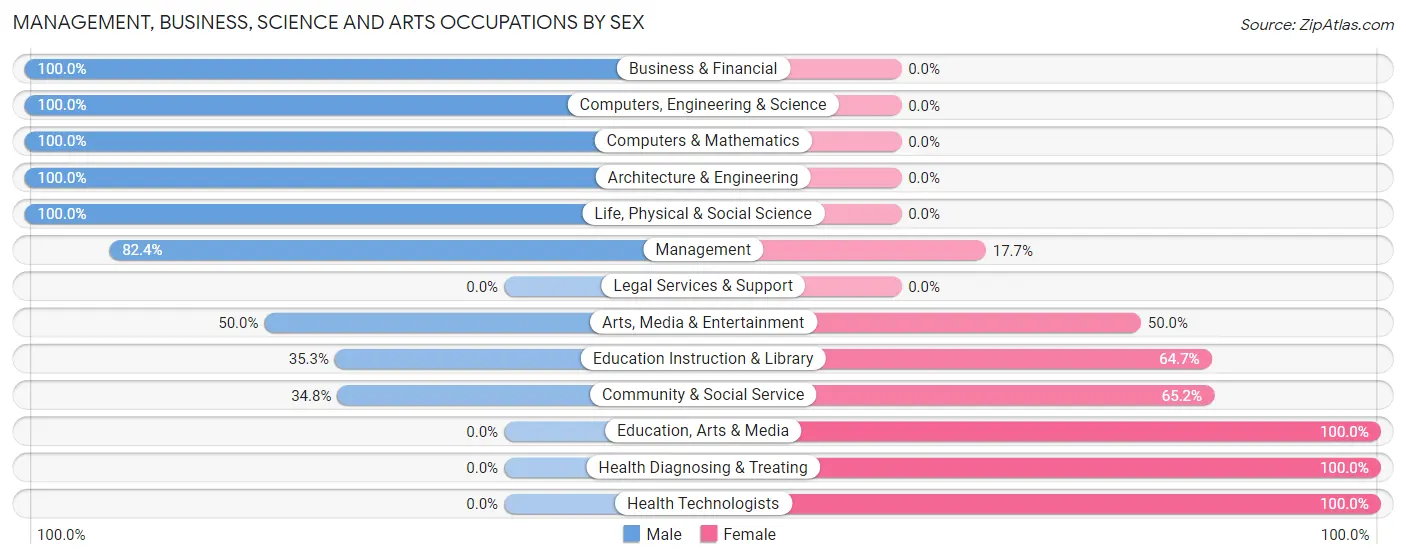
| Occupation | Male | Female |
| Management | 14 (82.4%) | 3 (17.6%) |
| Business & Financial | 1 (100.0%) | 0 (0.0%) |
| Computers, Engineering & Science | 7 (100.0%) | 0 (0.0%) |
| Computers & Mathematics | 2 (100.0%) | 0 (0.0%) |
| Architecture & Engineering | 1 (100.0%) | 0 (0.0%) |
| Life, Physical & Social Science | 4 (100.0%) | 0 (0.0%) |
| Community & Social Service | 8 (34.8%) | 15 (65.2%) |
| Education, Arts & Media | 0 (0.0%) | 2 (100.0%) |
| Legal Services & Support | 0 (0.0%) | 0 (0.0%) |
| Education Instruction & Library | 6 (35.3%) | 11 (64.7%) |
| Arts, Media & Entertainment | 2 (50.0%) | 2 (50.0%) |
| Health Diagnosing & Treating | 0 (0.0%) | 16 (100.0%) |
| Health Technologists | 0 (0.0%) | 14 (100.0%) |
| Total (Category) | 30 (46.9%) | 34 (53.1%) |
| Total (Overall) | 108 (46.2%) | 126 (53.8%) |
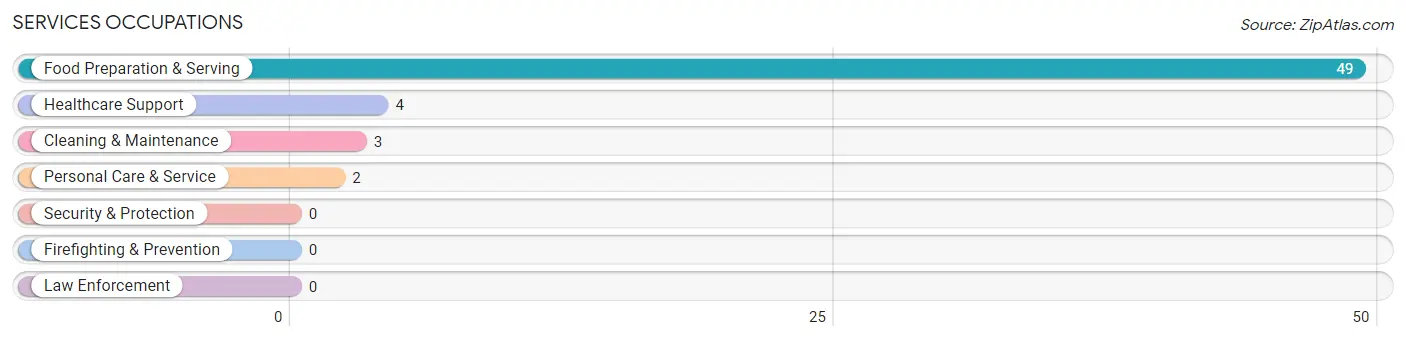
Services Occupations
The most common Services occupations in Grampian borough are Food Preparation & Serving (49 | 20.9%), Healthcare Support (4 | 1.7%), Cleaning & Maintenance (3 | 1.3%), and Personal Care & Service (2 | 0.9%).
Services Occupations by Sex
Within the Services occupations in Grampian borough, the most male-oriented occupations are Cleaning & Maintenance (66.7%), Healthcare Support (50.0%), and Food Preparation & Serving (8.2%), while the most female-oriented occupations are Personal Care & Service (100.0%), Food Preparation & Serving (91.8%), and Healthcare Support (50.0%).
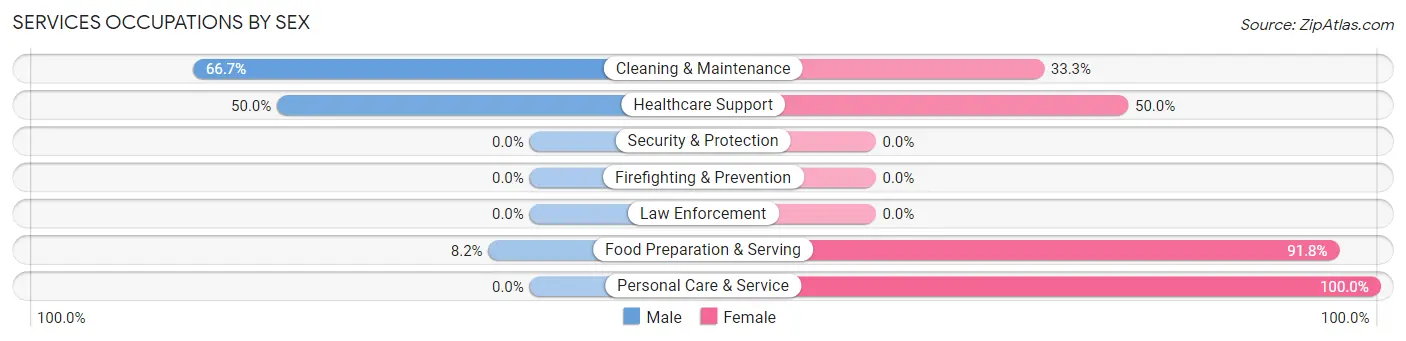
| Occupation | Male | Female |
| Healthcare Support | 2 (50.0%) | 2 (50.0%) |
| Security & Protection | 0 (0.0%) | 0 (0.0%) |
| Firefighting & Prevention | 0 (0.0%) | 0 (0.0%) |
| Law Enforcement | 0 (0.0%) | 0 (0.0%) |
| Food Preparation & Serving | 4 (8.2%) | 45 (91.8%) |
| Cleaning & Maintenance | 2 (66.7%) | 1 (33.3%) |
| Personal Care & Service | 0 (0.0%) | 2 (100.0%) |
| Total (Category) | 8 (13.8%) | 50 (86.2%) |
| Total (Overall) | 108 (46.2%) | 126 (53.8%) |
Sales and Office Occupations
The most common Sales and Office occupations in Grampian borough are Office & Administration (19 | 8.1%), and Sales & Related (8 | 3.4%).
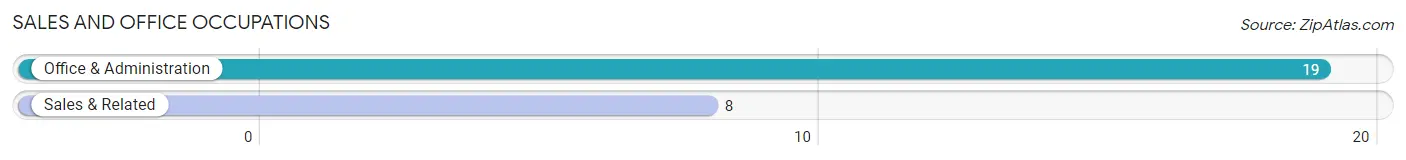
Sales and Office Occupations by Sex

| Occupation | Male | Female |
| Sales & Related | 2 (25.0%) | 6 (75.0%) |
| Office & Administration | 1 (5.3%) | 18 (94.7%) |
| Total (Category) | 3 (11.1%) | 24 (88.9%) |
| Total (Overall) | 108 (46.2%) | 126 (53.8%) |
Natural Resources, Construction and Maintenance Occupations
The most common Natural Resources, Construction and Maintenance occupations in Grampian borough are Construction & Extraction (24 | 10.3%), and Installation, Maintenance & Repair (10 | 4.3%).
Natural Resources, Construction and Maintenance Occupations by Sex
| Occupation | Male | Female |
| Farming, Fishing & Forestry | 0 (0.0%) | 0 (0.0%) |
| Construction & Extraction | 23 (95.8%) | 1 (4.2%) |
| Installation, Maintenance & Repair | 10 (100.0%) | 0 (0.0%) |
| Total (Category) | 33 (97.1%) | 1 (2.9%) |
| Total (Overall) | 108 (46.2%) | 126 (53.8%) |
Production, Transportation and Moving Occupations
The most common Production, Transportation and Moving occupations in Grampian borough are Material Moving (25 | 10.7%), Production (20 | 8.6%), and Transportation (6 | 2.6%).
Production, Transportation and Moving Occupations by Sex
| Occupation | Male | Female |
| Production | 15 (75.0%) | 5 (25.0%) |
| Transportation | 6 (100.0%) | 0 (0.0%) |
| Material Moving | 13 (52.0%) | 12 (48.0%) |
| Total (Category) | 34 (66.7%) | 17 (33.3%) |
| Total (Overall) | 108 (46.2%) | 126 (53.8%) |
Employment Industries by Sex in Grampian borough
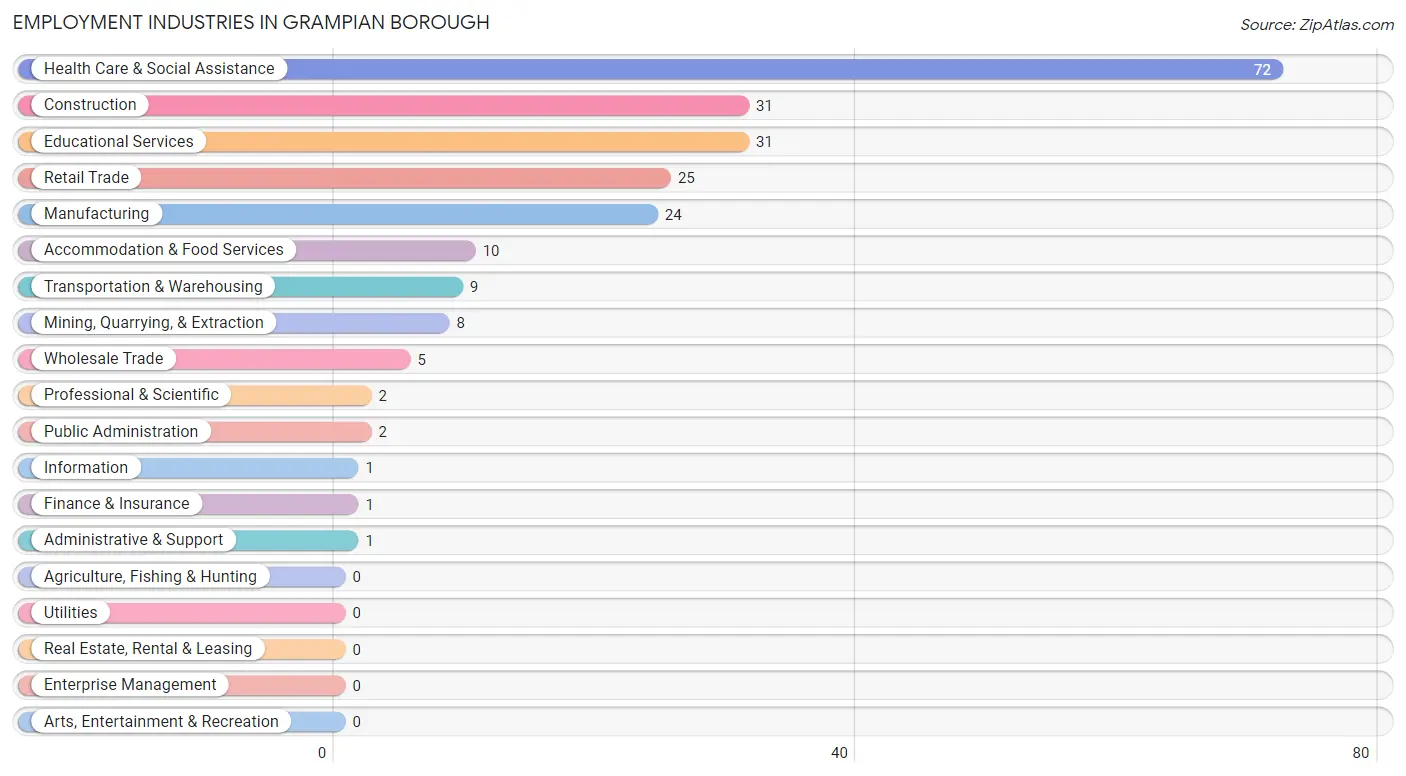
Employment Industries in Grampian borough
The major employment industries in Grampian borough include Health Care & Social Assistance (72 | 30.8%), Construction (31 | 13.3%), Educational Services (31 | 13.3%), Retail Trade (25 | 10.7%), and Manufacturing (24 | 10.3%).
Employment Industries by Sex in Grampian borough
The Grampian borough industries that see more men than women are Mining, Quarrying, & Extraction (100.0%), Public Administration (100.0%), and Construction (96.8%), whereas the industries that tend to have a higher number of women are Information (100.0%), Finance & Insurance (100.0%), and Professional & Scientific (100.0%).
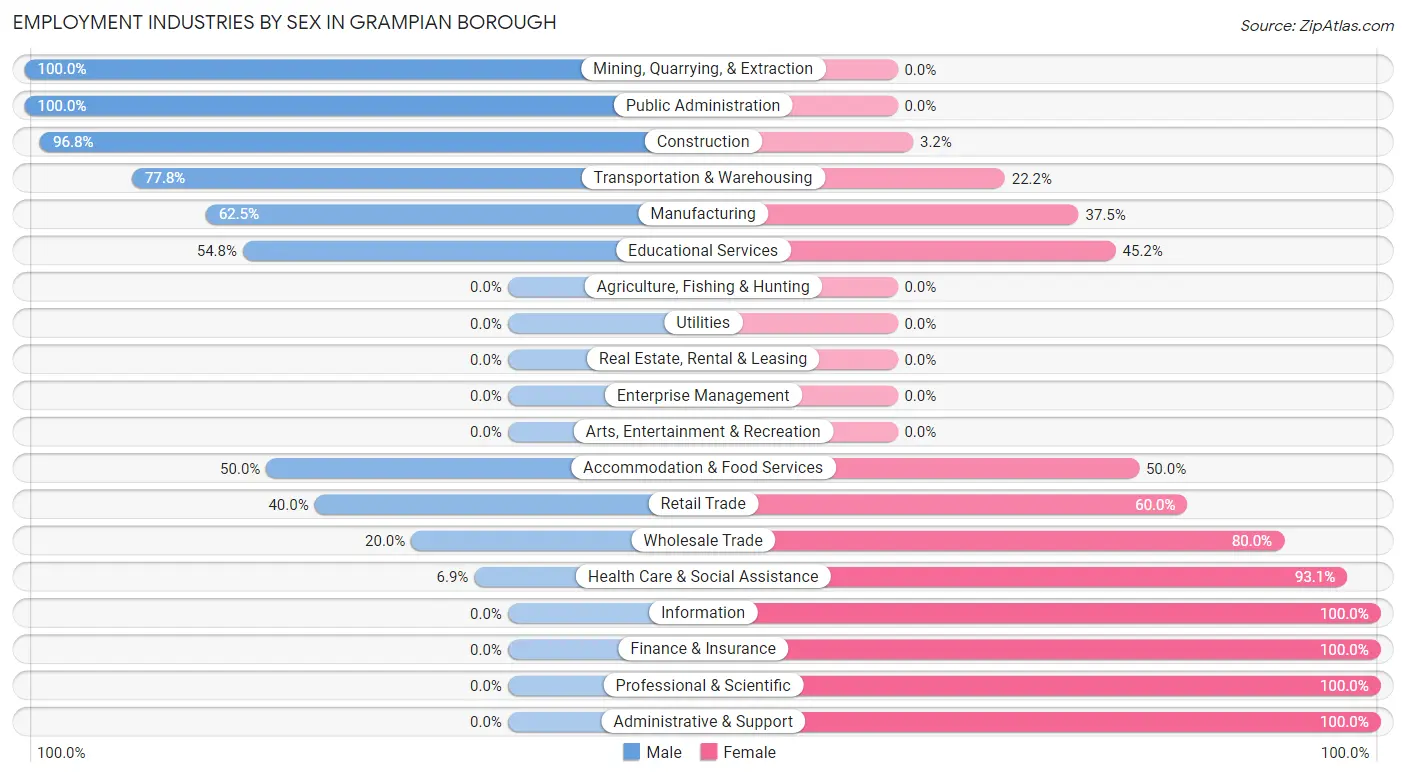
| Industry | Male | Female |
| Agriculture, Fishing & Hunting | 0 (0.0%) | 0 (0.0%) |
| Mining, Quarrying, & Extraction | 8 (100.0%) | 0 (0.0%) |
| Construction | 30 (96.8%) | 1 (3.2%) |
| Manufacturing | 15 (62.5%) | 9 (37.5%) |
| Wholesale Trade | 1 (20.0%) | 4 (80.0%) |
| Retail Trade | 10 (40.0%) | 15 (60.0%) |
| Transportation & Warehousing | 7 (77.8%) | 2 (22.2%) |
| Utilities | 0 (0.0%) | 0 (0.0%) |
| Information | 0 (0.0%) | 1 (100.0%) |
| Finance & Insurance | 0 (0.0%) | 1 (100.0%) |
| Real Estate, Rental & Leasing | 0 (0.0%) | 0 (0.0%) |
| Professional & Scientific | 0 (0.0%) | 2 (100.0%) |
| Enterprise Management | 0 (0.0%) | 0 (0.0%) |
| Administrative & Support | 0 (0.0%) | 1 (100.0%) |
| Educational Services | 17 (54.8%) | 14 (45.2%) |
| Health Care & Social Assistance | 5 (6.9%) | 67 (93.1%) |
| Arts, Entertainment & Recreation | 0 (0.0%) | 0 (0.0%) |
| Accommodation & Food Services | 5 (50.0%) | 5 (50.0%) |
| Public Administration | 2 (100.0%) | 0 (0.0%) |
| Total | 108 (46.2%) | 126 (53.8%) |
Education in Grampian borough
School Enrollment in Grampian borough
The most common levels of schooling among the 110 students in Grampian borough are elementary school (44 | 40.0%), middle school (22 | 20.0%), and high school (16 | 14.5%).
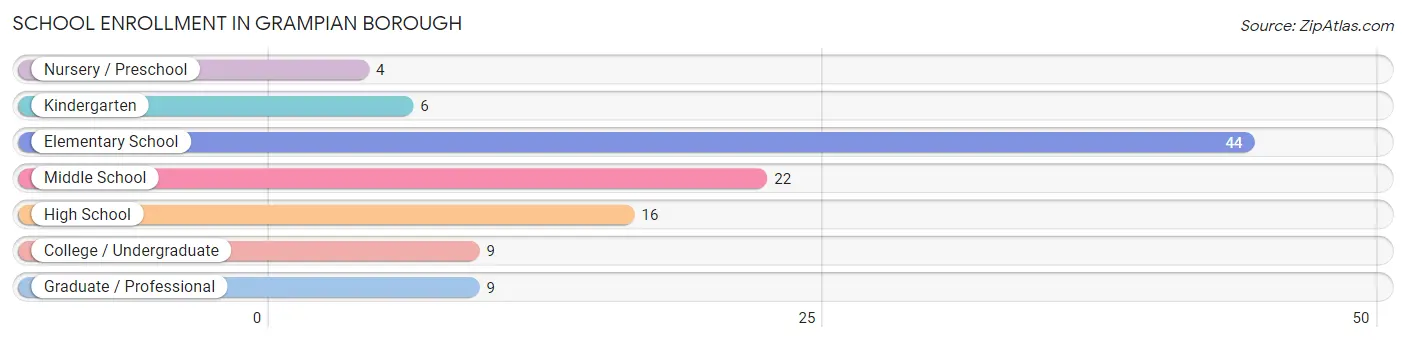
| School Level | # Students | % Students |
| Nursery / Preschool | 4 | 3.6% |
| Kindergarten | 6 | 5.4% |
| Elementary School | 44 | 40.0% |
| Middle School | 22 | 20.0% |
| High School | 16 | 14.5% |
| College / Undergraduate | 9 | 8.2% |
| Graduate / Professional | 9 | 8.2% |
| Total | 110 | 100.0% |
School Enrollment by Age by Funding Source in Grampian borough
Out of a total of 110 students who are enrolled in schools in Grampian borough, 17 (15.5%) attend a private institution, while the remaining 93 (84.5%) are enrolled in public schools. The age group of 35 years and over has the highest likelihood of being enrolled in private schools, with 7 (63.6% in the age bracket) enrolled. Conversely, the age group of 3 to 4 year olds has the lowest likelihood of being enrolled in a private school, with 2 (100.0% in the age bracket) attending a public institution.
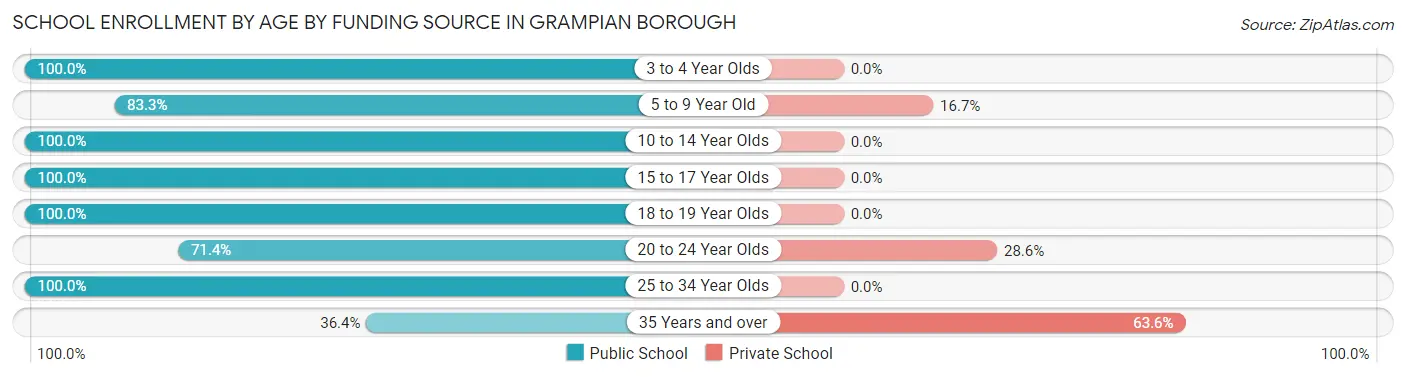
| Age Bracket | Public School | Private School |
| 3 to 4 Year Olds | 2 (100.0%) | 0 (0.0%) |
| 5 to 9 Year Old | 40 (83.3%) | 8 (16.7%) |
| 10 to 14 Year Olds | 27 (100.0%) | 0 (0.0%) |
| 15 to 17 Year Olds | 5 (100.0%) | 0 (0.0%) |
| 18 to 19 Year Olds | 8 (100.0%) | 0 (0.0%) |
| 20 to 24 Year Olds | 5 (71.4%) | 2 (28.6%) |
| 25 to 34 Year Olds | 2 (100.0%) | 0 (0.0%) |
| 35 Years and over | 4 (36.4%) | 7 (63.6%) |
| Total | 93 (84.5%) | 17 (15.5%) |
Educational Attainment by Field of Study in Grampian borough
Education (25 | 40.3%), engineering (7 | 11.3%), science & technology (7 | 11.3%), literature & languages (7 | 11.3%), and arts & humanities (5 | 8.1%) are the most common fields of study among 62 individuals in Grampian borough who have obtained a bachelor's degree or higher.
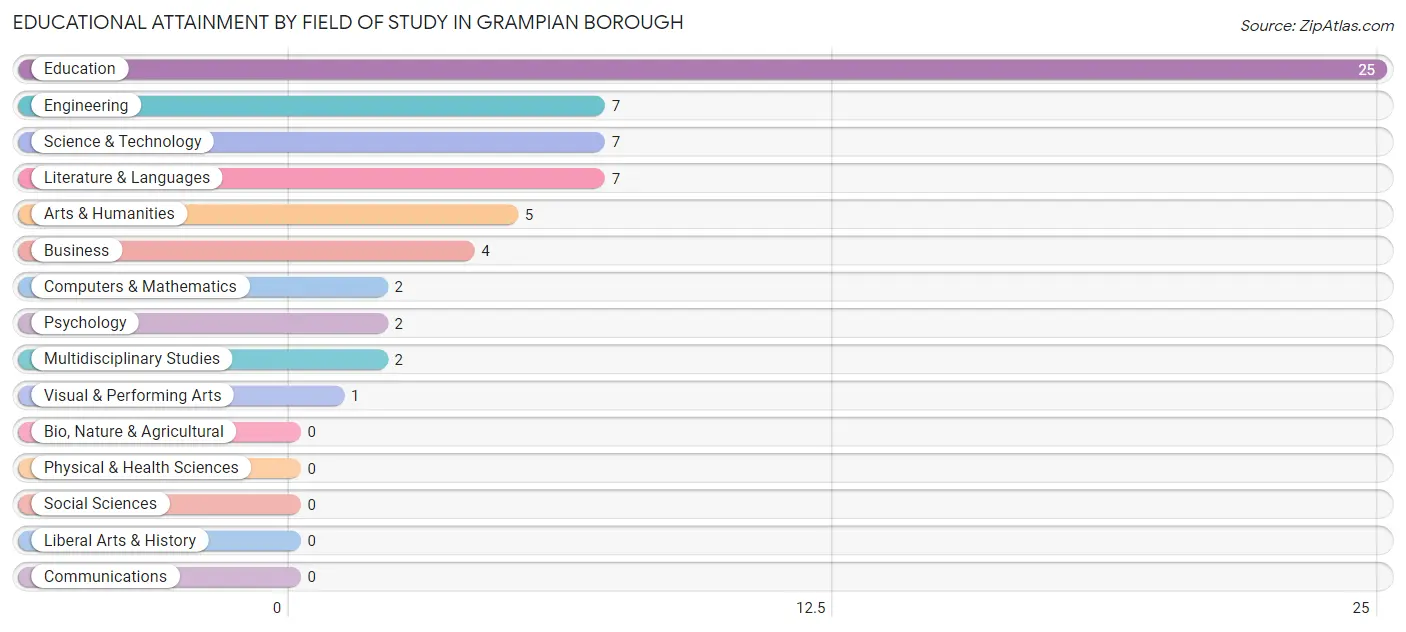
| Field of Study | # Graduates | % Graduates |
| Computers & Mathematics | 2 | 3.2% |
| Bio, Nature & Agricultural | 0 | 0.0% |
| Physical & Health Sciences | 0 | 0.0% |
| Psychology | 2 | 3.2% |
| Social Sciences | 0 | 0.0% |
| Engineering | 7 | 11.3% |
| Multidisciplinary Studies | 2 | 3.2% |
| Science & Technology | 7 | 11.3% |
| Business | 4 | 6.5% |
| Education | 25 | 40.3% |
| Literature & Languages | 7 | 11.3% |
| Liberal Arts & History | 0 | 0.0% |
| Visual & Performing Arts | 1 | 1.6% |
| Communications | 0 | 0.0% |
| Arts & Humanities | 5 | 8.1% |
| Total | 62 | 100.0% |
Transportation & Commute in Grampian borough
Vehicle Availability by Sex in Grampian borough
The most prevalent vehicle ownership categories in Grampian borough are males with 2 vehicles (51, accounting for 46.4%) and females with 2 vehicles (47, making up 40.5%).
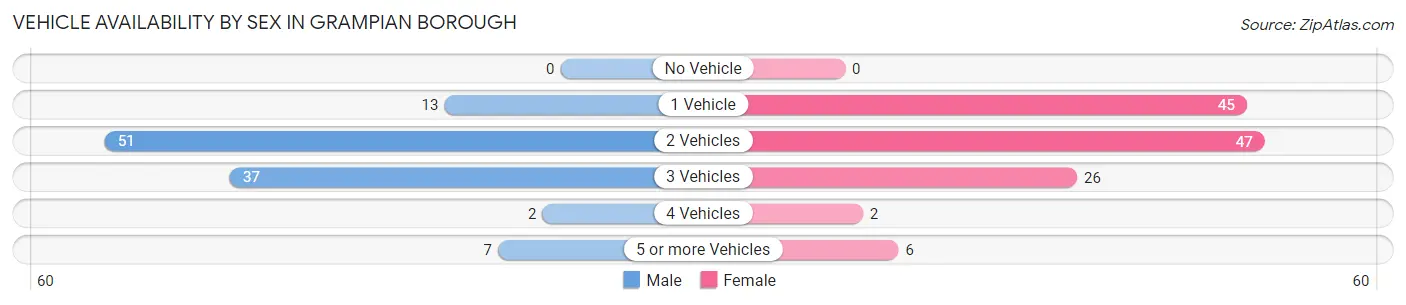
| Vehicles Available | Male | Female |
| No Vehicle | 0 (0.0%) | 0 (0.0%) |
| 1 Vehicle | 13 (11.8%) | 45 (35.7%) |
| 2 Vehicles | 51 (46.4%) | 47 (37.3%) |
| 3 Vehicles | 37 (33.6%) | 26 (20.6%) |
| 4 Vehicles | 2 (1.8%) | 2 (1.6%) |
| 5 or more Vehicles | 7 (6.4%) | 6 (4.8%) |
| Total | 110 (100.0%) | 126 (100.0%) |
Commute Time in Grampian borough
The most frequently occuring commute durations in Grampian borough are 20 to 24 minutes (83 commuters, 35.9%), 30 to 34 minutes (33 commuters, 14.3%), and 10 to 14 minutes (31 commuters, 13.4%).
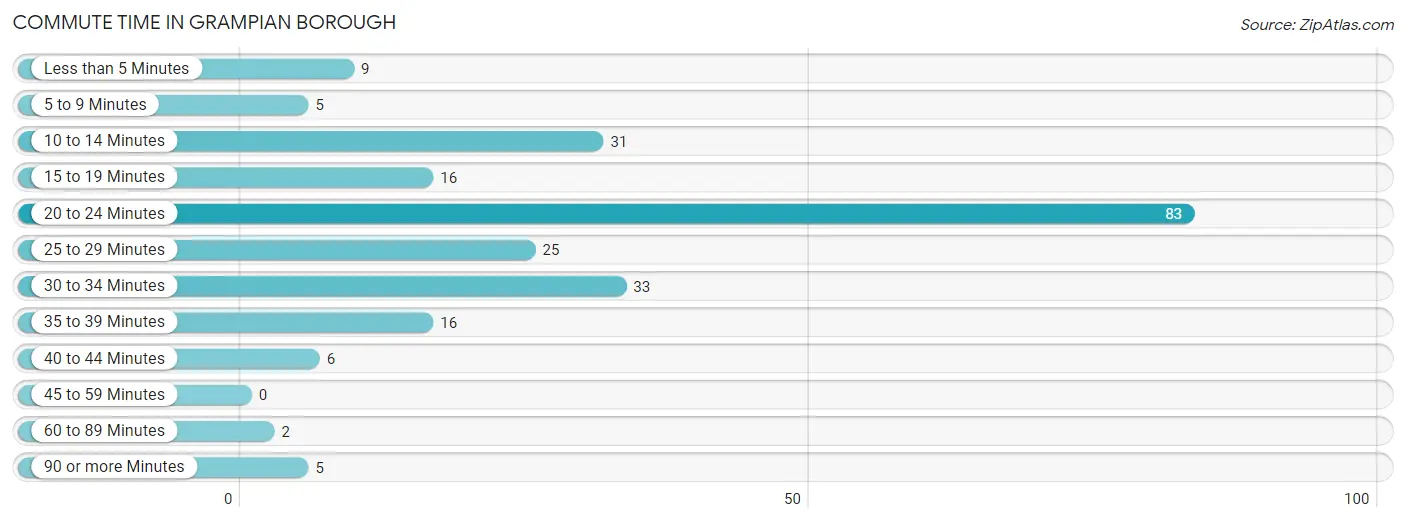
| Commute Time | # Commuters | % Commuters |
| Less than 5 Minutes | 9 | 3.9% |
| 5 to 9 Minutes | 5 | 2.2% |
| 10 to 14 Minutes | 31 | 13.4% |
| 15 to 19 Minutes | 16 | 6.9% |
| 20 to 24 Minutes | 83 | 35.9% |
| 25 to 29 Minutes | 25 | 10.8% |
| 30 to 34 Minutes | 33 | 14.3% |
| 35 to 39 Minutes | 16 | 6.9% |
| 40 to 44 Minutes | 6 | 2.6% |
| 45 to 59 Minutes | 0 | 0.0% |
| 60 to 89 Minutes | 2 | 0.9% |
| 90 or more Minutes | 5 | 2.2% |
Commute Time by Sex in Grampian borough
The most common commute times in Grampian borough are 20 to 24 minutes (23 commuters, 21.1%) for males and 20 to 24 minutes (60 commuters, 49.2%) for females.
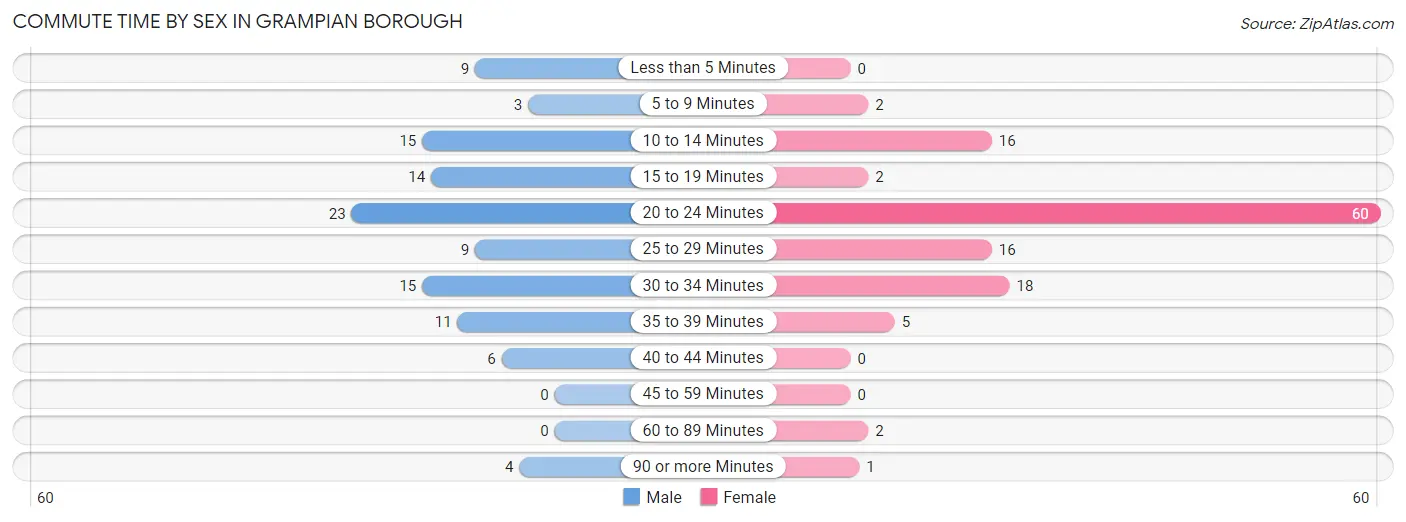
| Commute Time | Male | Female |
| Less than 5 Minutes | 9 (8.3%) | 0 (0.0%) |
| 5 to 9 Minutes | 3 (2.8%) | 2 (1.6%) |
| 10 to 14 Minutes | 15 (13.8%) | 16 (13.1%) |
| 15 to 19 Minutes | 14 (12.8%) | 2 (1.6%) |
| 20 to 24 Minutes | 23 (21.1%) | 60 (49.2%) |
| 25 to 29 Minutes | 9 (8.3%) | 16 (13.1%) |
| 30 to 34 Minutes | 15 (13.8%) | 18 (14.7%) |
| 35 to 39 Minutes | 11 (10.1%) | 5 (4.1%) |
| 40 to 44 Minutes | 6 (5.5%) | 0 (0.0%) |
| 45 to 59 Minutes | 0 (0.0%) | 0 (0.0%) |
| 60 to 89 Minutes | 0 (0.0%) | 2 (1.6%) |
| 90 or more Minutes | 4 (3.7%) | 1 (0.8%) |
Time of Departure to Work by Sex in Grampian borough
The most frequent times of departure to work in Grampian borough are 5:30 AM to 5:59 AM (19, 17.4%) for males and 5:30 AM to 5:59 AM (42, 34.4%) for females.
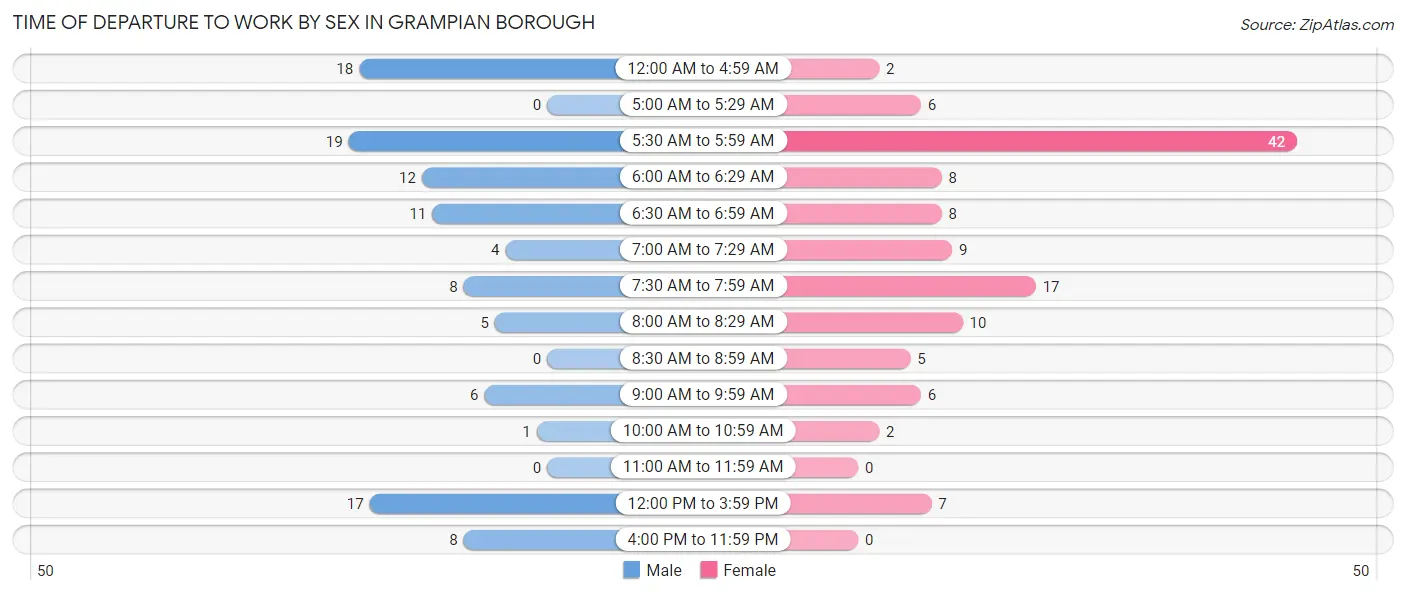
| Time of Departure | Male | Female |
| 12:00 AM to 4:59 AM | 18 (16.5%) | 2 (1.6%) |
| 5:00 AM to 5:29 AM | 0 (0.0%) | 6 (4.9%) |
| 5:30 AM to 5:59 AM | 19 (17.4%) | 42 (34.4%) |
| 6:00 AM to 6:29 AM | 12 (11.0%) | 8 (6.6%) |
| 6:30 AM to 6:59 AM | 11 (10.1%) | 8 (6.6%) |
| 7:00 AM to 7:29 AM | 4 (3.7%) | 9 (7.4%) |
| 7:30 AM to 7:59 AM | 8 (7.3%) | 17 (13.9%) |
| 8:00 AM to 8:29 AM | 5 (4.6%) | 10 (8.2%) |
| 8:30 AM to 8:59 AM | 0 (0.0%) | 5 (4.1%) |
| 9:00 AM to 9:59 AM | 6 (5.5%) | 6 (4.9%) |
| 10:00 AM to 10:59 AM | 1 (0.9%) | 2 (1.6%) |
| 11:00 AM to 11:59 AM | 0 (0.0%) | 0 (0.0%) |
| 12:00 PM to 3:59 PM | 17 (15.6%) | 7 (5.7%) |
| 4:00 PM to 11:59 PM | 8 (7.3%) | 0 (0.0%) |
| Total | 109 (100.0%) | 122 (100.0%) |
Housing Occupancy in Grampian borough
Occupancy by Ownership in Grampian borough
Of the total 188 dwellings in Grampian borough, owner-occupied units account for 127 (67.5%), while renter-occupied units make up 61 (32.5%).
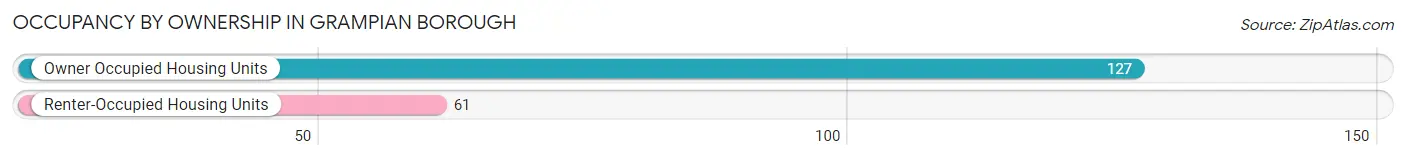
| Occupancy | # Housing Units | % Housing Units |
| Owner Occupied Housing Units | 127 | 67.5% |
| Renter-Occupied Housing Units | 61 | 32.5% |
| Total Occupied Housing Units | 188 | 100.0% |
Occupancy by Household Size in Grampian borough
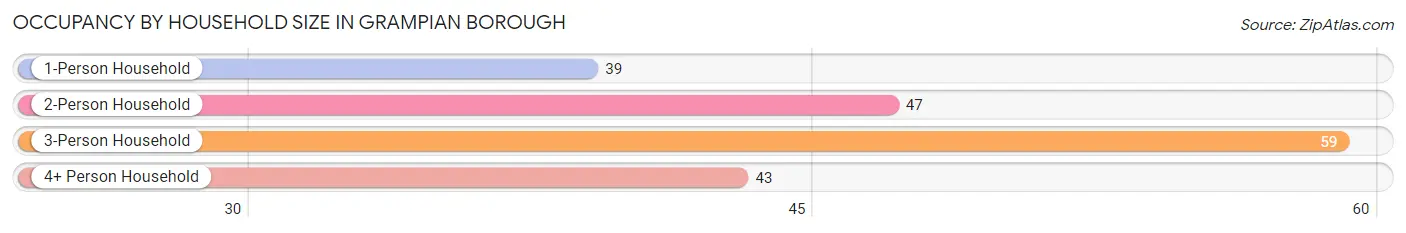
| Household Size | # Housing Units | % Housing Units |
| 1-Person Household | 39 | 20.7% |
| 2-Person Household | 47 | 25.0% |
| 3-Person Household | 59 | 31.4% |
| 4+ Person Household | 43 | 22.9% |
| Total Housing Units | 188 | 100.0% |
Occupancy by Ownership by Household Size in Grampian borough
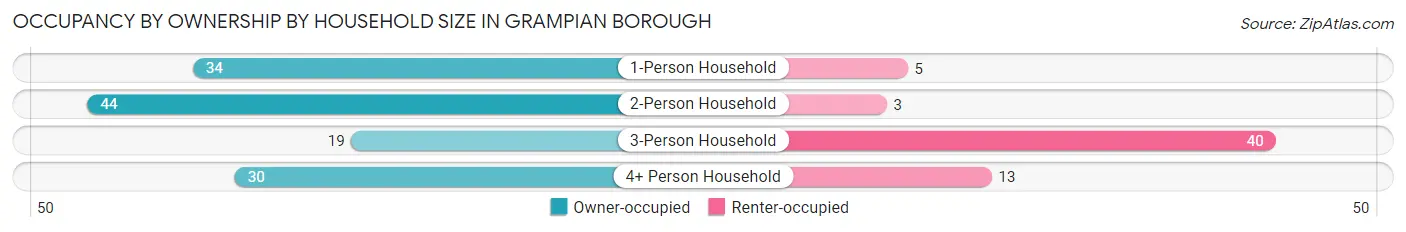
| Household Size | Owner-occupied | Renter-occupied |
| 1-Person Household | 34 (87.2%) | 5 (12.8%) |
| 2-Person Household | 44 (93.6%) | 3 (6.4%) |
| 3-Person Household | 19 (32.2%) | 40 (67.8%) |
| 4+ Person Household | 30 (69.8%) | 13 (30.2%) |
| Total Housing Units | 127 (67.5%) | 61 (32.5%) |
Occupancy by Educational Attainment in Grampian borough
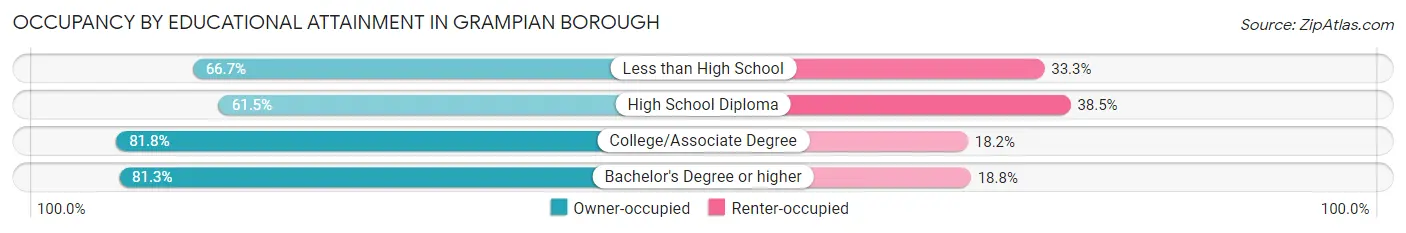
| Household Size | Owner-occupied | Renter-occupied |
| Less than High School | 8 (66.7%) | 4 (33.3%) |
| High School Diploma | 75 (61.5%) | 47 (38.5%) |
| College/Associate Degree | 18 (81.8%) | 4 (18.2%) |
| Bachelor's Degree or higher | 26 (81.2%) | 6 (18.8%) |
Occupancy by Age of Householder in Grampian borough
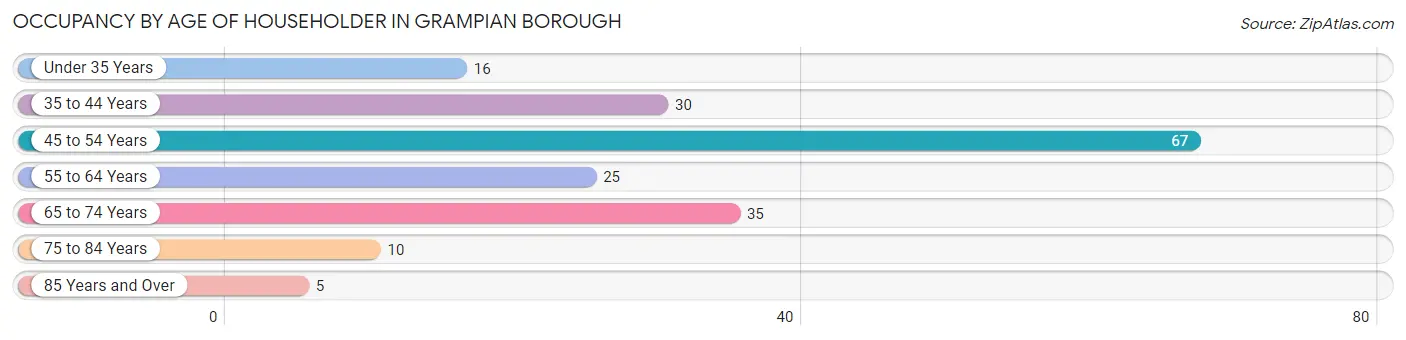
| Age Bracket | # Households | % Households |
| Under 35 Years | 16 | 8.5% |
| 35 to 44 Years | 30 | 16.0% |
| 45 to 54 Years | 67 | 35.6% |
| 55 to 64 Years | 25 | 13.3% |
| 65 to 74 Years | 35 | 18.6% |
| 75 to 84 Years | 10 | 5.3% |
| 85 Years and Over | 5 | 2.7% |
| Total | 188 | 100.0% |
Housing Finances in Grampian borough
Median Income by Occupancy in Grampian borough
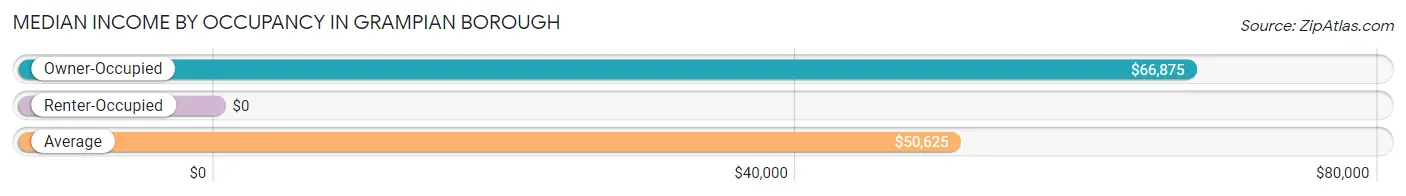
| Occupancy Type | # Households | Median Income |
| Owner-Occupied | 127 (67.5%) | $66,875 |
| Renter-Occupied | 61 (32.5%) | $0 |
| Average | 188 (100.0%) | $50,625 |
Occupancy by Householder Income Bracket in Grampian borough
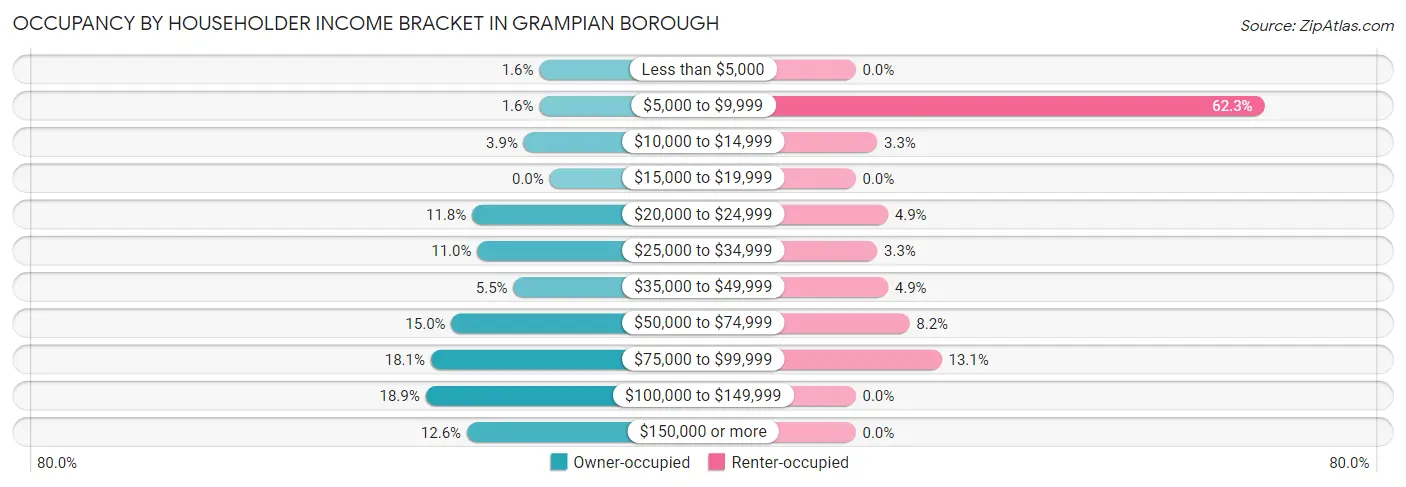
| Income Bracket | Owner-occupied | Renter-occupied |
| Less than $5,000 | 2 (1.6%) | 0 (0.0%) |
| $5,000 to $9,999 | 2 (1.6%) | 38 (62.3%) |
| $10,000 to $14,999 | 5 (3.9%) | 2 (3.3%) |
| $15,000 to $19,999 | 0 (0.0%) | 0 (0.0%) |
| $20,000 to $24,999 | 15 (11.8%) | 3 (4.9%) |
| $25,000 to $34,999 | 14 (11.0%) | 2 (3.3%) |
| $35,000 to $49,999 | 7 (5.5%) | 3 (4.9%) |
| $50,000 to $74,999 | 19 (15.0%) | 5 (8.2%) |
| $75,000 to $99,999 | 23 (18.1%) | 8 (13.1%) |
| $100,000 to $149,999 | 24 (18.9%) | 0 (0.0%) |
| $150,000 or more | 16 (12.6%) | 0 (0.0%) |
| Total | 127 (100.0%) | 61 (100.0%) |
Monthly Housing Cost Tiers in Grampian borough
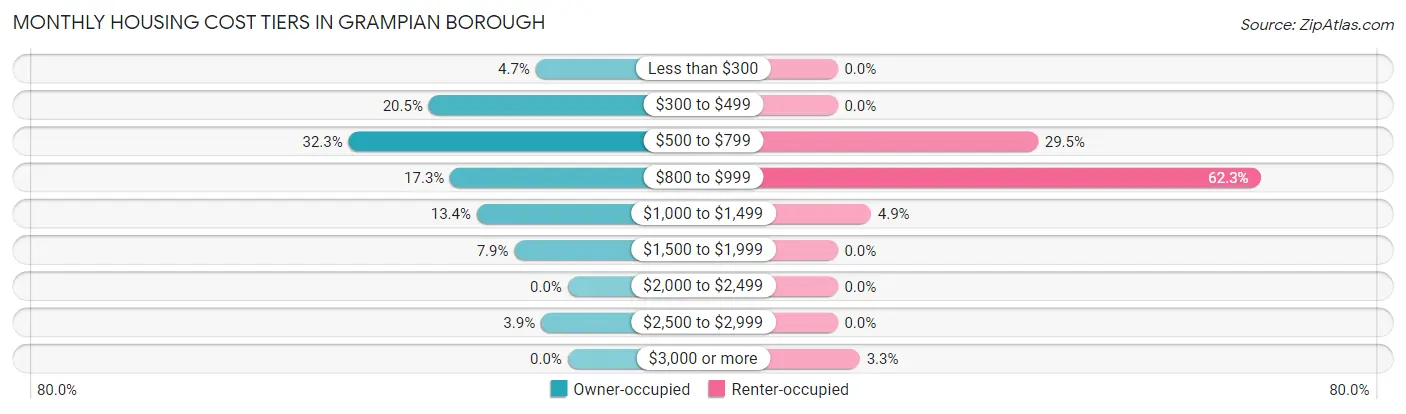
| Monthly Cost | Owner-occupied | Renter-occupied |
| Less than $300 | 6 (4.7%) | 0 (0.0%) |
| $300 to $499 | 26 (20.5%) | 0 (0.0%) |
| $500 to $799 | 41 (32.3%) | 18 (29.5%) |
| $800 to $999 | 22 (17.3%) | 38 (62.3%) |
| $1,000 to $1,499 | 17 (13.4%) | 3 (4.9%) |
| $1,500 to $1,999 | 10 (7.9%) | 0 (0.0%) |
| $2,000 to $2,499 | 0 (0.0%) | 0 (0.0%) |
| $2,500 to $2,999 | 5 (3.9%) | 0 (0.0%) |
| $3,000 or more | 0 (0.0%) | 2 (3.3%) |
| Total | 127 (100.0%) | 61 (100.0%) |
Physical Housing Characteristics in Grampian borough
Housing Structures in Grampian borough
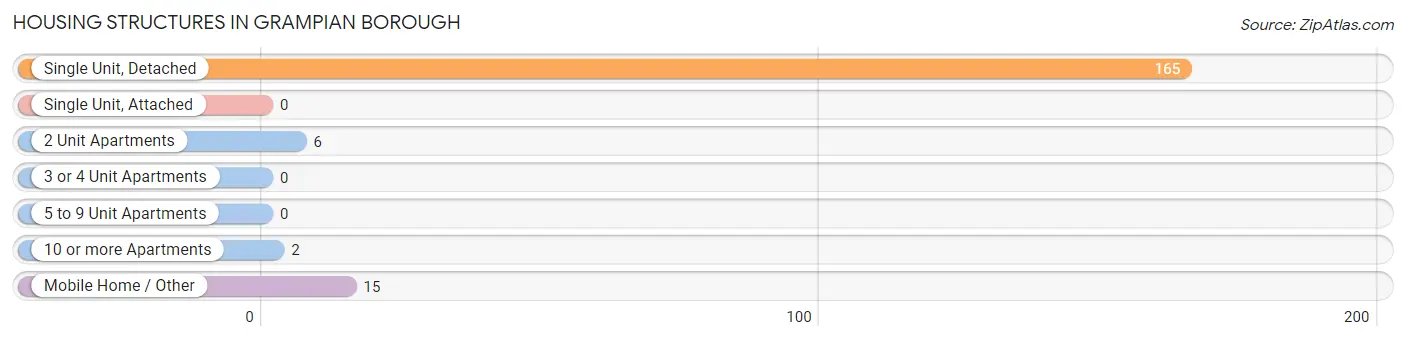
| Structure Type | # Housing Units | % Housing Units |
| Single Unit, Detached | 165 | 87.8% |
| Single Unit, Attached | 0 | 0.0% |
| 2 Unit Apartments | 6 | 3.2% |
| 3 or 4 Unit Apartments | 0 | 0.0% |
| 5 to 9 Unit Apartments | 0 | 0.0% |
| 10 or more Apartments | 2 | 1.1% |
| Mobile Home / Other | 15 | 8.0% |
| Total | 188 | 100.0% |
Housing Structures by Occupancy in Grampian borough
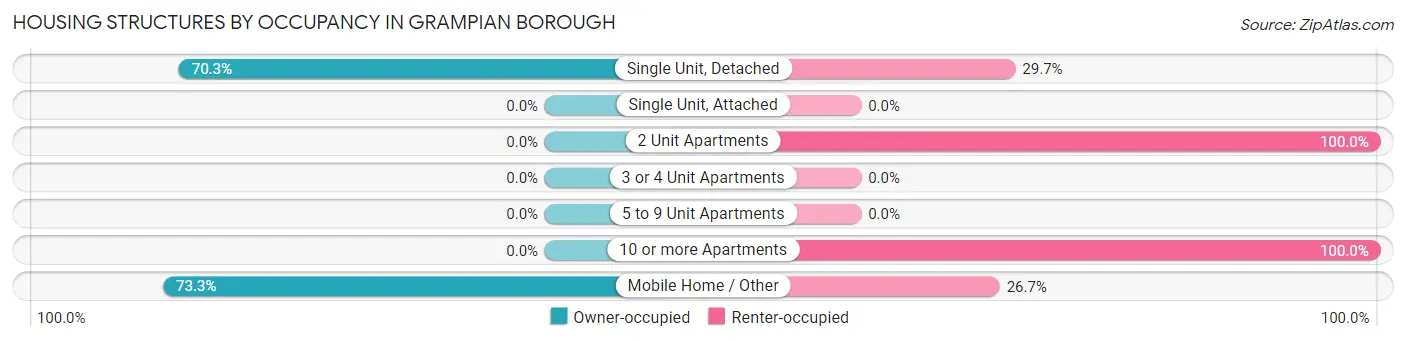
| Structure Type | Owner-occupied | Renter-occupied |
| Single Unit, Detached | 116 (70.3%) | 49 (29.7%) |
| Single Unit, Attached | 0 (0.0%) | 0 (0.0%) |
| 2 Unit Apartments | 0 (0.0%) | 6 (100.0%) |
| 3 or 4 Unit Apartments | 0 (0.0%) | 0 (0.0%) |
| 5 to 9 Unit Apartments | 0 (0.0%) | 0 (0.0%) |
| 10 or more Apartments | 0 (0.0%) | 2 (100.0%) |
| Mobile Home / Other | 11 (73.3%) | 4 (26.7%) |
| Total | 127 (67.5%) | 61 (32.5%) |
Housing Structures by Number of Rooms in Grampian borough
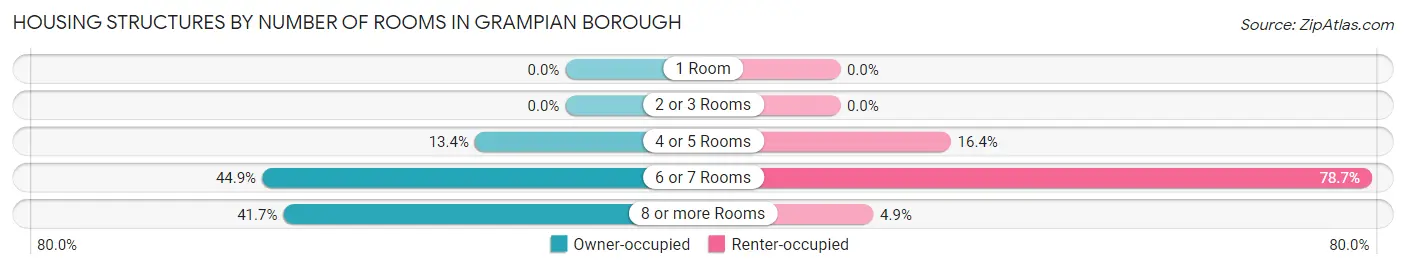
| Number of Rooms | Owner-occupied | Renter-occupied |
| 1 Room | 0 (0.0%) | 0 (0.0%) |
| 2 or 3 Rooms | 0 (0.0%) | 0 (0.0%) |
| 4 or 5 Rooms | 17 (13.4%) | 10 (16.4%) |
| 6 or 7 Rooms | 57 (44.9%) | 48 (78.7%) |
| 8 or more Rooms | 53 (41.7%) | 3 (4.9%) |
| Total | 127 (100.0%) | 61 (100.0%) |
Housing Structure by Heating Type in Grampian borough
| Heating Type | Owner-occupied | Renter-occupied |
| Utility Gas | 0 (0.0%) | 2 (3.3%) |
| Bottled, Tank, or LP Gas | 2 (1.6%) | 0 (0.0%) |
| Electricity | 9 (7.1%) | 6 (9.8%) |
| Fuel Oil or Kerosene | 74 (58.3%) | 49 (80.3%) |
| Coal or Coke | 33 (26.0%) | 4 (6.6%) |
| All other Fuels | 9 (7.1%) | 0 (0.0%) |
| No Fuel Used | 0 (0.0%) | 0 (0.0%) |
| Total | 127 (100.0%) | 61 (100.0%) |
Household Vehicle Usage in Grampian borough
| Vehicles per Household | Owner-occupied | Renter-occupied |
| No Vehicle | 2 (1.6%) | 0 (0.0%) |
| 1 Vehicle | 37 (29.1%) | 47 (77.0%) |
| 2 Vehicles | 51 (40.2%) | 8 (13.1%) |
| 3 or more Vehicles | 37 (29.1%) | 6 (9.8%) |
| Total | 127 (100.0%) | 61 (100.0%) |
Real Estate & Mortgages in Grampian borough
Real Estate and Mortgage Overview in Grampian borough
| Characteristic | Without Mortgage | With Mortgage |
| Housing Units | 66 | 61 |
| Median Property Value | $57,000 | $83,900 |
| Median Household Income | - | - |
| Monthly Housing Costs | $514 | $0 |
| Real Estate Taxes | $771 | $0 |
Property Value by Mortgage Status in Grampian borough
| Property Value | Without Mortgage | With Mortgage |
| Less than $50,000 | 19 (28.8%) | 4 (6.6%) |
| $50,000 to $99,999 | 35 (53.0%) | 37 (60.7%) |
| $100,000 to $299,999 | 11 (16.7%) | 10 (16.4%) |
| $300,000 to $499,999 | 1 (1.5%) | 10 (16.4%) |
| $500,000 to $749,999 | 0 (0.0%) | 0 (0.0%) |
| $750,000 to $999,999 | 0 (0.0%) | 0 (0.0%) |
| $1,000,000 or more | 0 (0.0%) | 0 (0.0%) |
| Total | 66 (100.0%) | 61 (100.0%) |
Household Income by Mortgage Status in Grampian borough
| Household Income | Without Mortgage | With Mortgage |
| Less than $10,000 | 4 (6.1%) | 8 (13.1%) |
| $10,000 to $24,999 | 20 (30.3%) | 0 (0.0%) |
| $25,000 to $34,999 | 10 (15.1%) | 0 (0.0%) |
| $35,000 to $49,999 | 6 (9.1%) | 4 (6.6%) |
| $50,000 to $74,999 | 13 (19.7%) | 1 (1.6%) |
| $75,000 to $99,999 | 5 (7.6%) | 6 (9.8%) |
| $100,000 to $149,999 | 2 (3.0%) | 18 (29.5%) |
| $150,000 or more | 6 (9.1%) | 22 (36.1%) |
| Total | 66 (100.0%) | 61 (100.0%) |
Property Value to Household Income Ratio in Grampian borough
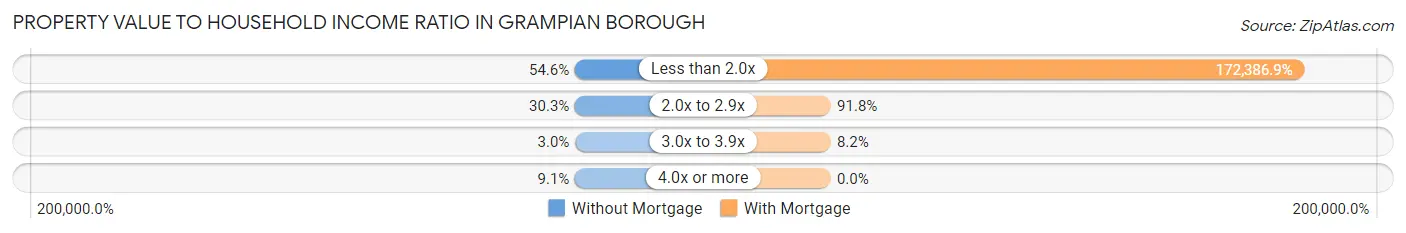
| Value-to-Income Ratio | Without Mortgage | With Mortgage |
| Less than 2.0x | 36 (54.5%) | 105,156 (172,386.9%) |
| 2.0x to 2.9x | 20 (30.3%) | 56 (91.8%) |
| 3.0x to 3.9x | 2 (3.0%) | 5 (8.2%) |
| 4.0x or more | 6 (9.1%) | 0 (0.0%) |
| Total | 66 (100.0%) | 61 (100.0%) |
Real Estate Taxes by Mortgage Status in Grampian borough
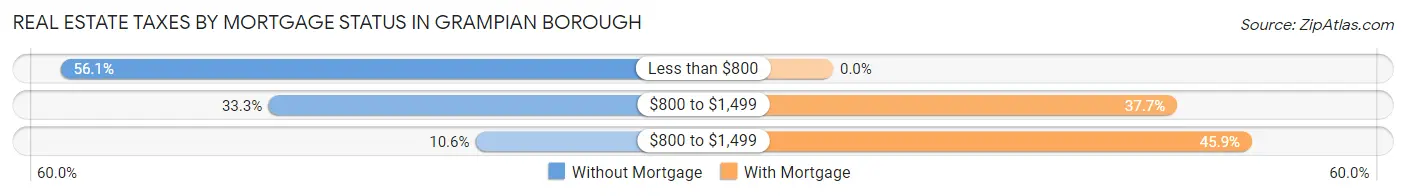
| Property Taxes | Without Mortgage | With Mortgage |
| Less than $800 | 37 (56.1%) | 0 (0.0%) |
| $800 to $1,499 | 22 (33.3%) | 23 (37.7%) |
| $800 to $1,499 | 7 (10.6%) | 28 (45.9%) |
| Total | 66 (100.0%) | 61 (100.0%) |
Health & Disability in Grampian borough
Health Insurance Coverage by Age in Grampian borough
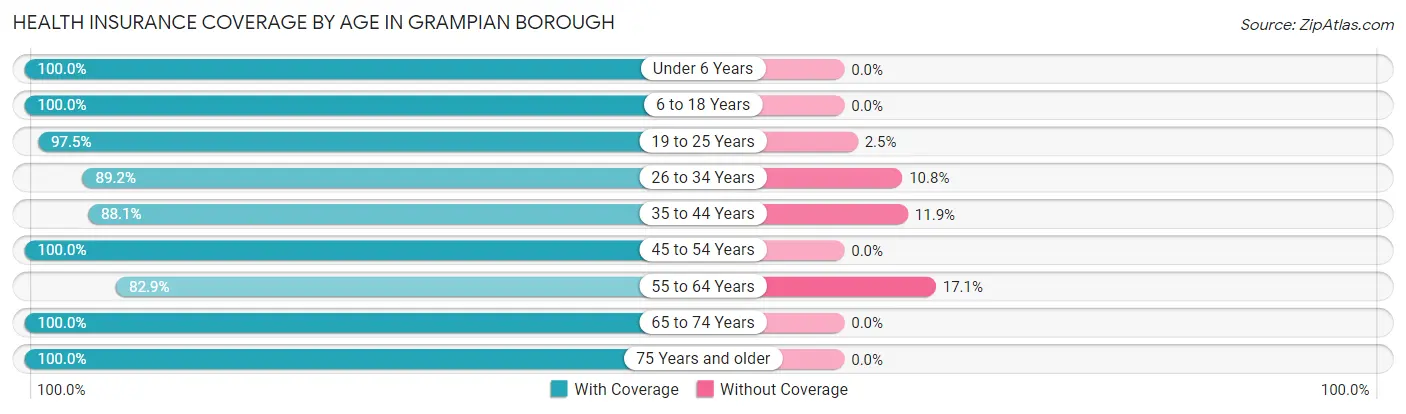
| Age Bracket | With Coverage | Without Coverage |
| Under 6 Years | 15 (100.0%) | 0 (0.0%) |
| 6 to 18 Years | 81 (100.0%) | 0 (0.0%) |
| 19 to 25 Years | 78 (97.5%) | 2 (2.5%) |
| 26 to 34 Years | 33 (89.2%) | 4 (10.8%) |
| 35 to 44 Years | 52 (88.1%) | 7 (11.9%) |
| 45 to 54 Years | 90 (100.0%) | 0 (0.0%) |
| 55 to 64 Years | 34 (82.9%) | 7 (17.1%) |
| 65 to 74 Years | 47 (100.0%) | 0 (0.0%) |
| 75 Years and older | 30 (100.0%) | 0 (0.0%) |
| Total | 460 (95.8%) | 20 (4.2%) |
Health Insurance Coverage by Citizenship Status in Grampian borough
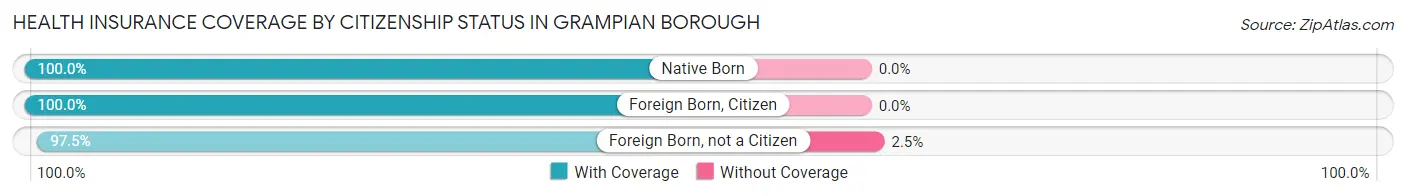
| Citizenship Status | With Coverage | Without Coverage |
| Native Born | 15 (100.0%) | 0 (0.0%) |
| Foreign Born, Citizen | 81 (100.0%) | 0 (0.0%) |
| Foreign Born, not a Citizen | 78 (97.5%) | 2 (2.5%) |
Health Insurance Coverage by Household Income in Grampian borough
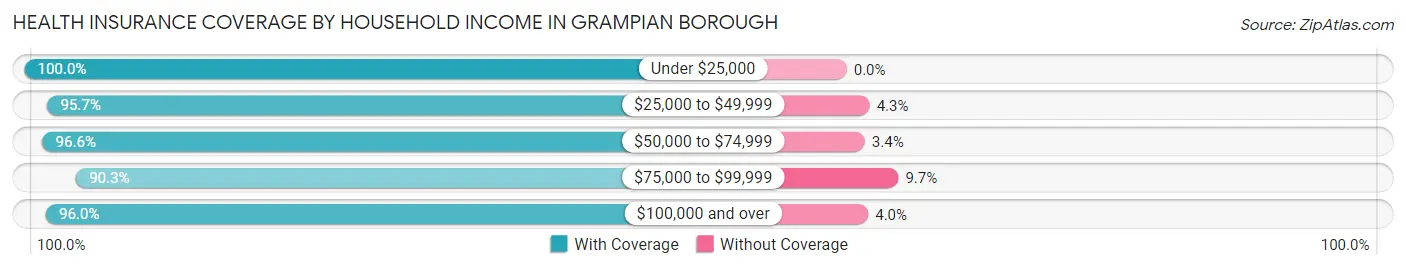
| Household Income | With Coverage | Without Coverage |
| Under $25,000 | 109 (100.0%) | 0 (0.0%) |
| $25,000 to $49,999 | 67 (95.7%) | 3 (4.3%) |
| $50,000 to $74,999 | 57 (96.6%) | 2 (3.4%) |
| $75,000 to $99,999 | 84 (90.3%) | 9 (9.7%) |
| $100,000 and over | 143 (96.0%) | 6 (4.0%) |
Public vs Private Health Insurance Coverage by Age in Grampian borough
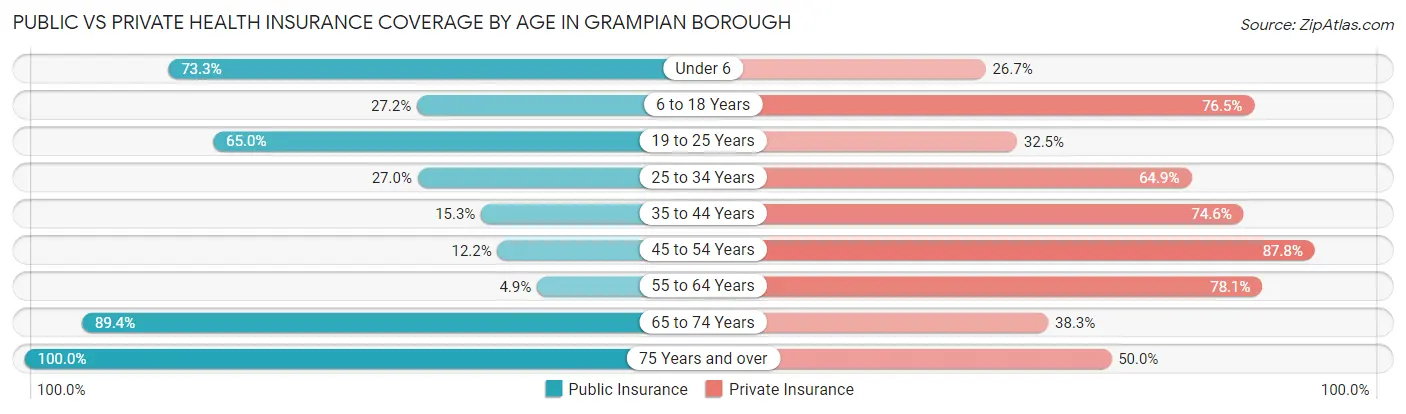
| Age Bracket | Public Insurance | Private Insurance |
| Under 6 | 11 (73.3%) | 4 (26.7%) |
| 6 to 18 Years | 22 (27.2%) | 62 (76.5%) |
| 19 to 25 Years | 52 (65.0%) | 26 (32.5%) |
| 25 to 34 Years | 10 (27.0%) | 24 (64.9%) |
| 35 to 44 Years | 9 (15.2%) | 44 (74.6%) |
| 45 to 54 Years | 11 (12.2%) | 79 (87.8%) |
| 55 to 64 Years | 2 (4.9%) | 32 (78.0%) |
| 65 to 74 Years | 42 (89.4%) | 18 (38.3%) |
| 75 Years and over | 30 (100.0%) | 15 (50.0%) |
| Total | 189 (39.4%) | 304 (63.3%) |
Disability Status by Sex by Age in Grampian borough
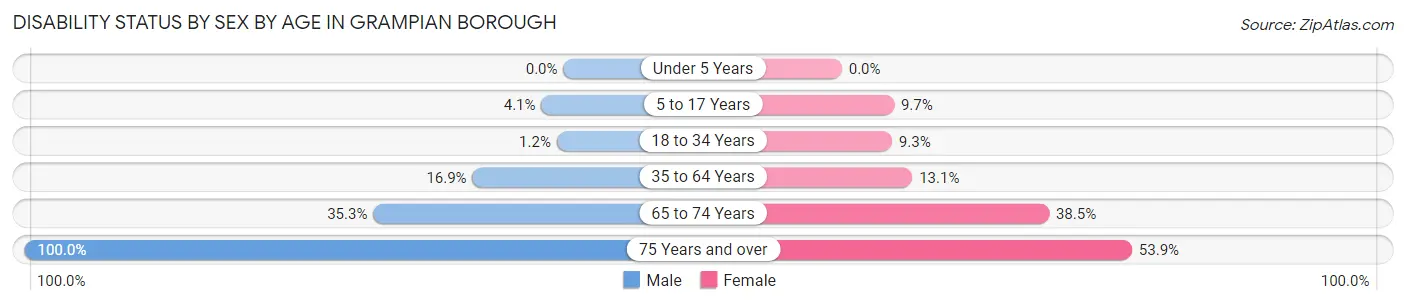
| Age Bracket | Male | Female |
| Under 5 Years | 0 (0.0%) | 0 (0.0%) |
| 5 to 17 Years | 2 (4.1%) | 3 (9.7%) |
| 18 to 34 Years | 1 (1.2%) | 4 (9.3%) |
| 35 to 64 Years | 14 (16.9%) | 14 (13.1%) |
| 65 to 74 Years | 12 (35.3%) | 5 (38.5%) |
| 75 Years and over | 4 (100.0%) | 14 (53.8%) |
Disability Class by Sex by Age in Grampian borough
Disability Class: Hearing Difficulty
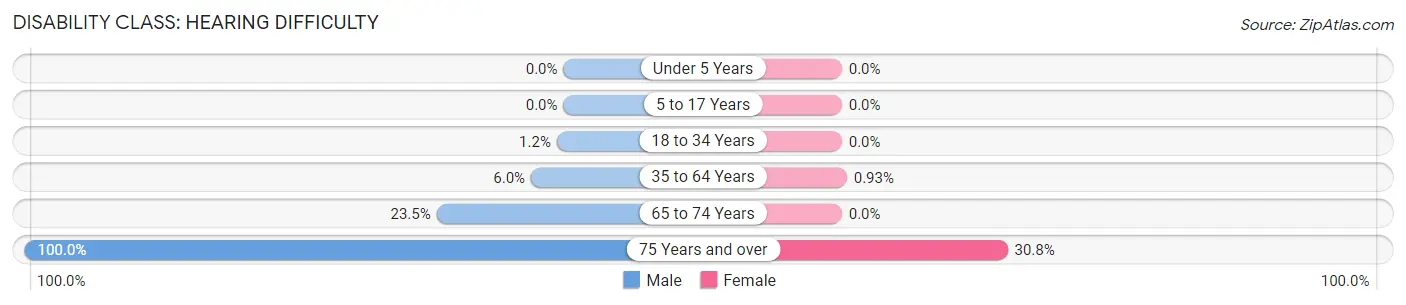
| Age Bracket | Male | Female |
| Under 5 Years | 0 (0.0%) | 0 (0.0%) |
| 5 to 17 Years | 0 (0.0%) | 0 (0.0%) |
| 18 to 34 Years | 1 (1.2%) | 0 (0.0%) |
| 35 to 64 Years | 5 (6.0%) | 1 (0.9%) |
| 65 to 74 Years | 8 (23.5%) | 0 (0.0%) |
| 75 Years and over | 4 (100.0%) | 8 (30.8%) |
Disability Class: Vision Difficulty
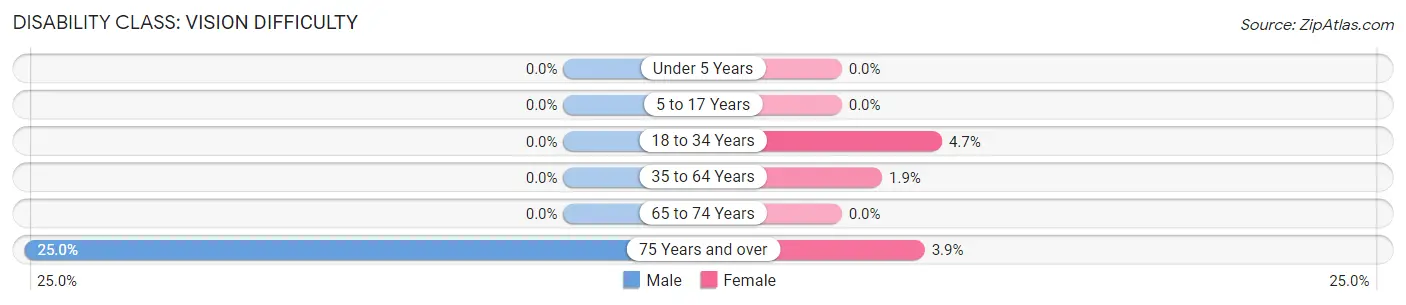
| Age Bracket | Male | Female |
| Under 5 Years | 0 (0.0%) | 0 (0.0%) |
| 5 to 17 Years | 0 (0.0%) | 0 (0.0%) |
| 18 to 34 Years | 0 (0.0%) | 2 (4.6%) |
| 35 to 64 Years | 0 (0.0%) | 2 (1.9%) |
| 65 to 74 Years | 0 (0.0%) | 0 (0.0%) |
| 75 Years and over | 1 (25.0%) | 1 (3.8%) |
Disability Class: Cognitive Difficulty
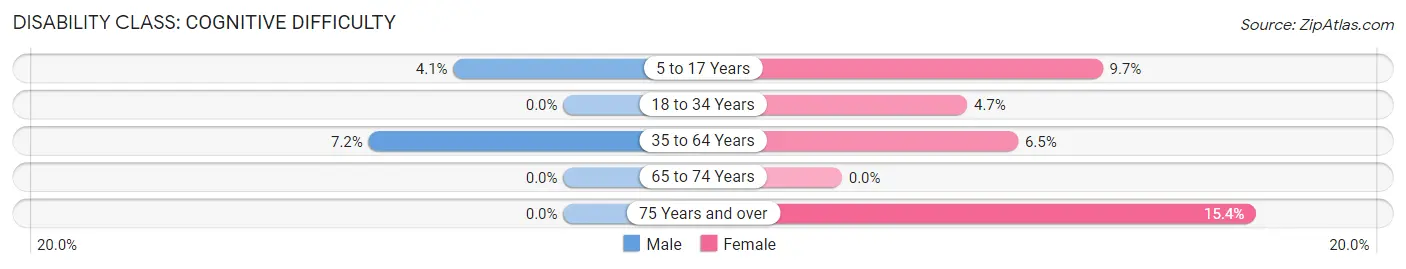
| Age Bracket | Male | Female |
| 5 to 17 Years | 2 (4.1%) | 3 (9.7%) |
| 18 to 34 Years | 0 (0.0%) | 2 (4.6%) |
| 35 to 64 Years | 6 (7.2%) | 7 (6.5%) |
| 65 to 74 Years | 0 (0.0%) | 0 (0.0%) |
| 75 Years and over | 0 (0.0%) | 4 (15.4%) |
Disability Class: Ambulatory Difficulty
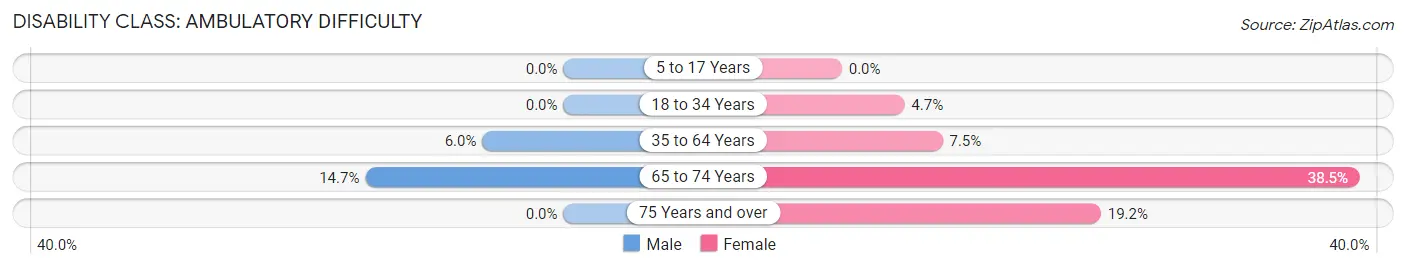
| Age Bracket | Male | Female |
| 5 to 17 Years | 0 (0.0%) | 0 (0.0%) |
| 18 to 34 Years | 0 (0.0%) | 2 (4.6%) |
| 35 to 64 Years | 5 (6.0%) | 8 (7.5%) |
| 65 to 74 Years | 5 (14.7%) | 5 (38.5%) |
| 75 Years and over | 0 (0.0%) | 5 (19.2%) |
Disability Class: Self-Care Difficulty
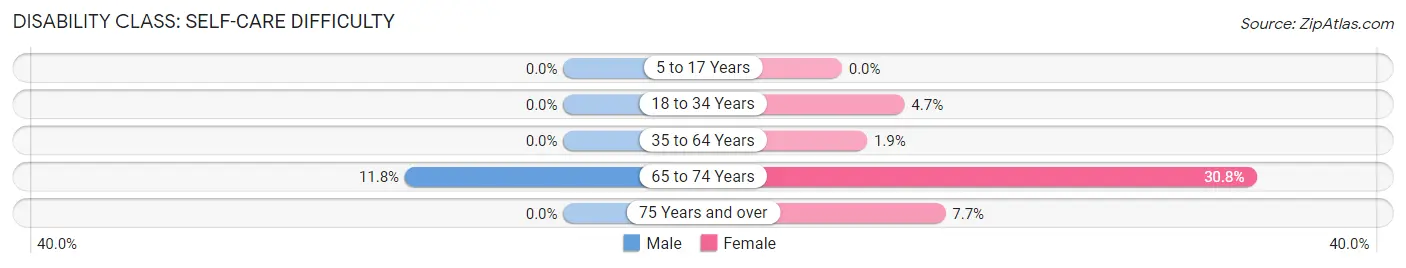
| Age Bracket | Male | Female |
| 5 to 17 Years | 0 (0.0%) | 0 (0.0%) |
| 18 to 34 Years | 0 (0.0%) | 2 (4.6%) |
| 35 to 64 Years | 0 (0.0%) | 2 (1.9%) |
| 65 to 74 Years | 4 (11.8%) | 4 (30.8%) |
| 75 Years and over | 0 (0.0%) | 2 (7.7%) |
Technology Access in Grampian borough
Computing Device Access in Grampian borough
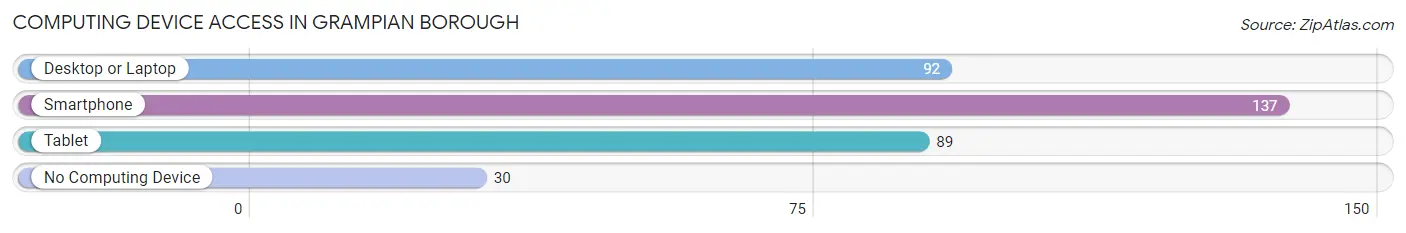
| Device Type | # Households | % Households |
| Desktop or Laptop | 92 | 48.9% |
| Smartphone | 137 | 72.9% |
| Tablet | 89 | 47.3% |
| No Computing Device | 30 | 16.0% |
| Total | 188 | 100.0% |
Internet Access in Grampian borough
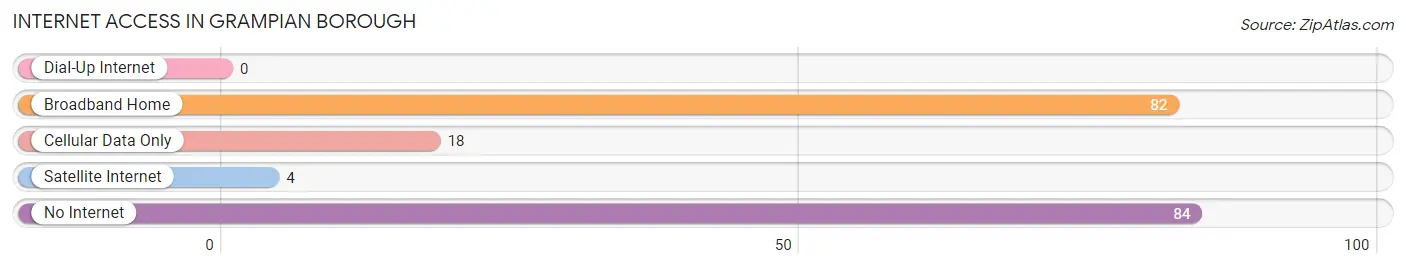
| Internet Type | # Households | % Households |
| Dial-Up Internet | 0 | 0.0% |
| Broadband Home | 82 | 43.6% |
| Cellular Data Only | 18 | 9.6% |
| Satellite Internet | 4 | 2.1% |
| No Internet | 84 | 44.7% |
| Total | 188 | 100.0% |
Grampian borough Summary
Grampian Borough is a borough located in Clearfield County, Pennsylvania. It is situated in the foothills of the Allegheny Mountains and is bordered by the Susquehanna River to the east. The borough is home to a population of approximately 1,400 people and covers an area of 1.2 square miles.
History
Grampian Borough was founded in 1876 and was originally known as Grampian Station. The name was derived from the Grampian Hills, which are located nearby. The area was first settled in the late 1700s by a group of Scots-Irish immigrants who were attracted to the area by its abundant natural resources. The first settlers built a sawmill and gristmill, which provided the foundation for the town’s economy.
In 1876, the town was officially incorporated as a borough and the name was changed to Grampian Borough. The town quickly grew and by the early 1900s, it had become a thriving community with a population of over 1,000 people. The town was home to several businesses, including a hotel, a bank, a post office, a general store, and several churches.
Geography
Grampian Borough is located in Clearfield County, Pennsylvania. It is situated in the foothills of the Allegheny Mountains and is bordered by the Susquehanna River to the east. The borough covers an area of 1.2 square miles and is home to a population of approximately 1,400 people.
The terrain of the borough is mostly hilly and is covered with a mix of deciduous and coniferous trees. The climate is humid continental, with cold winters and warm summers. The average annual temperature is around 50 degrees Fahrenheit.
Economy
The economy of Grampian Borough is largely based on agriculture and tourism. The town is home to several farms, which produce a variety of crops, including corn, soybeans, hay, and wheat. The town is also home to several tourist attractions, including the Grampian Hills State Park, which offers hiking, camping, and fishing opportunities.
The town is also home to several small businesses, including restaurants, retail stores, and service providers. The town is also home to a few manufacturing companies, which produce a variety of products, including furniture, clothing, and electronics.
Demographics
As of the 2010 census, the population of Grampian Borough was 1,400. The racial makeup of the borough was 97.3% White, 0.7% African American, 0.3% Native American, 0.3% Asian, and 1.3% from other races. The median household income was $37,500 and the median family income was $45,000.
The town is home to a variety of religious denominations, including Catholic, Protestant, and Jewish. The town is also home to a variety of educational institutions, including a public elementary school, a public middle school, and a public high school.
Conclusion
Grampian Borough is a small borough located in Clearfield County, Pennsylvania. It is situated in the foothills of the Allegheny Mountains and is bordered by the Susquehanna River to the east. The borough is home to a population of approximately 1,400 people and covers an area of 1.2 square miles. The economy of the borough is largely based on agriculture and tourism, and the town is home to several small businesses, including restaurants, retail stores, and service providers. The town is also home to a variety of religious denominations and educational institutions.
Common Questions
What is Per Capita Income in Grampian borough?
Per Capita income in Grampian borough is $24,541.
What is the Median Family Income in Grampian borough?
Median Family Income in Grampian borough is $56,250.
What is the Median Household income in Grampian borough?
Median Household Income in Grampian borough is $50,625.
What is Inequality or Gini Index in Grampian borough?
Inequality or Gini Index in Grampian borough is 0.48.
What is the Total Population of Grampian borough?
Total Population of Grampian borough is 482.
What is the Total Male Population of Grampian borough?
Total Male Population of Grampian borough is 255.
What is the Total Female Population of Grampian borough?
Total Female Population of Grampian borough is 227.
What is the Ratio of Males per 100 Females in Grampian borough?
There are 112.33 Males per 100 Females in Grampian borough.
What is the Ratio of Females per 100 Males in Grampian borough?
There are 89.02 Females per 100 Males in Grampian borough.
What is the Median Population Age in Grampian borough?
Median Population Age in Grampian borough is 40.0 Years.
What is the Average Family Size in Grampian borough
Average Family Size in Grampian borough is 2.9 People.
What is the Average Household Size in Grampian borough
Average Household Size in Grampian borough is 2.6 People.
How Large is the Labor Force in Grampian borough?
There are 283 People in the Labor Forcein in Grampian borough.
What is the Percentage of People in the Labor Force in Grampian borough?
71.5% of People are in the Labor Force in Grampian borough.
What is the Unemployment Rate in Grampian borough?
Unemployment Rate in Grampian borough is 16.7%.