Tipton, PA Map & Demographics
Tipton Map
Tipton Overview
$35,378
PER CAPITA INCOME
$101,458
AVG FAMILY INCOME
$62,991
AVG HOUSEHOLD INCOME
16.1%
WAGE / INCOME GAP [ % ]
83.9¢/ $1
WAGE / INCOME GAP [ $ ]
0.37
INEQUALITY / GINI INDEX
519
TOTAL POPULATION
212
MALE POPULATION
307
FEMALE POPULATION
69.06
MALES / 100 FEMALES
144.81
FEMALES / 100 MALES
40.5
MEDIAN AGE
3.3
AVG FAMILY SIZE
2.1
AVG HOUSEHOLD SIZE
310
LABOR FORCE [ PEOPLE ]
71.6%
PERCENT IN LABOR FORCE
Tipton Zip Codes
Tipton Area Codes
Income in Tipton
Income Overview in Tipton
Per Capita Income in Tipton is $35,378, while median incomes of families and households are $101,458 and $62,991 respectively.
| Characteristic | Number | Measure |
| Per Capita Income | 519 | $35,378 |
| Median Family Income | 114 | $101,458 |
| Mean Family Income | 114 | $112,826 |
| Median Household Income | 243 | $62,991 |
| Mean Household Income | 243 | $74,440 |
| Income Deficit | 114 | $0 |
| Wage / Income Gap (%) | 519 | 16.14% |
| Wage / Income Gap ($) | 519 | 83.86¢ per $1 |
| Gini / Inequality Index | 519 | 0.37 |
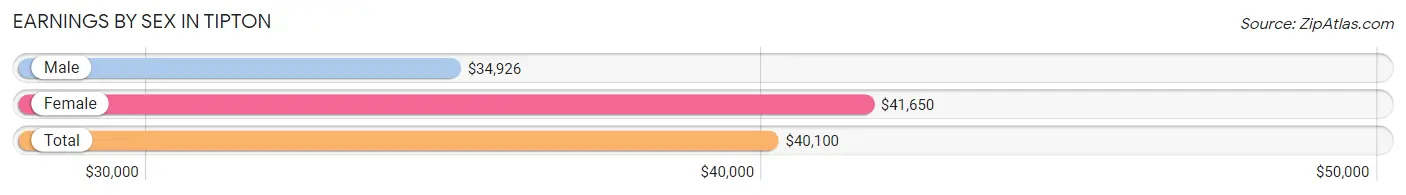
Earnings by Sex in Tipton
Average Earnings in Tipton are $40,100, $34,926 for men and $41,650 for women, a difference of 16.1%.
| Sex | Number | Average Earnings |
| Male | 119 (38.4%) | $34,926 |
| Female | 191 (61.6%) | $41,650 |
| Total | 310 (100.0%) | $40,100 |
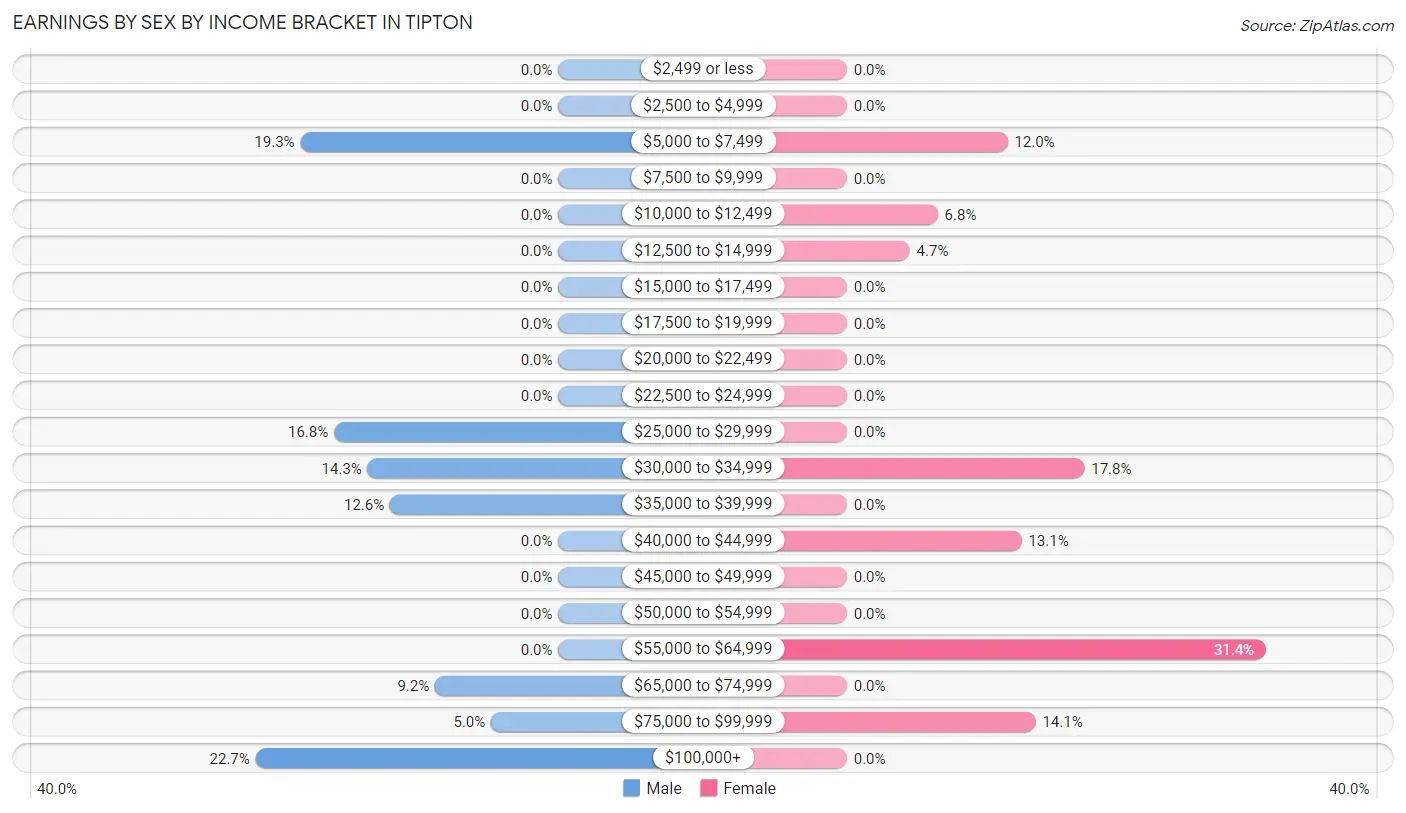
Earnings by Sex by Income Bracket in Tipton
The most common earnings brackets in Tipton are $100,000+ for men (27 | 22.7%) and $55,000 to $64,999 for women (60 | 31.4%).
| Income | Male | Female |
| $2,499 or less | 0 (0.0%) | 0 (0.0%) |
| $2,500 to $4,999 | 0 (0.0%) | 0 (0.0%) |
| $5,000 to $7,499 | 23 (19.3%) | 23 (12.0%) |
| $7,500 to $9,999 | 0 (0.0%) | 0 (0.0%) |
| $10,000 to $12,499 | 0 (0.0%) | 13 (6.8%) |
| $12,500 to $14,999 | 0 (0.0%) | 9 (4.7%) |
| $15,000 to $17,499 | 0 (0.0%) | 0 (0.0%) |
| $17,500 to $19,999 | 0 (0.0%) | 0 (0.0%) |
| $20,000 to $22,499 | 0 (0.0%) | 0 (0.0%) |
| $22,500 to $24,999 | 0 (0.0%) | 0 (0.0%) |
| $25,000 to $29,999 | 20 (16.8%) | 0 (0.0%) |
| $30,000 to $34,999 | 17 (14.3%) | 34 (17.8%) |
| $35,000 to $39,999 | 15 (12.6%) | 0 (0.0%) |
| $40,000 to $44,999 | 0 (0.0%) | 25 (13.1%) |
| $45,000 to $49,999 | 0 (0.0%) | 0 (0.0%) |
| $50,000 to $54,999 | 0 (0.0%) | 0 (0.0%) |
| $55,000 to $64,999 | 0 (0.0%) | 60 (31.4%) |
| $65,000 to $74,999 | 11 (9.2%) | 0 (0.0%) |
| $75,000 to $99,999 | 6 (5.0%) | 27 (14.1%) |
| $100,000+ | 27 (22.7%) | 0 (0.0%) |
| Total | 119 (100.0%) | 191 (100.0%) |
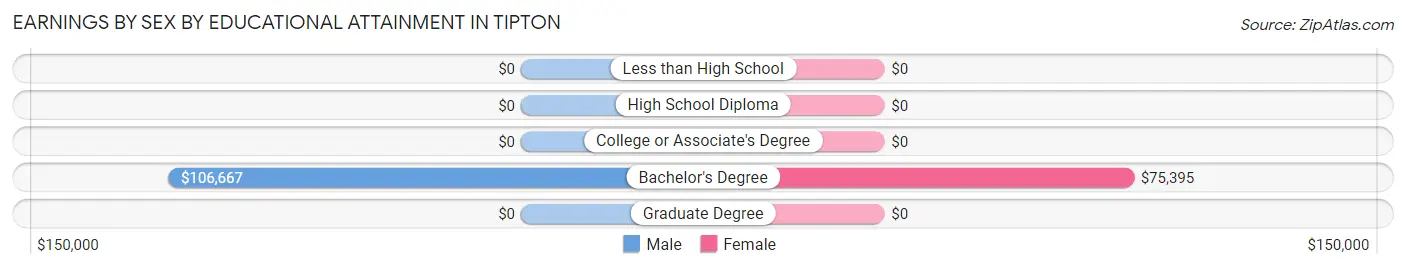
Earnings by Sex by Educational Attainment in Tipton
| Educational Attainment | Male Income | Female Income |
| Less than High School | - | - |
| High School Diploma | - | - |
| College or Associate's Degree | - | - |
| Bachelor's Degree | $106,667 | $75,395 |
| Graduate Degree | - | - |
| Total | - | - |
Family Income in Tipton
Family Income Brackets in Tipton
According to the Tipton family income data, there are 37 families falling into the $100,000 to $149,999 income range, which is the most common income bracket and makes up 32.5% of all families.
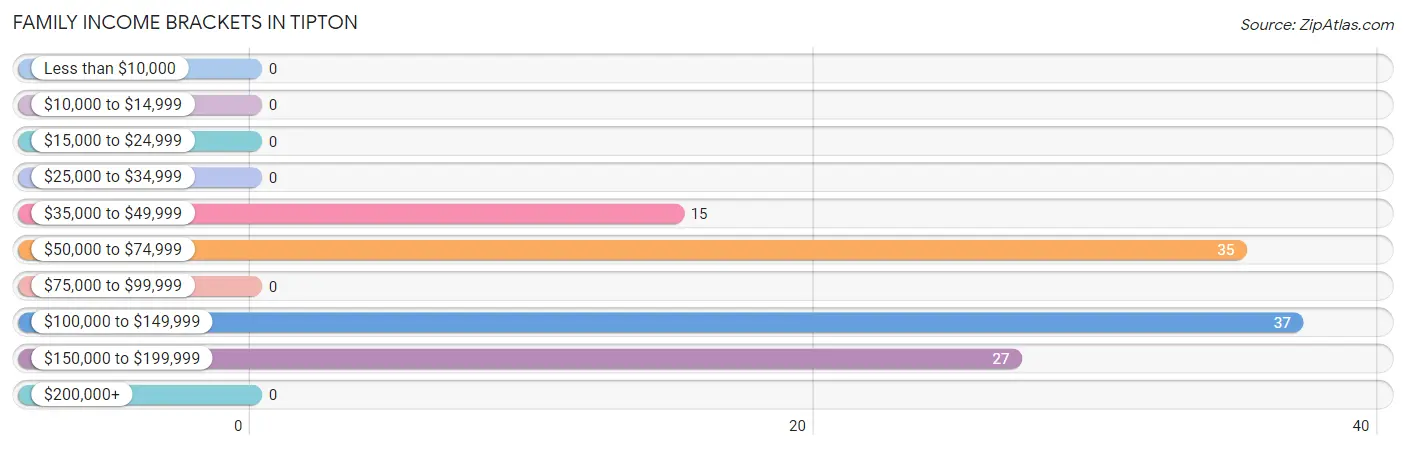
| Income Bracket | # Families | % Families |
| Less than $10,000 | 0 | 0.0% |
| $10,000 to $14,999 | 0 | 0.0% |
| $15,000 to $24,999 | 0 | 0.0% |
| $25,000 to $34,999 | 0 | 0.0% |
| $35,000 to $49,999 | 15 | 13.2% |
| $50,000 to $74,999 | 35 | 30.7% |
| $75,000 to $99,999 | 0 | 0.0% |
| $100,000 to $149,999 | 37 | 32.5% |
| $150,000 to $199,999 | 27 | 23.7% |
| $200,000+ | 0 | 0.0% |
Family Income by Famaliy Size in Tipton
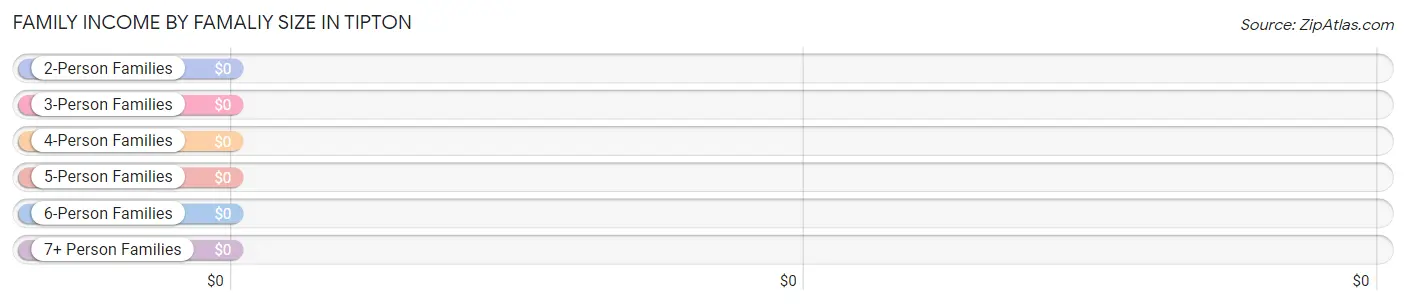
| Income Bracket | # Families | Median Income |
| 2-Person Families | 46 (40.4%) | $0 |
| 3-Person Families | 25 (21.9%) | $0 |
| 4-Person Families | 19 (16.7%) | $0 |
| 5-Person Families | 24 (21.0%) | $0 |
| 6-Person Families | 0 (0.0%) | $0 |
| 7+ Person Families | 0 (0.0%) | $0 |
| Total | 114 (100.0%) | $101,458 |
Family Income by Number of Earners in Tipton
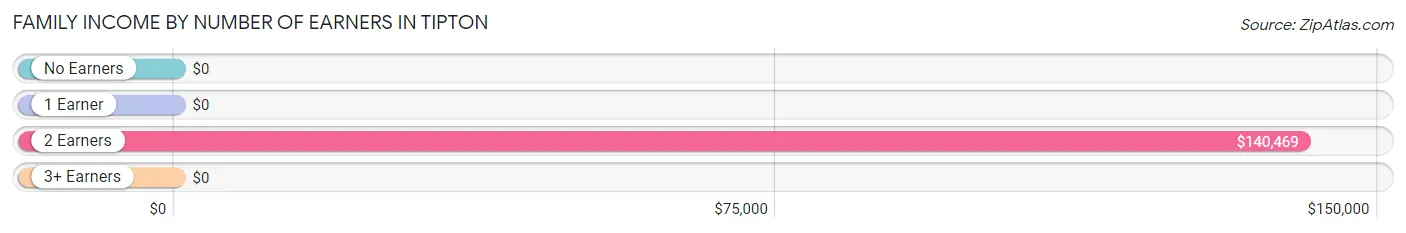
| Number of Earners | # Families | Median Income |
| No Earners | 16 (14.0%) | $0 |
| 1 Earner | 15 (13.2%) | $0 |
| 2 Earners | 49 (43.0%) | $140,469 |
| 3+ Earners | 34 (29.8%) | $0 |
| Total | 114 (100.0%) | $101,458 |
Household Income in Tipton
Household Income Brackets in Tipton
With 63 households falling in the category, the $35,000 to $49,999 income range is the most frequent in Tipton, accounting for 25.9% of all households.
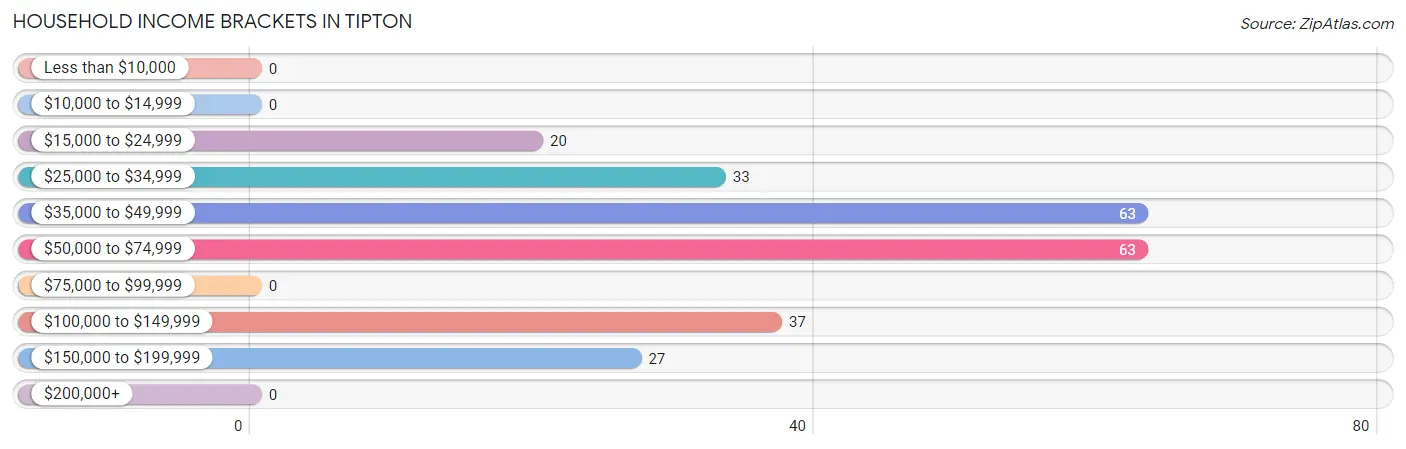
| Income Bracket | # Households | % Households |
| Less than $10,000 | 0 | 0.0% |
| $10,000 to $14,999 | 0 | 0.0% |
| $15,000 to $24,999 | 20 | 8.2% |
| $25,000 to $34,999 | 33 | 13.6% |
| $35,000 to $49,999 | 63 | 25.9% |
| $50,000 to $74,999 | 63 | 25.9% |
| $75,000 to $99,999 | 0 | 0.0% |
| $100,000 to $149,999 | 37 | 15.2% |
| $150,000 to $199,999 | 27 | 11.1% |
| $200,000+ | 0 | 0.0% |
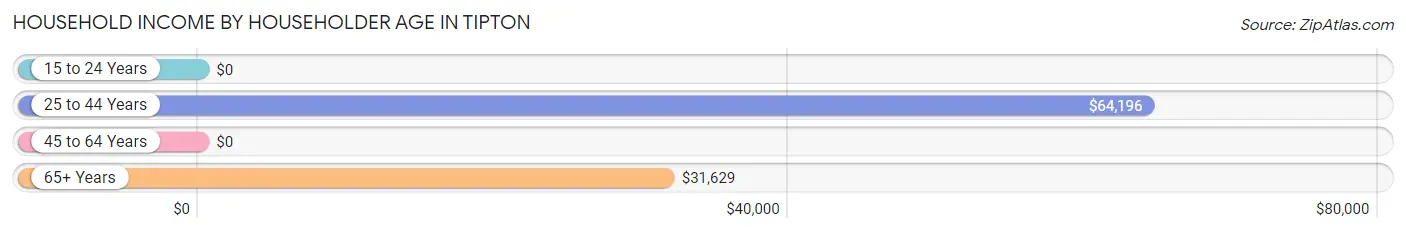
Household Income by Householder Age in Tipton
The median household income in Tipton is $62,991, with the highest median household income of $64,196 found in the 25 to 44 years age bracket for the primary householder. A total of 56 households (23.1%) fall into this category. Meanwhile, the 15 to 24 years age bracket for the primary householder has the lowest median household income of $0, with 25 households (10.3%) in this group.
| Income Bracket | # Households | Median Income |
| 15 to 24 Years | 25 (10.3%) | $0 |
| 25 to 44 Years | 56 (23.1%) | $64,196 |
| 45 to 64 Years | 79 (32.5%) | $0 |
| 65+ Years | 83 (34.2%) | $31,629 |
| Total | 243 (100.0%) | $62,991 |
Poverty in Tipton
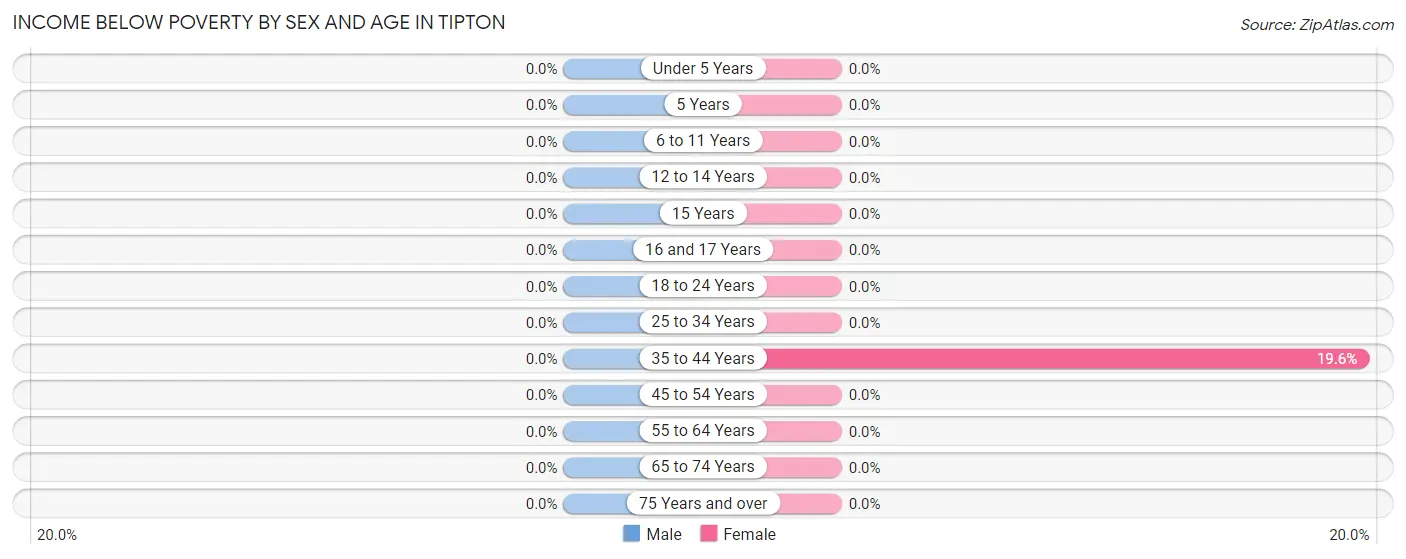
Income Below Poverty by Sex and Age in Tipton
| Age Bracket | Male | Female |
| Under 5 Years | 0 (0.0%) | 0 (0.0%) |
| 5 Years | 0 (0.0%) | 0 (0.0%) |
| 6 to 11 Years | 0 (0.0%) | 0 (0.0%) |
| 12 to 14 Years | 0 (0.0%) | 0 (0.0%) |
| 15 Years | 0 (0.0%) | 0 (0.0%) |
| 16 and 17 Years | 0 (0.0%) | 0 (0.0%) |
| 18 to 24 Years | 0 (0.0%) | 0 (0.0%) |
| 25 to 34 Years | 0 (0.0%) | 0 (0.0%) |
| 35 to 44 Years | 0 (0.0%) | 9 (19.6%) |
| 45 to 54 Years | 0 (0.0%) | 0 (0.0%) |
| 55 to 64 Years | 0 (0.0%) | 0 (0.0%) |
| 65 to 74 Years | 0 (0.0%) | 0 (0.0%) |
| 75 Years and over | 0 (0.0%) | 0 (0.0%) |
| Total | 0 (0.0%) | 9 (2.9%) |
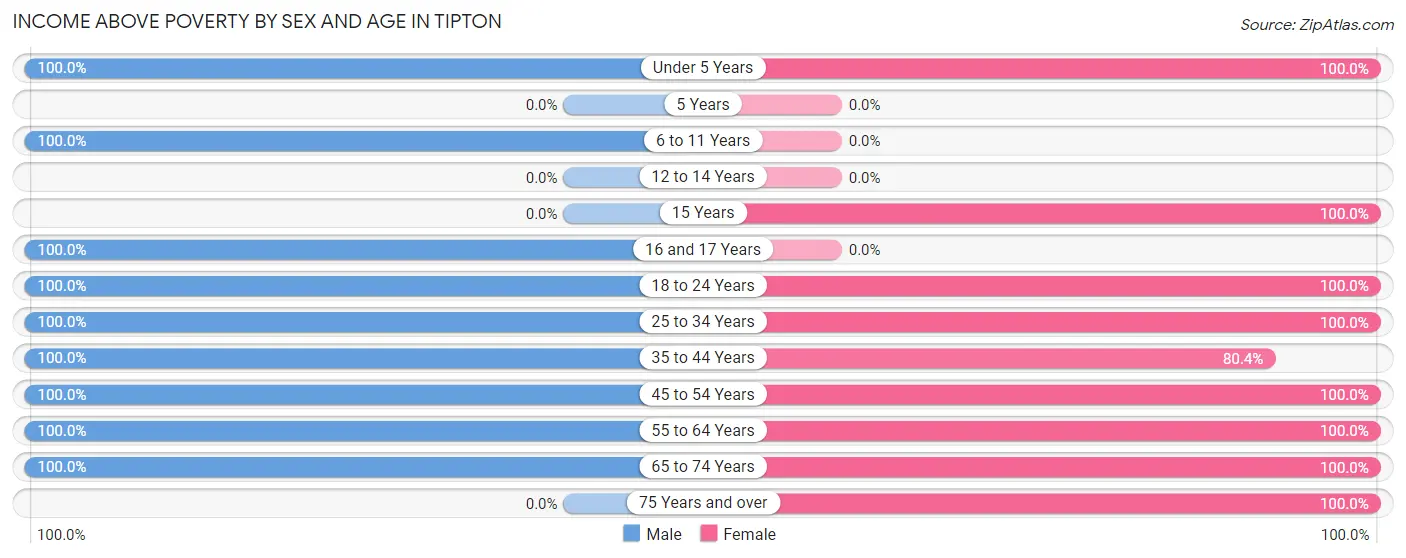
Income Above Poverty by Sex and Age in Tipton
According to the poverty statistics in Tipton, males aged under 5 years and females aged under 5 years are the age groups that are most secure financially, with 100.0% of males and 100.0% of females in these age groups living above the poverty line.
| Age Bracket | Male | Female |
| Under 5 Years | 15 (100.0%) | 22 (100.0%) |
| 5 Years | 0 (0.0%) | 0 (0.0%) |
| 6 to 11 Years | 38 (100.0%) | 0 (0.0%) |
| 12 to 14 Years | 0 (0.0%) | 0 (0.0%) |
| 15 Years | 0 (0.0%) | 11 (100.0%) |
| 16 and 17 Years | 8 (100.0%) | 0 (0.0%) |
| 18 to 24 Years | 39 (100.0%) | 55 (100.0%) |
| 25 to 34 Years | 35 (100.0%) | 11 (100.0%) |
| 35 to 44 Years | 8 (100.0%) | 37 (80.4%) |
| 45 to 54 Years | 29 (100.0%) | 48 (100.0%) |
| 55 to 64 Years | 24 (100.0%) | 31 (100.0%) |
| 65 to 74 Years | 16 (100.0%) | 30 (100.0%) |
| 75 Years and over | 0 (0.0%) | 53 (100.0%) |
| Total | 212 (100.0%) | 298 (97.1%) |
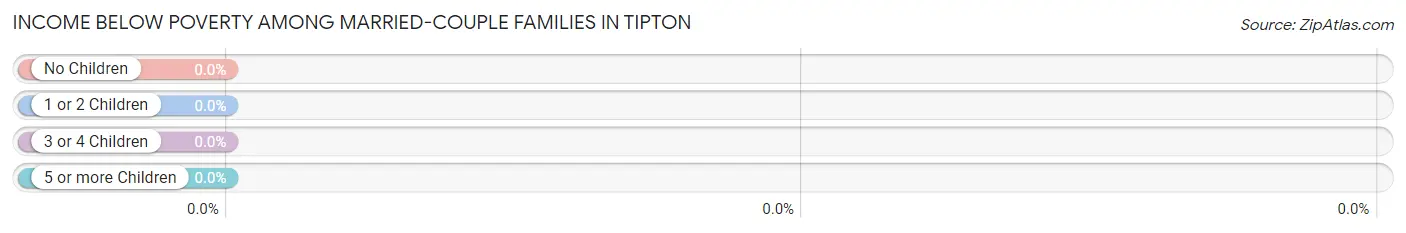
Income Below Poverty Among Married-Couple Families in Tipton
| Children | Above Poverty | Below Poverty |
| No Children | 59 (100.0%) | 0 (0.0%) |
| 1 or 2 Children | 28 (100.0%) | 0 (0.0%) |
| 3 or 4 Children | 0 (0.0%) | 0 (0.0%) |
| 5 or more Children | 0 (0.0%) | 0 (0.0%) |
| Total | 87 (100.0%) | 0 (0.0%) |
Income Below Poverty Among Single-Parent Households in Tipton
| Children | Single Father | Single Mother |
| No Children | 0 (0.0%) | 0 (0.0%) |
| 1 or 2 Children | 0 (0.0%) | 0 (0.0%) |
| 3 or 4 Children | 0 (0.0%) | 0 (0.0%) |
| 5 or more Children | 0 (0.0%) | 0 (0.0%) |
| Total | 0 (0.0%) | 0 (0.0%) |
Income Below Poverty Among Married-Couple vs Single-Parent Households in Tipton
| Children | Married-Couple Families | Single-Parent Households |
| No Children | 0 (0.0%) | 0 (0.0%) |
| 1 or 2 Children | 0 (0.0%) | 0 (0.0%) |
| 3 or 4 Children | 0 (0.0%) | 0 (0.0%) |
| 5 or more Children | 0 (0.0%) | 0 (0.0%) |
| Total | 0 (0.0%) | 0 (0.0%) |
Race in Tipton
The most populous races in Tipton are , and White / Caucasian (519 | 100.0%).
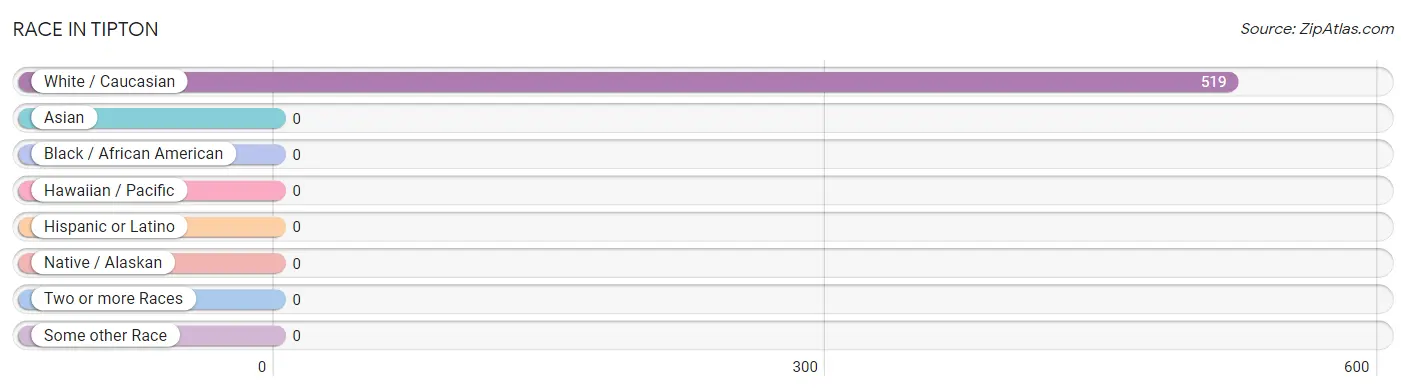
| Race | # Population | % Population |
| Asian | 0 | 0.0% |
| Black / African American | 0 | 0.0% |
| Hawaiian / Pacific | 0 | 0.0% |
| Hispanic or Latino | 0 | 0.0% |
| Native / Alaskan | 0 | 0.0% |
| White / Caucasian | 519 | 100.0% |
| Two or more Races | 0 | 0.0% |
| Some other Race | 0 | 0.0% |
| Total | 519 | 100.0% |
Ancestry in Tipton
The most populous ancestries reported in Tipton are German (226 | 43.5%), Irish (181 | 34.9%), Italian (107 | 20.6%), French (45 | 8.7%), and English (37 | 7.1%), together accounting for 114.8% of all Tipton residents.
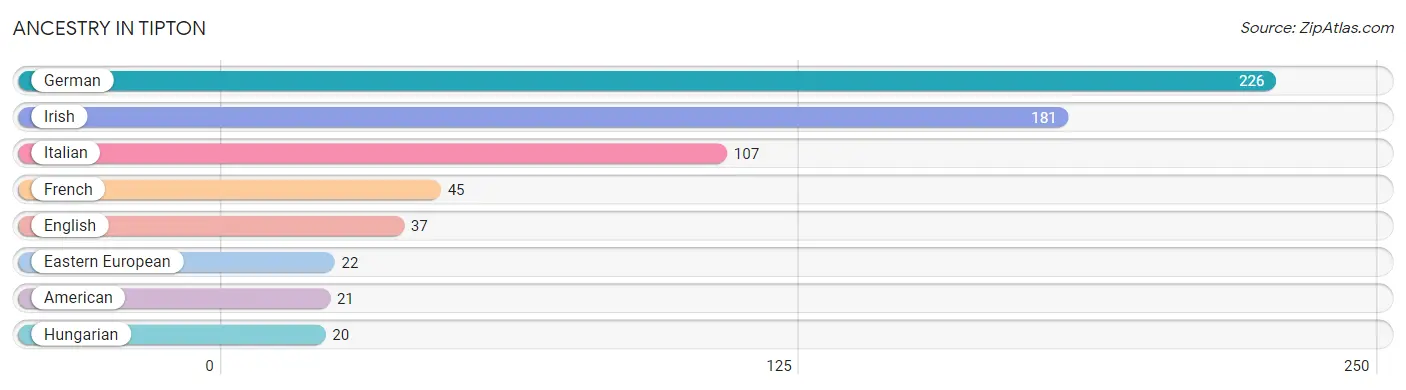
| Ancestry | # Population | % Population |
| American | 21 | 4.1% |
| Eastern European | 22 | 4.2% |
| English | 37 | 7.1% |
| French | 45 | 8.7% |
| German | 226 | 43.5% |
| Hungarian | 20 | 3.8% |
| Irish | 181 | 34.9% |
| Italian | 107 | 20.6% | View All 8 Rows |
Immigrants in Tipton

| Immigration Origin | # Population | % Population | View All 0 Rows |
Sex and Age in Tipton
Sex and Age in Tipton
The most populous age groups in Tipton are 50 to 54 Years (29 | 13.7%) for men and 15 to 19 Years (34 | 11.1%) for women.
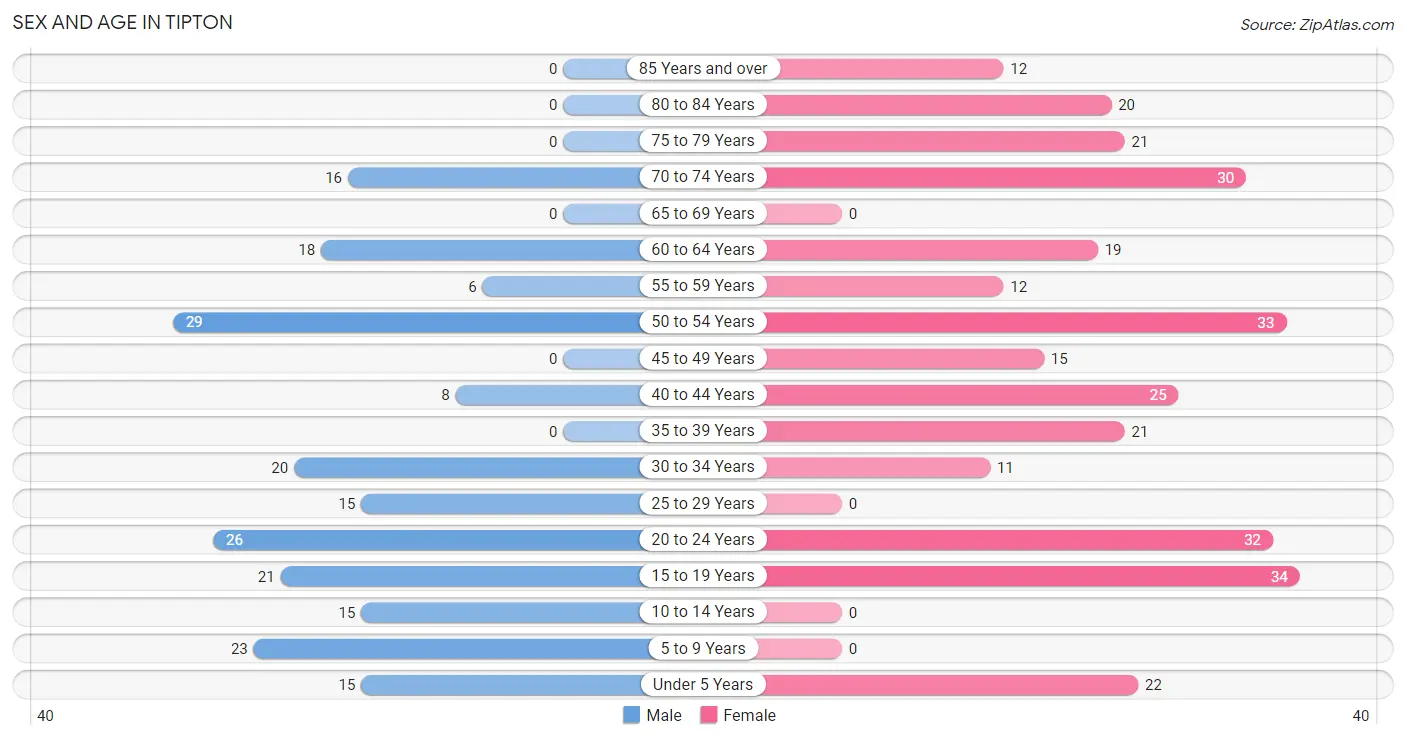
| Age Bracket | Male | Female |
| Under 5 Years | 15 (7.1%) | 22 (7.2%) |
| 5 to 9 Years | 23 (10.8%) | 0 (0.0%) |
| 10 to 14 Years | 15 (7.1%) | 0 (0.0%) |
| 15 to 19 Years | 21 (9.9%) | 34 (11.1%) |
| 20 to 24 Years | 26 (12.3%) | 32 (10.4%) |
| 25 to 29 Years | 15 (7.1%) | 0 (0.0%) |
| 30 to 34 Years | 20 (9.4%) | 11 (3.6%) |
| 35 to 39 Years | 0 (0.0%) | 21 (6.8%) |
| 40 to 44 Years | 8 (3.8%) | 25 (8.1%) |
| 45 to 49 Years | 0 (0.0%) | 15 (4.9%) |
| 50 to 54 Years | 29 (13.7%) | 33 (10.7%) |
| 55 to 59 Years | 6 (2.8%) | 12 (3.9%) |
| 60 to 64 Years | 18 (8.5%) | 19 (6.2%) |
| 65 to 69 Years | 0 (0.0%) | 0 (0.0%) |
| 70 to 74 Years | 16 (7.5%) | 30 (9.8%) |
| 75 to 79 Years | 0 (0.0%) | 21 (6.8%) |
| 80 to 84 Years | 0 (0.0%) | 20 (6.5%) |
| 85 Years and over | 0 (0.0%) | 12 (3.9%) |
| Total | 212 (100.0%) | 307 (100.0%) |
Families and Households in Tipton
Median Family Size in Tipton
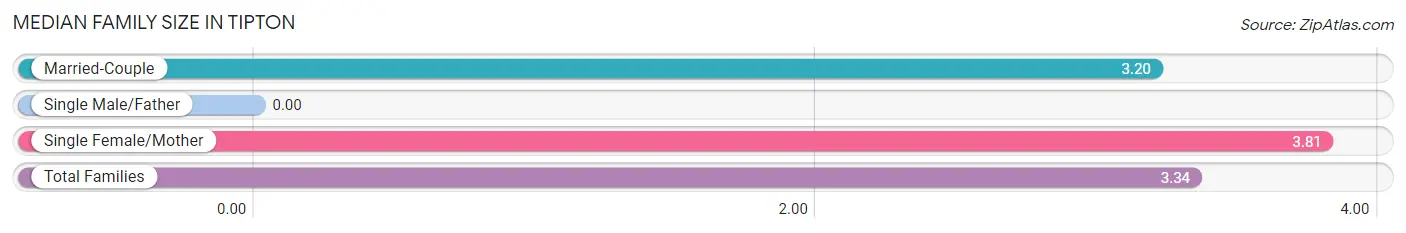
| Family Type | # Families | Family Size |
| Married-Couple | 87 (76.3%) | 3.20 |
| Single Male/Father | 0 (0.0%) | - |
| Single Female/Mother | 27 (23.7%) | 3.81 |
| Total Families | 114 (100.0%) | 3.34 |
Median Household Size in Tipton
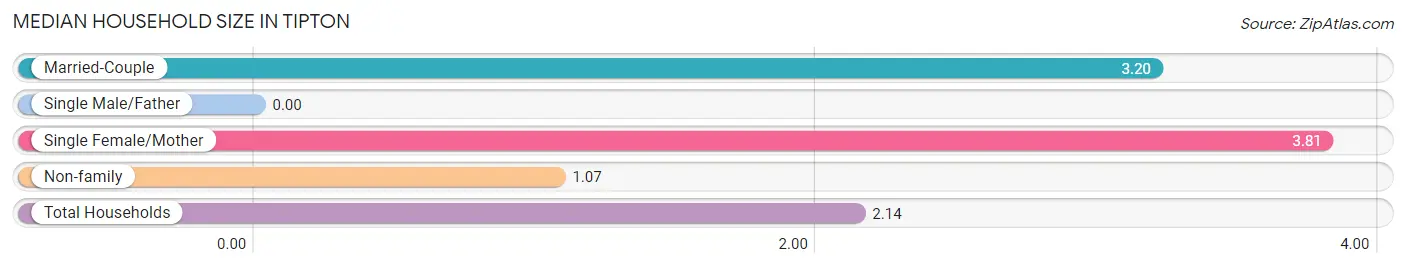
| Household Type | # Households | Household Size |
| Married-Couple | 87 (35.8%) | 3.20 |
| Single Male/Father | 0 (0.0%) | - |
| Single Female/Mother | 27 (11.1%) | 3.81 |
| Non-family | 129 (53.1%) | 1.07 |
| Total Households | 243 (100.0%) | 2.14 |
Household Size by Marriage Status in Tipton
Out of a total of 243 households in Tipton, 114 (46.9%) are family households, while 129 (53.1%) are nonfamily households. The most numerous type of family households are 2-person households, comprising 46, and the most common type of nonfamily households are 1-person households, comprising 120.
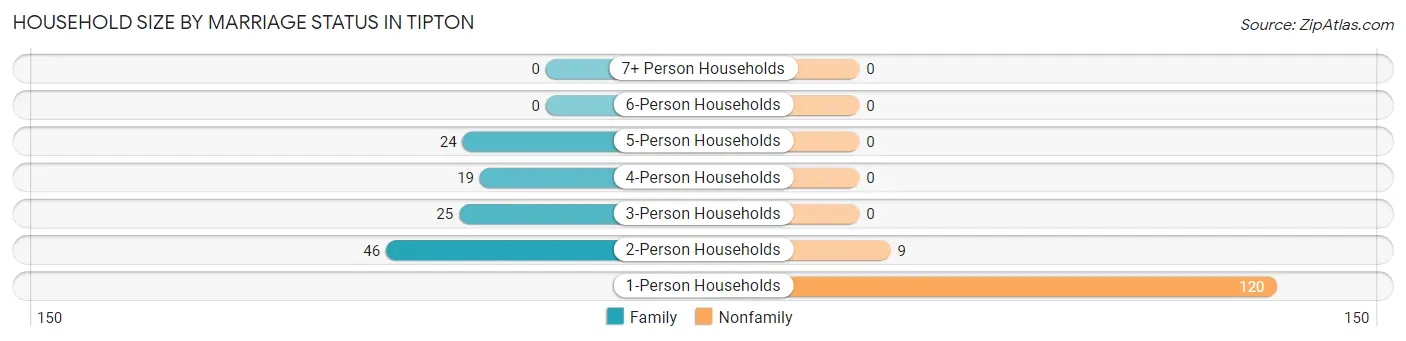
| Household Size | Family Households | Nonfamily Households |
| 1-Person Households | - | 120 (49.4%) |
| 2-Person Households | 46 (18.9%) | 9 (3.7%) |
| 3-Person Households | 25 (10.3%) | 0 (0.0%) |
| 4-Person Households | 19 (7.8%) | 0 (0.0%) |
| 5-Person Households | 24 (9.9%) | 0 (0.0%) |
| 6-Person Households | 0 (0.0%) | 0 (0.0%) |
| 7+ Person Households | 0 (0.0%) | 0 (0.0%) |
| Total | 114 (46.9%) | 129 (53.1%) |
Female Fertility in Tipton
Fertility by Age in Tipton
| Age Bracket | Women with Births | Births / 1,000 Women |
| 15 to 19 years | 0 (0.0%) | 0.0 |
| 20 to 34 years | 0 (0.0%) | 0.0 |
| 35 to 50 years | 0 (0.0%) | 0.0 |
| Total | 0 (0.0%) | 0.0 |
Fertility by Age by Marriage Status in Tipton
| Age Bracket | Married | Unmarried |
| 15 to 19 years | 0 (0.0%) | 0 (0.0%) |
| 20 to 34 years | 0 (0.0%) | 0 (0.0%) |
| 35 to 50 years | 0 (0.0%) | 0 (0.0%) |
| Total | 0 (0.0%) | 0 (0.0%) |
Fertility by Education in Tipton
| Educational Attainment | Women with Births | Births / 1,000 Women |
| Less than High School | 0 (0.0%) | 0.0 |
| High School Diploma | 0 (0.0%) | 0.0 |
| College or Associate's Degree | 0 (0.0%) | 0.0 |
| Bachelor's Degree | 0 (0.0%) | 0.0 |
| Graduate Degree | 0 (0.0%) | 0.0 |
| Total | 0 (0.0%) | 0.0 |
Fertility by Education by Marriage Status in Tipton
| Educational Attainment | Married | Unmarried |
| Less than High School | 0 (0.0%) | 0 (0.0%) |
| High School Diploma | 0 (0.0%) | 0 (0.0%) |
| College or Associate's Degree | 0 (0.0%) | 0 (0.0%) |
| Bachelor's Degree | 0 (0.0%) | 0 (0.0%) |
| Graduate Degree | 0 (0.0%) | 0 (0.0%) |
| Total | 0 (0.0%) | 0 (0.0%) |
Employment Characteristics in Tipton
Employment by Class of Employer in Tipton
Among the 310 employed individuals in Tipton, private company employees (214 | 69.0%), state government employees (41 | 13.2%), and local government employees (36 | 11.6%) make up the most common classes of employment.
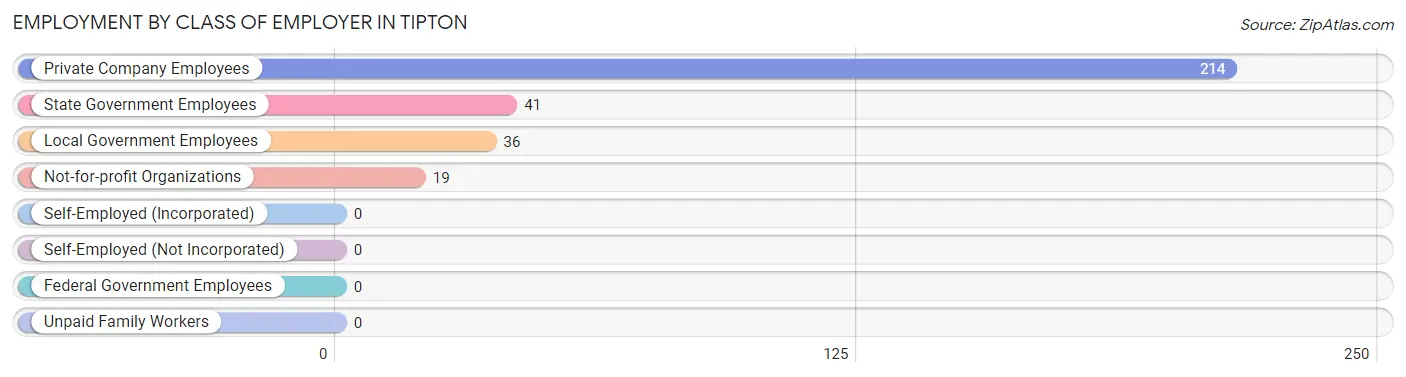
| Employer Class | # Employees | % Employees |
| Private Company Employees | 214 | 69.0% |
| Self-Employed (Incorporated) | 0 | 0.0% |
| Self-Employed (Not Incorporated) | 0 | 0.0% |
| Not-for-profit Organizations | 19 | 6.1% |
| Local Government Employees | 36 | 11.6% |
| State Government Employees | 41 | 13.2% |
| Federal Government Employees | 0 | 0.0% |
| Unpaid Family Workers | 0 | 0.0% |
| Total | 310 | 100.0% |
Employment Status by Age in Tipton
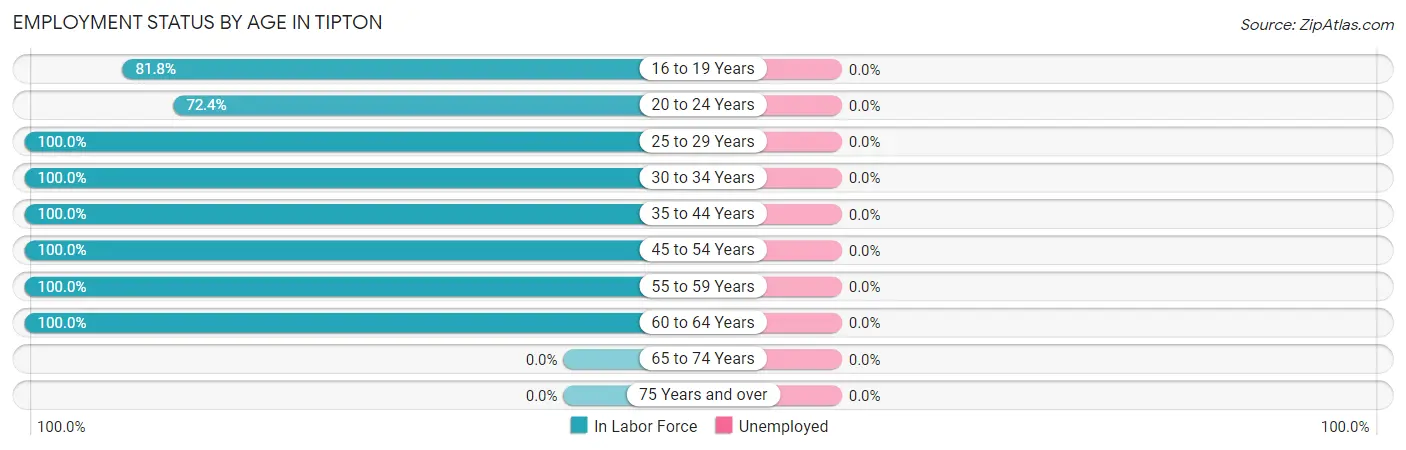
| Age Bracket | In Labor Force | Unemployed |
| 16 to 19 Years | 36 (81.8%) | 0 (0.0%) |
| 20 to 24 Years | 42 (72.4%) | 0 (0.0%) |
| 25 to 29 Years | 15 (100.0%) | 0 (0.0%) |
| 30 to 34 Years | 31 (100.0%) | 0 (0.0%) |
| 35 to 44 Years | 54 (100.0%) | 0 (0.0%) |
| 45 to 54 Years | 77 (100.0%) | 0 (0.0%) |
| 55 to 59 Years | 18 (100.0%) | 0 (0.0%) |
| 60 to 64 Years | 37 (100.0%) | 0 (0.0%) |
| 65 to 74 Years | 0 (0.0%) | 0 (0.0%) |
| 75 Years and over | 0 (0.0%) | 0 (0.0%) |
| Total | 310 (71.6%) | 0 (0.0%) |
Employment Status by Educational Attainment in Tipton
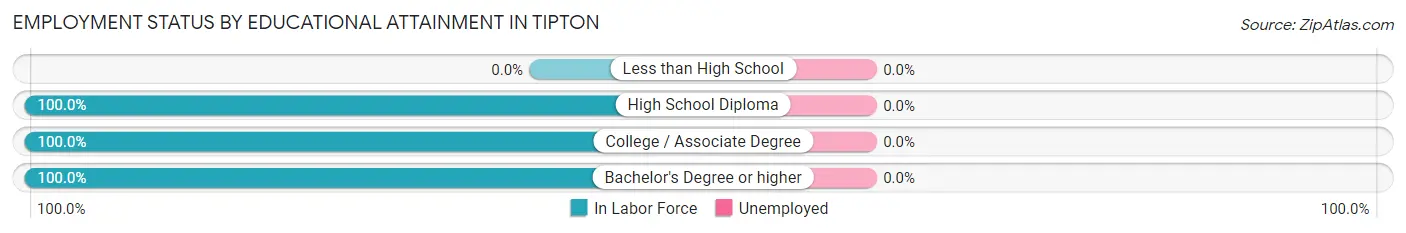
| Educational Attainment | In Labor Force | Unemployed |
| Less than High School | 0 (0.0%) | 0 (0.0%) |
| High School Diploma | 42 (100.0%) | 0 (0.0%) |
| College / Associate Degree | 62 (100.0%) | 0 (0.0%) |
| Bachelor's Degree or higher | 128 (100.0%) | 0 (0.0%) |
| Total | 232 (100.0%) | 0 (0.0%) |
Employment Occupations by Sex in Tipton
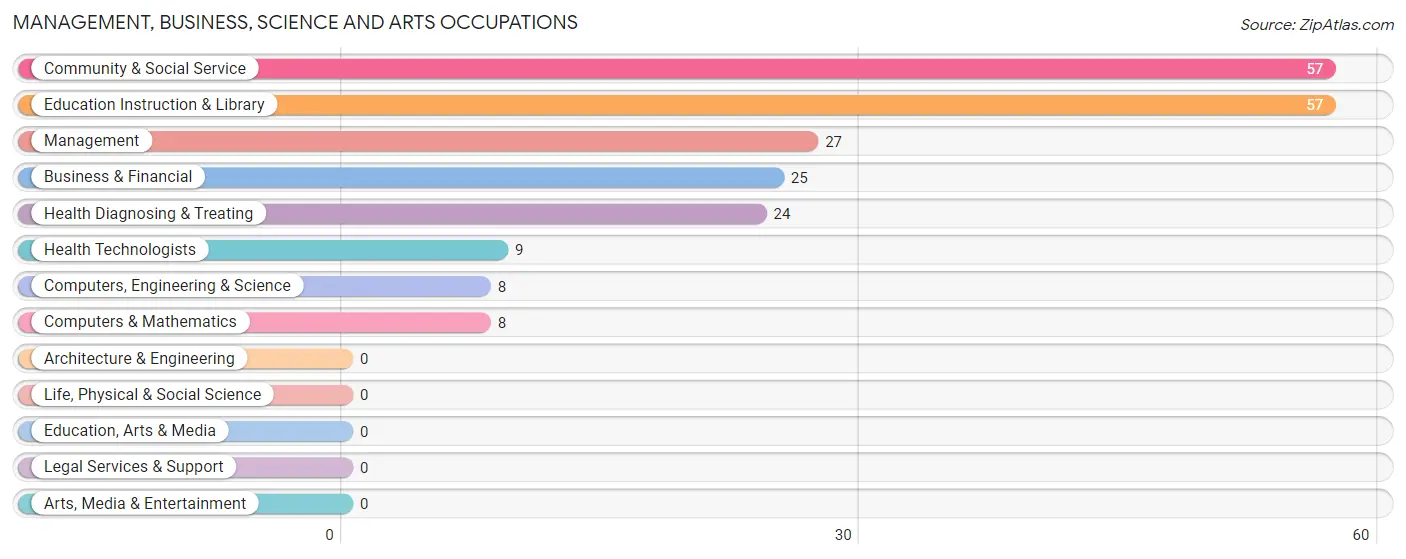
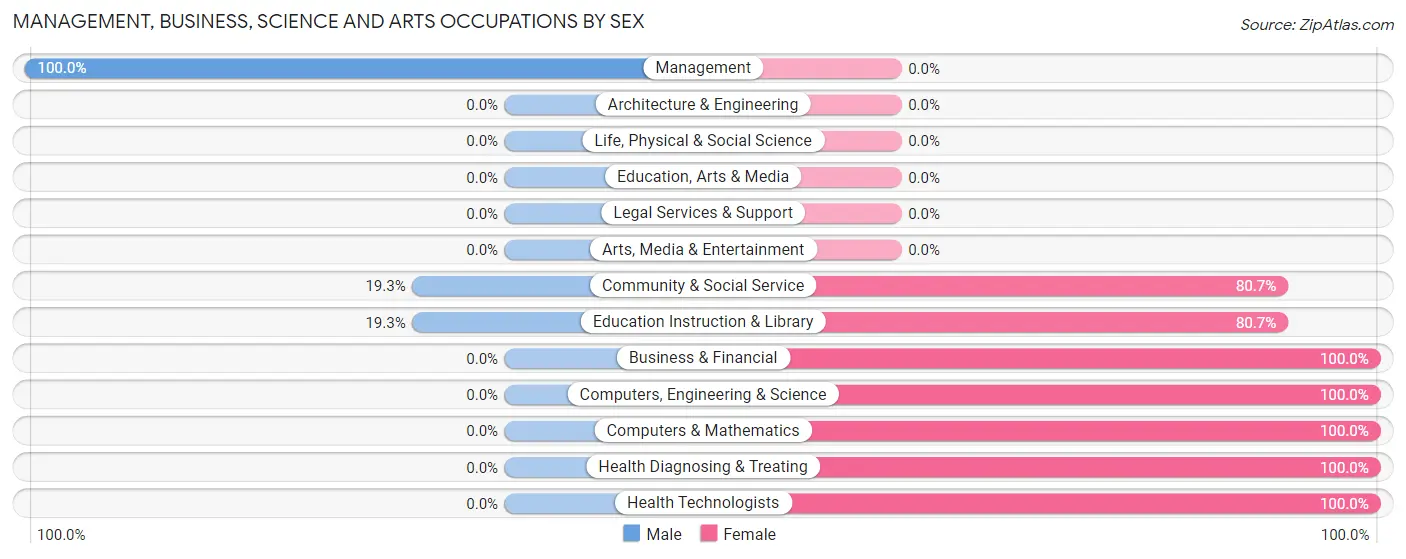
Management, Business, Science and Arts Occupations
The most common Management, Business, Science and Arts occupations in Tipton are Community & Social Service (57 | 18.4%), Education Instruction & Library (57 | 18.4%), Management (27 | 8.7%), Business & Financial (25 | 8.1%), and Health Diagnosing & Treating (24 | 7.7%).
Management, Business, Science and Arts Occupations by Sex
Within the Management, Business, Science and Arts occupations in Tipton, the most male-oriented occupations are Management (100.0%), Community & Social Service (19.3%), and Education Instruction & Library (19.3%), while the most female-oriented occupations are Business & Financial (100.0%), Computers, Engineering & Science (100.0%), and Computers & Mathematics (100.0%).
| Occupation | Male | Female |
| Management | 27 (100.0%) | 0 (0.0%) |
| Business & Financial | 0 (0.0%) | 25 (100.0%) |
| Computers, Engineering & Science | 0 (0.0%) | 8 (100.0%) |
| Computers & Mathematics | 0 (0.0%) | 8 (100.0%) |
| Architecture & Engineering | 0 (0.0%) | 0 (0.0%) |
| Life, Physical & Social Science | 0 (0.0%) | 0 (0.0%) |
| Community & Social Service | 11 (19.3%) | 46 (80.7%) |
| Education, Arts & Media | 0 (0.0%) | 0 (0.0%) |
| Legal Services & Support | 0 (0.0%) | 0 (0.0%) |
| Education Instruction & Library | 11 (19.3%) | 46 (80.7%) |
| Arts, Media & Entertainment | 0 (0.0%) | 0 (0.0%) |
| Health Diagnosing & Treating | 0 (0.0%) | 24 (100.0%) |
| Health Technologists | 0 (0.0%) | 9 (100.0%) |
| Total (Category) | 38 (27.0%) | 103 (73.1%) |
| Total (Overall) | 119 (38.4%) | 191 (61.6%) |
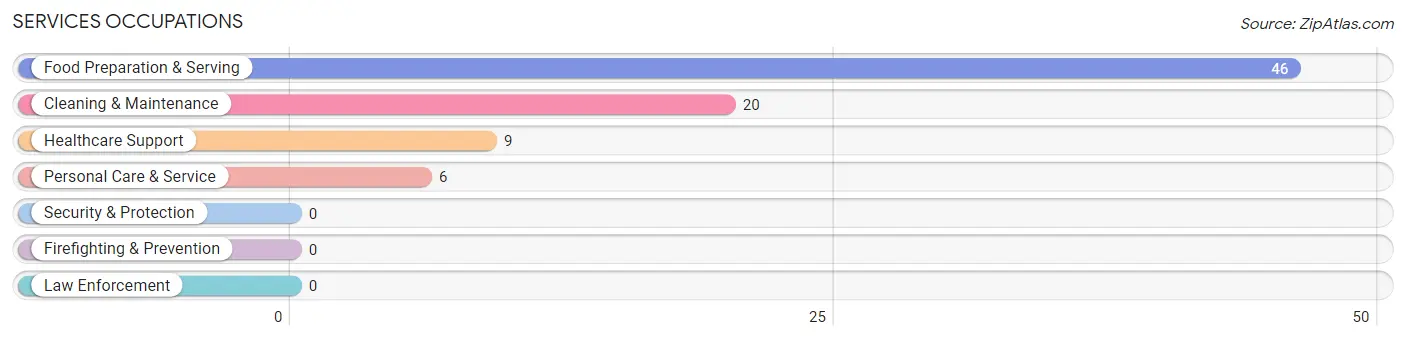
Services Occupations
The most common Services occupations in Tipton are Food Preparation & Serving (46 | 14.8%), Cleaning & Maintenance (20 | 6.5%), Healthcare Support (9 | 2.9%), and Personal Care & Service (6 | 1.9%).
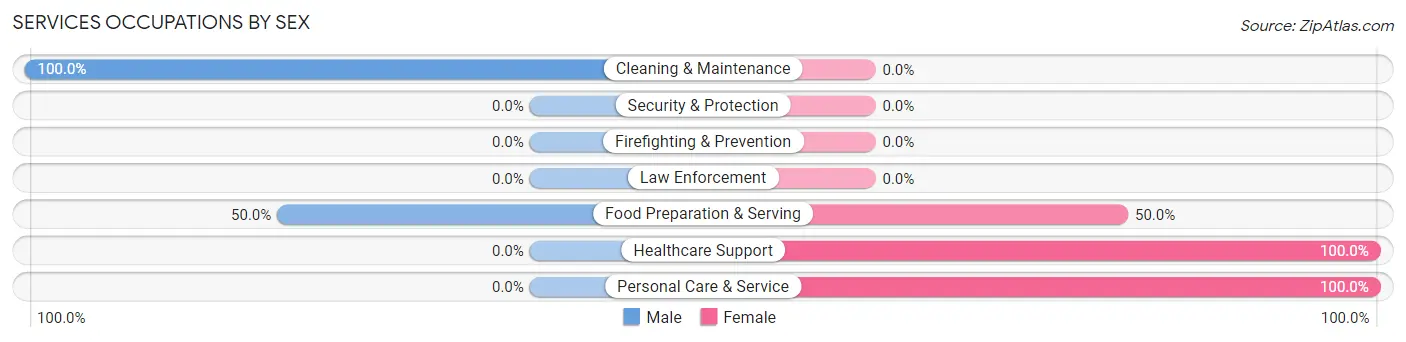
Services Occupations by Sex
Within the Services occupations in Tipton, the most male-oriented occupations are Cleaning & Maintenance (100.0%), and Food Preparation & Serving (50.0%), while the most female-oriented occupations are Healthcare Support (100.0%), Personal Care & Service (100.0%), and Food Preparation & Serving (50.0%).
| Occupation | Male | Female |
| Healthcare Support | 0 (0.0%) | 9 (100.0%) |
| Security & Protection | 0 (0.0%) | 0 (0.0%) |
| Firefighting & Prevention | 0 (0.0%) | 0 (0.0%) |
| Law Enforcement | 0 (0.0%) | 0 (0.0%) |
| Food Preparation & Serving | 23 (50.0%) | 23 (50.0%) |
| Cleaning & Maintenance | 20 (100.0%) | 0 (0.0%) |
| Personal Care & Service | 0 (0.0%) | 6 (100.0%) |
| Total (Category) | 43 (53.1%) | 38 (46.9%) |
| Total (Overall) | 119 (38.4%) | 191 (61.6%) |
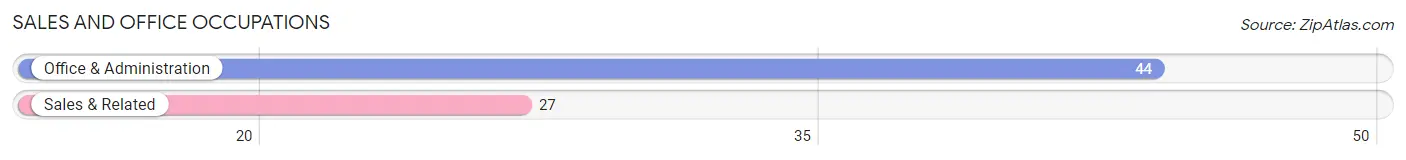
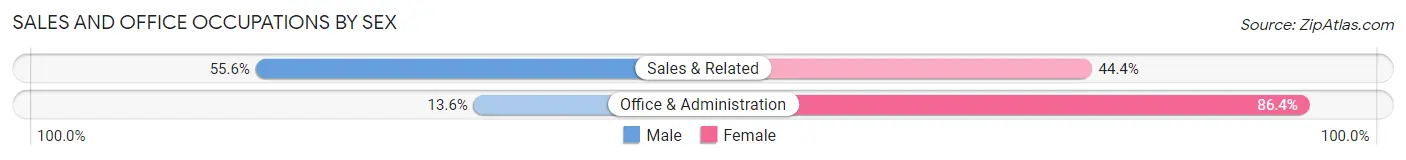
Sales and Office Occupations
The most common Sales and Office occupations in Tipton are Office & Administration (44 | 14.2%), and Sales & Related (27 | 8.7%).
Sales and Office Occupations by Sex
| Occupation | Male | Female |
| Sales & Related | 15 (55.6%) | 12 (44.4%) |
| Office & Administration | 6 (13.6%) | 38 (86.4%) |
| Total (Category) | 21 (29.6%) | 50 (70.4%) |
| Total (Overall) | 119 (38.4%) | 191 (61.6%) |
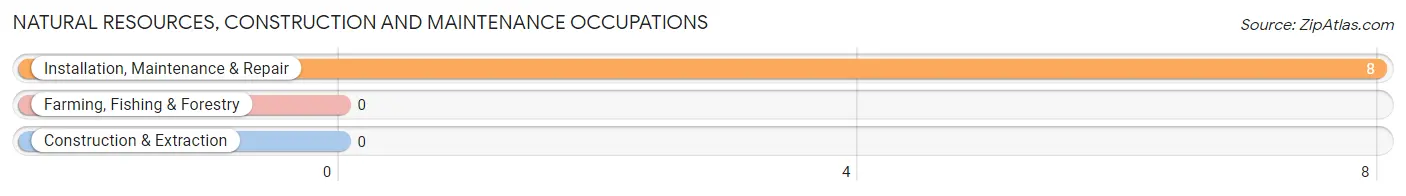
Natural Resources, Construction and Maintenance Occupations
The most common Natural Resources, Construction and Maintenance occupations in Tipton are , and Installation, Maintenance & Repair (8 | 2.6%).
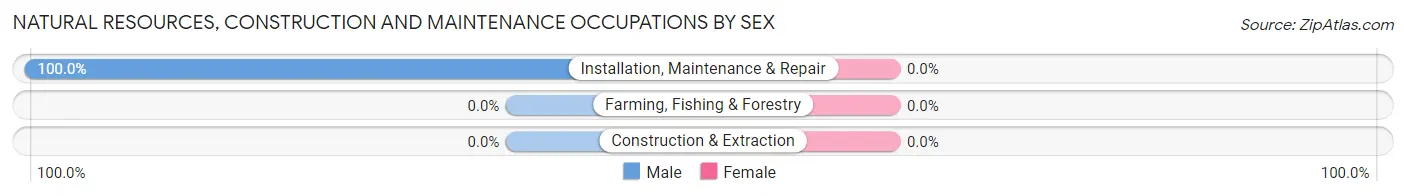
Natural Resources, Construction and Maintenance Occupations by Sex
| Occupation | Male | Female |
| Farming, Fishing & Forestry | 0 (0.0%) | 0 (0.0%) |
| Construction & Extraction | 0 (0.0%) | 0 (0.0%) |
| Installation, Maintenance & Repair | 8 (100.0%) | 0 (0.0%) |
| Total (Category) | 8 (100.0%) | 0 (0.0%) |
| Total (Overall) | 119 (38.4%) | 191 (61.6%) |
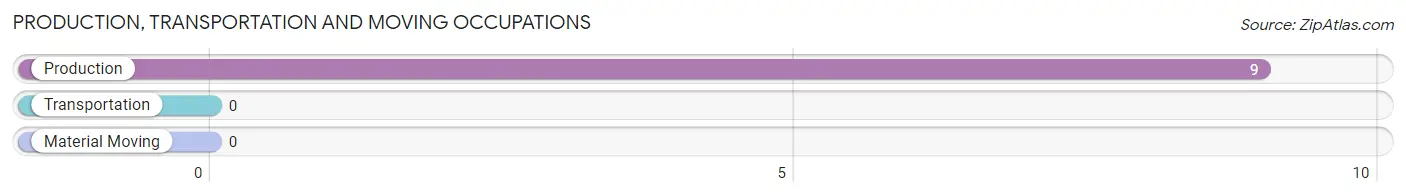
Production, Transportation and Moving Occupations
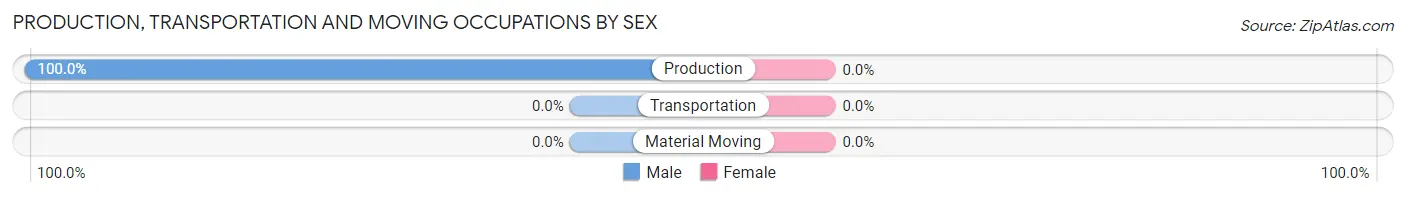
The most common Production, Transportation and Moving occupations in Tipton are , and Production (9 | 2.9%).
Production, Transportation and Moving Occupations by Sex
| Occupation | Male | Female |
| Production | 9 (100.0%) | 0 (0.0%) |
| Transportation | 0 (0.0%) | 0 (0.0%) |
| Material Moving | 0 (0.0%) | 0 (0.0%) |
| Total (Category) | 9 (100.0%) | 0 (0.0%) |
| Total (Overall) | 119 (38.4%) | 191 (61.6%) |
Employment Industries by Sex in Tipton
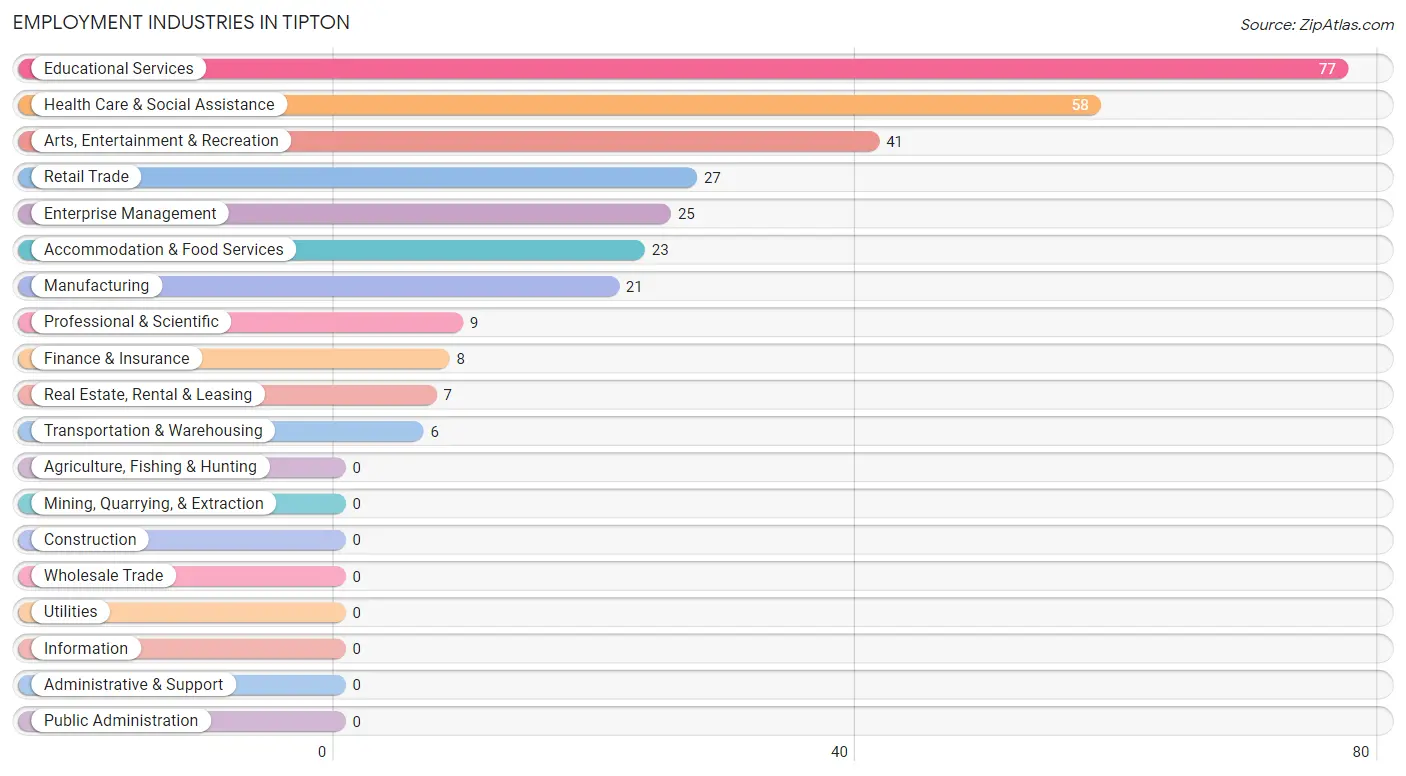
Employment Industries in Tipton
The major employment industries in Tipton include Educational Services (77 | 24.8%), Health Care & Social Assistance (58 | 18.7%), Arts, Entertainment & Recreation (41 | 13.2%), Retail Trade (27 | 8.7%), and Enterprise Management (25 | 8.1%).
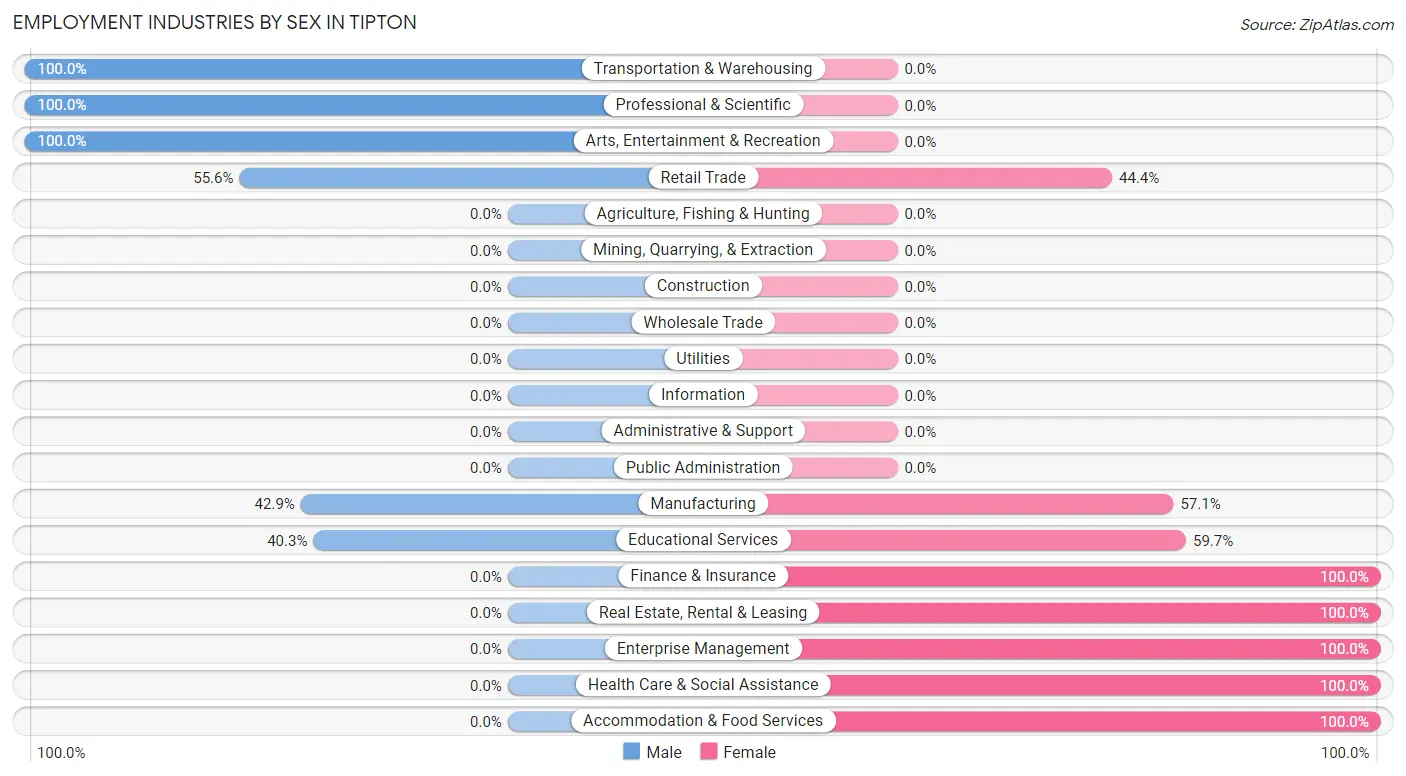
Employment Industries by Sex in Tipton
The Tipton industries that see more men than women are Transportation & Warehousing (100.0%), Professional & Scientific (100.0%), and Arts, Entertainment & Recreation (100.0%), whereas the industries that tend to have a higher number of women are Finance & Insurance (100.0%), Real Estate, Rental & Leasing (100.0%), and Enterprise Management (100.0%).
| Industry | Male | Female |
| Agriculture, Fishing & Hunting | 0 (0.0%) | 0 (0.0%) |
| Mining, Quarrying, & Extraction | 0 (0.0%) | 0 (0.0%) |
| Construction | 0 (0.0%) | 0 (0.0%) |
| Manufacturing | 9 (42.9%) | 12 (57.1%) |
| Wholesale Trade | 0 (0.0%) | 0 (0.0%) |
| Retail Trade | 15 (55.6%) | 12 (44.4%) |
| Transportation & Warehousing | 6 (100.0%) | 0 (0.0%) |
| Utilities | 0 (0.0%) | 0 (0.0%) |
| Information | 0 (0.0%) | 0 (0.0%) |
| Finance & Insurance | 0 (0.0%) | 8 (100.0%) |
| Real Estate, Rental & Leasing | 0 (0.0%) | 7 (100.0%) |
| Professional & Scientific | 9 (100.0%) | 0 (0.0%) |
| Enterprise Management | 0 (0.0%) | 25 (100.0%) |
| Administrative & Support | 0 (0.0%) | 0 (0.0%) |
| Educational Services | 31 (40.3%) | 46 (59.7%) |
| Health Care & Social Assistance | 0 (0.0%) | 58 (100.0%) |
| Arts, Entertainment & Recreation | 41 (100.0%) | 0 (0.0%) |
| Accommodation & Food Services | 0 (0.0%) | 23 (100.0%) |
| Public Administration | 0 (0.0%) | 0 (0.0%) |
| Total | 119 (38.4%) | 191 (61.6%) |
Education in Tipton
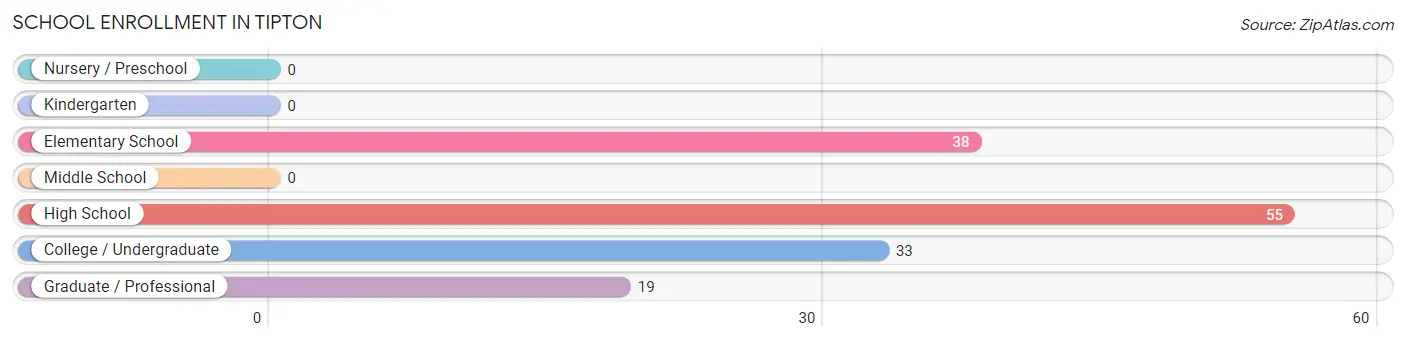
School Enrollment in Tipton
The most common levels of schooling among the 145 students in Tipton are high school (55 | 37.9%), elementary school (38 | 26.2%), and college / undergraduate (33 | 22.8%).
| School Level | # Students | % Students |
| Nursery / Preschool | 0 | 0.0% |
| Kindergarten | 0 | 0.0% |
| Elementary School | 38 | 26.2% |
| Middle School | 0 | 0.0% |
| High School | 55 | 37.9% |
| College / Undergraduate | 33 | 22.8% |
| Graduate / Professional | 19 | 13.1% |
| Total | 145 | 100.0% |
School Enrollment by Age by Funding Source in Tipton
Out of a total of 145 students who are enrolled in schools in Tipton, 38 (26.2%) attend a private institution, while the remaining 107 (73.8%) are enrolled in public schools. The age group of 18 to 19 year olds has the highest likelihood of being enrolled in private schools, with 23 (63.9% in the age bracket) enrolled. Conversely, the age group of 5 to 9 year old has the lowest likelihood of being enrolled in a private school, with 23 (100.0% in the age bracket) attending a public institution.
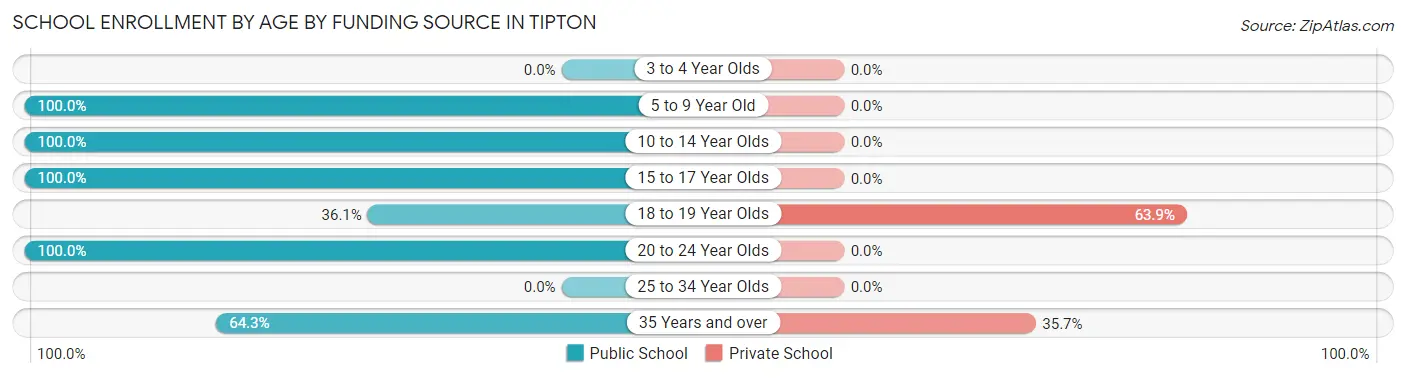
| Age Bracket | Public School | Private School |
| 3 to 4 Year Olds | 0 (0.0%) | 0 (0.0%) |
| 5 to 9 Year Old | 23 (100.0%) | 0 (0.0%) |
| 10 to 14 Year Olds | 15 (100.0%) | 0 (0.0%) |
| 15 to 17 Year Olds | 19 (100.0%) | 0 (0.0%) |
| 18 to 19 Year Olds | 13 (36.1%) | 23 (63.9%) |
| 20 to 24 Year Olds | 10 (100.0%) | 0 (0.0%) |
| 25 to 34 Year Olds | 0 (0.0%) | 0 (0.0%) |
| 35 Years and over | 27 (64.3%) | 15 (35.7%) |
| Total | 107 (73.8%) | 38 (26.2%) |
Educational Attainment by Field of Study in Tipton
Education (57 | 44.5%), business (26 | 20.3%), engineering (24 | 18.8%), arts & humanities (12 | 9.4%), and science & technology (9 | 7.0%) are the most common fields of study among 128 individuals in Tipton who have obtained a bachelor's degree or higher.
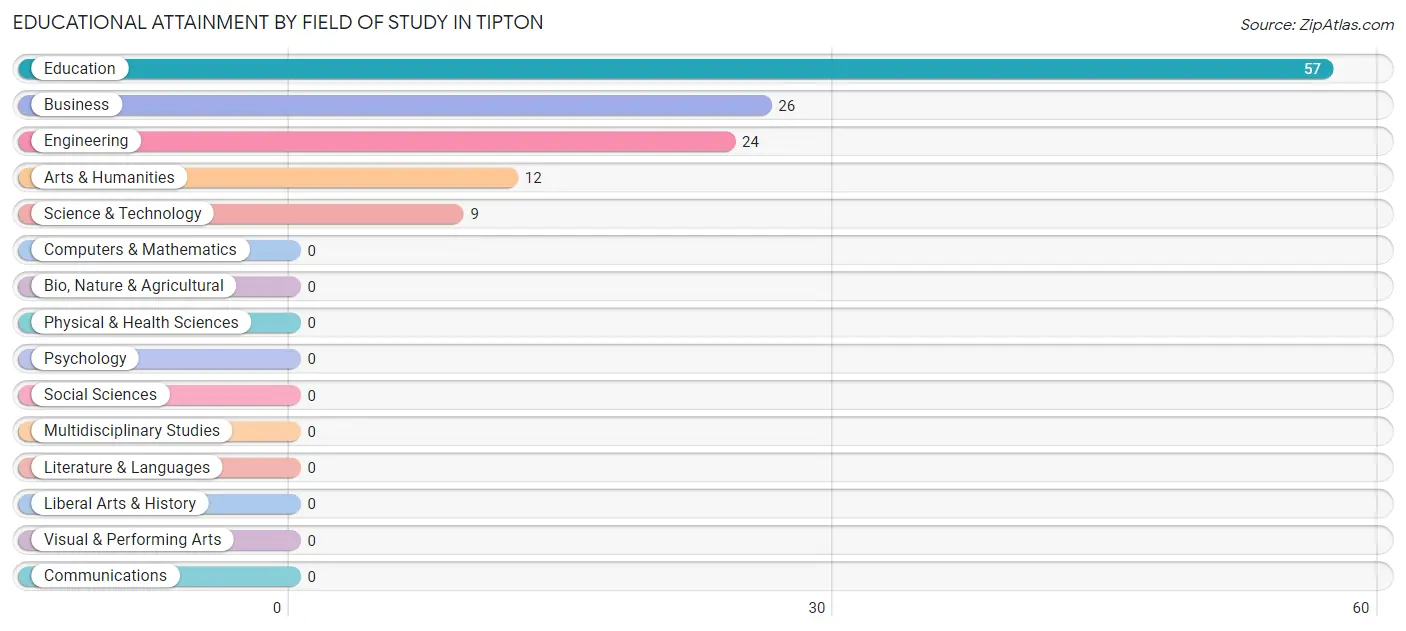
| Field of Study | # Graduates | % Graduates |
| Computers & Mathematics | 0 | 0.0% |
| Bio, Nature & Agricultural | 0 | 0.0% |
| Physical & Health Sciences | 0 | 0.0% |
| Psychology | 0 | 0.0% |
| Social Sciences | 0 | 0.0% |
| Engineering | 24 | 18.8% |
| Multidisciplinary Studies | 0 | 0.0% |
| Science & Technology | 9 | 7.0% |
| Business | 26 | 20.3% |
| Education | 57 | 44.5% |
| Literature & Languages | 0 | 0.0% |
| Liberal Arts & History | 0 | 0.0% |
| Visual & Performing Arts | 0 | 0.0% |
| Communications | 0 | 0.0% |
| Arts & Humanities | 12 | 9.4% |
| Total | 128 | 100.0% |
Transportation & Commute in Tipton
Vehicle Availability by Sex in Tipton
The most prevalent vehicle ownership categories in Tipton are males with 2 vehicles (53, accounting for 44.5%) and females with 2 vehicles (63, making up 27.8%).
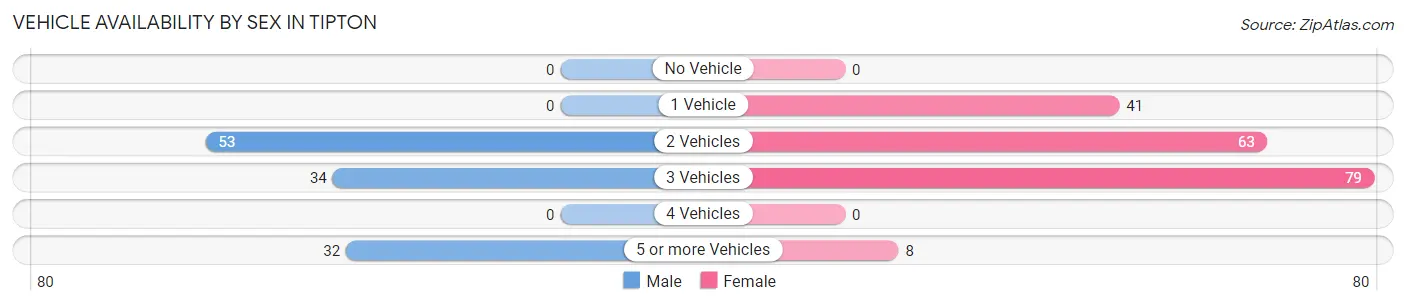
| Vehicles Available | Male | Female |
| No Vehicle | 0 (0.0%) | 0 (0.0%) |
| 1 Vehicle | 0 (0.0%) | 41 (21.5%) |
| 2 Vehicles | 53 (44.5%) | 63 (33.0%) |
| 3 Vehicles | 34 (28.6%) | 79 (41.4%) |
| 4 Vehicles | 0 (0.0%) | 0 (0.0%) |
| 5 or more Vehicles | 32 (26.9%) | 8 (4.2%) |
| Total | 119 (100.0%) | 191 (100.0%) |
Commute Time in Tipton
The most frequently occuring commute durations in Tipton are 15 to 19 minutes (58 commuters, 18.7%), less than 5 minutes (53 commuters, 17.1%), and 5 to 9 minutes (52 commuters, 16.8%).
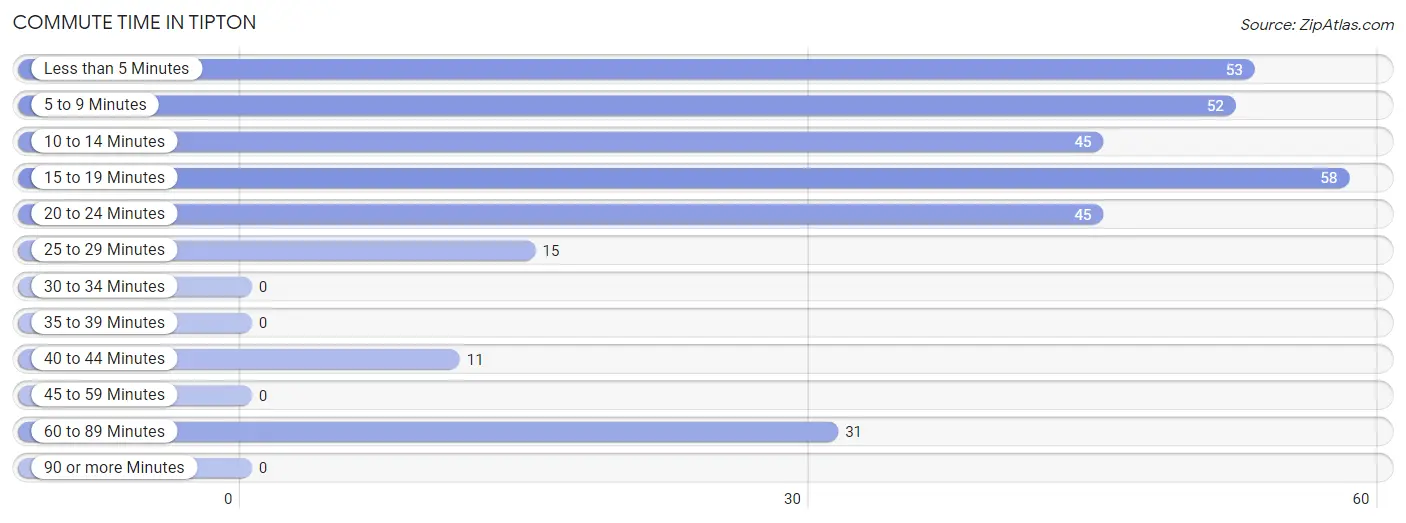
| Commute Time | # Commuters | % Commuters |
| Less than 5 Minutes | 53 | 17.1% |
| 5 to 9 Minutes | 52 | 16.8% |
| 10 to 14 Minutes | 45 | 14.5% |
| 15 to 19 Minutes | 58 | 18.7% |
| 20 to 24 Minutes | 45 | 14.5% |
| 25 to 29 Minutes | 15 | 4.8% |
| 30 to 34 Minutes | 0 | 0.0% |
| 35 to 39 Minutes | 0 | 0.0% |
| 40 to 44 Minutes | 11 | 3.5% |
| 45 to 59 Minutes | 0 | 0.0% |
| 60 to 89 Minutes | 31 | 10.0% |
| 90 or more Minutes | 0 | 0.0% |
Commute Time by Sex in Tipton
The most common commute times in Tipton are 5 to 9 minutes (52 commuters, 43.7%) for males and 15 to 19 minutes (50 commuters, 26.2%) for females.
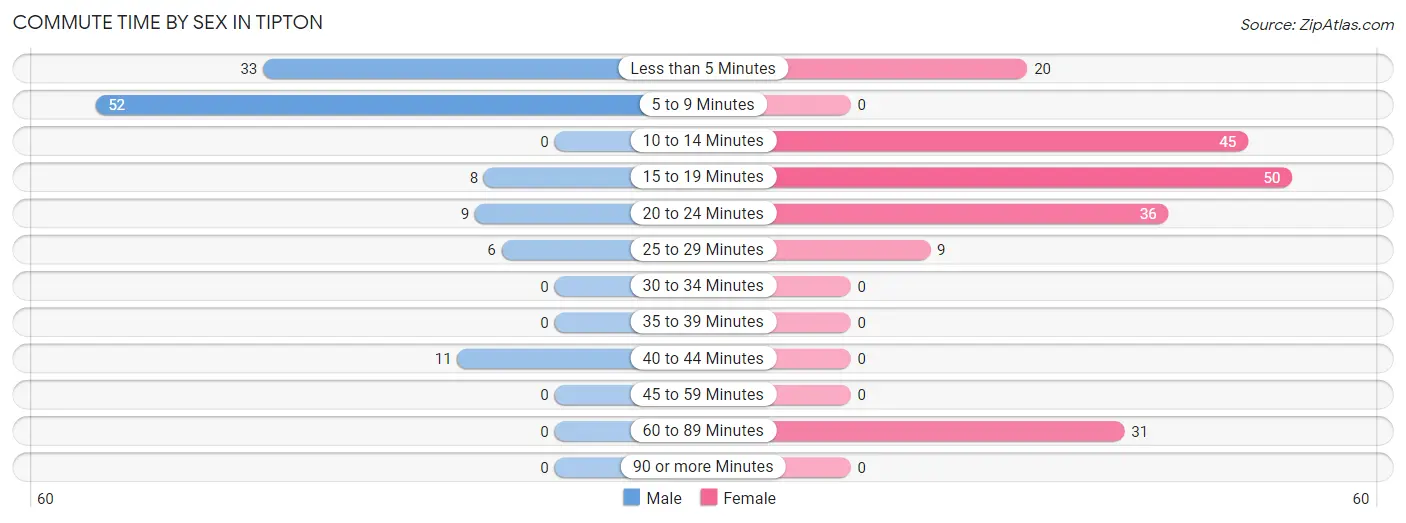
| Commute Time | Male | Female |
| Less than 5 Minutes | 33 (27.7%) | 20 (10.5%) |
| 5 to 9 Minutes | 52 (43.7%) | 0 (0.0%) |
| 10 to 14 Minutes | 0 (0.0%) | 45 (23.6%) |
| 15 to 19 Minutes | 8 (6.7%) | 50 (26.2%) |
| 20 to 24 Minutes | 9 (7.6%) | 36 (18.9%) |
| 25 to 29 Minutes | 6 (5.0%) | 9 (4.7%) |
| 30 to 34 Minutes | 0 (0.0%) | 0 (0.0%) |
| 35 to 39 Minutes | 0 (0.0%) | 0 (0.0%) |
| 40 to 44 Minutes | 11 (9.2%) | 0 (0.0%) |
| 45 to 59 Minutes | 0 (0.0%) | 0 (0.0%) |
| 60 to 89 Minutes | 0 (0.0%) | 31 (16.2%) |
| 90 or more Minutes | 0 (0.0%) | 0 (0.0%) |
Time of Departure to Work by Sex in Tipton
The most frequent times of departure to work in Tipton are 12:00 PM to 3:59 PM (44, 37.0%) for males and 6:30 AM to 6:59 AM (64, 33.5%) for females.
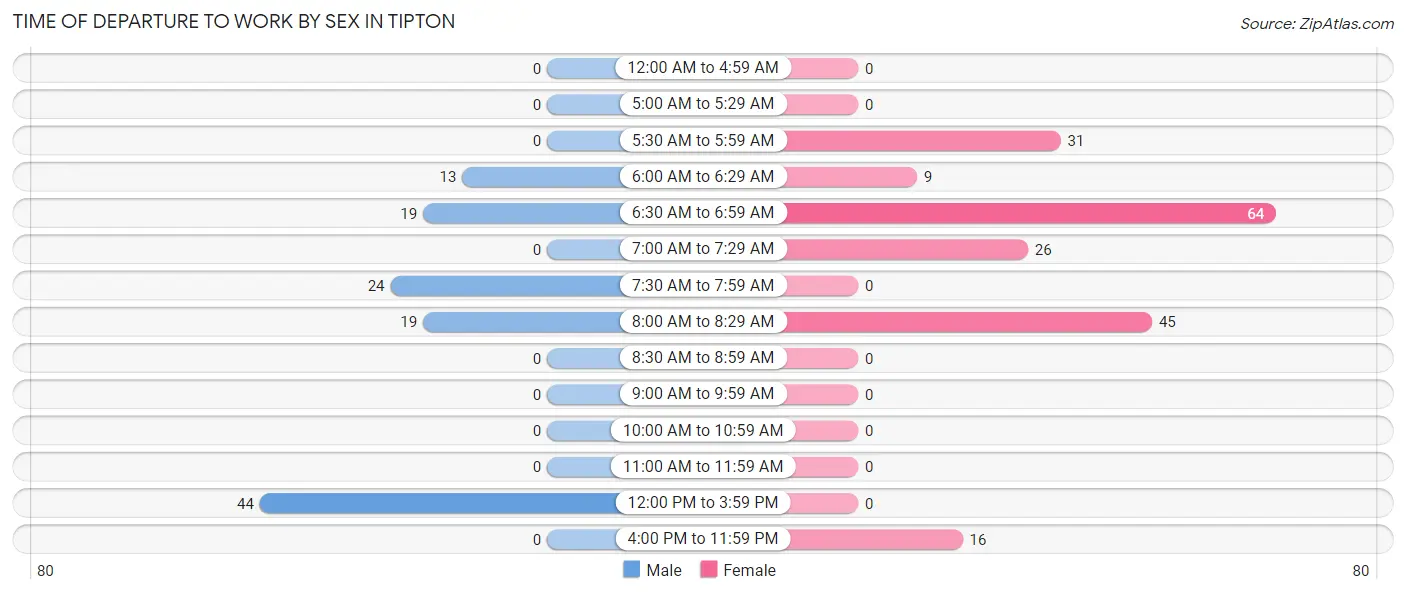
| Time of Departure | Male | Female |
| 12:00 AM to 4:59 AM | 0 (0.0%) | 0 (0.0%) |
| 5:00 AM to 5:29 AM | 0 (0.0%) | 0 (0.0%) |
| 5:30 AM to 5:59 AM | 0 (0.0%) | 31 (16.2%) |
| 6:00 AM to 6:29 AM | 13 (10.9%) | 9 (4.7%) |
| 6:30 AM to 6:59 AM | 19 (16.0%) | 64 (33.5%) |
| 7:00 AM to 7:29 AM | 0 (0.0%) | 26 (13.6%) |
| 7:30 AM to 7:59 AM | 24 (20.2%) | 0 (0.0%) |
| 8:00 AM to 8:29 AM | 19 (16.0%) | 45 (23.6%) |
| 8:30 AM to 8:59 AM | 0 (0.0%) | 0 (0.0%) |
| 9:00 AM to 9:59 AM | 0 (0.0%) | 0 (0.0%) |
| 10:00 AM to 10:59 AM | 0 (0.0%) | 0 (0.0%) |
| 11:00 AM to 11:59 AM | 0 (0.0%) | 0 (0.0%) |
| 12:00 PM to 3:59 PM | 44 (37.0%) | 0 (0.0%) |
| 4:00 PM to 11:59 PM | 0 (0.0%) | 16 (8.4%) |
| Total | 119 (100.0%) | 191 (100.0%) |
Housing Occupancy in Tipton
Occupancy by Ownership in Tipton
Of the total 243 dwellings in Tipton, owner-occupied units account for 193 (79.4%), while renter-occupied units make up 50 (20.6%).
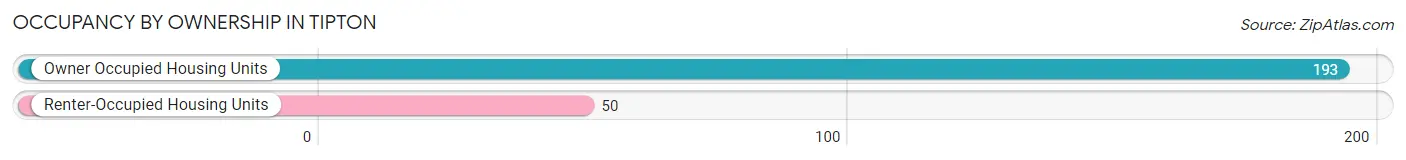
| Occupancy | # Housing Units | % Housing Units |
| Owner Occupied Housing Units | 193 | 79.4% |
| Renter-Occupied Housing Units | 50 | 20.6% |
| Total Occupied Housing Units | 243 | 100.0% |
Occupancy by Household Size in Tipton
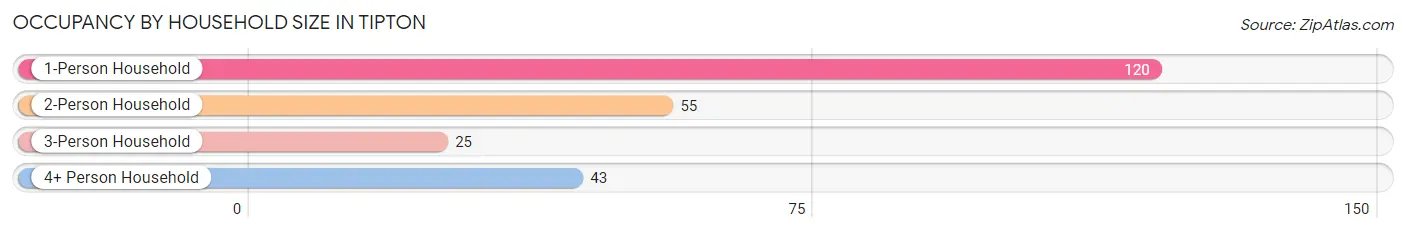
| Household Size | # Housing Units | % Housing Units |
| 1-Person Household | 120 | 49.4% |
| 2-Person Household | 55 | 22.6% |
| 3-Person Household | 25 | 10.3% |
| 4+ Person Household | 43 | 17.7% |
| Total Housing Units | 243 | 100.0% |
Occupancy by Ownership by Household Size in Tipton
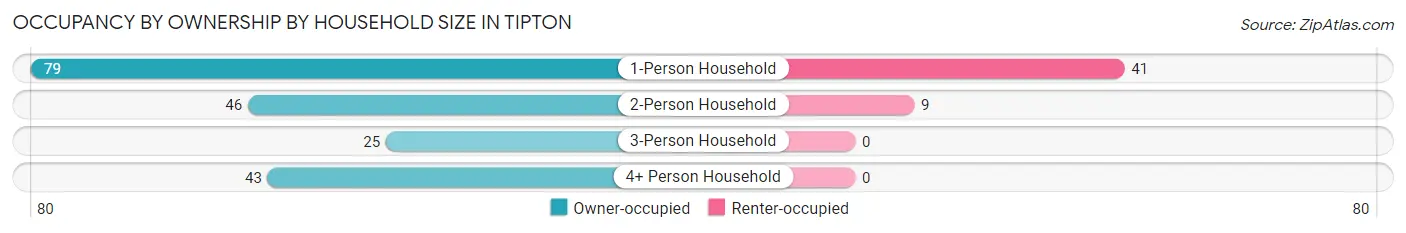
| Household Size | Owner-occupied | Renter-occupied |
| 1-Person Household | 79 (65.8%) | 41 (34.2%) |
| 2-Person Household | 46 (83.6%) | 9 (16.4%) |
| 3-Person Household | 25 (100.0%) | 0 (0.0%) |
| 4+ Person Household | 43 (100.0%) | 0 (0.0%) |
| Total Housing Units | 193 (79.4%) | 50 (20.6%) |
Occupancy by Educational Attainment in Tipton
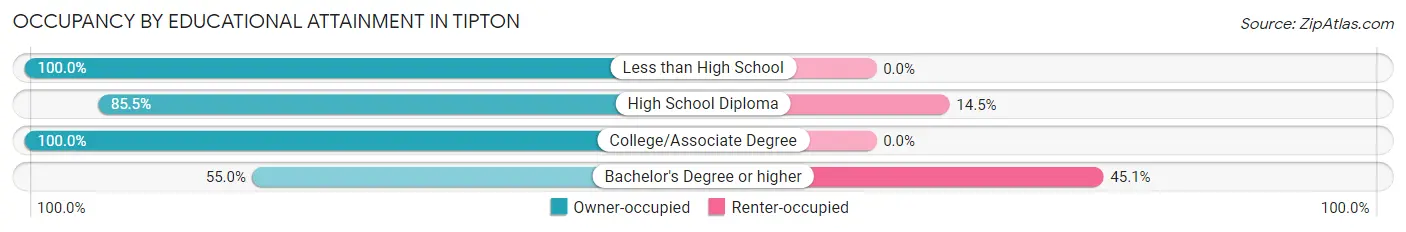
| Household Size | Owner-occupied | Renter-occupied |
| Less than High School | 12 (100.0%) | 0 (0.0%) |
| High School Diploma | 53 (85.5%) | 9 (14.5%) |
| College/Associate Degree | 78 (100.0%) | 0 (0.0%) |
| Bachelor's Degree or higher | 50 (54.9%) | 41 (45.1%) |
Occupancy by Age of Householder in Tipton
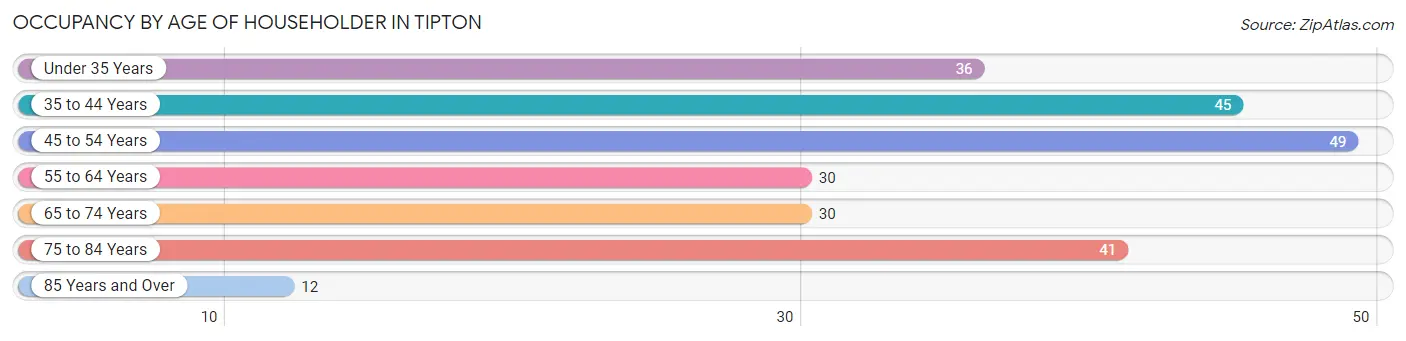
| Age Bracket | # Households | % Households |
| Under 35 Years | 36 | 14.8% |
| 35 to 44 Years | 45 | 18.5% |
| 45 to 54 Years | 49 | 20.2% |
| 55 to 64 Years | 30 | 12.3% |
| 65 to 74 Years | 30 | 12.3% |
| 75 to 84 Years | 41 | 16.9% |
| 85 Years and Over | 12 | 4.9% |
| Total | 243 | 100.0% |
Housing Finances in Tipton
Median Income by Occupancy in Tipton
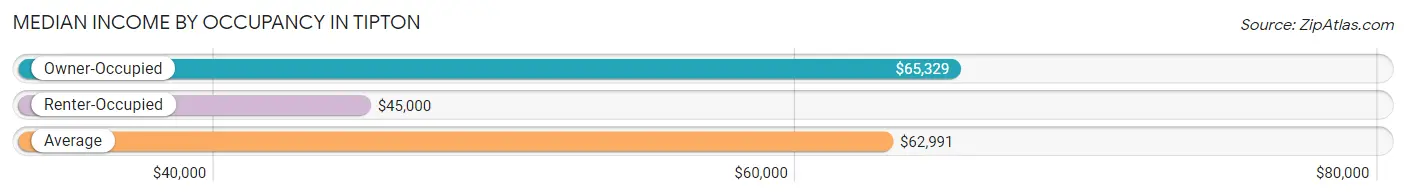
| Occupancy Type | # Households | Median Income |
| Owner-Occupied | 193 (79.4%) | $65,329 |
| Renter-Occupied | 50 (20.6%) | $45,000 |
| Average | 243 (100.0%) | $62,991 |
Occupancy by Householder Income Bracket in Tipton
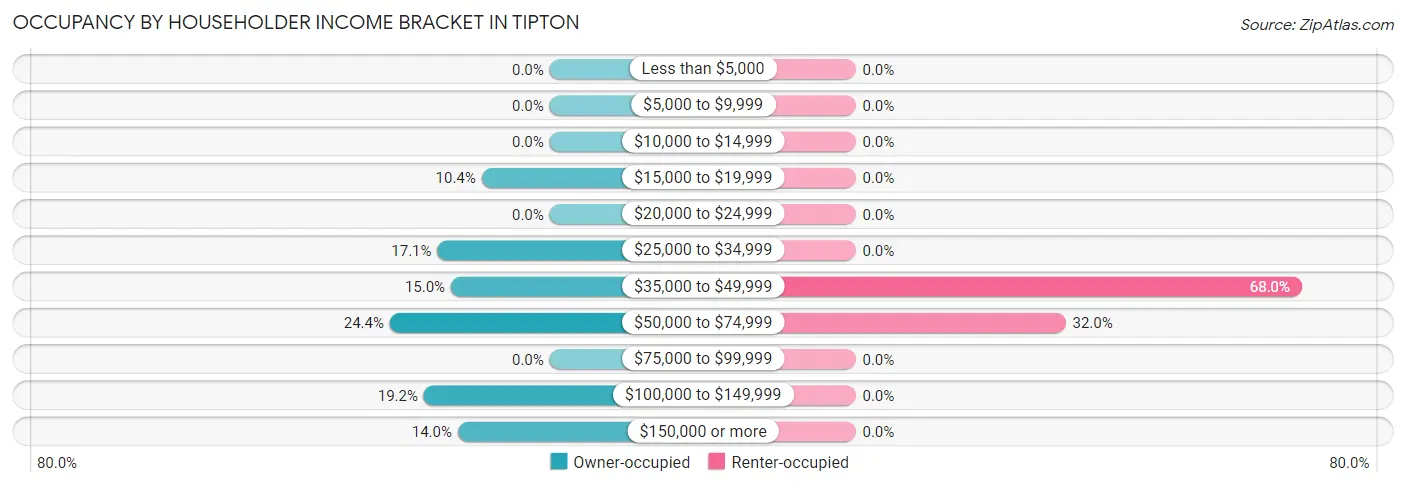
| Income Bracket | Owner-occupied | Renter-occupied |
| Less than $5,000 | 0 (0.0%) | 0 (0.0%) |
| $5,000 to $9,999 | 0 (0.0%) | 0 (0.0%) |
| $10,000 to $14,999 | 0 (0.0%) | 0 (0.0%) |
| $15,000 to $19,999 | 20 (10.4%) | 0 (0.0%) |
| $20,000 to $24,999 | 0 (0.0%) | 0 (0.0%) |
| $25,000 to $34,999 | 33 (17.1%) | 0 (0.0%) |
| $35,000 to $49,999 | 29 (15.0%) | 34 (68.0%) |
| $50,000 to $74,999 | 47 (24.3%) | 16 (32.0%) |
| $75,000 to $99,999 | 0 (0.0%) | 0 (0.0%) |
| $100,000 to $149,999 | 37 (19.2%) | 0 (0.0%) |
| $150,000 or more | 27 (14.0%) | 0 (0.0%) |
| Total | 193 (100.0%) | 50 (100.0%) |
Monthly Housing Cost Tiers in Tipton
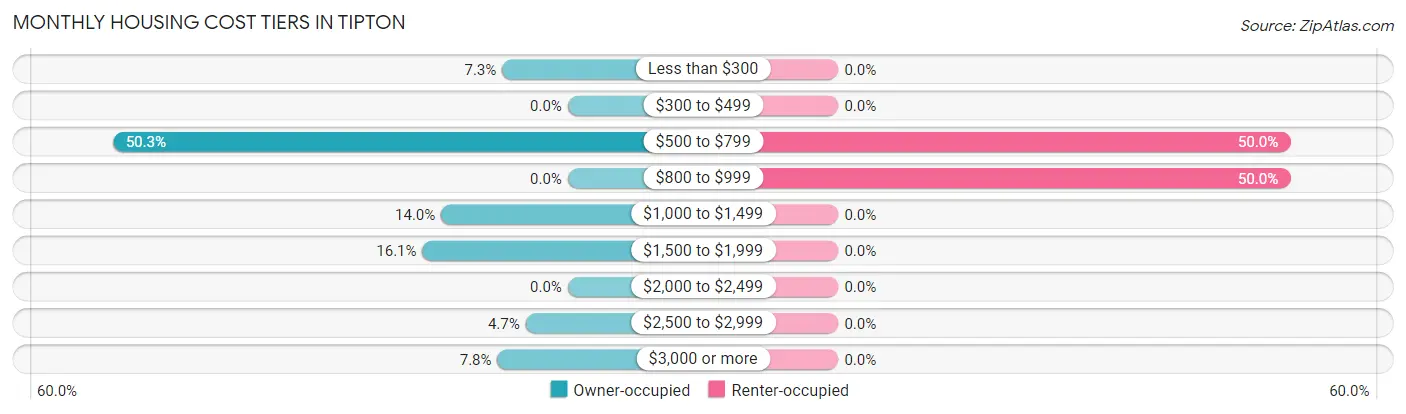
| Monthly Cost | Owner-occupied | Renter-occupied |
| Less than $300 | 14 (7.2%) | 0 (0.0%) |
| $300 to $499 | 0 (0.0%) | 0 (0.0%) |
| $500 to $799 | 97 (50.3%) | 25 (50.0%) |
| $800 to $999 | 0 (0.0%) | 25 (50.0%) |
| $1,000 to $1,499 | 27 (14.0%) | 0 (0.0%) |
| $1,500 to $1,999 | 31 (16.1%) | 0 (0.0%) |
| $2,000 to $2,499 | 0 (0.0%) | 0 (0.0%) |
| $2,500 to $2,999 | 9 (4.7%) | 0 (0.0%) |
| $3,000 or more | 15 (7.8%) | 0 (0.0%) |
| Total | 193 (100.0%) | 50 (100.0%) |
Physical Housing Characteristics in Tipton
Housing Structures in Tipton
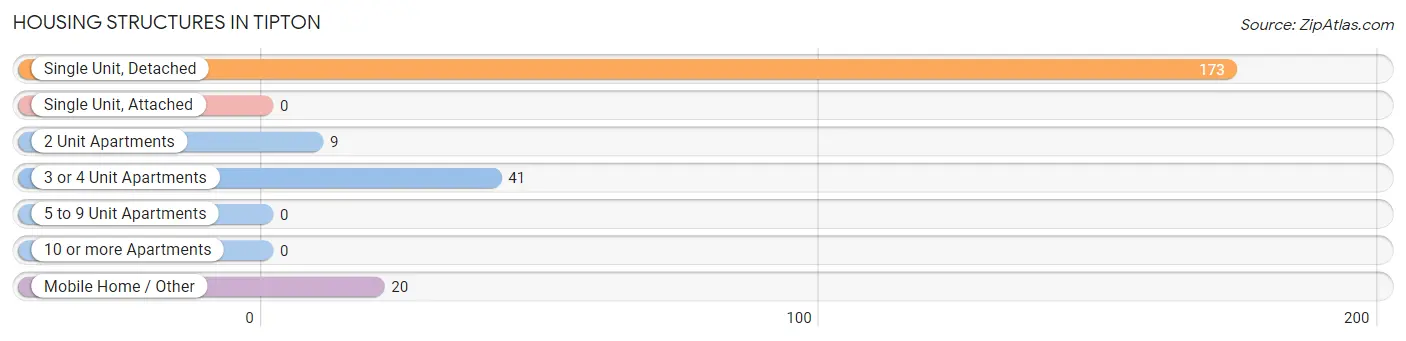
| Structure Type | # Housing Units | % Housing Units |
| Single Unit, Detached | 173 | 71.2% |
| Single Unit, Attached | 0 | 0.0% |
| 2 Unit Apartments | 9 | 3.7% |
| 3 or 4 Unit Apartments | 41 | 16.9% |
| 5 to 9 Unit Apartments | 0 | 0.0% |
| 10 or more Apartments | 0 | 0.0% |
| Mobile Home / Other | 20 | 8.2% |
| Total | 243 | 100.0% |
Housing Structures by Occupancy in Tipton
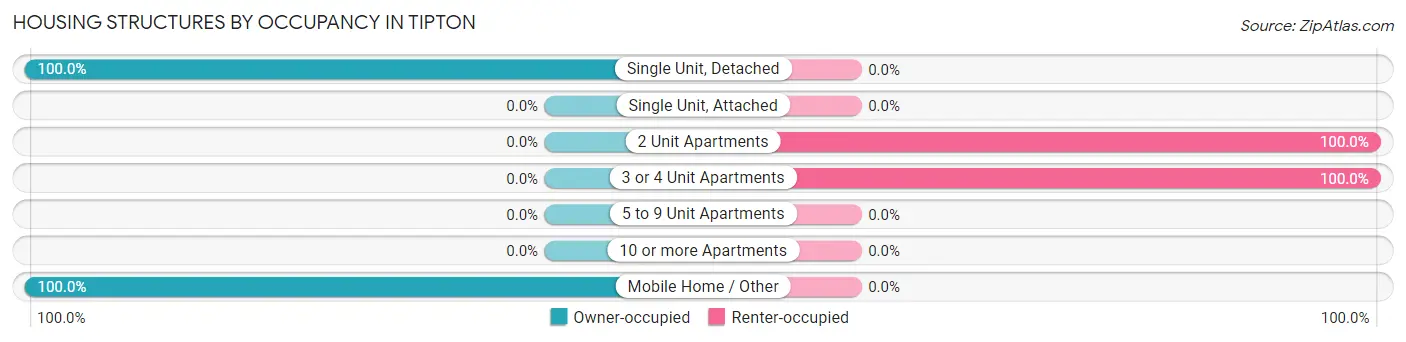
| Structure Type | Owner-occupied | Renter-occupied |
| Single Unit, Detached | 173 (100.0%) | 0 (0.0%) |
| Single Unit, Attached | 0 (0.0%) | 0 (0.0%) |
| 2 Unit Apartments | 0 (0.0%) | 9 (100.0%) |
| 3 or 4 Unit Apartments | 0 (0.0%) | 41 (100.0%) |
| 5 to 9 Unit Apartments | 0 (0.0%) | 0 (0.0%) |
| 10 or more Apartments | 0 (0.0%) | 0 (0.0%) |
| Mobile Home / Other | 20 (100.0%) | 0 (0.0%) |
| Total | 193 (79.4%) | 50 (20.6%) |
Housing Structures by Number of Rooms in Tipton
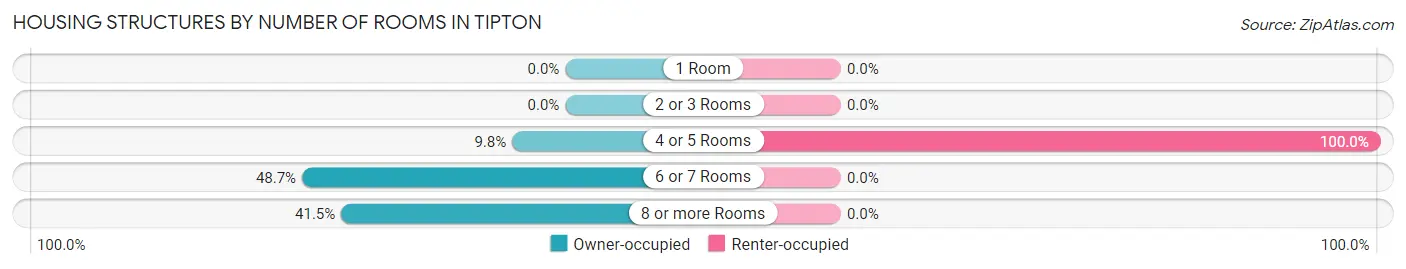
| Number of Rooms | Owner-occupied | Renter-occupied |
| 1 Room | 0 (0.0%) | 0 (0.0%) |
| 2 or 3 Rooms | 0 (0.0%) | 0 (0.0%) |
| 4 or 5 Rooms | 19 (9.8%) | 50 (100.0%) |
| 6 or 7 Rooms | 94 (48.7%) | 0 (0.0%) |
| 8 or more Rooms | 80 (41.4%) | 0 (0.0%) |
| Total | 193 (100.0%) | 50 (100.0%) |
Housing Structure by Heating Type in Tipton
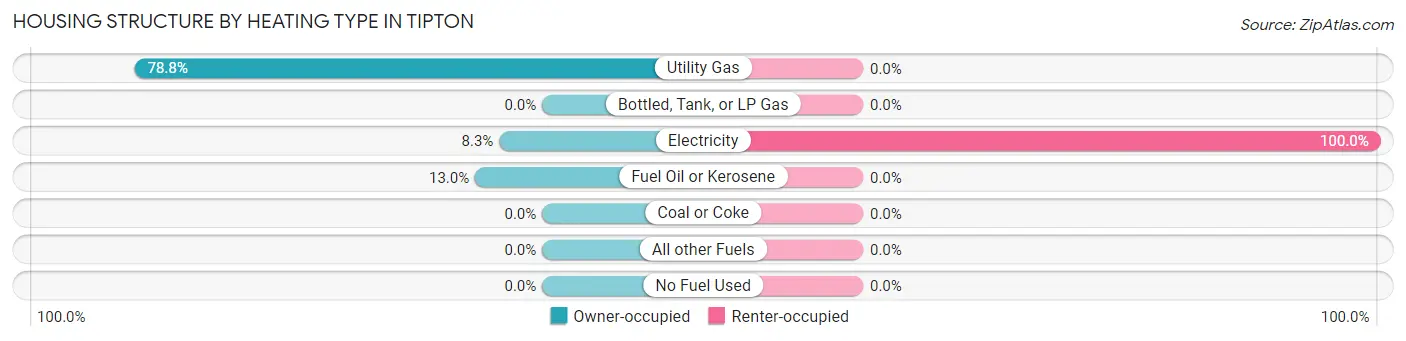
| Heating Type | Owner-occupied | Renter-occupied |
| Utility Gas | 152 (78.8%) | 0 (0.0%) |
| Bottled, Tank, or LP Gas | 0 (0.0%) | 0 (0.0%) |
| Electricity | 16 (8.3%) | 50 (100.0%) |
| Fuel Oil or Kerosene | 25 (13.0%) | 0 (0.0%) |
| Coal or Coke | 0 (0.0%) | 0 (0.0%) |
| All other Fuels | 0 (0.0%) | 0 (0.0%) |
| No Fuel Used | 0 (0.0%) | 0 (0.0%) |
| Total | 193 (100.0%) | 50 (100.0%) |
Household Vehicle Usage in Tipton
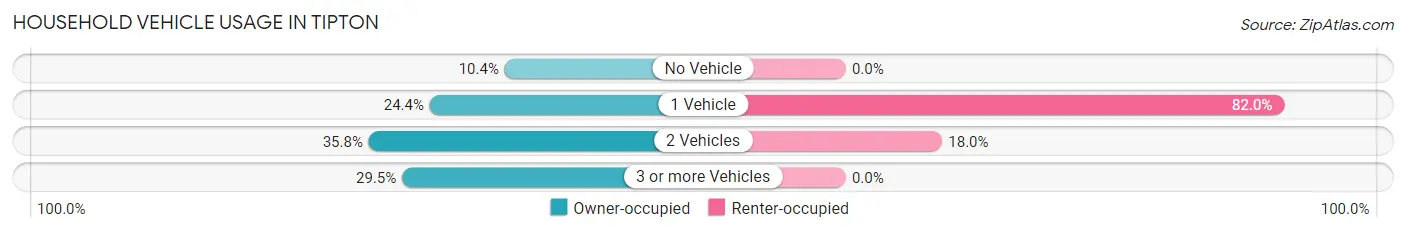
| Vehicles per Household | Owner-occupied | Renter-occupied |
| No Vehicle | 20 (10.4%) | 0 (0.0%) |
| 1 Vehicle | 47 (24.3%) | 41 (82.0%) |
| 2 Vehicles | 69 (35.7%) | 9 (18.0%) |
| 3 or more Vehicles | 57 (29.5%) | 0 (0.0%) |
| Total | 193 (100.0%) | 50 (100.0%) |
Real Estate & Mortgages in Tipton
Real Estate and Mortgage Overview in Tipton
| Characteristic | Without Mortgage | With Mortgage |
| Housing Units | 64 | 129 |
| Median Property Value | $146,400 | $206,900 |
| Median Household Income | - | - |
| Monthly Housing Costs | $556 | $15 |
| Real Estate Taxes | - | - |
Property Value by Mortgage Status in Tipton
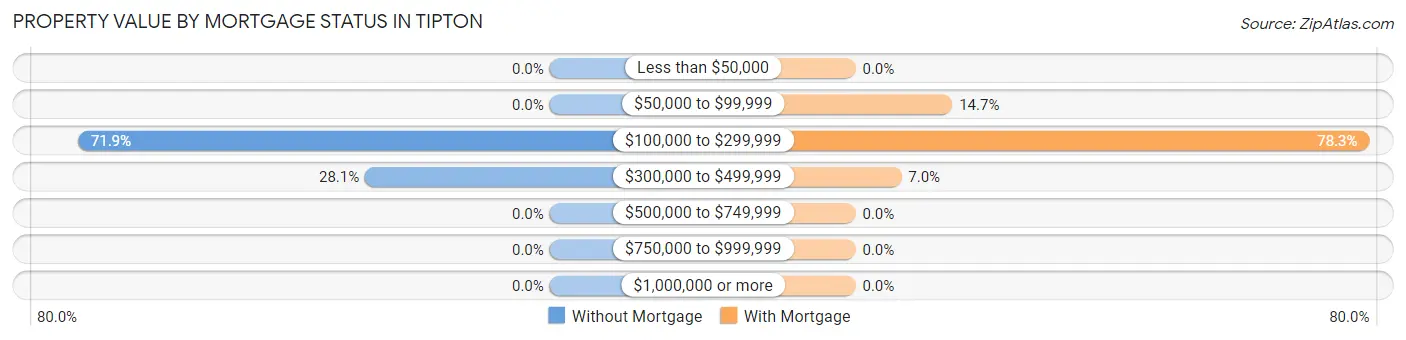
| Property Value | Without Mortgage | With Mortgage |
| Less than $50,000 | 0 (0.0%) | 0 (0.0%) |
| $50,000 to $99,999 | 0 (0.0%) | 19 (14.7%) |
| $100,000 to $299,999 | 46 (71.9%) | 101 (78.3%) |
| $300,000 to $499,999 | 18 (28.1%) | 9 (7.0%) |
| $500,000 to $749,999 | 0 (0.0%) | 0 (0.0%) |
| $750,000 to $999,999 | 0 (0.0%) | 0 (0.0%) |
| $1,000,000 or more | 0 (0.0%) | 0 (0.0%) |
| Total | 64 (100.0%) | 129 (100.0%) |
Household Income by Mortgage Status in Tipton
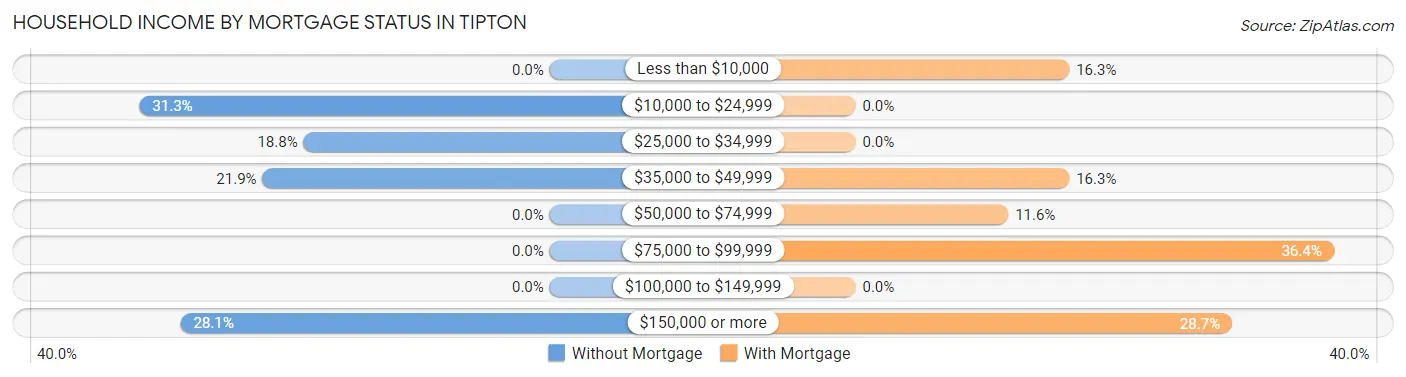
| Household Income | Without Mortgage | With Mortgage |
| Less than $10,000 | 0 (0.0%) | 21 (16.3%) |
| $10,000 to $24,999 | 20 (31.2%) | 0 (0.0%) |
| $25,000 to $34,999 | 12 (18.8%) | 0 (0.0%) |
| $35,000 to $49,999 | 14 (21.9%) | 21 (16.3%) |
| $50,000 to $74,999 | 0 (0.0%) | 15 (11.6%) |
| $75,000 to $99,999 | 0 (0.0%) | 47 (36.4%) |
| $100,000 to $149,999 | 0 (0.0%) | 0 (0.0%) |
| $150,000 or more | 18 (28.1%) | 37 (28.7%) |
| Total | 64 (100.0%) | 129 (100.0%) |
Property Value to Household Income Ratio in Tipton
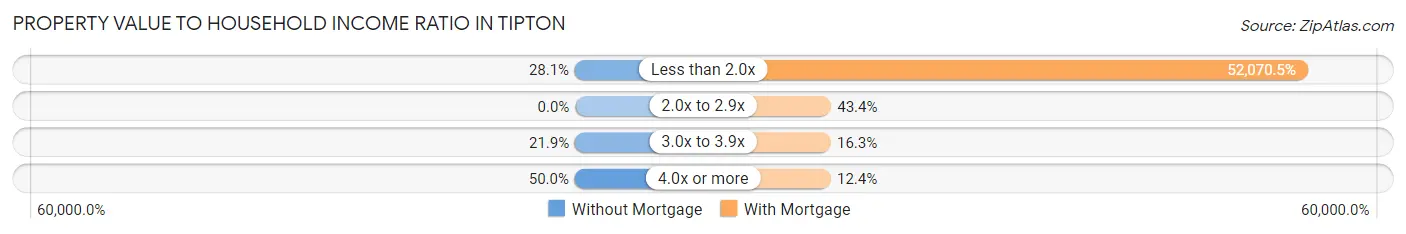
| Value-to-Income Ratio | Without Mortgage | With Mortgage |
| Less than 2.0x | 18 (28.1%) | 67,171 (52,070.5%) |
| 2.0x to 2.9x | 0 (0.0%) | 56 (43.4%) |
| 3.0x to 3.9x | 14 (21.9%) | 21 (16.3%) |
| 4.0x or more | 32 (50.0%) | 16 (12.4%) |
| Total | 64 (100.0%) | 129 (100.0%) |
Real Estate Taxes by Mortgage Status in Tipton
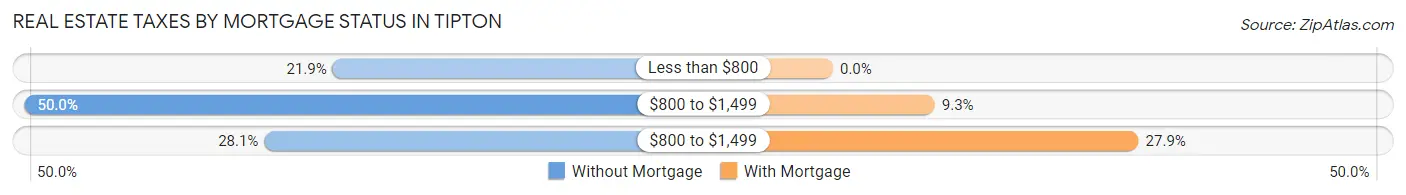
| Property Taxes | Without Mortgage | With Mortgage |
| Less than $800 | 14 (21.9%) | 0 (0.0%) |
| $800 to $1,499 | 32 (50.0%) | 12 (9.3%) |
| $800 to $1,499 | 18 (28.1%) | 36 (27.9%) |
| Total | 64 (100.0%) | 129 (100.0%) |
Health & Disability in Tipton
Health Insurance Coverage by Age in Tipton
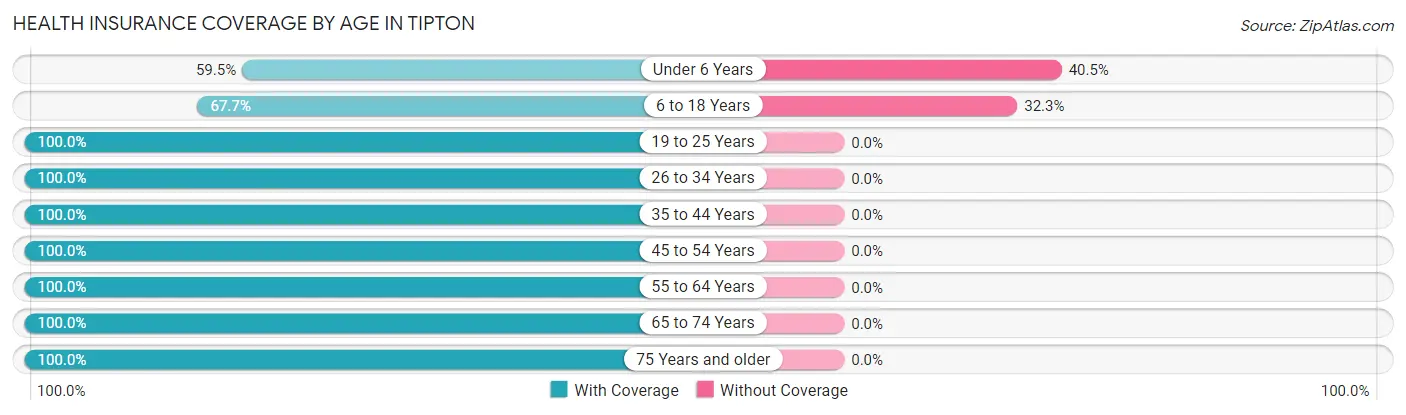
| Age Bracket | With Coverage | Without Coverage |
| Under 6 Years | 22 (59.5%) | 15 (40.5%) |
| 6 to 18 Years | 63 (67.7%) | 30 (32.3%) |
| 19 to 25 Years | 58 (100.0%) | 0 (0.0%) |
| 26 to 34 Years | 46 (100.0%) | 0 (0.0%) |
| 35 to 44 Years | 54 (100.0%) | 0 (0.0%) |
| 45 to 54 Years | 77 (100.0%) | 0 (0.0%) |
| 55 to 64 Years | 55 (100.0%) | 0 (0.0%) |
| 65 to 74 Years | 46 (100.0%) | 0 (0.0%) |
| 75 Years and older | 53 (100.0%) | 0 (0.0%) |
| Total | 474 (91.3%) | 45 (8.7%) |
Health Insurance Coverage by Citizenship Status in Tipton
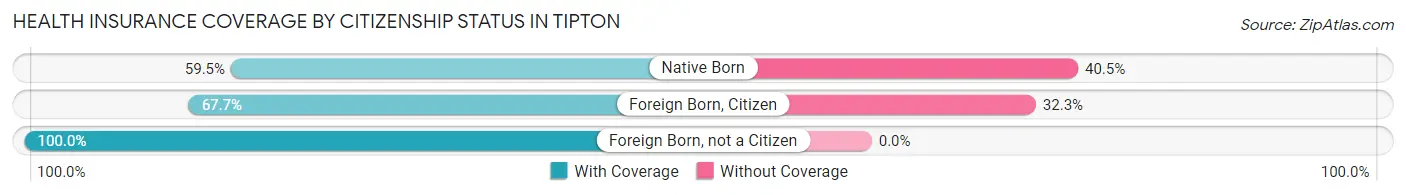
| Citizenship Status | With Coverage | Without Coverage |
| Native Born | 22 (59.5%) | 15 (40.5%) |
| Foreign Born, Citizen | 63 (67.7%) | 30 (32.3%) |
| Foreign Born, not a Citizen | 58 (100.0%) | 0 (0.0%) |
Health Insurance Coverage by Household Income in Tipton
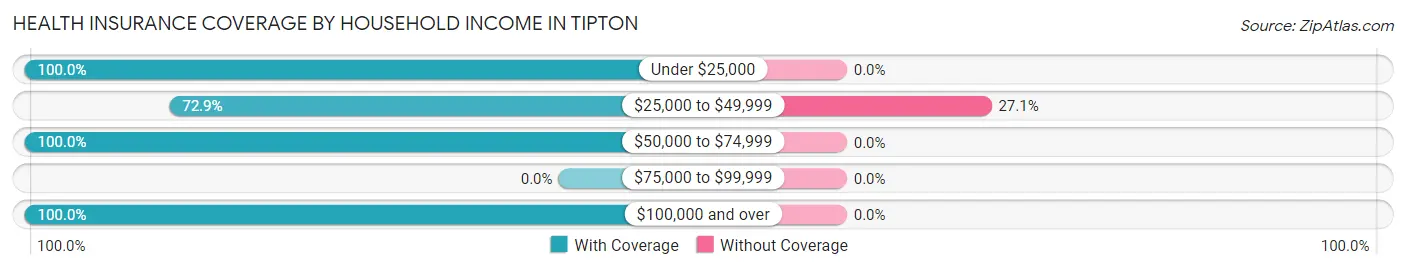
| Household Income | With Coverage | Without Coverage |
| Under $25,000 | 20 (100.0%) | 0 (0.0%) |
| $25,000 to $49,999 | 121 (72.9%) | 45 (27.1%) |
| $50,000 to $74,999 | 122 (100.0%) | 0 (0.0%) |
| $75,000 to $99,999 | 0 (0.0%) | 0 (0.0%) |
| $100,000 and over | 211 (100.0%) | 0 (0.0%) |
Public vs Private Health Insurance Coverage by Age in Tipton
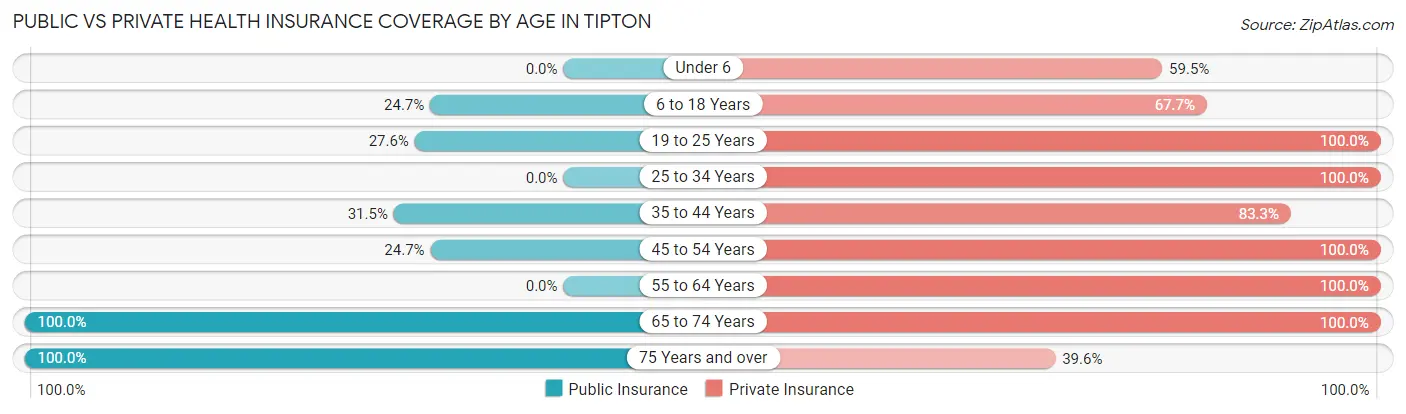
| Age Bracket | Public Insurance | Private Insurance |
| Under 6 | 0 (0.0%) | 22 (59.5%) |
| 6 to 18 Years | 23 (24.7%) | 63 (67.7%) |
| 19 to 25 Years | 16 (27.6%) | 58 (100.0%) |
| 25 to 34 Years | 0 (0.0%) | 46 (100.0%) |
| 35 to 44 Years | 17 (31.5%) | 45 (83.3%) |
| 45 to 54 Years | 19 (24.7%) | 77 (100.0%) |
| 55 to 64 Years | 0 (0.0%) | 55 (100.0%) |
| 65 to 74 Years | 46 (100.0%) | 46 (100.0%) |
| 75 Years and over | 53 (100.0%) | 21 (39.6%) |
| Total | 174 (33.5%) | 433 (83.4%) |
Disability Status by Sex by Age in Tipton
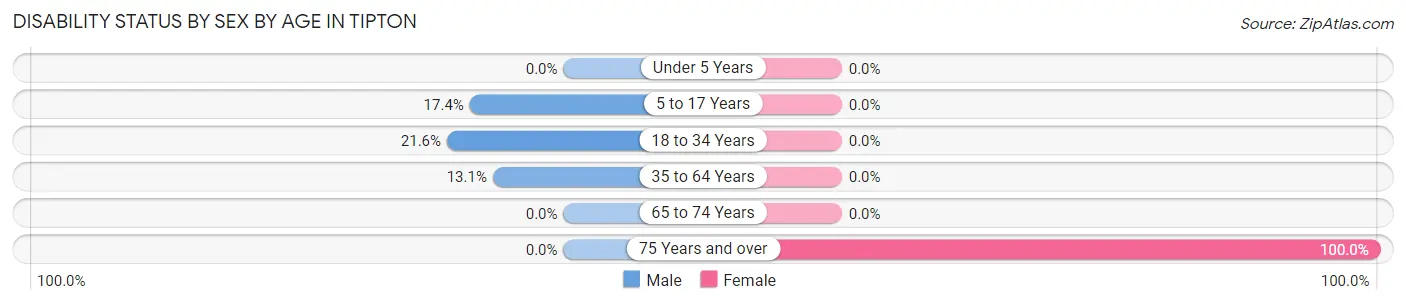
| Age Bracket | Male | Female |
| Under 5 Years | 0 (0.0%) | 0 (0.0%) |
| 5 to 17 Years | 8 (17.4%) | 0 (0.0%) |
| 18 to 34 Years | 16 (21.6%) | 0 (0.0%) |
| 35 to 64 Years | 8 (13.1%) | 0 (0.0%) |
| 65 to 74 Years | 0 (0.0%) | 0 (0.0%) |
| 75 Years and over | 0 (0.0%) | 53 (100.0%) |
Disability Class by Sex by Age in Tipton
Disability Class: Hearing Difficulty
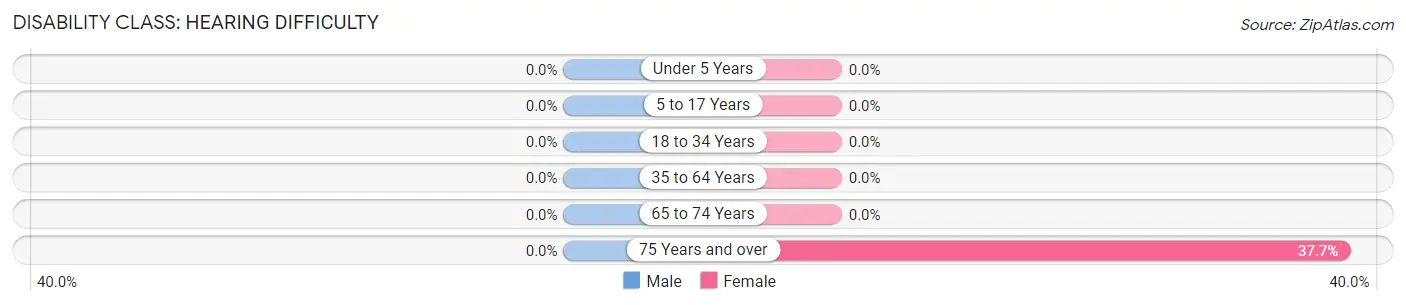
| Age Bracket | Male | Female |
| Under 5 Years | 0 (0.0%) | 0 (0.0%) |
| 5 to 17 Years | 0 (0.0%) | 0 (0.0%) |
| 18 to 34 Years | 0 (0.0%) | 0 (0.0%) |
| 35 to 64 Years | 0 (0.0%) | 0 (0.0%) |
| 65 to 74 Years | 0 (0.0%) | 0 (0.0%) |
| 75 Years and over | 0 (0.0%) | 20 (37.7%) |
Disability Class: Vision Difficulty
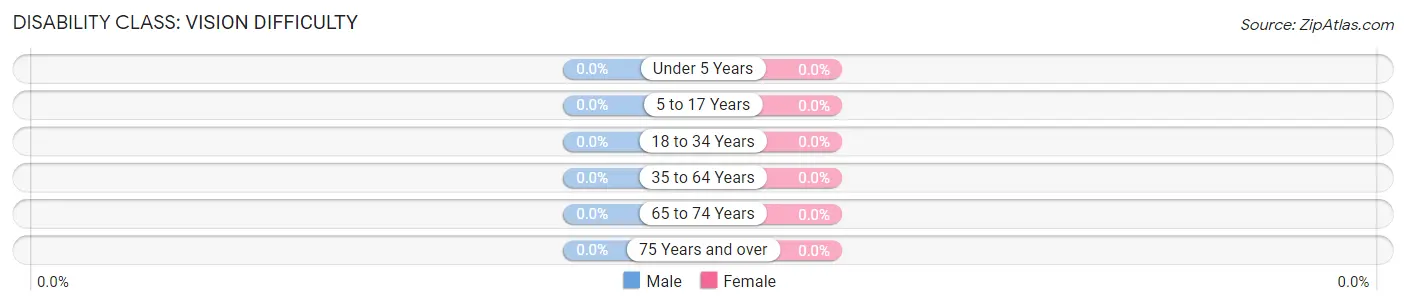
| Age Bracket | Male | Female |
| Under 5 Years | 0 (0.0%) | 0 (0.0%) |
| 5 to 17 Years | 0 (0.0%) | 0 (0.0%) |
| 18 to 34 Years | 0 (0.0%) | 0 (0.0%) |
| 35 to 64 Years | 0 (0.0%) | 0 (0.0%) |
| 65 to 74 Years | 0 (0.0%) | 0 (0.0%) |
| 75 Years and over | 0 (0.0%) | 0 (0.0%) |
Disability Class: Cognitive Difficulty
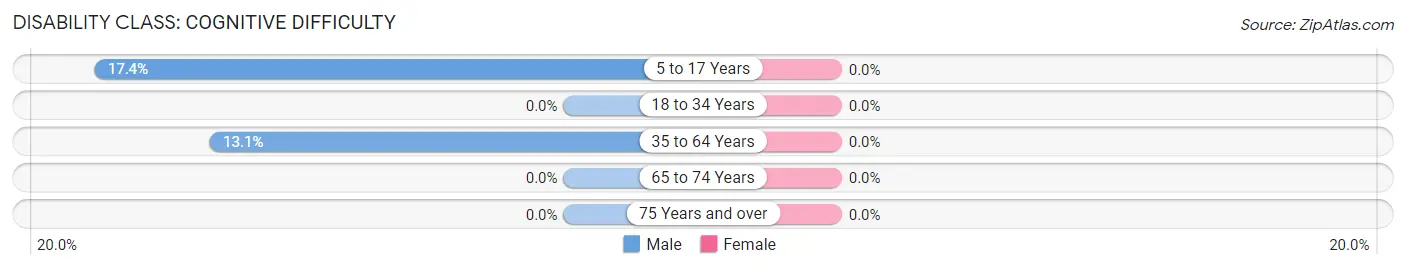
| Age Bracket | Male | Female |
| 5 to 17 Years | 8 (17.4%) | 0 (0.0%) |
| 18 to 34 Years | 0 (0.0%) | 0 (0.0%) |
| 35 to 64 Years | 8 (13.1%) | 0 (0.0%) |
| 65 to 74 Years | 0 (0.0%) | 0 (0.0%) |
| 75 Years and over | 0 (0.0%) | 0 (0.0%) |
Disability Class: Ambulatory Difficulty
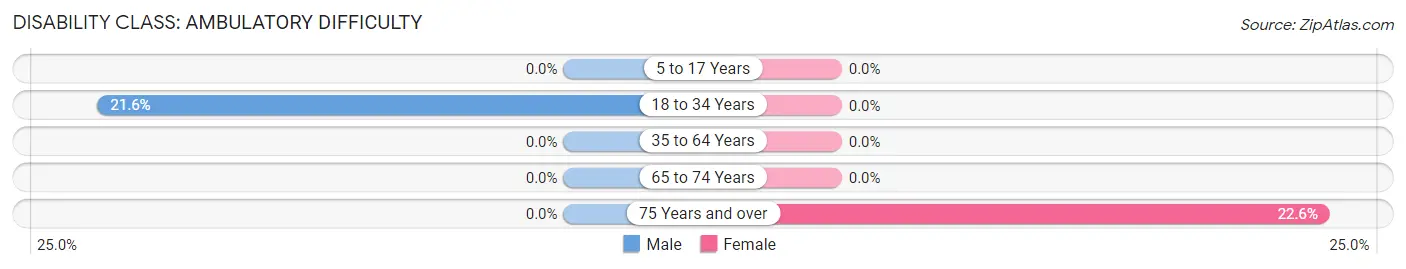
| Age Bracket | Male | Female |
| 5 to 17 Years | 0 (0.0%) | 0 (0.0%) |
| 18 to 34 Years | 16 (21.6%) | 0 (0.0%) |
| 35 to 64 Years | 0 (0.0%) | 0 (0.0%) |
| 65 to 74 Years | 0 (0.0%) | 0 (0.0%) |
| 75 Years and over | 0 (0.0%) | 12 (22.6%) |
Disability Class: Self-Care Difficulty
| Age Bracket | Male | Female |
| 5 to 17 Years | 0 (0.0%) | 0 (0.0%) |
| 18 to 34 Years | 0 (0.0%) | 0 (0.0%) |
| 35 to 64 Years | 0 (0.0%) | 0 (0.0%) |
| 65 to 74 Years | 0 (0.0%) | 0 (0.0%) |
| 75 Years and over | 0 (0.0%) | 0 (0.0%) |
Technology Access in Tipton
Computing Device Access in Tipton
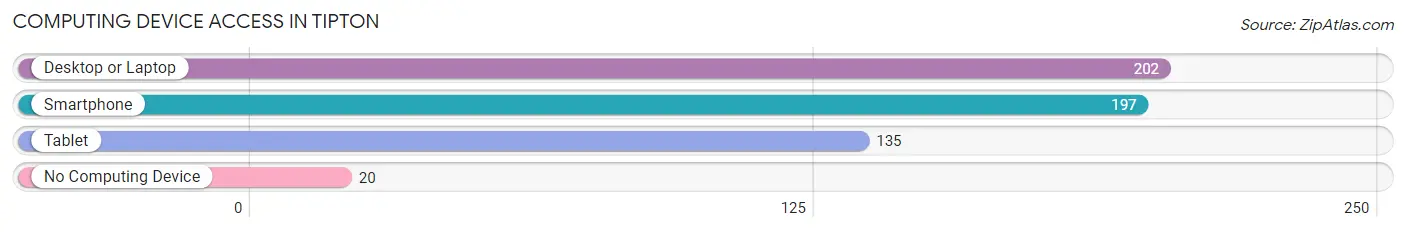
| Device Type | # Households | % Households |
| Desktop or Laptop | 202 | 83.1% |
| Smartphone | 197 | 81.1% |
| Tablet | 135 | 55.6% |
| No Computing Device | 20 | 8.2% |
| Total | 243 | 100.0% |
Internet Access in Tipton
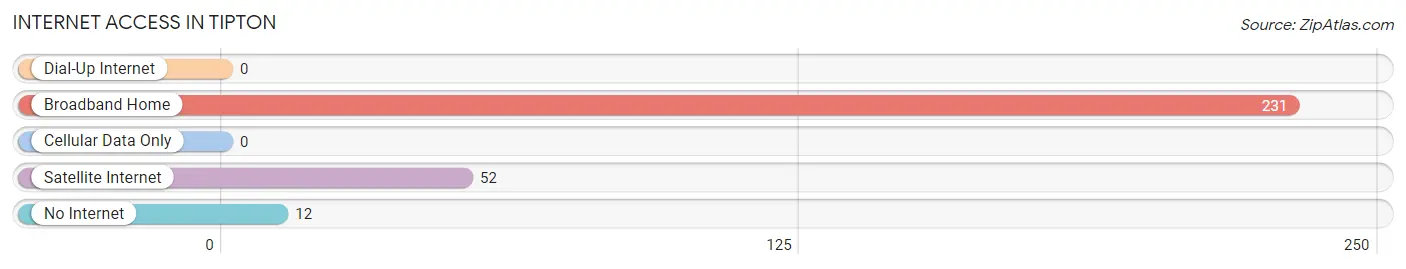
| Internet Type | # Households | % Households |
| Dial-Up Internet | 0 | 0.0% |
| Broadband Home | 231 | 95.1% |
| Cellular Data Only | 0 | 0.0% |
| Satellite Internet | 52 | 21.4% |
| No Internet | 12 | 4.9% |
| Total | 243 | 100.0% |
Tipton Summary
Tipton is a small borough located in Westmoreland County, Pennsylvania. It is situated in the foothills of the Allegheny Mountains, approximately 40 miles southeast of Pittsburgh. The population of Tipton was 1,093 at the 2010 census.
History
Tipton was founded in 1845 by John Tipton, a local landowner. The town was originally known as Tiptonville, but the name was changed to Tipton in 1876. The town was incorporated in 1891.
Tipton was a small farming community until the early 20th century, when the coal industry began to boom in the area. The town was home to several coal mines, and the population grew rapidly. By the 1950s, Tipton had become a bustling coal mining town.
Geography
Tipton is located at 40°19'N 79°37'W (40.3167, -79.6167). According to the United States Census Bureau, the borough has a total area of 0.6 square miles (1.6 km2), all of it land.
Economy
Tipton's economy is largely based on agriculture and coal mining. The town is home to several small farms, and the surrounding area is known for its production of corn, wheat, and hay. The coal industry is still a major employer in the area, and several coal mines are still in operation.
Demographics
As of the 2010 census, there were 1,093 people, 441 households, and 294 families residing in the borough. The population density was 1,822.5 people per square mile (704.3/km2). There were 486 housing units at an average density of 811.7 per square mile (313.7/km2). The racial makeup of the borough was 97.7% White, 0.7% African American, 0.2% Native American, 0.2% Asian, 0.1% from other races, and 1.1% from two or more races. Hispanic or Latino of any race were 0.7% of the population.
There were 441 households, out of which 28.2% had children under the age of 18 living with them, 48.2% were married couples living together, 12.7% had a female householder with no husband present, and 33.2% were non-families. 28.2% of all households were made up of individuals, and 14.3% had someone living alone who was 65 years of age or older. The average household size was 2.47 and the average family size was 3.02.
In the borough, the population was spread out, with 24.2% under the age of 18, 7.2% from 18 to 24, 27.2% from 25 to 44, 24.2% from 45 to 64, and 17.2% who were 65 years of age or older. The median age was 39 years. For every 100 females, there were 94.2 males. For every 100 females age 18 and over, there were 91.2 males.
The median income for a household in the borough was $30,000, and the median income for a family was $36,250. Males had a median income of $30,000 versus $20,000 for females. The per capita income for the borough was $14,945. About 8.2% of families and 11.2% of the population were below the poverty line, including 16.7% of those under age 18 and 8.3% of those age 65 or over.
Common Questions
What is Per Capita Income in Tipton?
Per Capita income in Tipton is $35,378.
What is the Median Family Income in Tipton?
Median Family Income in Tipton is $101,458.
What is the Median Household income in Tipton?
Median Household Income in Tipton is $62,991.
What is Income or Wage Gap in Tipton?
Income or Wage Gap in Tipton is 16.1%.
Women in Tipton earn 83.9 cents for every dollar earned by a man.
What is Inequality or Gini Index in Tipton?
Inequality or Gini Index in Tipton is 0.37.
What is the Total Population of Tipton?
Total Population of Tipton is 519.
What is the Total Male Population of Tipton?
Total Male Population of Tipton is 212.
What is the Total Female Population of Tipton?
Total Female Population of Tipton is 307.
What is the Ratio of Males per 100 Females in Tipton?
There are 69.06 Males per 100 Females in Tipton.
What is the Ratio of Females per 100 Males in Tipton?
There are 144.81 Females per 100 Males in Tipton.
What is the Median Population Age in Tipton?
Median Population Age in Tipton is 40.5 Years.
What is the Average Family Size in Tipton
Average Family Size in Tipton is 3.3 People.
What is the Average Household Size in Tipton
Average Household Size in Tipton is 2.1 People.
How Large is the Labor Force in Tipton?
There are 310 People in the Labor Forcein in Tipton.
What is the Percentage of People in the Labor Force in Tipton?
71.6% of People are in the Labor Force in Tipton.