Yorklyn, PA Map & Demographics
Yorklyn Map
Yorklyn Overview
$35,632
PER CAPITA INCOME
$76,703
AVG FAMILY INCOME
$75,833
AVG HOUSEHOLD INCOME
2.4%
WAGE / INCOME GAP [ % ]
97.6¢/ $1
WAGE / INCOME GAP [ $ ]
0.34
INEQUALITY / GINI INDEX
1,637
TOTAL POPULATION
875
MALE POPULATION
762
FEMALE POPULATION
114.83
MALES / 100 FEMALES
87.09
FEMALES / 100 MALES
40.5
MEDIAN AGE
3.4
AVG FAMILY SIZE
3.0
AVG HOUSEHOLD SIZE
875
LABOR FORCE [ PEOPLE ]
65.9%
PERCENT IN LABOR FORCE
Income in Yorklyn
Income Overview in Yorklyn
Per Capita Income in Yorklyn is $35,632, while median incomes of families and households are $76,703 and $75,833 respectively.
| Characteristic | Number | Measure |
| Per Capita Income | 1,637 | $35,632 |
| Median Family Income | 444 | $76,703 |
| Mean Family Income | 444 | $104,598 |
| Median Household Income | 546 | $75,833 |
| Mean Household Income | 546 | $100,214 |
| Income Deficit | 444 | $0 |
| Wage / Income Gap (%) | 1,637 | 2.44% |
| Wage / Income Gap ($) | 1,637 | 97.56¢ per $1 |
| Gini / Inequality Index | 1,637 | 0.34 |
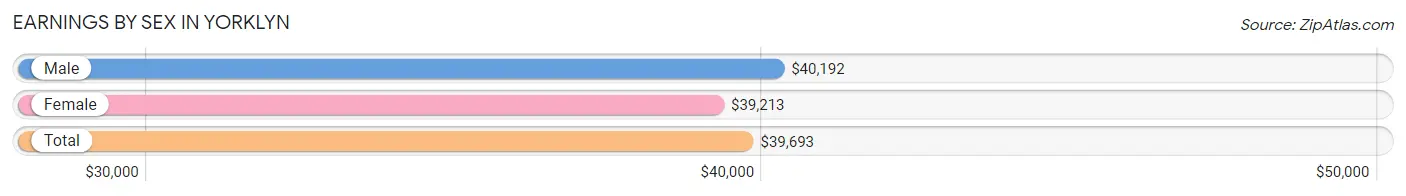
Earnings by Sex in Yorklyn
Average Earnings in Yorklyn are $39,693, $40,192 for men and $39,213 for women, a difference of 2.4%.
| Sex | Number | Average Earnings |
| Male | 570 (62.4%) | $40,192 |
| Female | 343 (37.6%) | $39,213 |
| Total | 913 (100.0%) | $39,693 |
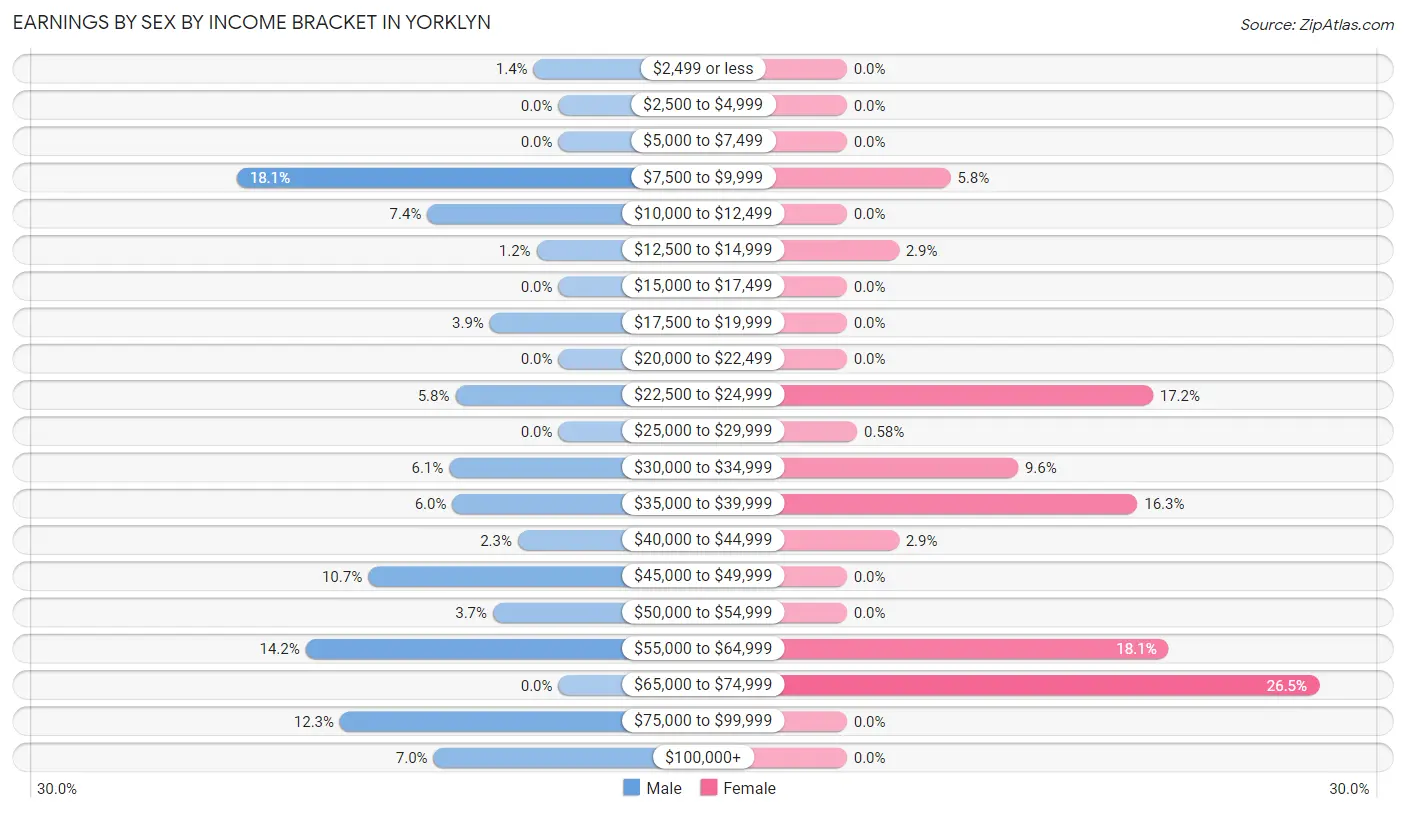
Earnings by Sex by Income Bracket in Yorklyn
The most common earnings brackets in Yorklyn are $7,500 to $9,999 for men (103 | 18.1%) and $65,000 to $74,999 for women (91 | 26.5%).
| Income | Male | Female |
| $2,499 or less | 8 (1.4%) | 0 (0.0%) |
| $2,500 to $4,999 | 0 (0.0%) | 0 (0.0%) |
| $5,000 to $7,499 | 0 (0.0%) | 0 (0.0%) |
| $7,500 to $9,999 | 103 (18.1%) | 20 (5.8%) |
| $10,000 to $12,499 | 42 (7.4%) | 0 (0.0%) |
| $12,500 to $14,999 | 7 (1.2%) | 10 (2.9%) |
| $15,000 to $17,499 | 0 (0.0%) | 0 (0.0%) |
| $17,500 to $19,999 | 22 (3.9%) | 0 (0.0%) |
| $20,000 to $22,499 | 0 (0.0%) | 0 (0.0%) |
| $22,500 to $24,999 | 33 (5.8%) | 59 (17.2%) |
| $25,000 to $29,999 | 0 (0.0%) | 2 (0.6%) |
| $30,000 to $34,999 | 35 (6.1%) | 33 (9.6%) |
| $35,000 to $39,999 | 34 (6.0%) | 56 (16.3%) |
| $40,000 to $44,999 | 13 (2.3%) | 10 (2.9%) |
| $45,000 to $49,999 | 61 (10.7%) | 0 (0.0%) |
| $50,000 to $54,999 | 21 (3.7%) | 0 (0.0%) |
| $55,000 to $64,999 | 81 (14.2%) | 62 (18.1%) |
| $65,000 to $74,999 | 0 (0.0%) | 91 (26.5%) |
| $75,000 to $99,999 | 70 (12.3%) | 0 (0.0%) |
| $100,000+ | 40 (7.0%) | 0 (0.0%) |
| Total | 570 (100.0%) | 343 (100.0%) |
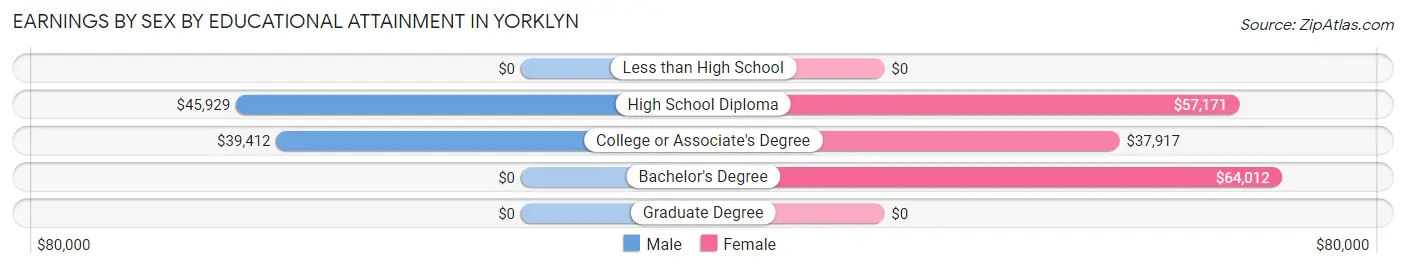
Earnings by Sex by Educational Attainment in Yorklyn
Average earnings in Yorklyn are $48,864 for men and $39,213 for women, a difference of 19.8%. Men with an educational attainment of high school diploma enjoy the highest average annual earnings of $45,929, while those with college or associate's degree education earn the least with $39,412. Women with an educational attainment of bachelor's degree earn the most with the average annual earnings of $64,012, while those with college or associate's degree education have the smallest earnings of $37,917.
| Educational Attainment | Male Income | Female Income |
| Less than High School | - | - |
| High School Diploma | $45,929 | $57,171 |
| College or Associate's Degree | $39,412 | $37,917 |
| Bachelor's Degree | - | - |
| Graduate Degree | - | - |
| Total | $48,864 | $39,213 |
Family Income in Yorklyn
Family Income Brackets in Yorklyn
According to the Yorklyn family income data, there are 124 families falling into the $100,000 to $149,999 income range, which is the most common income bracket and makes up 27.9% of all families.
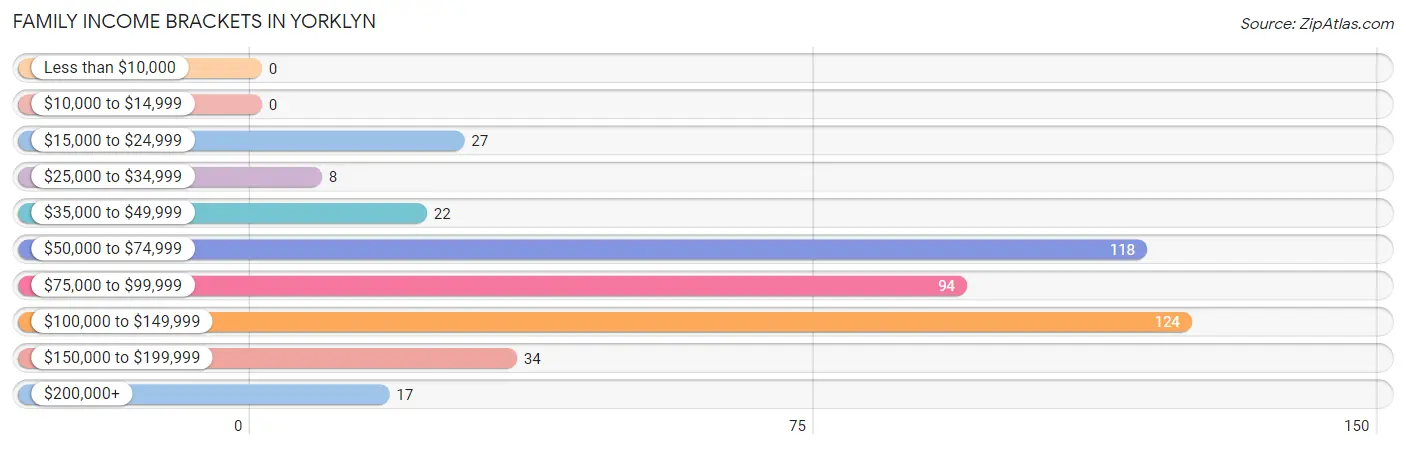
| Income Bracket | # Families | % Families |
| Less than $10,000 | 0 | 0.0% |
| $10,000 to $14,999 | 0 | 0.0% |
| $15,000 to $24,999 | 27 | 6.1% |
| $25,000 to $34,999 | 8 | 1.8% |
| $35,000 to $49,999 | 22 | 5.0% |
| $50,000 to $74,999 | 118 | 26.6% |
| $75,000 to $99,999 | 94 | 21.2% |
| $100,000 to $149,999 | 124 | 27.9% |
| $150,000 to $199,999 | 34 | 7.7% |
| $200,000+ | 17 | 3.8% |
Family Income by Famaliy Size in Yorklyn
3-person families (56 | 12.6%) account for the highest median family income in Yorklyn with $109,432 per family, while 2-person families (260 | 58.6%) have the highest median income of $36,923 per family member.
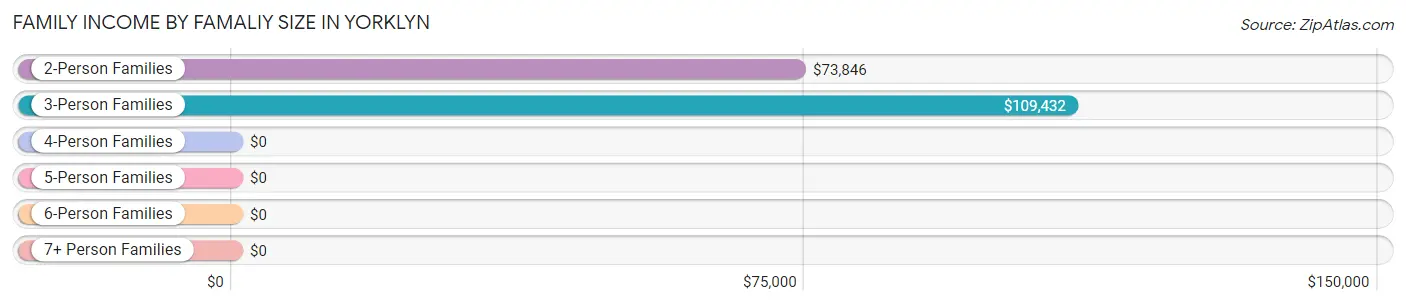
| Income Bracket | # Families | Median Income |
| 2-Person Families | 260 (58.6%) | $73,846 |
| 3-Person Families | 56 (12.6%) | $109,432 |
| 4-Person Families | 28 (6.3%) | $0 |
| 5-Person Families | 17 (3.8%) | $0 |
| 6-Person Families | 40 (9.0%) | $0 |
| 7+ Person Families | 43 (9.7%) | $0 |
| Total | 444 (100.0%) | $76,703 |
Family Income by Number of Earners in Yorklyn
The median family income in Yorklyn is $76,703, with families comprising 3+ earners (79) having the highest median family income of $138,634, while families with no earners (49) have the lowest median family income of $45,781, accounting for 17.8% and 11.0% of families, respectively.
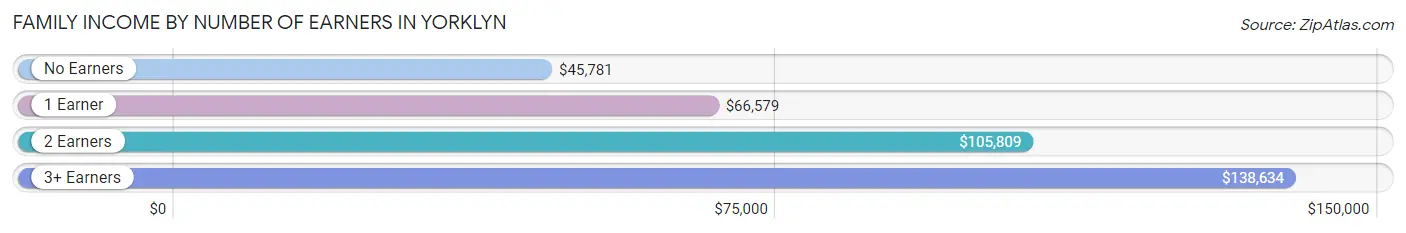
| Number of Earners | # Families | Median Income |
| No Earners | 49 (11.0%) | $45,781 |
| 1 Earner | 160 (36.0%) | $66,579 |
| 2 Earners | 156 (35.1%) | $105,809 |
| 3+ Earners | 79 (17.8%) | $138,634 |
| Total | 444 (100.0%) | $76,703 |
Household Income in Yorklyn
Household Income Brackets in Yorklyn
With 169 households falling in the category, the $50,000 to $74,999 income range is the most frequent in Yorklyn, accounting for 30.9% of all households.
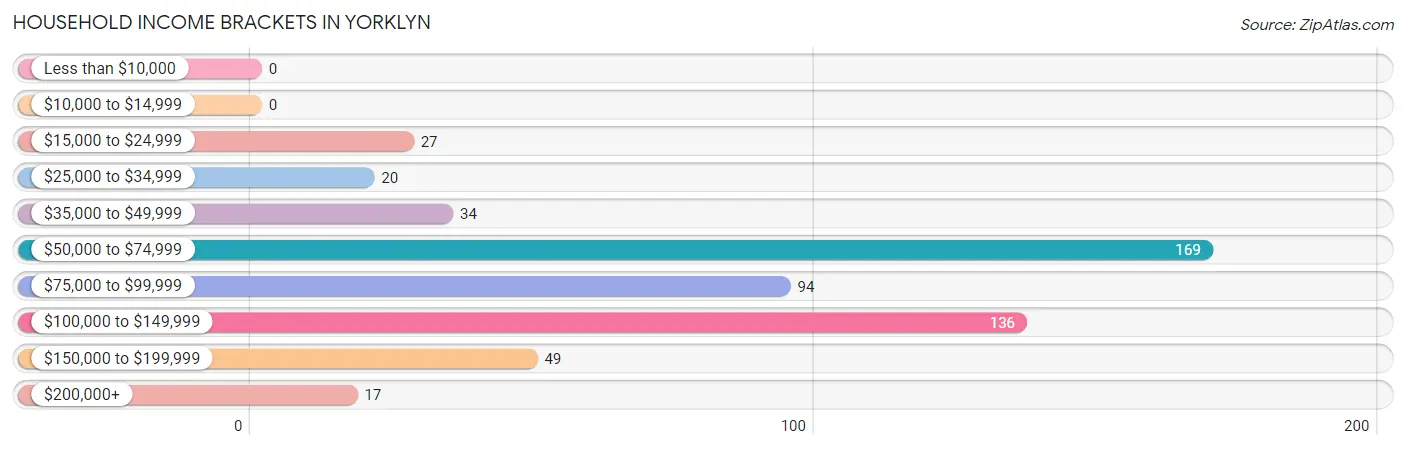
| Income Bracket | # Households | % Households |
| Less than $10,000 | 0 | 0.0% |
| $10,000 to $14,999 | 0 | 0.0% |
| $15,000 to $24,999 | 27 | 4.9% |
| $25,000 to $34,999 | 20 | 3.7% |
| $35,000 to $49,999 | 34 | 6.2% |
| $50,000 to $74,999 | 169 | 31.0% |
| $75,000 to $99,999 | 94 | 17.2% |
| $100,000 to $149,999 | 136 | 24.9% |
| $150,000 to $199,999 | 49 | 9.0% |
| $200,000+ | 17 | 3.1% |
Household Income by Householder Age in Yorklyn
The median household income in Yorklyn is $75,833, with the highest median household income of $77,330 found in the 65+ years age bracket for the primary householder. A total of 187 households (34.3%) fall into this category.
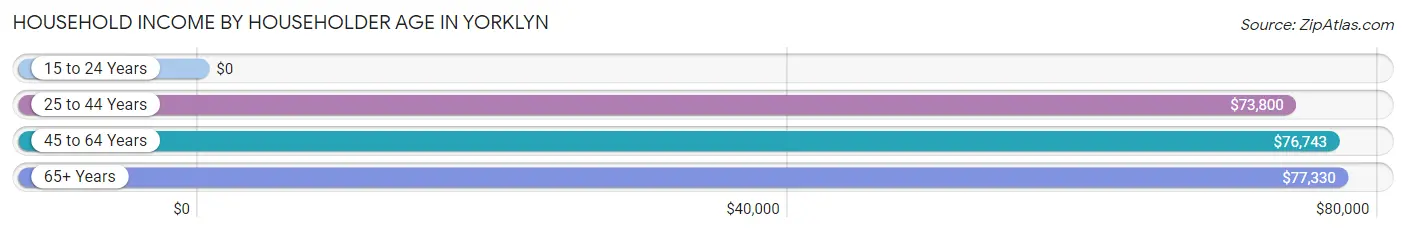
| Income Bracket | # Households | Median Income |
| 15 to 24 Years | 0 (0.0%) | $0 |
| 25 to 44 Years | 186 (34.1%) | $73,800 |
| 45 to 64 Years | 173 (31.7%) | $76,743 |
| 65+ Years | 187 (34.3%) | $77,330 |
| Total | 546 (100.0%) | $75,833 |
Poverty in Yorklyn
Income Below Poverty by Sex and Age in Yorklyn
With 19.0% poverty level for males and 3.5% for females among the residents of Yorklyn, under 5 year old males and 35 to 44 year old females are the most vulnerable to poverty, with 34 males (100.0%) and 27 females (22.3%) in their respective age groups living below the poverty level.
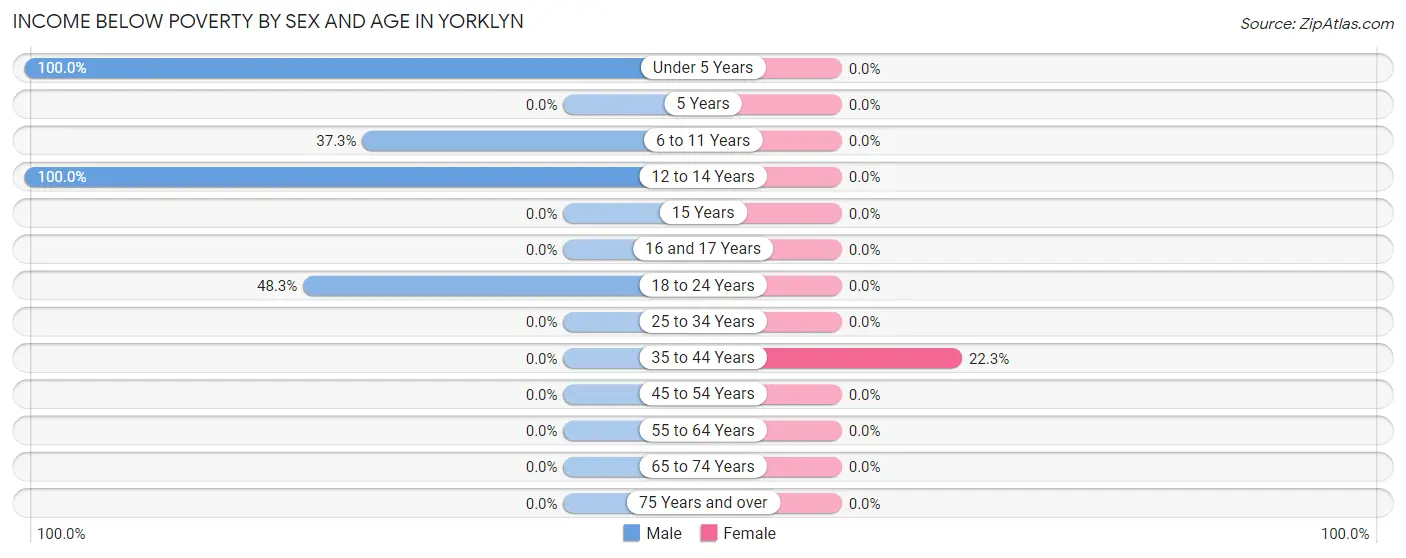
| Age Bracket | Male | Female |
| Under 5 Years | 34 (100.0%) | 0 (0.0%) |
| 5 Years | 0 (0.0%) | 0 (0.0%) |
| 6 to 11 Years | 25 (37.3%) | 0 (0.0%) |
| 12 to 14 Years | 50 (100.0%) | 0 (0.0%) |
| 15 Years | 0 (0.0%) | 0 (0.0%) |
| 16 and 17 Years | 0 (0.0%) | 0 (0.0%) |
| 18 to 24 Years | 57 (48.3%) | 0 (0.0%) |
| 25 to 34 Years | 0 (0.0%) | 0 (0.0%) |
| 35 to 44 Years | 0 (0.0%) | 27 (22.3%) |
| 45 to 54 Years | 0 (0.0%) | 0 (0.0%) |
| 55 to 64 Years | 0 (0.0%) | 0 (0.0%) |
| 65 to 74 Years | 0 (0.0%) | 0 (0.0%) |
| 75 Years and over | 0 (0.0%) | 0 (0.0%) |
| Total | 166 (19.0%) | 27 (3.5%) |
Income Above Poverty by Sex and Age in Yorklyn
According to the poverty statistics in Yorklyn, males aged 16 and 17 years and females aged under 5 years are the age groups that are most secure financially, with 100.0% of males and 100.0% of females in these age groups living above the poverty line.
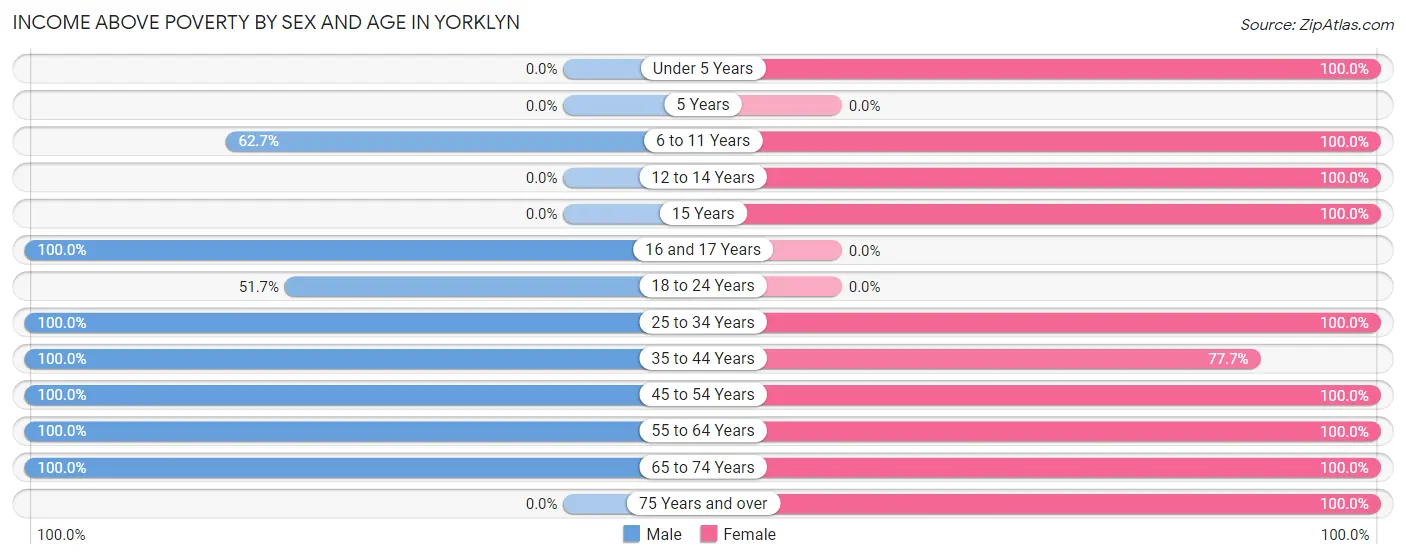
| Age Bracket | Male | Female |
| Under 5 Years | 0 (0.0%) | 24 (100.0%) |
| 5 Years | 0 (0.0%) | 0 (0.0%) |
| 6 to 11 Years | 42 (62.7%) | 40 (100.0%) |
| 12 to 14 Years | 0 (0.0%) | 81 (100.0%) |
| 15 Years | 0 (0.0%) | 13 (100.0%) |
| 16 and 17 Years | 8 (100.0%) | 0 (0.0%) |
| 18 to 24 Years | 61 (51.7%) | 0 (0.0%) |
| 25 to 34 Years | 154 (100.0%) | 124 (100.0%) |
| 35 to 44 Years | 33 (100.0%) | 94 (77.7%) |
| 45 to 54 Years | 95 (100.0%) | 50 (100.0%) |
| 55 to 64 Years | 150 (100.0%) | 147 (100.0%) |
| 65 to 74 Years | 166 (100.0%) | 133 (100.0%) |
| 75 Years and over | 0 (0.0%) | 29 (100.0%) |
| Total | 709 (81.0%) | 735 (96.5%) |
Income Below Poverty Among Married-Couple Families in Yorklyn
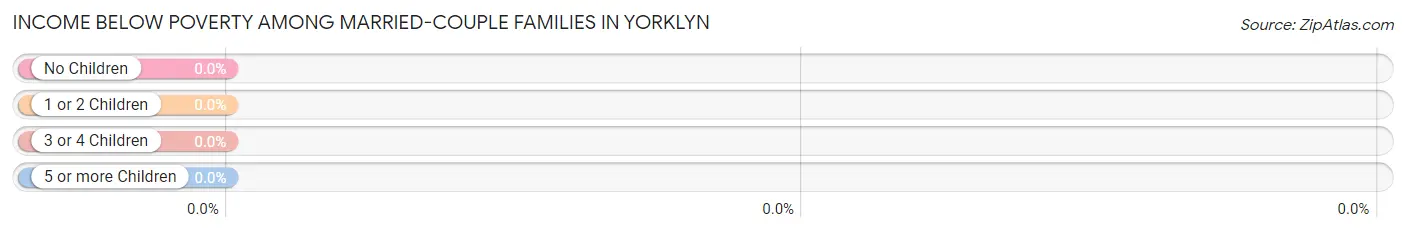
| Children | Above Poverty | Below Poverty |
| No Children | 311 (100.0%) | 0 (0.0%) |
| 1 or 2 Children | 30 (100.0%) | 0 (0.0%) |
| 3 or 4 Children | 43 (100.0%) | 0 (0.0%) |
| 5 or more Children | 0 (0.0%) | 0 (0.0%) |
| Total | 384 (100.0%) | 0 (0.0%) |
Income Below Poverty Among Single-Parent Households in Yorklyn
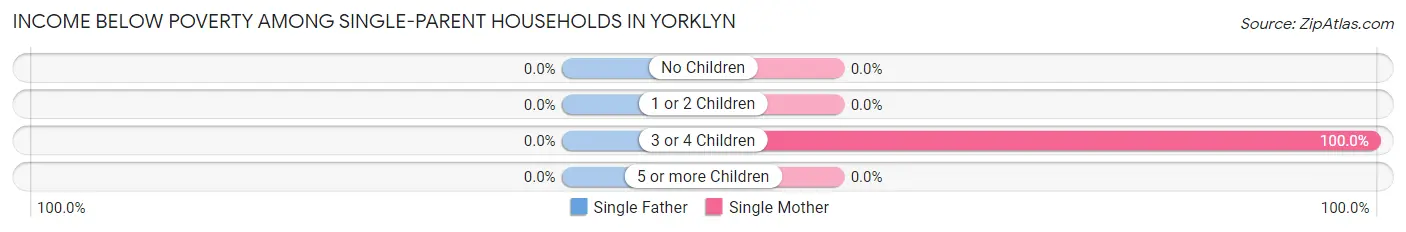
| Children | Single Father | Single Mother |
| No Children | 0 (0.0%) | 0 (0.0%) |
| 1 or 2 Children | 0 (0.0%) | 0 (0.0%) |
| 3 or 4 Children | 0 (0.0%) | 27 (100.0%) |
| 5 or more Children | 0 (0.0%) | 0 (0.0%) |
| Total | 0 (0.0%) | 27 (50.9%) |
Income Below Poverty Among Married-Couple vs Single-Parent Households in Yorklyn
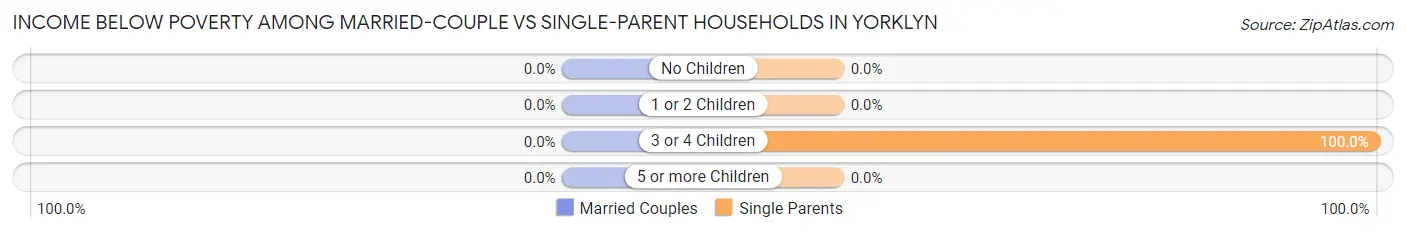
| Children | Married-Couple Families | Single-Parent Households |
| No Children | 0 (0.0%) | 0 (0.0%) |
| 1 or 2 Children | 0 (0.0%) | 0 (0.0%) |
| 3 or 4 Children | 0 (0.0%) | 27 (100.0%) |
| 5 or more Children | 0 (0.0%) | 0 (0.0%) |
| Total | 0 (0.0%) | 27 (45.0%) |
Race in Yorklyn
The most populous races in Yorklyn are White / Caucasian (1,164 | 71.1%), Hispanic or Latino (421 | 25.7%), and Two or more Races (290 | 17.7%).
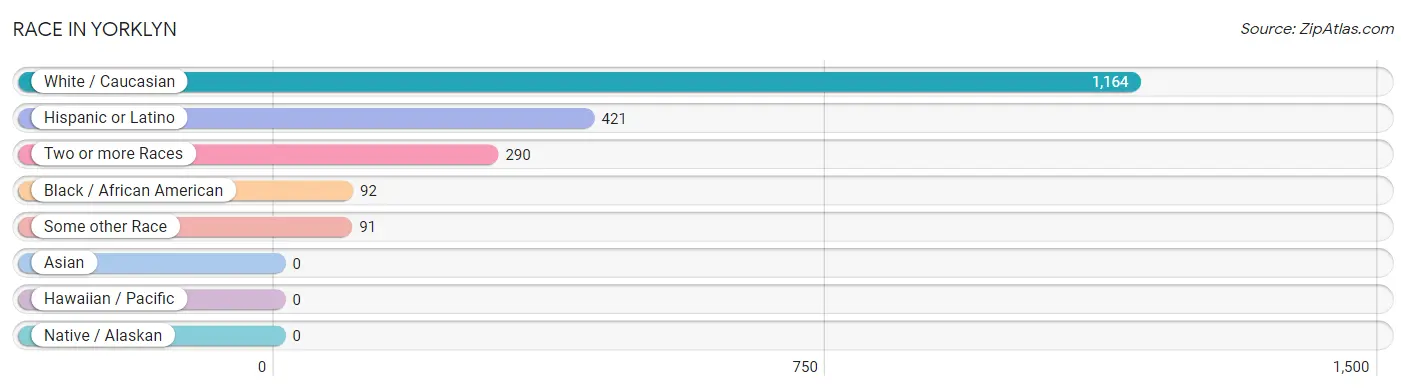
| Race | # Population | % Population |
| Asian | 0 | 0.0% |
| Black / African American | 92 | 5.6% |
| Hawaiian / Pacific | 0 | 0.0% |
| Hispanic or Latino | 421 | 25.7% |
| Native / Alaskan | 0 | 0.0% |
| White / Caucasian | 1,164 | 71.1% |
| Two or more Races | 290 | 17.7% |
| Some other Race | 91 | 5.6% |
| Total | 1,637 | 100.0% |
Ancestry in Yorklyn
The most populous ancestries reported in Yorklyn are Puerto Rican (345 | 21.1%), German (236 | 14.4%), English (95 | 5.8%), Irish (92 | 5.6%), and American (82 | 5.0%), together accounting for 51.9% of all Yorklyn residents.
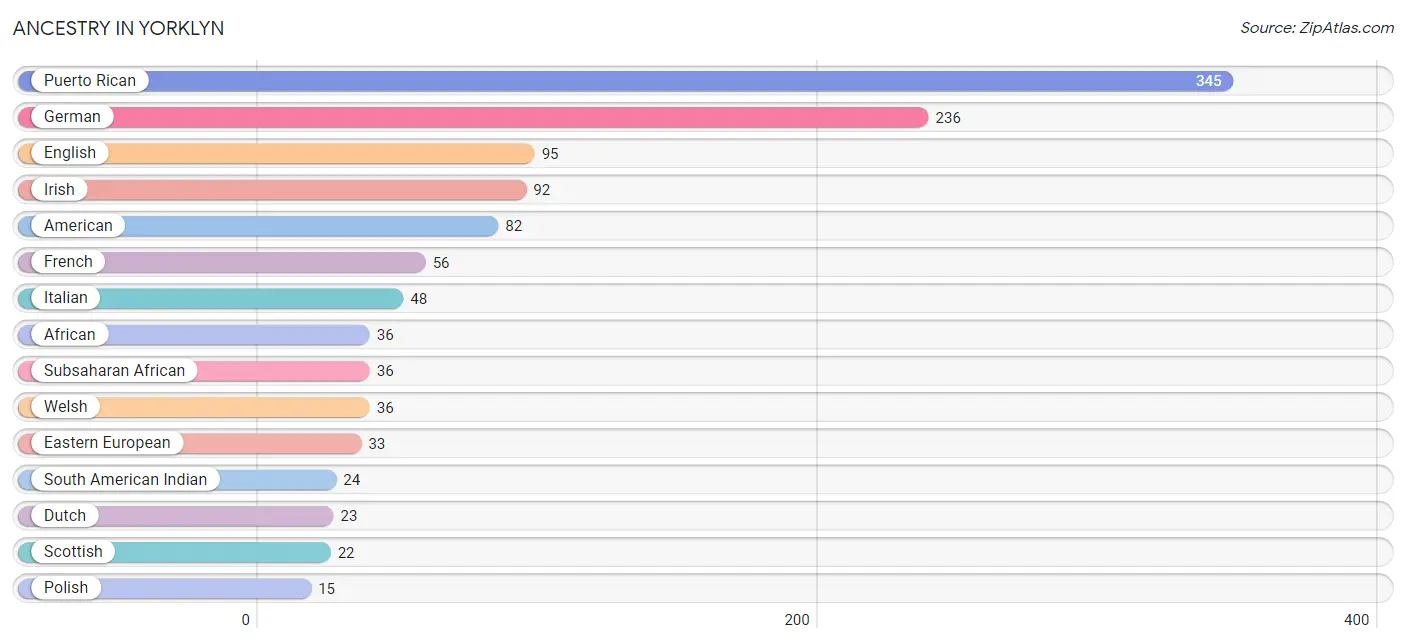
| Ancestry | # Population | % Population |
| African | 36 | 2.2% |
| American | 82 | 5.0% |
| Dutch | 23 | 1.4% |
| Eastern European | 33 | 2.0% |
| English | 95 | 5.8% |
| European | 11 | 0.7% |
| French | 56 | 3.4% |
| German | 236 | 14.4% |
| Irish | 92 | 5.6% |
| Italian | 48 | 2.9% |
| Polish | 15 | 0.9% |
| Puerto Rican | 345 | 21.1% |
| Scotch-Irish | 13 | 0.8% |
| Scottish | 22 | 1.3% |
| South American Indian | 24 | 1.5% |
| Subsaharan African | 36 | 2.2% |
| Swedish | 13 | 0.8% |
| Welsh | 36 | 2.2% | View All 18 Rows |
Immigrants in Yorklyn
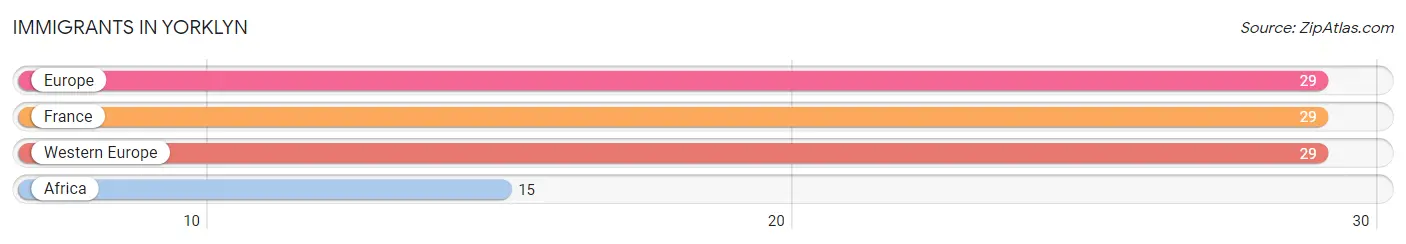
The most numerous immigrant groups reported in Yorklyn came from Europe (29 | 1.8%), France (29 | 1.8%), Western Europe (29 | 1.8%), and Africa (15 | 0.9%), together accounting for 6.2% of all Yorklyn residents.
| Immigration Origin | # Population | % Population |
| Africa | 15 | 0.9% |
| Europe | 29 | 1.8% |
| France | 29 | 1.8% |
| Western Europe | 29 | 1.8% | View All 4 Rows |
Sex and Age in Yorklyn
Sex and Age in Yorklyn
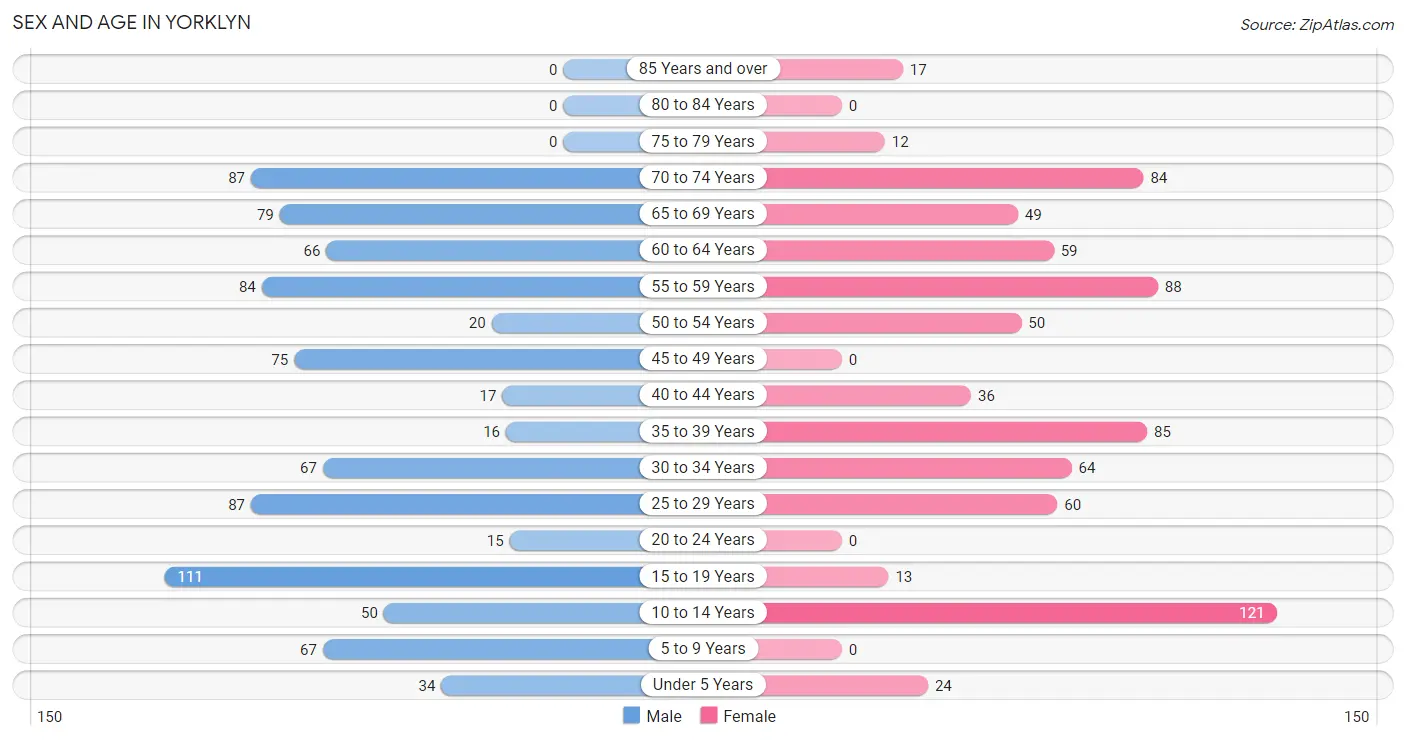
The most populous age groups in Yorklyn are 15 to 19 Years (111 | 12.7%) for men and 10 to 14 Years (121 | 15.9%) for women.
| Age Bracket | Male | Female |
| Under 5 Years | 34 (3.9%) | 24 (3.2%) |
| 5 to 9 Years | 67 (7.7%) | 0 (0.0%) |
| 10 to 14 Years | 50 (5.7%) | 121 (15.9%) |
| 15 to 19 Years | 111 (12.7%) | 13 (1.7%) |
| 20 to 24 Years | 15 (1.7%) | 0 (0.0%) |
| 25 to 29 Years | 87 (9.9%) | 60 (7.9%) |
| 30 to 34 Years | 67 (7.7%) | 64 (8.4%) |
| 35 to 39 Years | 16 (1.8%) | 85 (11.2%) |
| 40 to 44 Years | 17 (1.9%) | 36 (4.7%) |
| 45 to 49 Years | 75 (8.6%) | 0 (0.0%) |
| 50 to 54 Years | 20 (2.3%) | 50 (6.6%) |
| 55 to 59 Years | 84 (9.6%) | 88 (11.6%) |
| 60 to 64 Years | 66 (7.5%) | 59 (7.7%) |
| 65 to 69 Years | 79 (9.0%) | 49 (6.4%) |
| 70 to 74 Years | 87 (9.9%) | 84 (11.0%) |
| 75 to 79 Years | 0 (0.0%) | 12 (1.6%) |
| 80 to 84 Years | 0 (0.0%) | 0 (0.0%) |
| 85 Years and over | 0 (0.0%) | 17 (2.2%) |
| Total | 875 (100.0%) | 762 (100.0%) |
Families and Households in Yorklyn
Median Family Size in Yorklyn
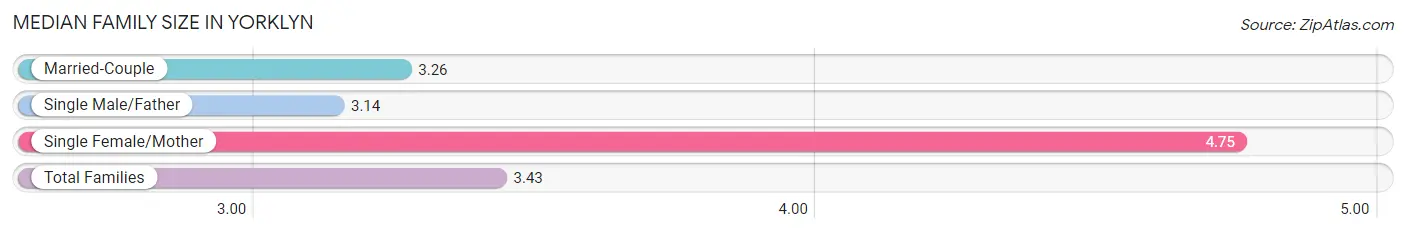
The median family size in Yorklyn is 3.43 persons per family, with single female/mother families (53 | 11.9%) accounting for the largest median family size of 4.75 persons per family. On the other hand, single male/father families (7 | 1.6%) represent the smallest median family size with 3.14 persons per family.
| Family Type | # Families | Family Size |
| Married-Couple | 384 (86.5%) | 3.26 |
| Single Male/Father | 7 (1.6%) | 3.14 |
| Single Female/Mother | 53 (11.9%) | 4.75 |
| Total Families | 444 (100.0%) | 3.43 |
Median Household Size in Yorklyn
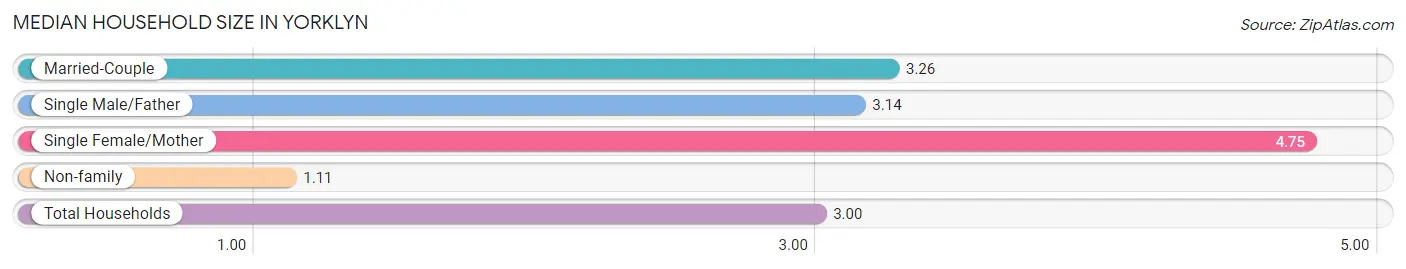
The median household size in Yorklyn is 3.00 persons per household, with single female/mother households (53 | 9.7%) accounting for the largest median household size of 4.75 persons per household. non-family households (102 | 18.7%) represent the smallest median household size with 1.11 persons per household.
| Household Type | # Households | Household Size |
| Married-Couple | 384 (70.3%) | 3.26 |
| Single Male/Father | 7 (1.3%) | 3.14 |
| Single Female/Mother | 53 (9.7%) | 4.75 |
| Non-family | 102 (18.7%) | 1.11 |
| Total Households | 546 (100.0%) | 3.00 |
Household Size by Marriage Status in Yorklyn
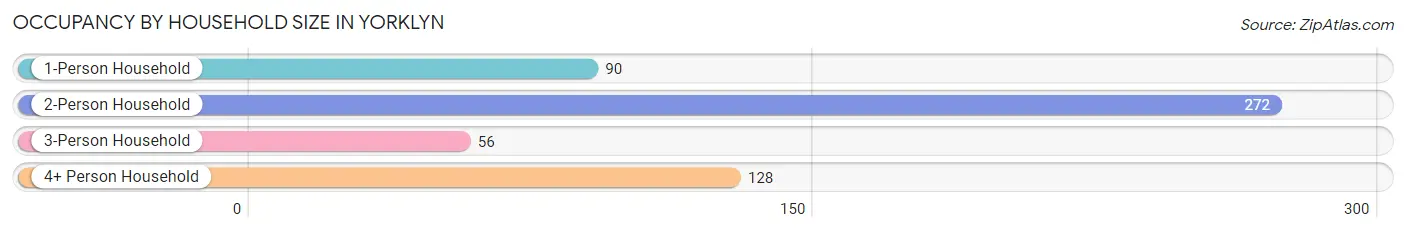
Out of a total of 546 households in Yorklyn, 444 (81.3%) are family households, while 102 (18.7%) are nonfamily households. The most numerous type of family households are 2-person households, comprising 260, and the most common type of nonfamily households are 1-person households, comprising 90.
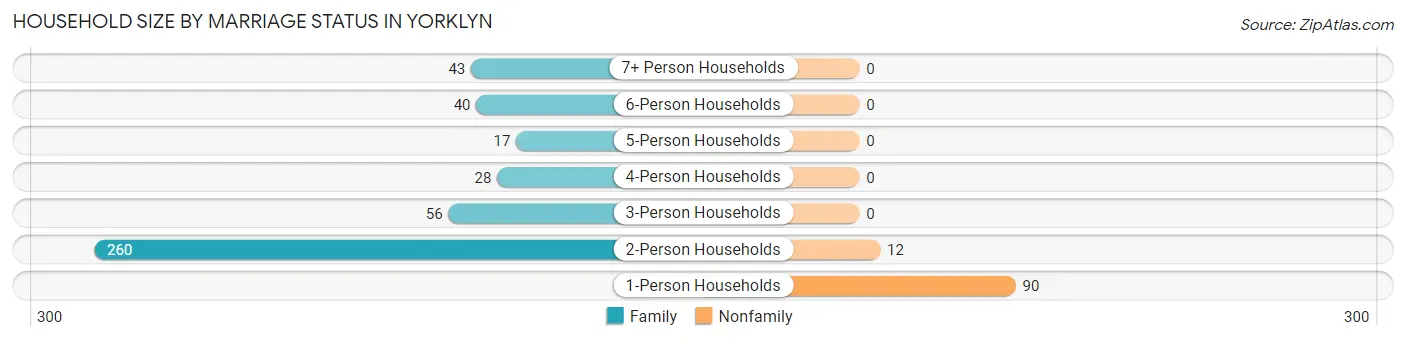
| Household Size | Family Households | Nonfamily Households |
| 1-Person Households | - | 90 (16.5%) |
| 2-Person Households | 260 (47.6%) | 12 (2.2%) |
| 3-Person Households | 56 (10.3%) | 0 (0.0%) |
| 4-Person Households | 28 (5.1%) | 0 (0.0%) |
| 5-Person Households | 17 (3.1%) | 0 (0.0%) |
| 6-Person Households | 40 (7.3%) | 0 (0.0%) |
| 7+ Person Households | 43 (7.9%) | 0 (0.0%) |
| Total | 444 (81.3%) | 102 (18.7%) |
Female Fertility in Yorklyn
Fertility by Age in Yorklyn
| Age Bracket | Women with Births | Births / 1,000 Women |
| 15 to 19 years | 0 (0.0%) | 0.0 |
| 20 to 34 years | 0 (0.0%) | 0.0 |
| 35 to 50 years | 0 (0.0%) | 0.0 |
| Total | 0 (0.0%) | 0.0 |
Fertility by Age by Marriage Status in Yorklyn
| Age Bracket | Married | Unmarried |
| 15 to 19 years | 0 (0.0%) | 0 (0.0%) |
| 20 to 34 years | 0 (0.0%) | 0 (0.0%) |
| 35 to 50 years | 0 (0.0%) | 0 (0.0%) |
| Total | 0 (0.0%) | 0 (0.0%) |
Fertility by Education in Yorklyn
| Educational Attainment | Women with Births | Births / 1,000 Women |
| Less than High School | 0 (0.0%) | 0.0 |
| High School Diploma | 0 (0.0%) | 0.0 |
| College or Associate's Degree | 0 (0.0%) | 0.0 |
| Bachelor's Degree | 0 (0.0%) | 0.0 |
| Graduate Degree | 0 (0.0%) | 0.0 |
| Total | 0 (0.0%) | 0.0 |
Fertility by Education by Marriage Status in Yorklyn
| Educational Attainment | Married | Unmarried |
| Less than High School | 0 (0.0%) | 0 (0.0%) |
| High School Diploma | 0 (0.0%) | 0 (0.0%) |
| College or Associate's Degree | 0 (0.0%) | 0 (0.0%) |
| Bachelor's Degree | 0 (0.0%) | 0 (0.0%) |
| Graduate Degree | 0 (0.0%) | 0 (0.0%) |
| Total | 0 (0.0%) | 0 (0.0%) |
Employment Characteristics in Yorklyn
Employment by Class of Employer in Yorklyn
Among the 875 employed individuals in Yorklyn, private company employees (735 | 84.0%), not-for-profit organizations (79 | 9.0%), and self-employed (incorporated) (42 | 4.8%) make up the most common classes of employment.
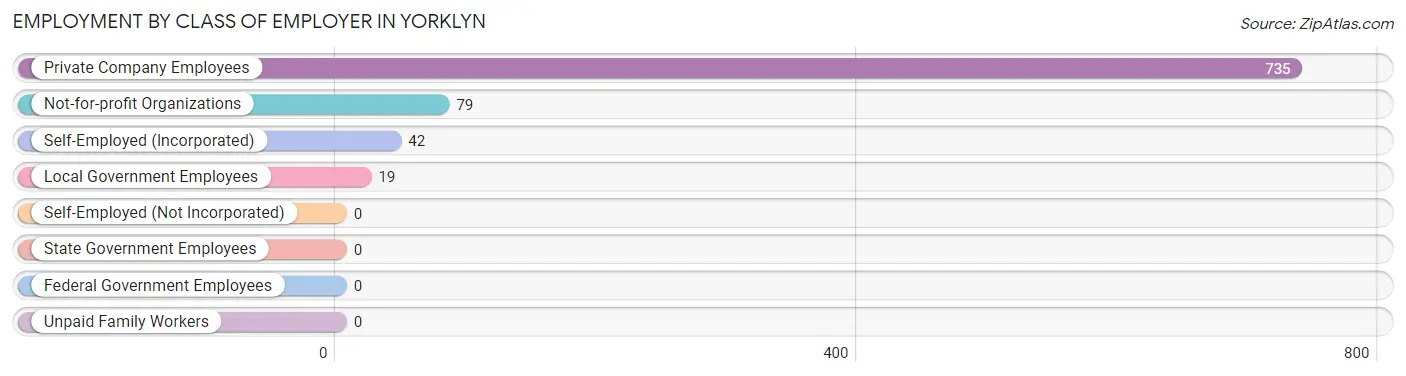
| Employer Class | # Employees | % Employees |
| Private Company Employees | 735 | 84.0% |
| Self-Employed (Incorporated) | 42 | 4.8% |
| Self-Employed (Not Incorporated) | 0 | 0.0% |
| Not-for-profit Organizations | 79 | 9.0% |
| Local Government Employees | 19 | 2.2% |
| State Government Employees | 0 | 0.0% |
| Federal Government Employees | 0 | 0.0% |
| Unpaid Family Workers | 0 | 0.0% |
| Total | 875 | 100.0% |
Employment Status by Age in Yorklyn
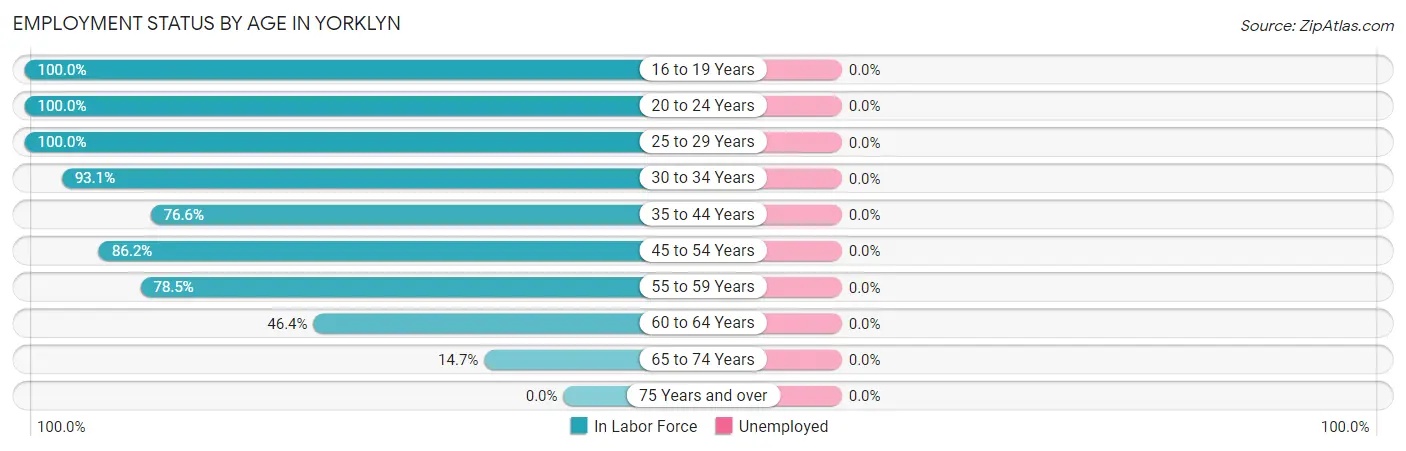
| Age Bracket | In Labor Force | Unemployed |
| 16 to 19 Years | 111 (100.0%) | 0 (0.0%) |
| 20 to 24 Years | 15 (100.0%) | 0 (0.0%) |
| 25 to 29 Years | 147 (100.0%) | 0 (0.0%) |
| 30 to 34 Years | 122 (93.1%) | 0 (0.0%) |
| 35 to 44 Years | 118 (76.6%) | 0 (0.0%) |
| 45 to 54 Years | 125 (86.2%) | 0 (0.0%) |
| 55 to 59 Years | 135 (78.5%) | 0 (0.0%) |
| 60 to 64 Years | 58 (46.4%) | 0 (0.0%) |
| 65 to 74 Years | 44 (14.7%) | 0 (0.0%) |
| 75 Years and over | 0 (0.0%) | 0 (0.0%) |
| Total | 875 (65.9%) | 0 (0.0%) |
Employment Status by Educational Attainment in Yorklyn
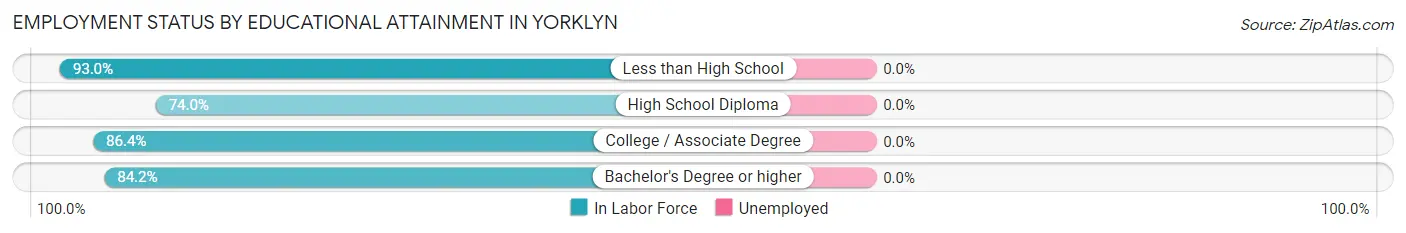
| Educational Attainment | In Labor Force | Unemployed |
| Less than High School | 106 (93.0%) | 0 (0.0%) |
| High School Diploma | 330 (74.0%) | 0 (0.0%) |
| College / Associate Degree | 184 (86.4%) | 0 (0.0%) |
| Bachelor's Degree or higher | 85 (84.2%) | 0 (0.0%) |
| Total | 705 (80.7%) | 0 (0.0%) |
Employment Occupations by Sex in Yorklyn
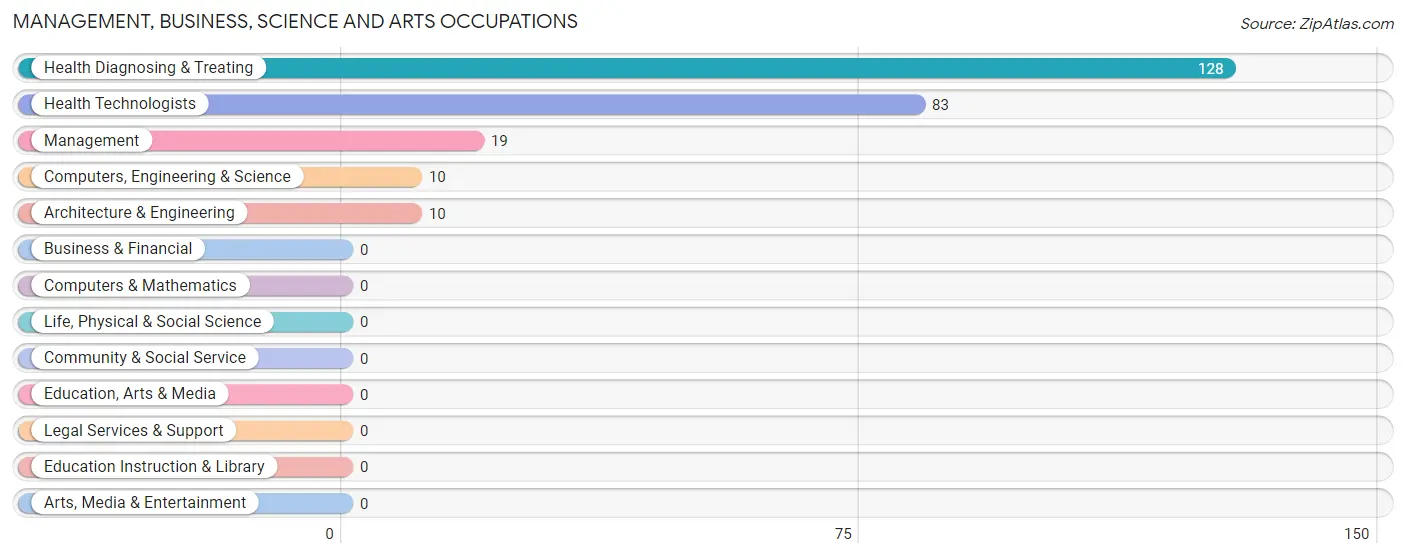
Management, Business, Science and Arts Occupations
The most common Management, Business, Science and Arts occupations in Yorklyn are Health Diagnosing & Treating (128 | 14.6%), Health Technologists (83 | 9.5%), Management (19 | 2.2%), Computers, Engineering & Science (10 | 1.1%), and Architecture & Engineering (10 | 1.1%).
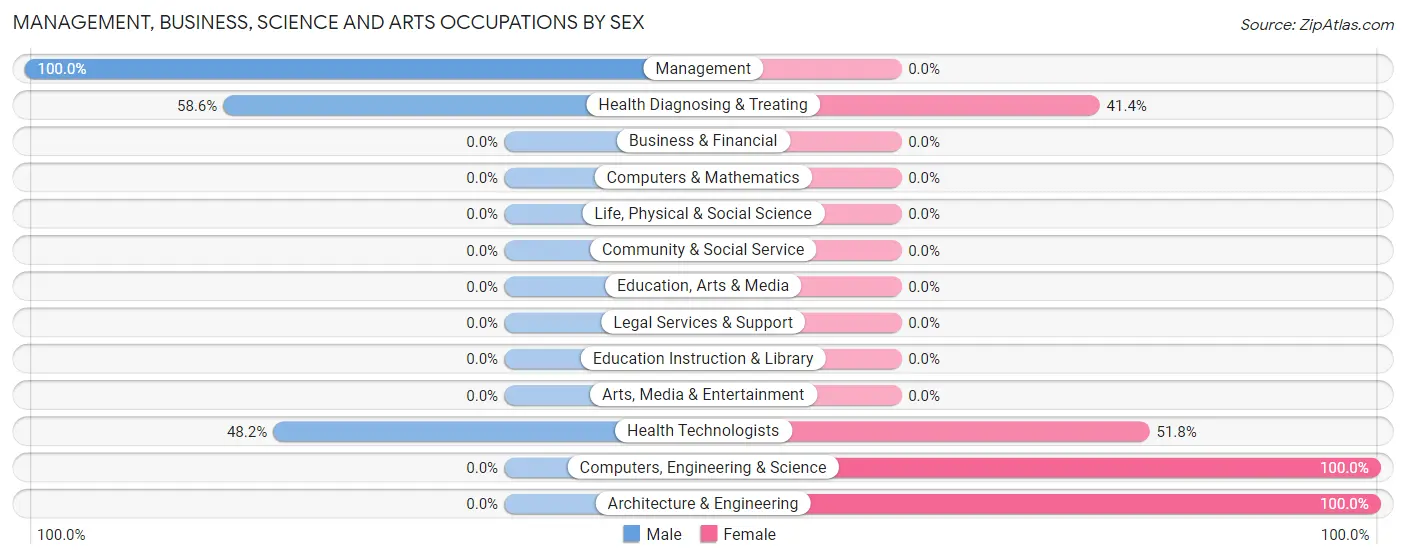
Management, Business, Science and Arts Occupations by Sex
Within the Management, Business, Science and Arts occupations in Yorklyn, the most male-oriented occupations are Management (100.0%), Health Diagnosing & Treating (58.6%), and Health Technologists (48.2%), while the most female-oriented occupations are Computers, Engineering & Science (100.0%), Architecture & Engineering (100.0%), and Health Technologists (51.8%).
| Occupation | Male | Female |
| Management | 19 (100.0%) | 0 (0.0%) |
| Business & Financial | 0 (0.0%) | 0 (0.0%) |
| Computers, Engineering & Science | 0 (0.0%) | 10 (100.0%) |
| Computers & Mathematics | 0 (0.0%) | 0 (0.0%) |
| Architecture & Engineering | 0 (0.0%) | 10 (100.0%) |
| Life, Physical & Social Science | 0 (0.0%) | 0 (0.0%) |
| Community & Social Service | 0 (0.0%) | 0 (0.0%) |
| Education, Arts & Media | 0 (0.0%) | 0 (0.0%) |
| Legal Services & Support | 0 (0.0%) | 0 (0.0%) |
| Education Instruction & Library | 0 (0.0%) | 0 (0.0%) |
| Arts, Media & Entertainment | 0 (0.0%) | 0 (0.0%) |
| Health Diagnosing & Treating | 75 (58.6%) | 53 (41.4%) |
| Health Technologists | 40 (48.2%) | 43 (51.8%) |
| Total (Category) | 94 (59.9%) | 63 (40.1%) |
| Total (Overall) | 548 (62.6%) | 327 (37.4%) |
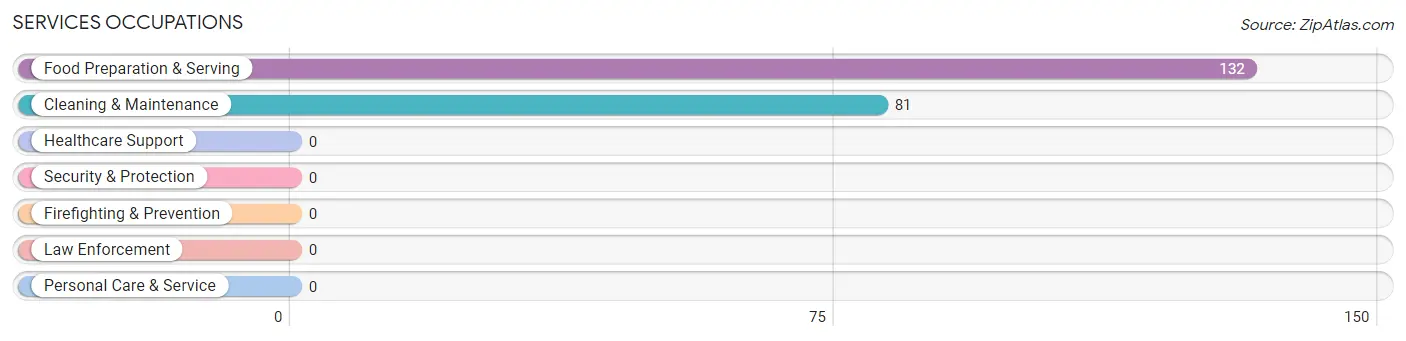
Services Occupations
The most common Services occupations in Yorklyn are Food Preparation & Serving (132 | 15.1%), and Cleaning & Maintenance (81 | 9.3%).
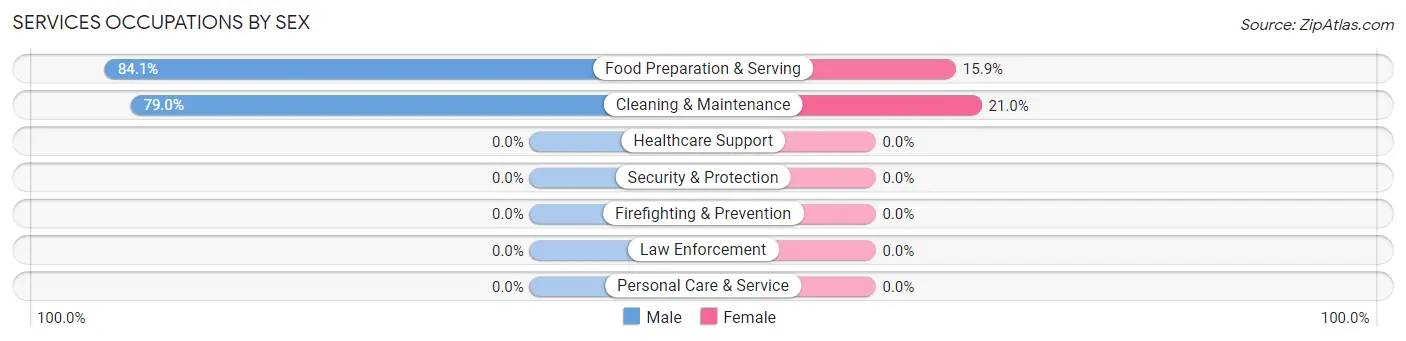
Services Occupations by Sex
Within the Services occupations in Yorklyn, the most male-oriented occupations are Food Preparation & Serving (84.1%), and Cleaning & Maintenance (79.0%), while the most female-oriented occupations are Cleaning & Maintenance (21.0%), and Food Preparation & Serving (15.9%).
| Occupation | Male | Female |
| Healthcare Support | 0 (0.0%) | 0 (0.0%) |
| Security & Protection | 0 (0.0%) | 0 (0.0%) |
| Firefighting & Prevention | 0 (0.0%) | 0 (0.0%) |
| Law Enforcement | 0 (0.0%) | 0 (0.0%) |
| Food Preparation & Serving | 111 (84.1%) | 21 (15.9%) |
| Cleaning & Maintenance | 64 (79.0%) | 17 (21.0%) |
| Personal Care & Service | 0 (0.0%) | 0 (0.0%) |
| Total (Category) | 175 (82.2%) | 38 (17.8%) |
| Total (Overall) | 548 (62.6%) | 327 (37.4%) |
Sales and Office Occupations
The most common Sales and Office occupations in Yorklyn are Office & Administration (111 | 12.7%), and Sales & Related (45 | 5.1%).
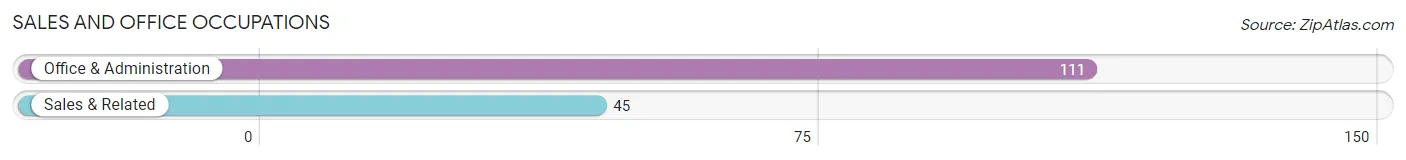
Sales and Office Occupations by Sex
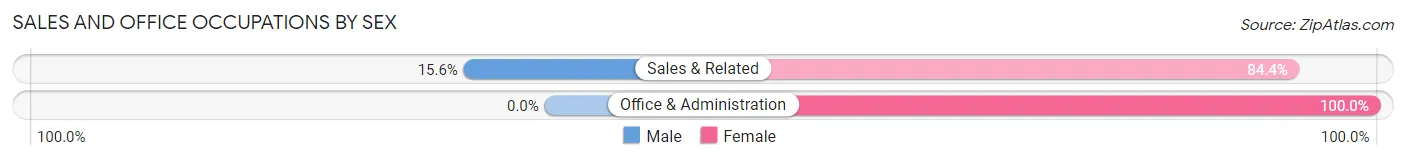
| Occupation | Male | Female |
| Sales & Related | 7 (15.6%) | 38 (84.4%) |
| Office & Administration | 0 (0.0%) | 111 (100.0%) |
| Total (Category) | 7 (4.5%) | 149 (95.5%) |
| Total (Overall) | 548 (62.6%) | 327 (37.4%) |
Natural Resources, Construction and Maintenance Occupations
The most common Natural Resources, Construction and Maintenance occupations in Yorklyn are , and Installation, Maintenance & Repair (55 | 6.3%).
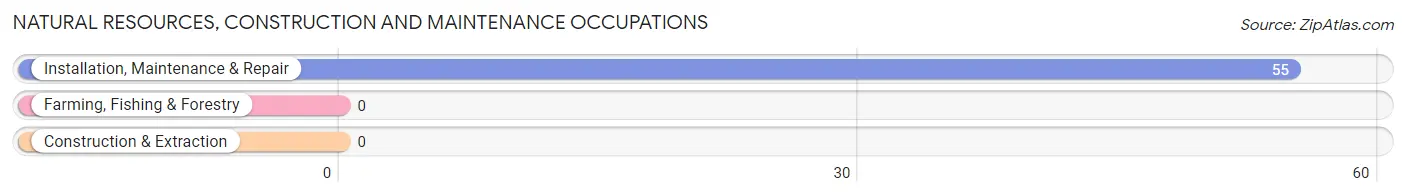
Natural Resources, Construction and Maintenance Occupations by Sex
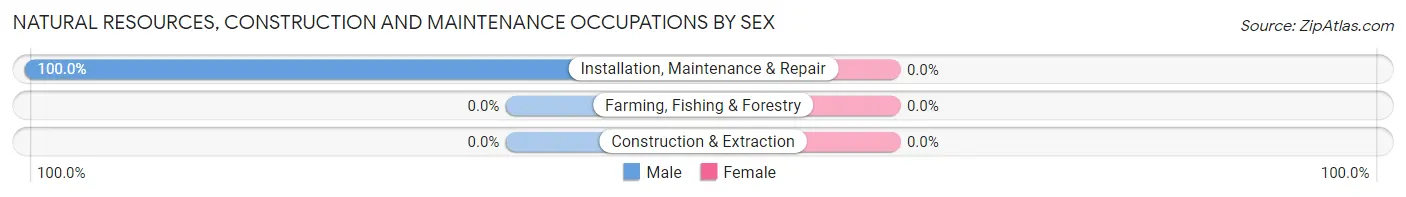
| Occupation | Male | Female |
| Farming, Fishing & Forestry | 0 (0.0%) | 0 (0.0%) |
| Construction & Extraction | 0 (0.0%) | 0 (0.0%) |
| Installation, Maintenance & Repair | 55 (100.0%) | 0 (0.0%) |
| Total (Category) | 55 (100.0%) | 0 (0.0%) |
| Total (Overall) | 548 (62.6%) | 327 (37.4%) |
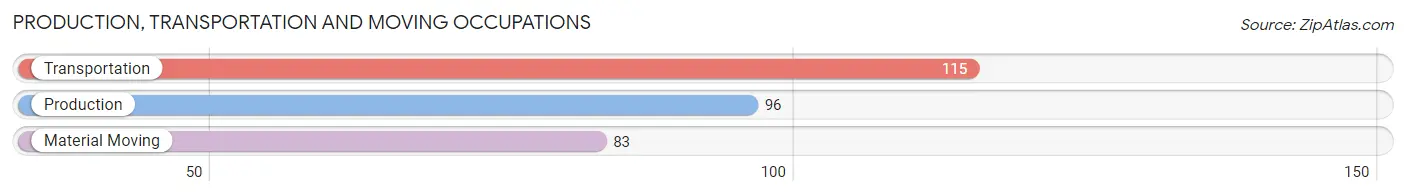
Production, Transportation and Moving Occupations
The most common Production, Transportation and Moving occupations in Yorklyn are Transportation (115 | 13.1%), Production (96 | 11.0%), and Material Moving (83 | 9.5%).
Production, Transportation and Moving Occupations by Sex
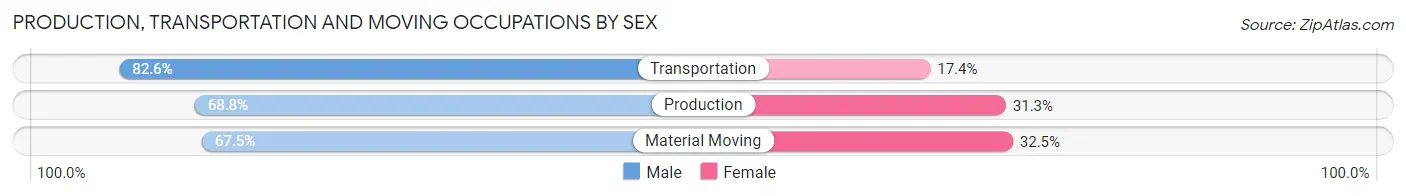
| Occupation | Male | Female |
| Production | 66 (68.8%) | 30 (31.2%) |
| Transportation | 95 (82.6%) | 20 (17.4%) |
| Material Moving | 56 (67.5%) | 27 (32.5%) |
| Total (Category) | 217 (73.8%) | 77 (26.2%) |
| Total (Overall) | 548 (62.6%) | 327 (37.4%) |
Employment Industries by Sex in Yorklyn
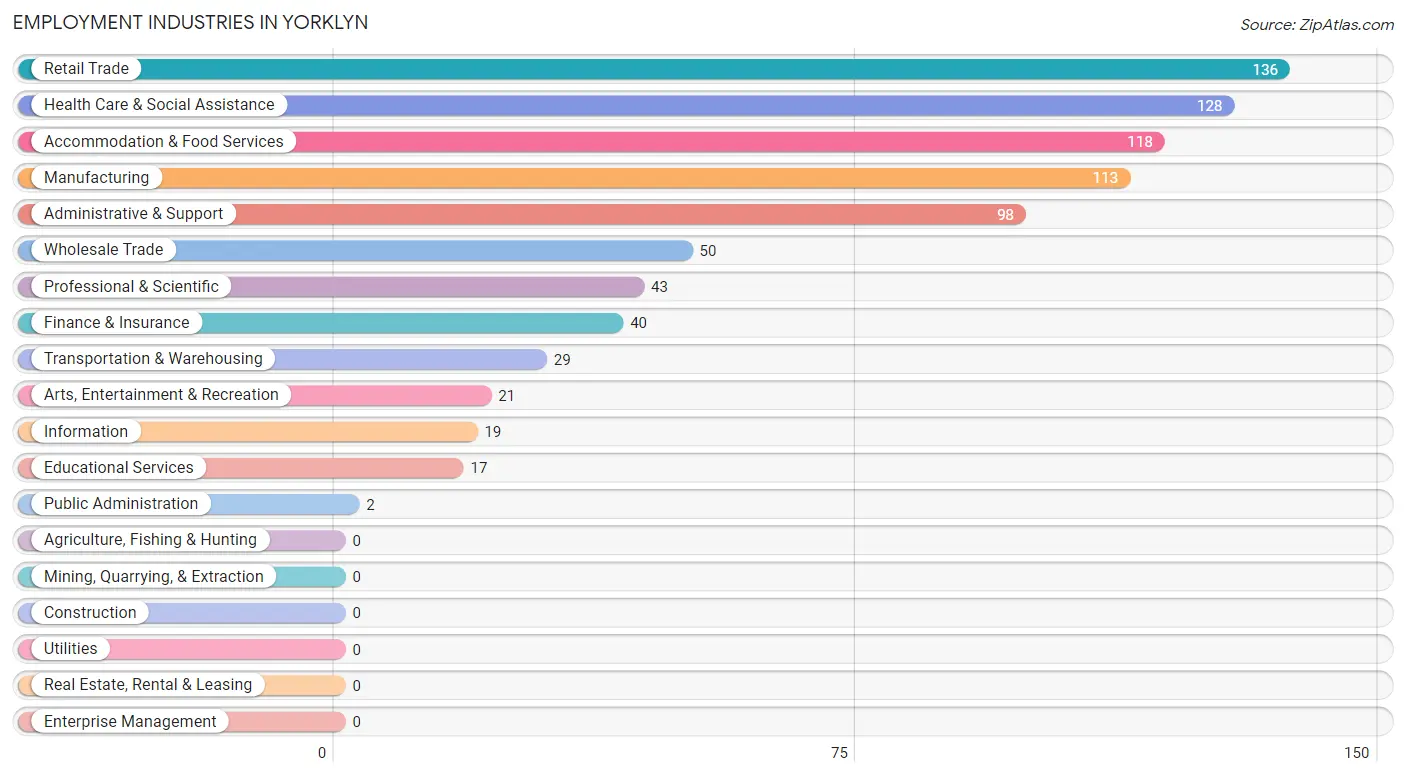
Employment Industries in Yorklyn
The major employment industries in Yorklyn include Retail Trade (136 | 15.5%), Health Care & Social Assistance (128 | 14.6%), Accommodation & Food Services (118 | 13.5%), Manufacturing (113 | 12.9%), and Administrative & Support (98 | 11.2%).
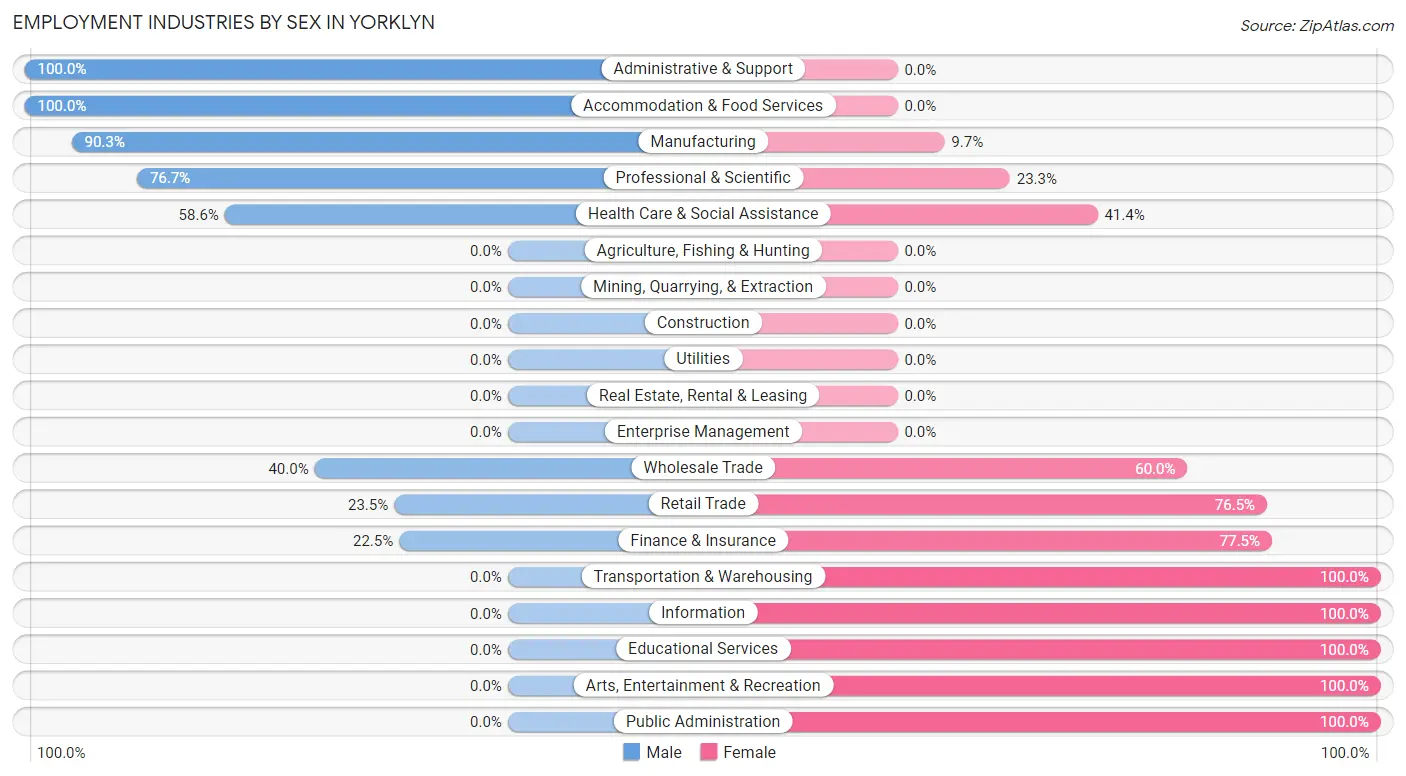
Employment Industries by Sex in Yorklyn
The Yorklyn industries that see more men than women are Administrative & Support (100.0%), Accommodation & Food Services (100.0%), and Manufacturing (90.3%), whereas the industries that tend to have a higher number of women are Transportation & Warehousing (100.0%), Information (100.0%), and Educational Services (100.0%).
| Industry | Male | Female |
| Agriculture, Fishing & Hunting | 0 (0.0%) | 0 (0.0%) |
| Mining, Quarrying, & Extraction | 0 (0.0%) | 0 (0.0%) |
| Construction | 0 (0.0%) | 0 (0.0%) |
| Manufacturing | 102 (90.3%) | 11 (9.7%) |
| Wholesale Trade | 20 (40.0%) | 30 (60.0%) |
| Retail Trade | 32 (23.5%) | 104 (76.5%) |
| Transportation & Warehousing | 0 (0.0%) | 29 (100.0%) |
| Utilities | 0 (0.0%) | 0 (0.0%) |
| Information | 0 (0.0%) | 19 (100.0%) |
| Finance & Insurance | 9 (22.5%) | 31 (77.5%) |
| Real Estate, Rental & Leasing | 0 (0.0%) | 0 (0.0%) |
| Professional & Scientific | 33 (76.7%) | 10 (23.3%) |
| Enterprise Management | 0 (0.0%) | 0 (0.0%) |
| Administrative & Support | 98 (100.0%) | 0 (0.0%) |
| Educational Services | 0 (0.0%) | 17 (100.0%) |
| Health Care & Social Assistance | 75 (58.6%) | 53 (41.4%) |
| Arts, Entertainment & Recreation | 0 (0.0%) | 21 (100.0%) |
| Accommodation & Food Services | 118 (100.0%) | 0 (0.0%) |
| Public Administration | 0 (0.0%) | 2 (100.0%) |
| Total | 548 (62.6%) | 327 (37.4%) |
Education in Yorklyn
School Enrollment in Yorklyn
The most common levels of schooling among the 305 students in Yorklyn are middle school (146 | 47.9%), high school (92 | 30.2%), and elementary school (67 | 22.0%).
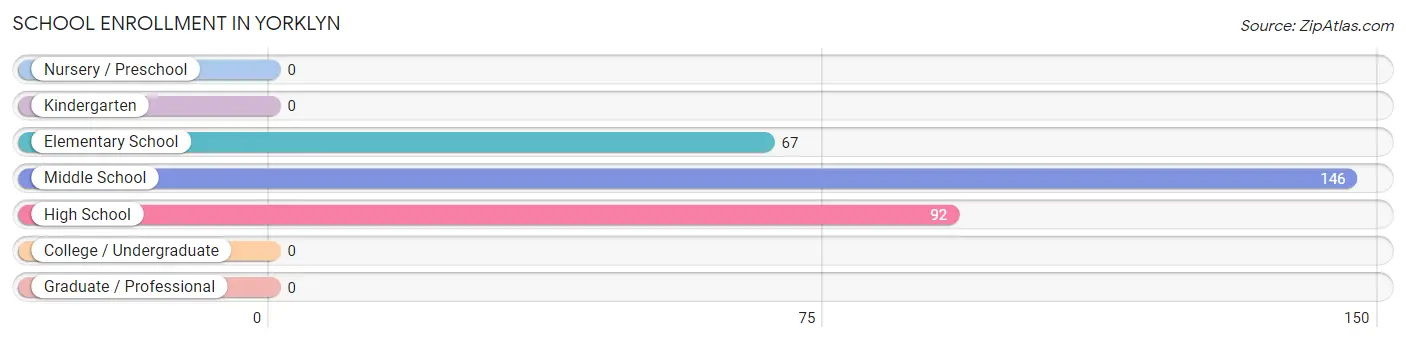
| School Level | # Students | % Students |
| Nursery / Preschool | 0 | 0.0% |
| Kindergarten | 0 | 0.0% |
| Elementary School | 67 | 22.0% |
| Middle School | 146 | 47.9% |
| High School | 92 | 30.2% |
| College / Undergraduate | 0 | 0.0% |
| Graduate / Professional | 0 | 0.0% |
| Total | 305 | 100.0% |
School Enrollment by Age by Funding Source in Yorklyn
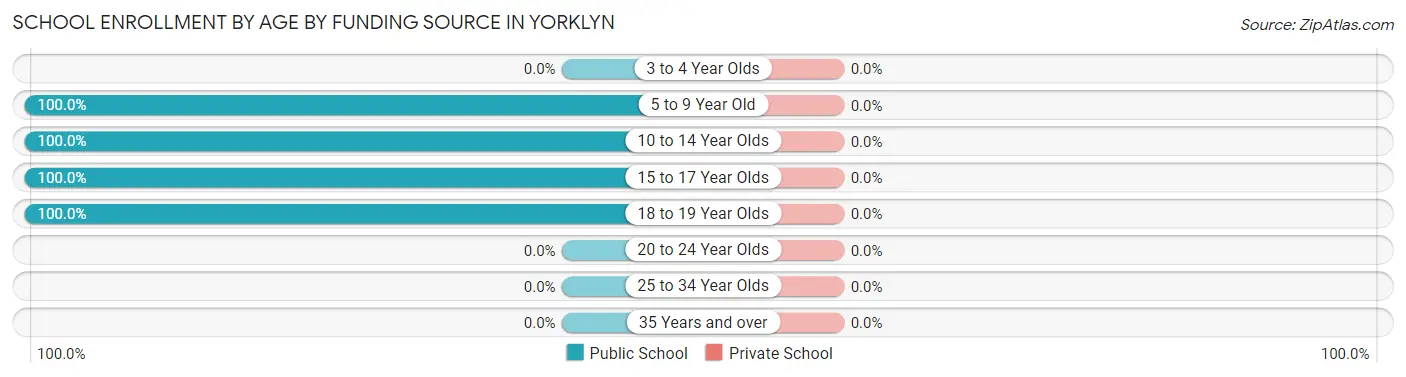
| Age Bracket | Public School | Private School |
| 3 to 4 Year Olds | 0 (0.0%) | 0 (0.0%) |
| 5 to 9 Year Old | 67 (100.0%) | 0 (0.0%) |
| 10 to 14 Year Olds | 171 (100.0%) | 0 (0.0%) |
| 15 to 17 Year Olds | 21 (100.0%) | 0 (0.0%) |
| 18 to 19 Year Olds | 46 (100.0%) | 0 (0.0%) |
| 20 to 24 Year Olds | 0 (0.0%) | 0 (0.0%) |
| 25 to 34 Year Olds | 0 (0.0%) | 0 (0.0%) |
| 35 Years and over | 0 (0.0%) | 0 (0.0%) |
| Total | 305 (100.0%) | 0 (0.0%) |
Educational Attainment by Field of Study in Yorklyn
Science & technology (59 | 29.6%), education (36 | 18.1%), psychology (19 | 9.6%), business (19 | 9.6%), and bio, nature & agricultural (15 | 7.5%) are the most common fields of study among 199 individuals in Yorklyn who have obtained a bachelor's degree or higher.
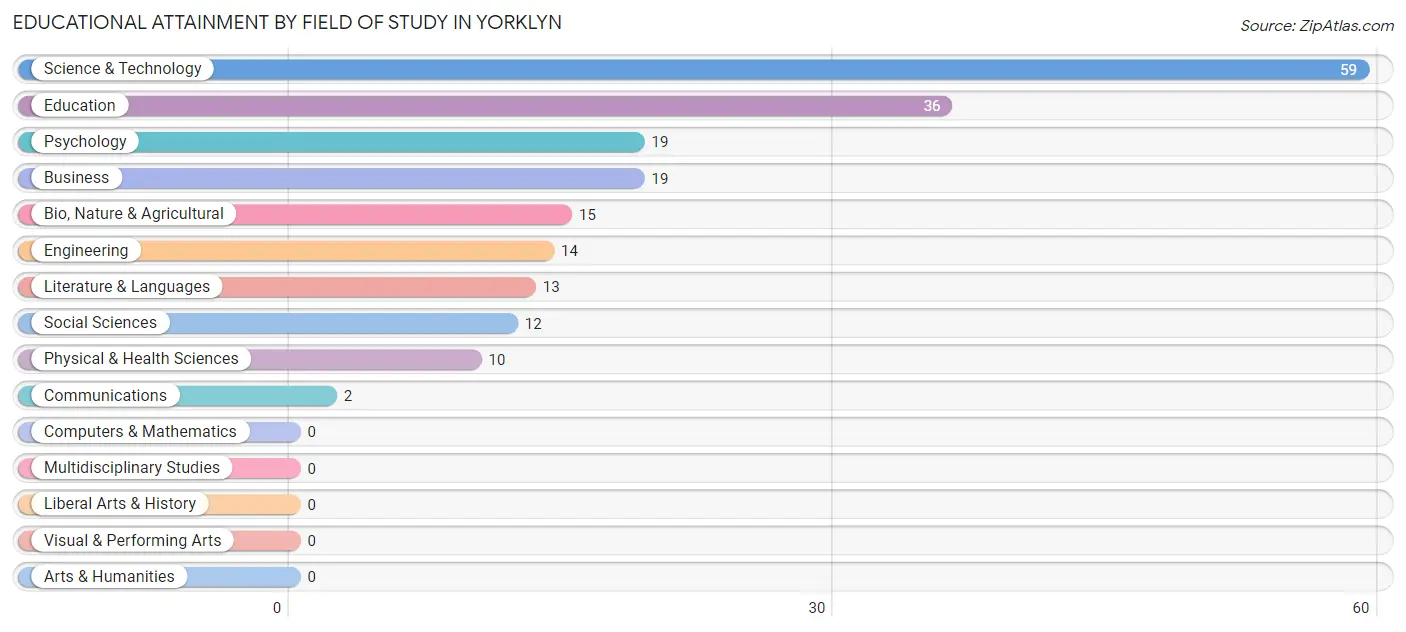
| Field of Study | # Graduates | % Graduates |
| Computers & Mathematics | 0 | 0.0% |
| Bio, Nature & Agricultural | 15 | 7.5% |
| Physical & Health Sciences | 10 | 5.0% |
| Psychology | 19 | 9.6% |
| Social Sciences | 12 | 6.0% |
| Engineering | 14 | 7.0% |
| Multidisciplinary Studies | 0 | 0.0% |
| Science & Technology | 59 | 29.6% |
| Business | 19 | 9.6% |
| Education | 36 | 18.1% |
| Literature & Languages | 13 | 6.5% |
| Liberal Arts & History | 0 | 0.0% |
| Visual & Performing Arts | 0 | 0.0% |
| Communications | 2 | 1.0% |
| Arts & Humanities | 0 | 0.0% |
| Total | 199 | 100.0% |
Transportation & Commute in Yorklyn
Vehicle Availability by Sex in Yorklyn
The most prevalent vehicle ownership categories in Yorklyn are males with 2 vehicles (146, accounting for 26.6%) and females with 2 vehicles (129, making up 44.7%).
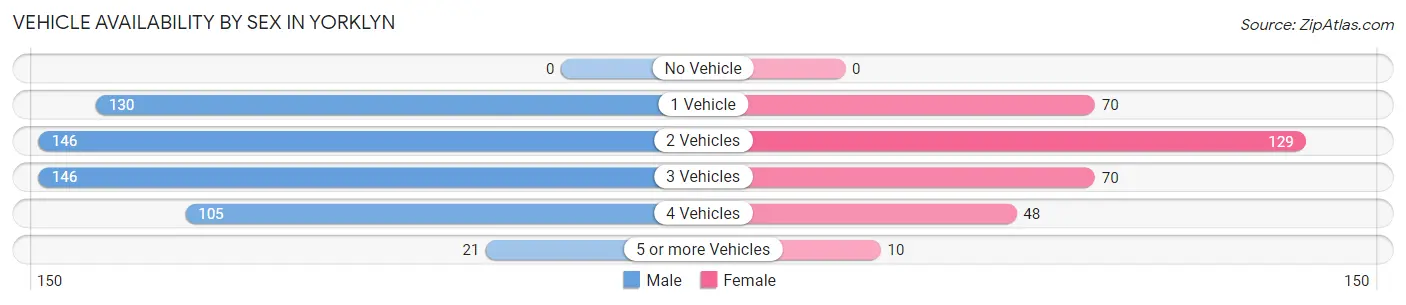
| Vehicles Available | Male | Female |
| No Vehicle | 0 (0.0%) | 0 (0.0%) |
| 1 Vehicle | 130 (23.7%) | 70 (21.4%) |
| 2 Vehicles | 146 (26.6%) | 129 (39.5%) |
| 3 Vehicles | 146 (26.6%) | 70 (21.4%) |
| 4 Vehicles | 105 (19.2%) | 48 (14.7%) |
| 5 or more Vehicles | 21 (3.8%) | 10 (3.1%) |
| Total | 548 (100.0%) | 327 (100.0%) |
Commute Time in Yorklyn
The most frequently occuring commute durations in Yorklyn are 10 to 14 minutes (167 commuters, 20.7%), 15 to 19 minutes (122 commuters, 15.1%), and 20 to 24 minutes (116 commuters, 14.4%).
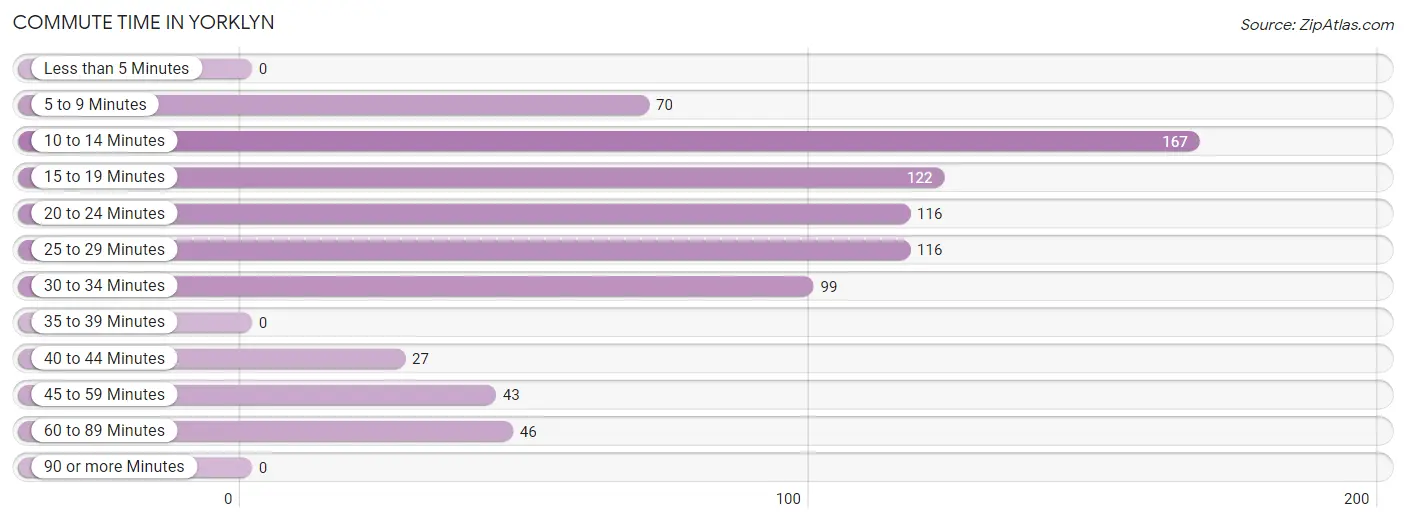
| Commute Time | # Commuters | % Commuters |
| Less than 5 Minutes | 0 | 0.0% |
| 5 to 9 Minutes | 70 | 8.7% |
| 10 to 14 Minutes | 167 | 20.7% |
| 15 to 19 Minutes | 122 | 15.1% |
| 20 to 24 Minutes | 116 | 14.4% |
| 25 to 29 Minutes | 116 | 14.4% |
| 30 to 34 Minutes | 99 | 12.3% |
| 35 to 39 Minutes | 0 | 0.0% |
| 40 to 44 Minutes | 27 | 3.4% |
| 45 to 59 Minutes | 43 | 5.3% |
| 60 to 89 Minutes | 46 | 5.7% |
| 90 or more Minutes | 0 | 0.0% |
Commute Time by Sex in Yorklyn
The most common commute times in Yorklyn are 10 to 14 minutes (128 commuters, 23.4%) for males and 15 to 19 minutes (67 commuters, 26.0%) for females.
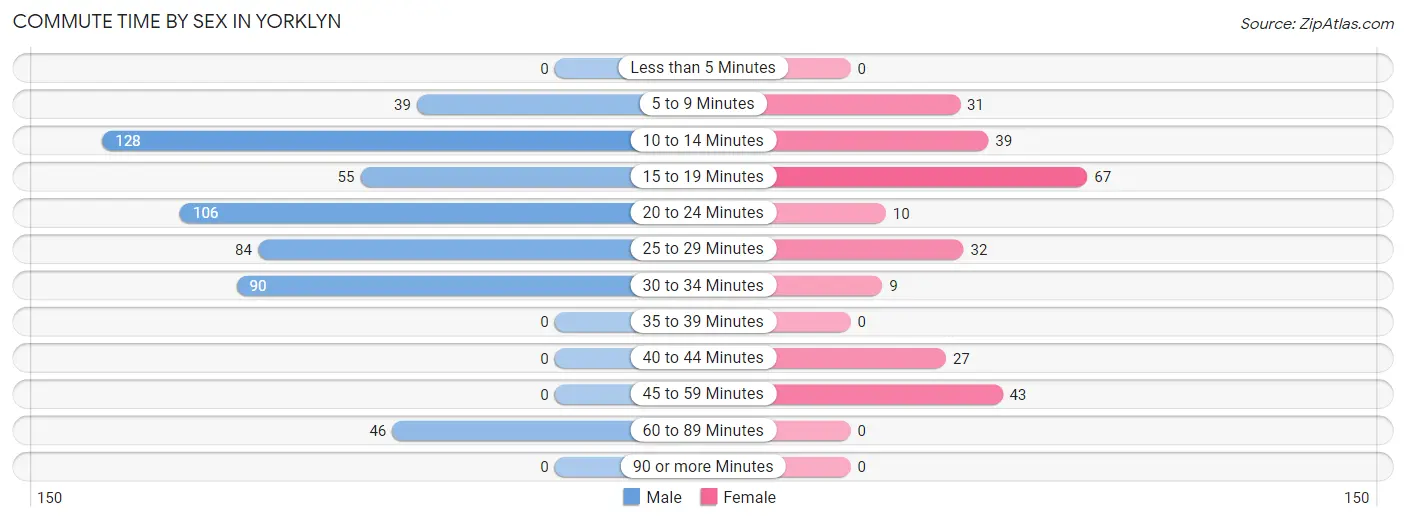
| Commute Time | Male | Female |
| Less than 5 Minutes | 0 (0.0%) | 0 (0.0%) |
| 5 to 9 Minutes | 39 (7.1%) | 31 (12.0%) |
| 10 to 14 Minutes | 128 (23.4%) | 39 (15.1%) |
| 15 to 19 Minutes | 55 (10.0%) | 67 (26.0%) |
| 20 to 24 Minutes | 106 (19.3%) | 10 (3.9%) |
| 25 to 29 Minutes | 84 (15.3%) | 32 (12.4%) |
| 30 to 34 Minutes | 90 (16.4%) | 9 (3.5%) |
| 35 to 39 Minutes | 0 (0.0%) | 0 (0.0%) |
| 40 to 44 Minutes | 0 (0.0%) | 27 (10.5%) |
| 45 to 59 Minutes | 0 (0.0%) | 43 (16.7%) |
| 60 to 89 Minutes | 46 (8.4%) | 0 (0.0%) |
| 90 or more Minutes | 0 (0.0%) | 0 (0.0%) |
Time of Departure to Work by Sex in Yorklyn
The most frequent times of departure to work in Yorklyn are 12:00 AM to 4:59 AM (126, 23.0%) for males and 6:30 AM to 6:59 AM (92, 35.7%) for females.
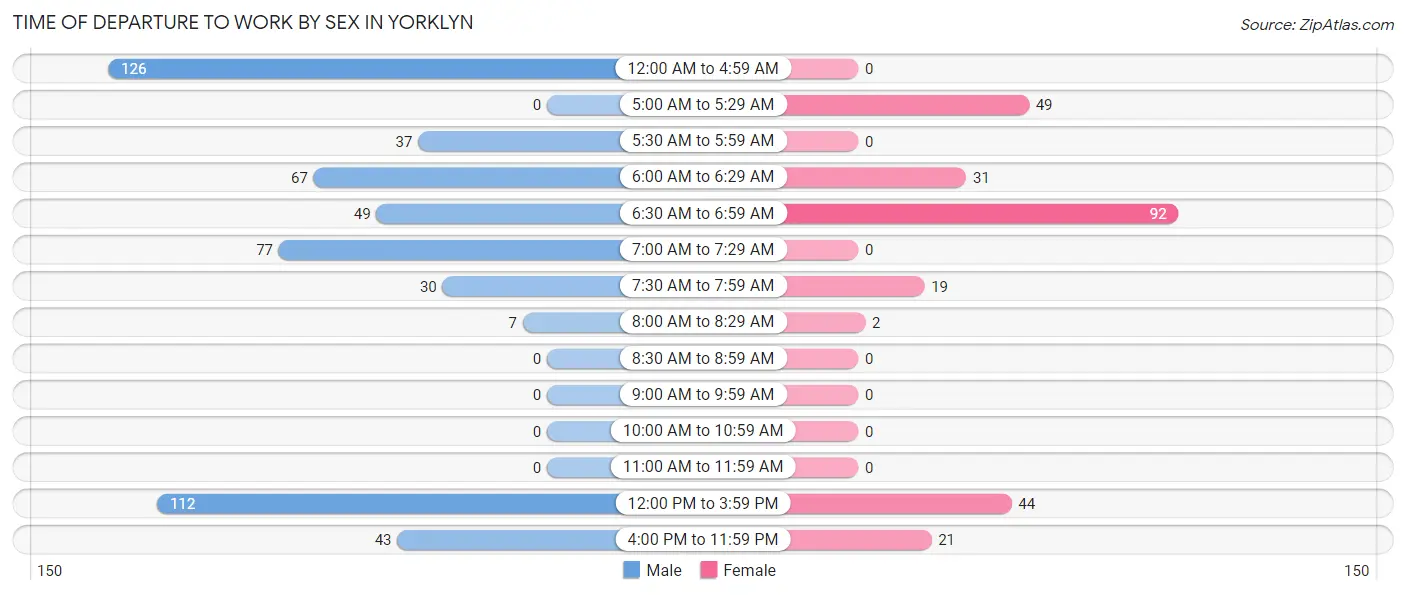
| Time of Departure | Male | Female |
| 12:00 AM to 4:59 AM | 126 (23.0%) | 0 (0.0%) |
| 5:00 AM to 5:29 AM | 0 (0.0%) | 49 (19.0%) |
| 5:30 AM to 5:59 AM | 37 (6.8%) | 0 (0.0%) |
| 6:00 AM to 6:29 AM | 67 (12.2%) | 31 (12.0%) |
| 6:30 AM to 6:59 AM | 49 (8.9%) | 92 (35.7%) |
| 7:00 AM to 7:29 AM | 77 (14.1%) | 0 (0.0%) |
| 7:30 AM to 7:59 AM | 30 (5.5%) | 19 (7.4%) |
| 8:00 AM to 8:29 AM | 7 (1.3%) | 2 (0.8%) |
| 8:30 AM to 8:59 AM | 0 (0.0%) | 0 (0.0%) |
| 9:00 AM to 9:59 AM | 0 (0.0%) | 0 (0.0%) |
| 10:00 AM to 10:59 AM | 0 (0.0%) | 0 (0.0%) |
| 11:00 AM to 11:59 AM | 0 (0.0%) | 0 (0.0%) |
| 12:00 PM to 3:59 PM | 112 (20.4%) | 44 (17.1%) |
| 4:00 PM to 11:59 PM | 43 (7.9%) | 21 (8.1%) |
| Total | 548 (100.0%) | 258 (100.0%) |
Housing Occupancy in Yorklyn
Occupancy by Ownership in Yorklyn
Of the total 546 dwellings in Yorklyn, owner-occupied units account for 380 (69.6%), while renter-occupied units make up 166 (30.4%).
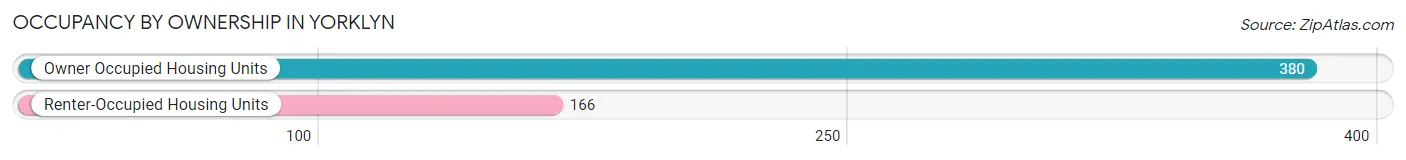
| Occupancy | # Housing Units | % Housing Units |
| Owner Occupied Housing Units | 380 | 69.6% |
| Renter-Occupied Housing Units | 166 | 30.4% |
| Total Occupied Housing Units | 546 | 100.0% |
Occupancy by Household Size in Yorklyn
| Household Size | # Housing Units | % Housing Units |
| 1-Person Household | 90 | 16.5% |
| 2-Person Household | 272 | 49.8% |
| 3-Person Household | 56 | 10.3% |
| 4+ Person Household | 128 | 23.4% |
| Total Housing Units | 546 | 100.0% |
Occupancy by Ownership by Household Size in Yorklyn
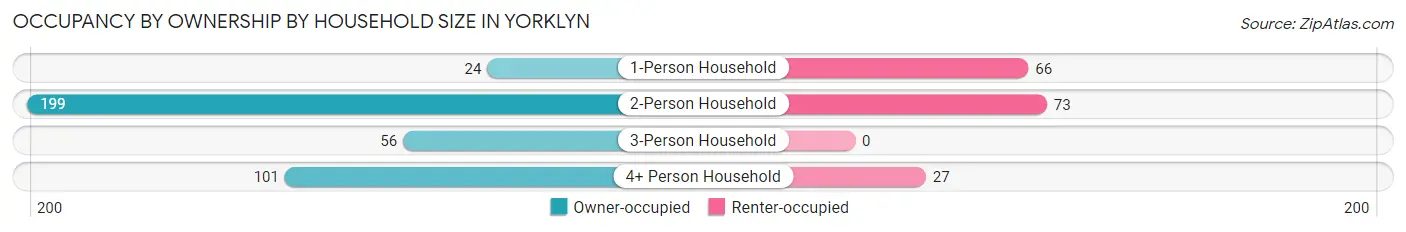
| Household Size | Owner-occupied | Renter-occupied |
| 1-Person Household | 24 (26.7%) | 66 (73.3%) |
| 2-Person Household | 199 (73.2%) | 73 (26.8%) |
| 3-Person Household | 56 (100.0%) | 0 (0.0%) |
| 4+ Person Household | 101 (78.9%) | 27 (21.1%) |
| Total Housing Units | 380 (69.6%) | 166 (30.4%) |
Occupancy by Educational Attainment in Yorklyn
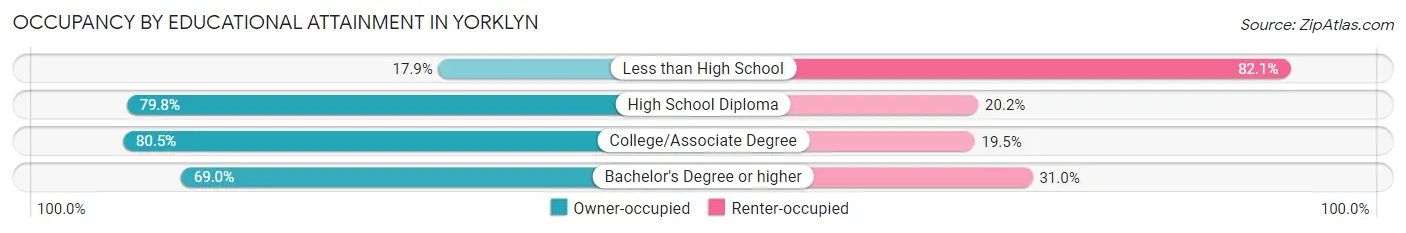
| Household Size | Owner-occupied | Renter-occupied |
| Less than High School | 12 (17.9%) | 55 (82.1%) |
| High School Diploma | 142 (79.8%) | 36 (20.2%) |
| College/Associate Degree | 128 (80.5%) | 31 (19.5%) |
| Bachelor's Degree or higher | 98 (69.0%) | 44 (31.0%) |
Occupancy by Age of Householder in Yorklyn
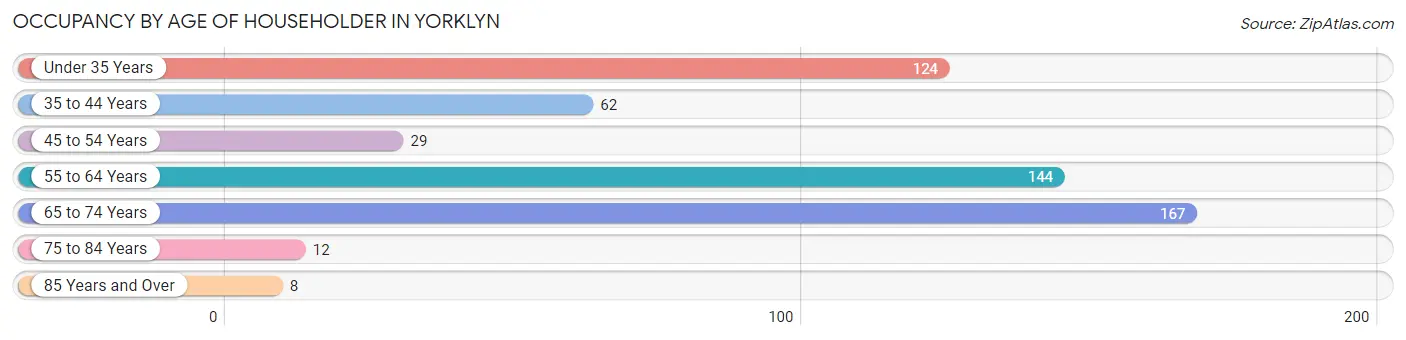
| Age Bracket | # Households | % Households |
| Under 35 Years | 124 | 22.7% |
| 35 to 44 Years | 62 | 11.4% |
| 45 to 54 Years | 29 | 5.3% |
| 55 to 64 Years | 144 | 26.4% |
| 65 to 74 Years | 167 | 30.6% |
| 75 to 84 Years | 12 | 2.2% |
| 85 Years and Over | 8 | 1.5% |
| Total | 546 | 100.0% |
Housing Finances in Yorklyn
Median Income by Occupancy in Yorklyn
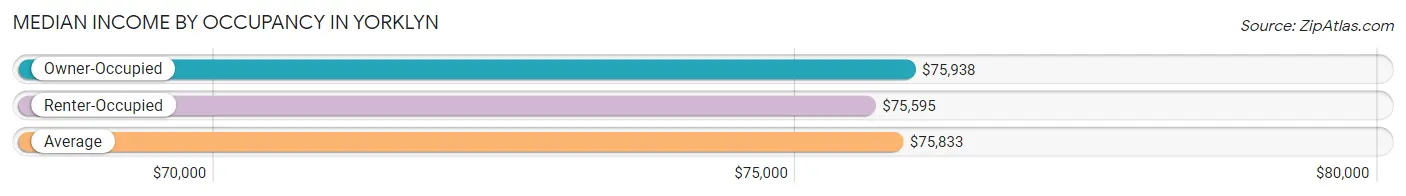
| Occupancy Type | # Households | Median Income |
| Owner-Occupied | 380 (69.6%) | $75,938 |
| Renter-Occupied | 166 (30.4%) | $75,595 |
| Average | 546 (100.0%) | $75,833 |
Occupancy by Householder Income Bracket in Yorklyn
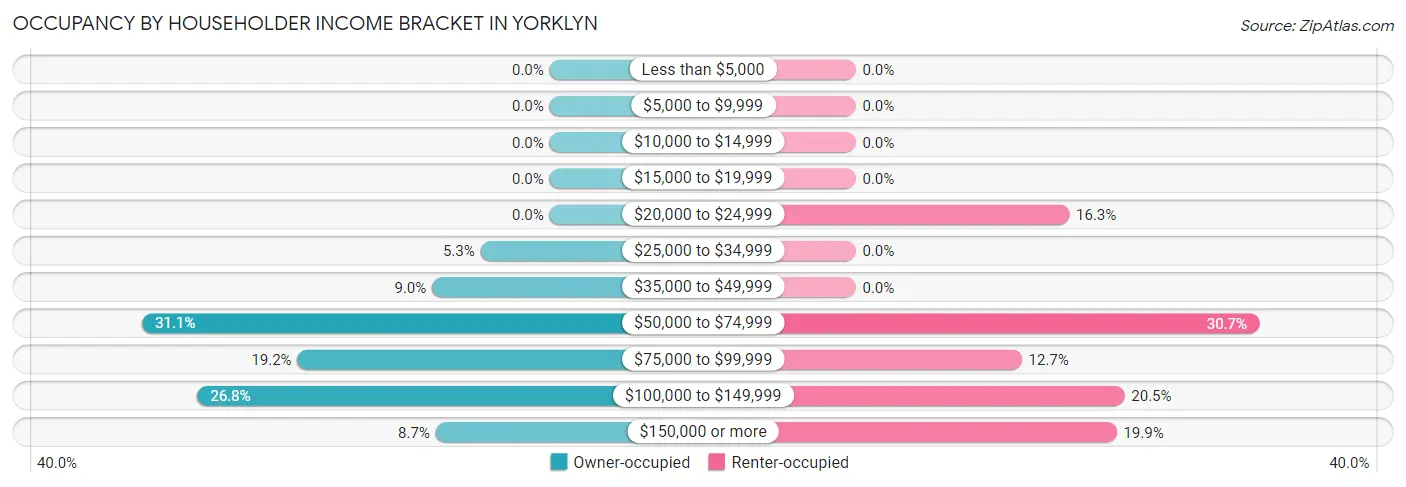
| Income Bracket | Owner-occupied | Renter-occupied |
| Less than $5,000 | 0 (0.0%) | 0 (0.0%) |
| $5,000 to $9,999 | 0 (0.0%) | 0 (0.0%) |
| $10,000 to $14,999 | 0 (0.0%) | 0 (0.0%) |
| $15,000 to $19,999 | 0 (0.0%) | 0 (0.0%) |
| $20,000 to $24,999 | 0 (0.0%) | 27 (16.3%) |
| $25,000 to $34,999 | 20 (5.3%) | 0 (0.0%) |
| $35,000 to $49,999 | 34 (8.9%) | 0 (0.0%) |
| $50,000 to $74,999 | 118 (31.0%) | 51 (30.7%) |
| $75,000 to $99,999 | 73 (19.2%) | 21 (12.7%) |
| $100,000 to $149,999 | 102 (26.8%) | 34 (20.5%) |
| $150,000 or more | 33 (8.7%) | 33 (19.9%) |
| Total | 380 (100.0%) | 166 (100.0%) |
Monthly Housing Cost Tiers in Yorklyn
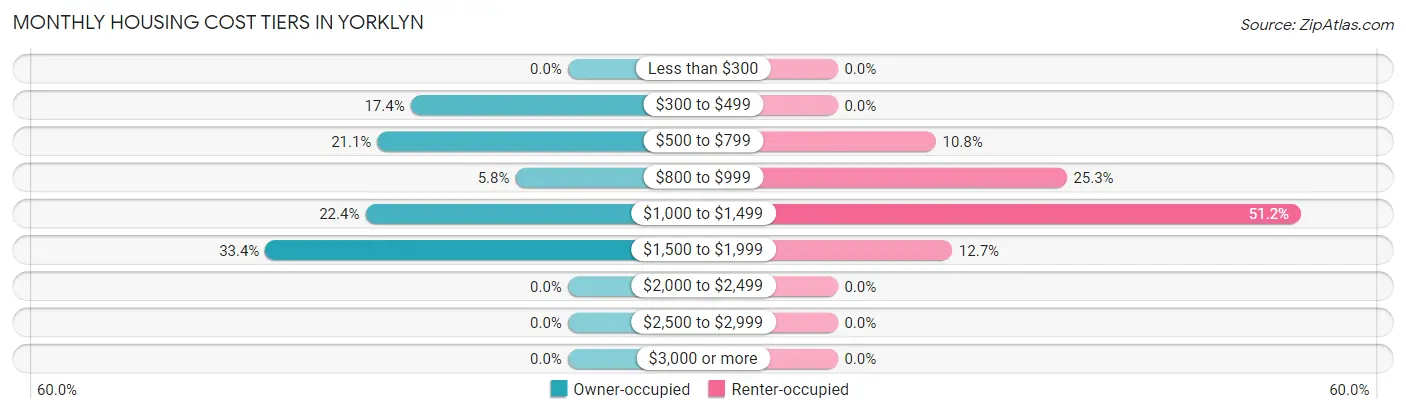
| Monthly Cost | Owner-occupied | Renter-occupied |
| Less than $300 | 0 (0.0%) | 0 (0.0%) |
| $300 to $499 | 66 (17.4%) | 0 (0.0%) |
| $500 to $799 | 80 (21.0%) | 18 (10.8%) |
| $800 to $999 | 22 (5.8%) | 42 (25.3%) |
| $1,000 to $1,499 | 85 (22.4%) | 85 (51.2%) |
| $1,500 to $1,999 | 127 (33.4%) | 21 (12.7%) |
| $2,000 to $2,499 | 0 (0.0%) | 0 (0.0%) |
| $2,500 to $2,999 | 0 (0.0%) | 0 (0.0%) |
| $3,000 or more | 0 (0.0%) | 0 (0.0%) |
| Total | 380 (100.0%) | 166 (100.0%) |
Physical Housing Characteristics in Yorklyn
Housing Structures in Yorklyn
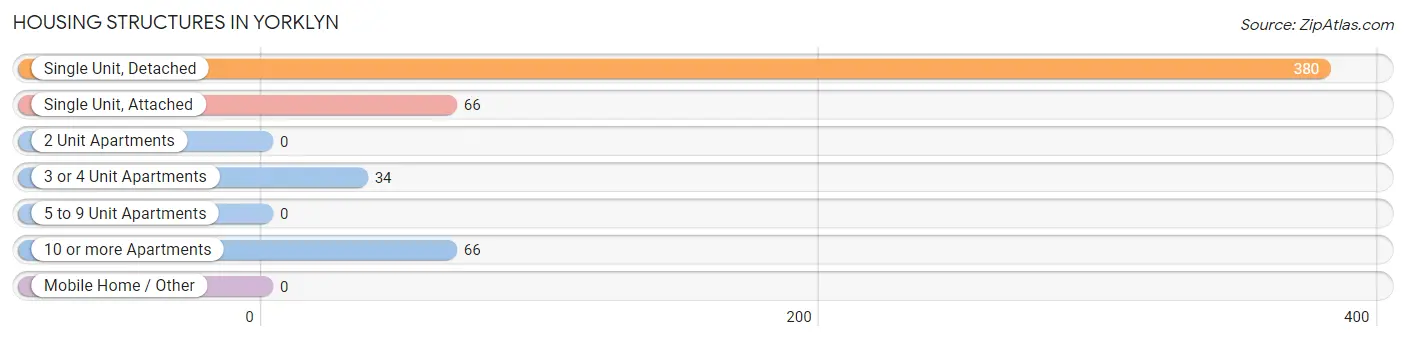
| Structure Type | # Housing Units | % Housing Units |
| Single Unit, Detached | 380 | 69.6% |
| Single Unit, Attached | 66 | 12.1% |
| 2 Unit Apartments | 0 | 0.0% |
| 3 or 4 Unit Apartments | 34 | 6.2% |
| 5 to 9 Unit Apartments | 0 | 0.0% |
| 10 or more Apartments | 66 | 12.1% |
| Mobile Home / Other | 0 | 0.0% |
| Total | 546 | 100.0% |
Housing Structures by Occupancy in Yorklyn
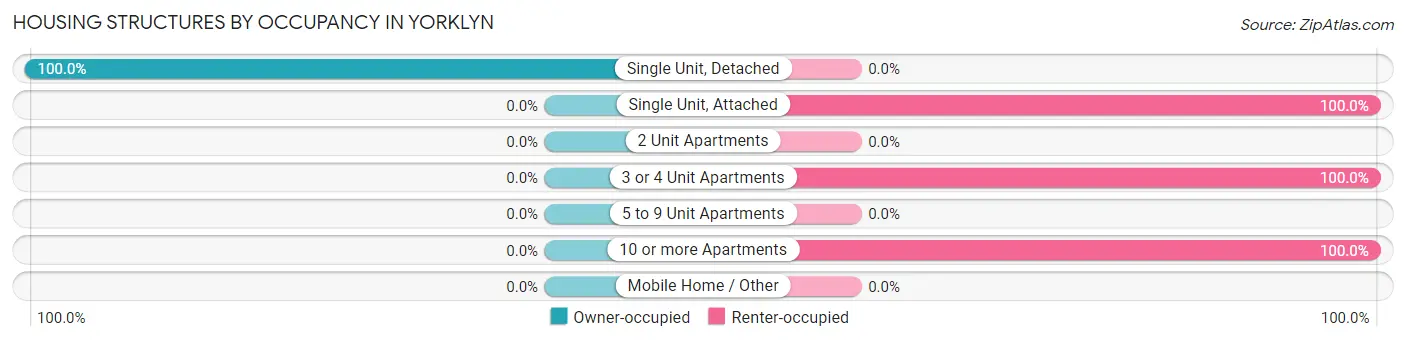
| Structure Type | Owner-occupied | Renter-occupied |
| Single Unit, Detached | 380 (100.0%) | 0 (0.0%) |
| Single Unit, Attached | 0 (0.0%) | 66 (100.0%) |
| 2 Unit Apartments | 0 (0.0%) | 0 (0.0%) |
| 3 or 4 Unit Apartments | 0 (0.0%) | 34 (100.0%) |
| 5 to 9 Unit Apartments | 0 (0.0%) | 0 (0.0%) |
| 10 or more Apartments | 0 (0.0%) | 66 (100.0%) |
| Mobile Home / Other | 0 (0.0%) | 0 (0.0%) |
| Total | 380 (69.6%) | 166 (30.4%) |
Housing Structures by Number of Rooms in Yorklyn
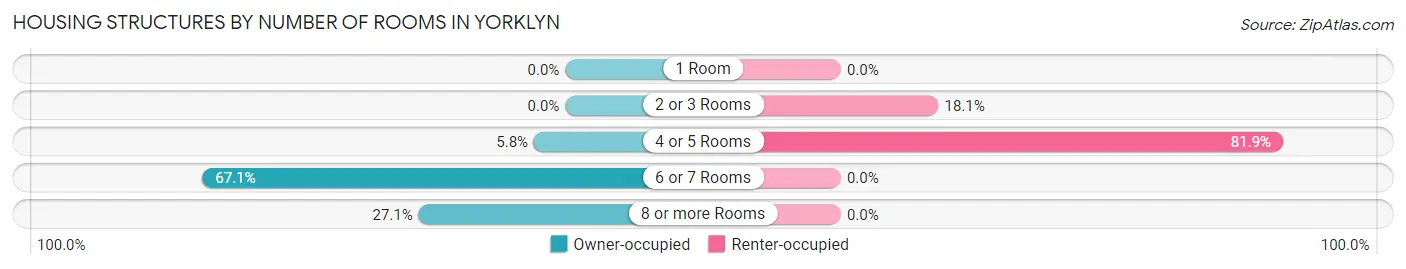
| Number of Rooms | Owner-occupied | Renter-occupied |
| 1 Room | 0 (0.0%) | 0 (0.0%) |
| 2 or 3 Rooms | 0 (0.0%) | 30 (18.1%) |
| 4 or 5 Rooms | 22 (5.8%) | 136 (81.9%) |
| 6 or 7 Rooms | 255 (67.1%) | 0 (0.0%) |
| 8 or more Rooms | 103 (27.1%) | 0 (0.0%) |
| Total | 380 (100.0%) | 166 (100.0%) |
Housing Structure by Heating Type in Yorklyn
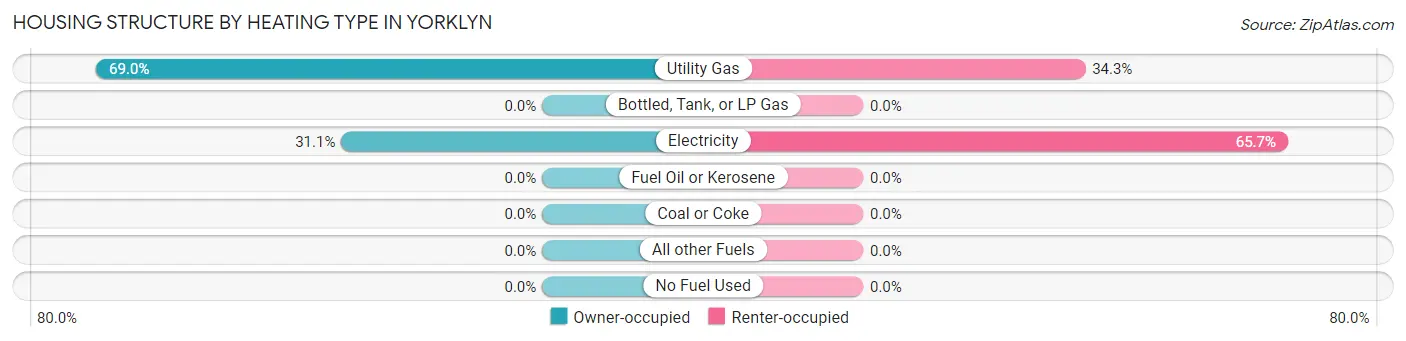
| Heating Type | Owner-occupied | Renter-occupied |
| Utility Gas | 262 (69.0%) | 57 (34.3%) |
| Bottled, Tank, or LP Gas | 0 (0.0%) | 0 (0.0%) |
| Electricity | 118 (31.0%) | 109 (65.7%) |
| Fuel Oil or Kerosene | 0 (0.0%) | 0 (0.0%) |
| Coal or Coke | 0 (0.0%) | 0 (0.0%) |
| All other Fuels | 0 (0.0%) | 0 (0.0%) |
| No Fuel Used | 0 (0.0%) | 0 (0.0%) |
| Total | 380 (100.0%) | 166 (100.0%) |
Household Vehicle Usage in Yorklyn
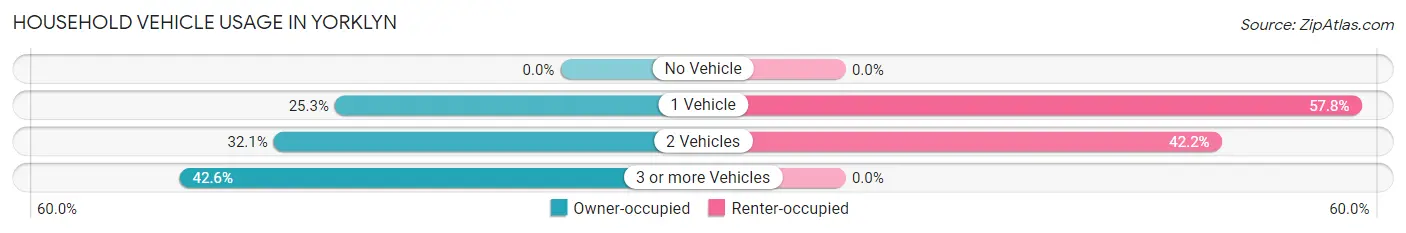
| Vehicles per Household | Owner-occupied | Renter-occupied |
| No Vehicle | 0 (0.0%) | 0 (0.0%) |
| 1 Vehicle | 96 (25.3%) | 96 (57.8%) |
| 2 Vehicles | 122 (32.1%) | 70 (42.2%) |
| 3 or more Vehicles | 162 (42.6%) | 0 (0.0%) |
| Total | 380 (100.0%) | 166 (100.0%) |
Real Estate & Mortgages in Yorklyn
Real Estate and Mortgage Overview in Yorklyn
| Characteristic | Without Mortgage | With Mortgage |
| Housing Units | 124 | 256 |
| Median Property Value | $183,000 | $188,500 |
| Median Household Income | $62,614 | $16 |
| Monthly Housing Costs | $493 | $0 |
| Real Estate Taxes | - | - |
Property Value by Mortgage Status in Yorklyn
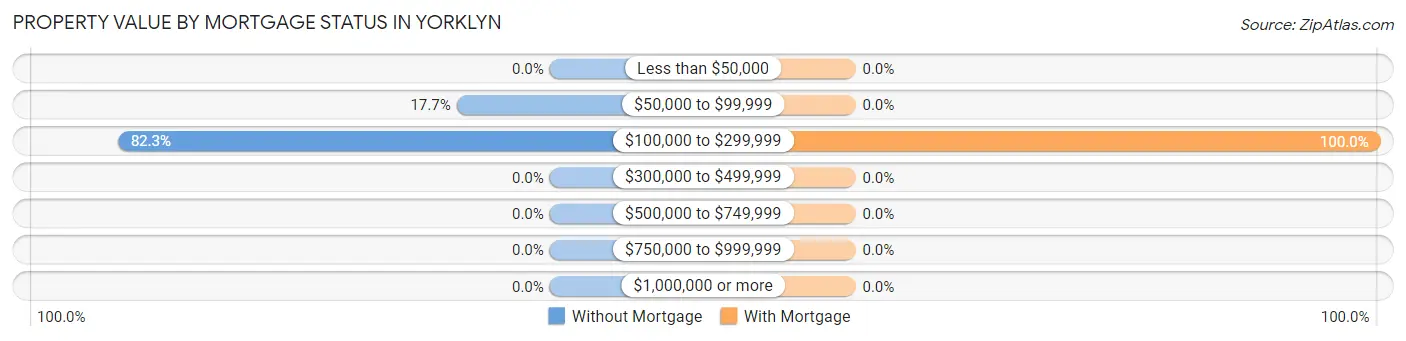
| Property Value | Without Mortgage | With Mortgage |
| Less than $50,000 | 0 (0.0%) | 0 (0.0%) |
| $50,000 to $99,999 | 22 (17.7%) | 0 (0.0%) |
| $100,000 to $299,999 | 102 (82.3%) | 256 (100.0%) |
| $300,000 to $499,999 | 0 (0.0%) | 0 (0.0%) |
| $500,000 to $749,999 | 0 (0.0%) | 0 (0.0%) |
| $750,000 to $999,999 | 0 (0.0%) | 0 (0.0%) |
| $1,000,000 or more | 0 (0.0%) | 0 (0.0%) |
| Total | 124 (100.0%) | 256 (100.0%) |
Household Income by Mortgage Status in Yorklyn
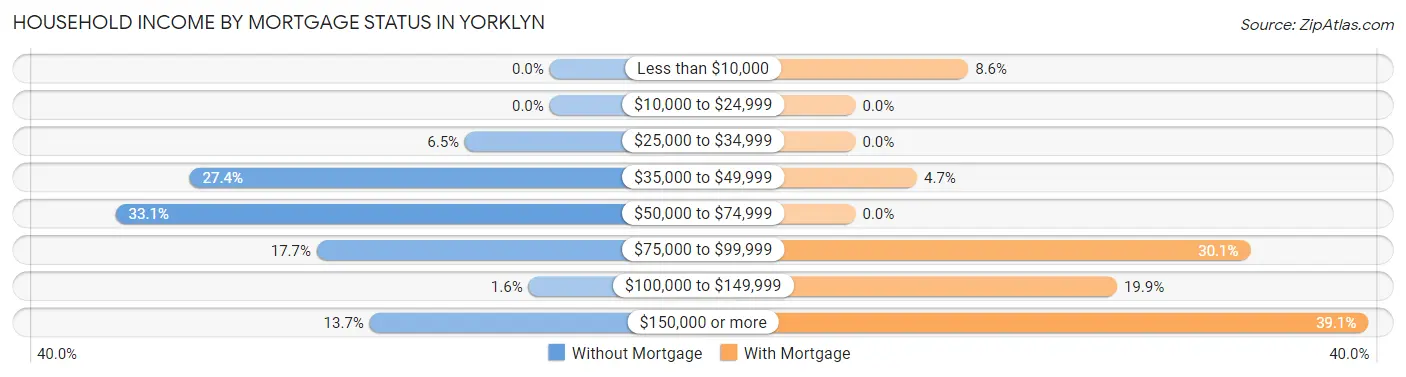
| Household Income | Without Mortgage | With Mortgage |
| Less than $10,000 | 0 (0.0%) | 22 (8.6%) |
| $10,000 to $24,999 | 0 (0.0%) | 0 (0.0%) |
| $25,000 to $34,999 | 8 (6.5%) | 0 (0.0%) |
| $35,000 to $49,999 | 34 (27.4%) | 12 (4.7%) |
| $50,000 to $74,999 | 41 (33.1%) | 0 (0.0%) |
| $75,000 to $99,999 | 22 (17.7%) | 77 (30.1%) |
| $100,000 to $149,999 | 2 (1.6%) | 51 (19.9%) |
| $150,000 or more | 17 (13.7%) | 100 (39.1%) |
| Total | 124 (100.0%) | 256 (100.0%) |
Property Value to Household Income Ratio in Yorklyn
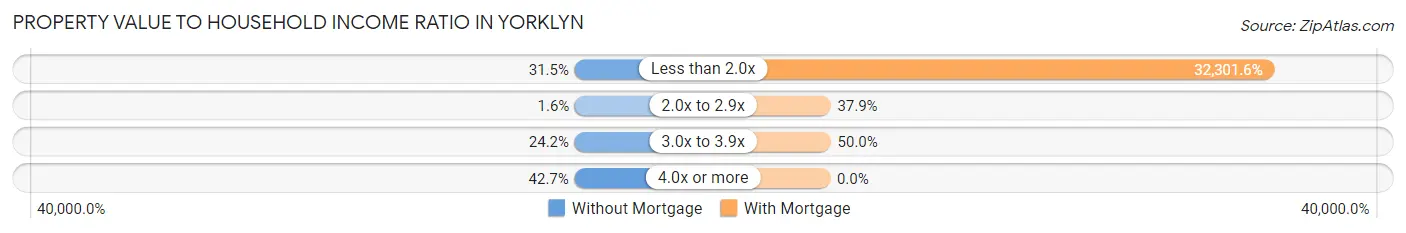
| Value-to-Income Ratio | Without Mortgage | With Mortgage |
| Less than 2.0x | 39 (31.5%) | 82,692 (32,301.6%) |
| 2.0x to 2.9x | 2 (1.6%) | 97 (37.9%) |
| 3.0x to 3.9x | 30 (24.2%) | 128 (50.0%) |
| 4.0x or more | 53 (42.7%) | 0 (0.0%) |
| Total | 124 (100.0%) | 256 (100.0%) |
Real Estate Taxes by Mortgage Status in Yorklyn
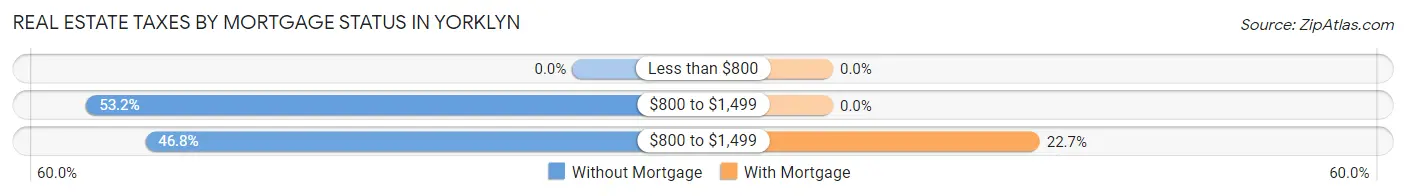
| Property Taxes | Without Mortgage | With Mortgage |
| Less than $800 | 0 (0.0%) | 0 (0.0%) |
| $800 to $1,499 | 66 (53.2%) | 0 (0.0%) |
| $800 to $1,499 | 58 (46.8%) | 58 (22.7%) |
| Total | 124 (100.0%) | 256 (100.0%) |
Health & Disability in Yorklyn
Health Insurance Coverage by Age in Yorklyn
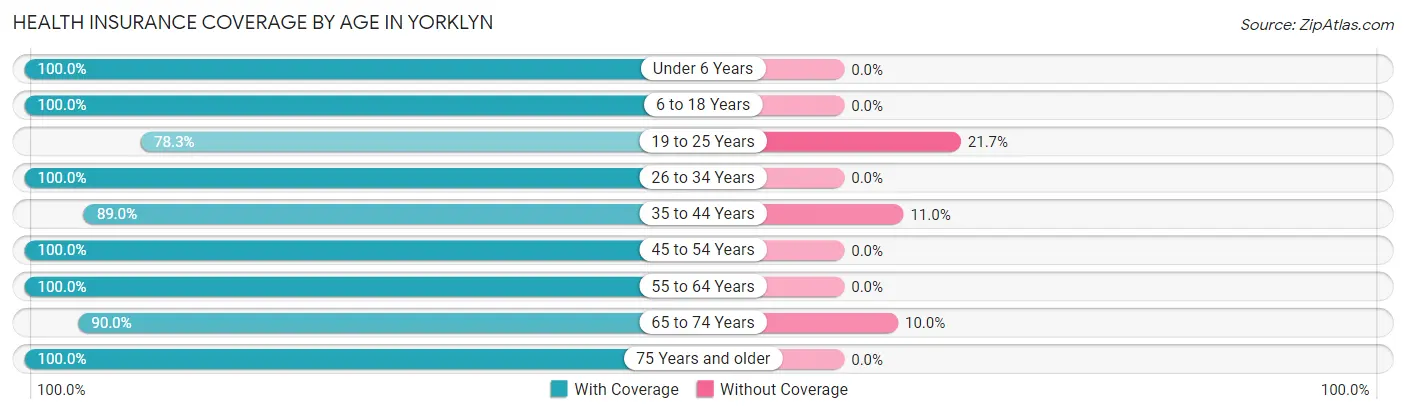
| Age Bracket | With Coverage | Without Coverage |
| Under 6 Years | 58 (100.0%) | 0 (0.0%) |
| 6 to 18 Years | 362 (100.0%) | 0 (0.0%) |
| 19 to 25 Years | 54 (78.3%) | 15 (21.7%) |
| 26 to 34 Years | 224 (100.0%) | 0 (0.0%) |
| 35 to 44 Years | 137 (89.0%) | 17 (11.0%) |
| 45 to 54 Years | 145 (100.0%) | 0 (0.0%) |
| 55 to 64 Years | 297 (100.0%) | 0 (0.0%) |
| 65 to 74 Years | 269 (90.0%) | 30 (10.0%) |
| 75 Years and older | 29 (100.0%) | 0 (0.0%) |
| Total | 1,575 (96.2%) | 62 (3.8%) |
Health Insurance Coverage by Citizenship Status in Yorklyn
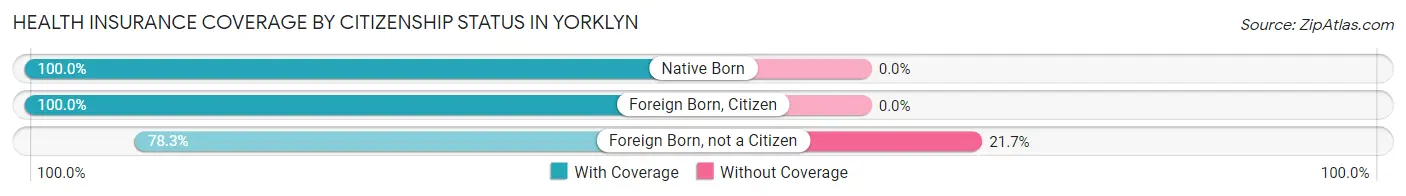
| Citizenship Status | With Coverage | Without Coverage |
| Native Born | 58 (100.0%) | 0 (0.0%) |
| Foreign Born, Citizen | 362 (100.0%) | 0 (0.0%) |
| Foreign Born, not a Citizen | 54 (78.3%) | 15 (21.7%) |
Health Insurance Coverage by Household Income in Yorklyn
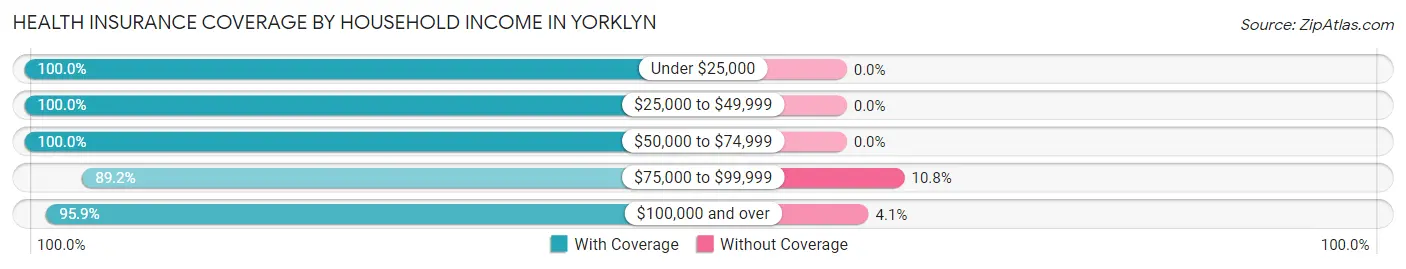
| Household Income | With Coverage | Without Coverage |
| Under $25,000 | 193 (100.0%) | 0 (0.0%) |
| $25,000 to $49,999 | 82 (100.0%) | 0 (0.0%) |
| $50,000 to $74,999 | 285 (100.0%) | 0 (0.0%) |
| $75,000 to $99,999 | 239 (89.2%) | 29 (10.8%) |
| $100,000 and over | 776 (95.9%) | 33 (4.1%) |
Public vs Private Health Insurance Coverage by Age in Yorklyn
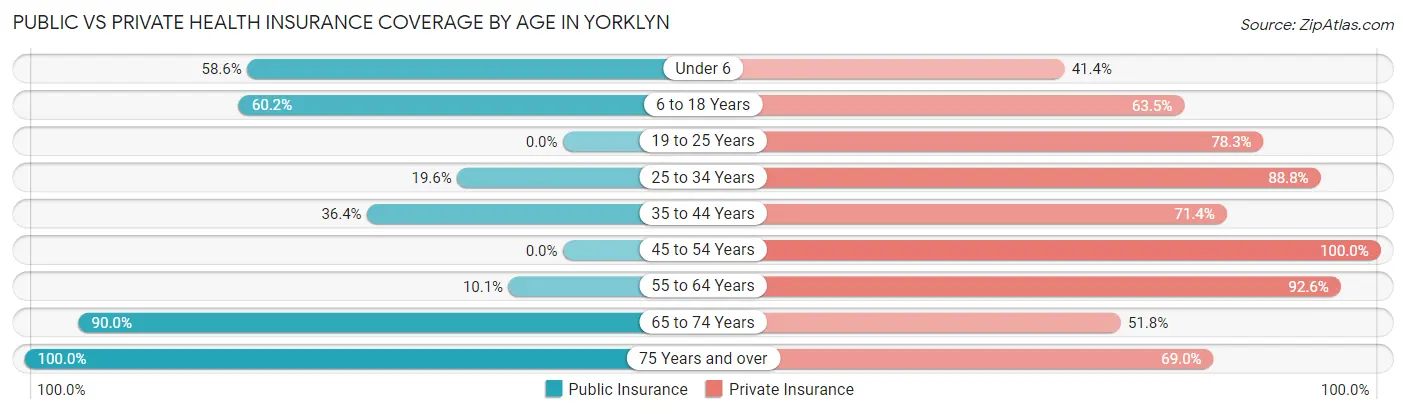
| Age Bracket | Public Insurance | Private Insurance |
| Under 6 | 34 (58.6%) | 24 (41.4%) |
| 6 to 18 Years | 218 (60.2%) | 230 (63.5%) |
| 19 to 25 Years | 0 (0.0%) | 54 (78.3%) |
| 25 to 34 Years | 44 (19.6%) | 199 (88.8%) |
| 35 to 44 Years | 56 (36.4%) | 110 (71.4%) |
| 45 to 54 Years | 0 (0.0%) | 145 (100.0%) |
| 55 to 64 Years | 30 (10.1%) | 275 (92.6%) |
| 65 to 74 Years | 269 (90.0%) | 155 (51.8%) |
| 75 Years and over | 29 (100.0%) | 20 (69.0%) |
| Total | 680 (41.5%) | 1,212 (74.0%) |
Disability Status by Sex by Age in Yorklyn
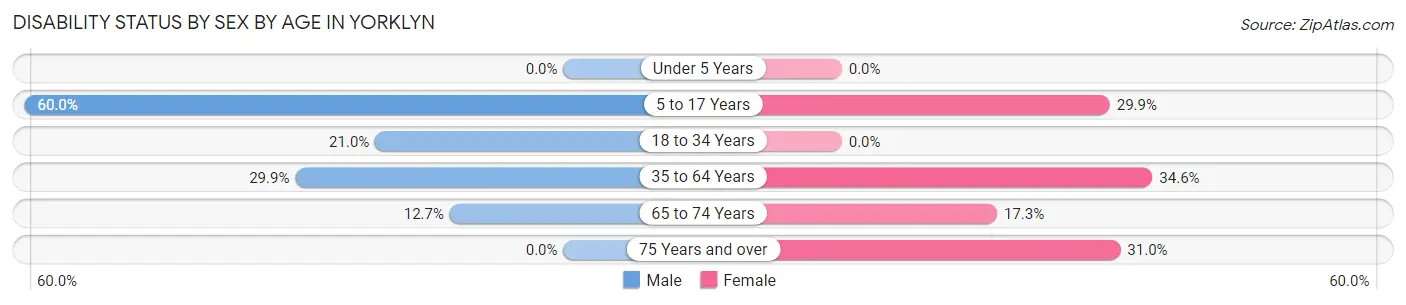
| Age Bracket | Male | Female |
| Under 5 Years | 0 (0.0%) | 0 (0.0%) |
| 5 to 17 Years | 75 (60.0%) | 40 (29.8%) |
| 18 to 34 Years | 57 (21.0%) | 0 (0.0%) |
| 35 to 64 Years | 83 (29.9%) | 110 (34.6%) |
| 65 to 74 Years | 21 (12.7%) | 23 (17.3%) |
| 75 Years and over | 0 (0.0%) | 9 (31.0%) |
Disability Class by Sex by Age in Yorklyn
Disability Class: Hearing Difficulty
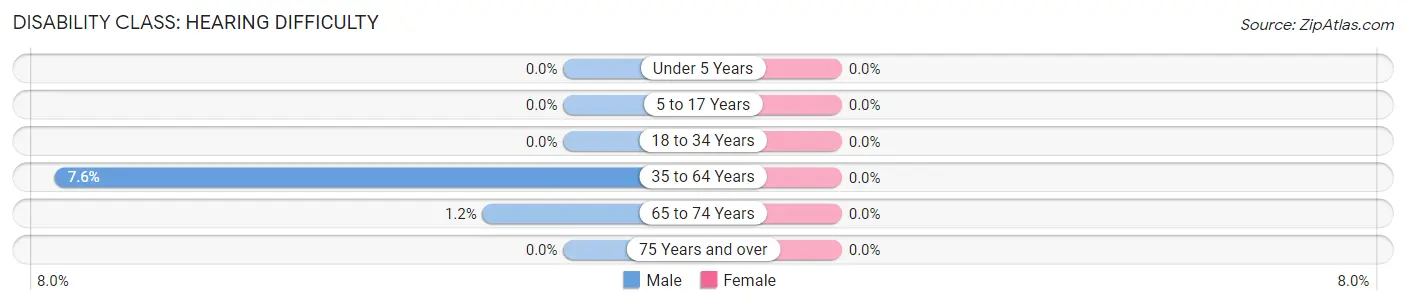
| Age Bracket | Male | Female |
| Under 5 Years | 0 (0.0%) | 0 (0.0%) |
| 5 to 17 Years | 0 (0.0%) | 0 (0.0%) |
| 18 to 34 Years | 0 (0.0%) | 0 (0.0%) |
| 35 to 64 Years | 21 (7.5%) | 0 (0.0%) |
| 65 to 74 Years | 2 (1.2%) | 0 (0.0%) |
| 75 Years and over | 0 (0.0%) | 0 (0.0%) |
Disability Class: Vision Difficulty
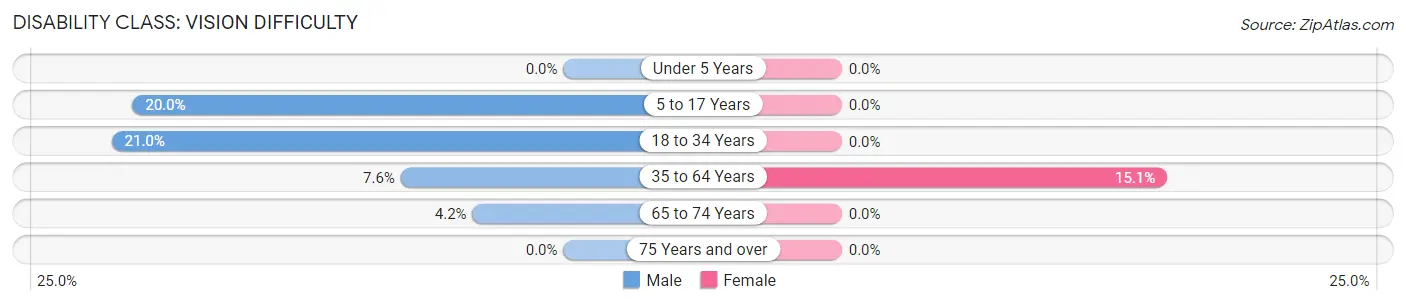
| Age Bracket | Male | Female |
| Under 5 Years | 0 (0.0%) | 0 (0.0%) |
| 5 to 17 Years | 25 (20.0%) | 0 (0.0%) |
| 18 to 34 Years | 57 (21.0%) | 0 (0.0%) |
| 35 to 64 Years | 21 (7.5%) | 48 (15.1%) |
| 65 to 74 Years | 7 (4.2%) | 0 (0.0%) |
| 75 Years and over | 0 (0.0%) | 0 (0.0%) |
Disability Class: Cognitive Difficulty
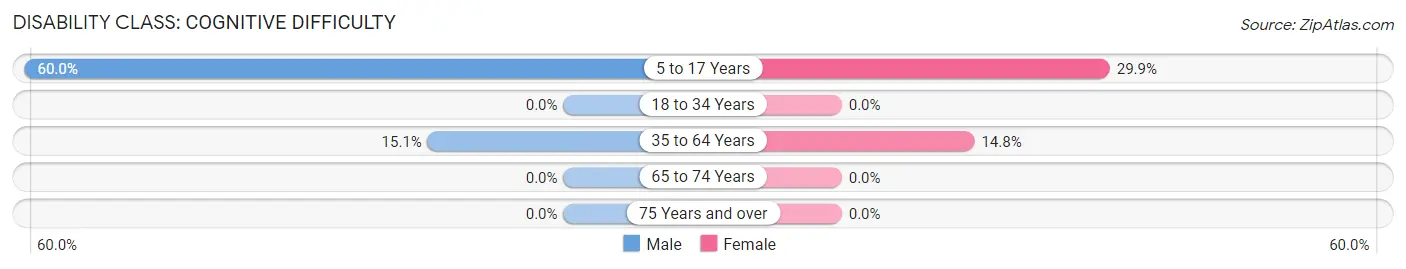
| Age Bracket | Male | Female |
| 5 to 17 Years | 75 (60.0%) | 40 (29.8%) |
| 18 to 34 Years | 0 (0.0%) | 0 (0.0%) |
| 35 to 64 Years | 42 (15.1%) | 47 (14.8%) |
| 65 to 74 Years | 0 (0.0%) | 0 (0.0%) |
| 75 Years and over | 0 (0.0%) | 0 (0.0%) |
Disability Class: Ambulatory Difficulty
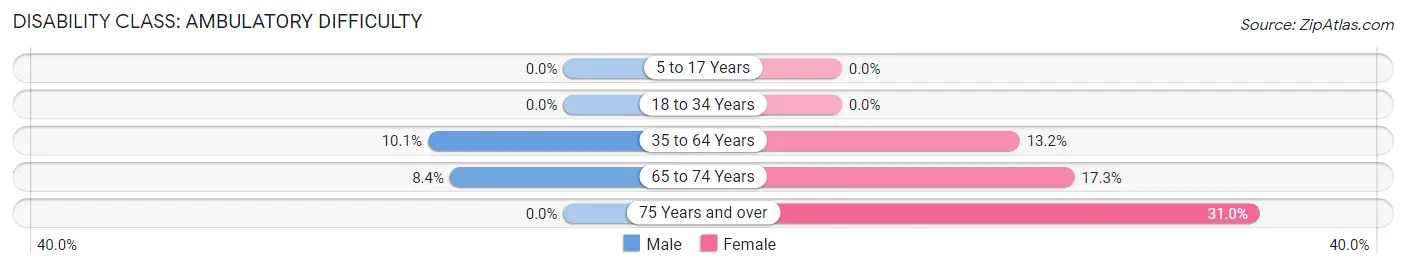
| Age Bracket | Male | Female |
| 5 to 17 Years | 0 (0.0%) | 0 (0.0%) |
| 18 to 34 Years | 0 (0.0%) | 0 (0.0%) |
| 35 to 64 Years | 28 (10.1%) | 42 (13.2%) |
| 65 to 74 Years | 14 (8.4%) | 23 (17.3%) |
| 75 Years and over | 0 (0.0%) | 9 (31.0%) |
Disability Class: Self-Care Difficulty
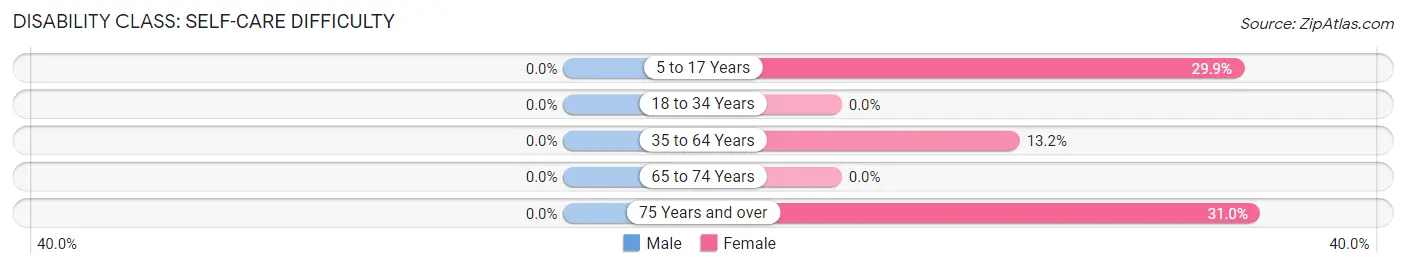
| Age Bracket | Male | Female |
| 5 to 17 Years | 0 (0.0%) | 40 (29.8%) |
| 18 to 34 Years | 0 (0.0%) | 0 (0.0%) |
| 35 to 64 Years | 0 (0.0%) | 42 (13.2%) |
| 65 to 74 Years | 0 (0.0%) | 0 (0.0%) |
| 75 Years and over | 0 (0.0%) | 9 (31.0%) |
Technology Access in Yorklyn
Computing Device Access in Yorklyn
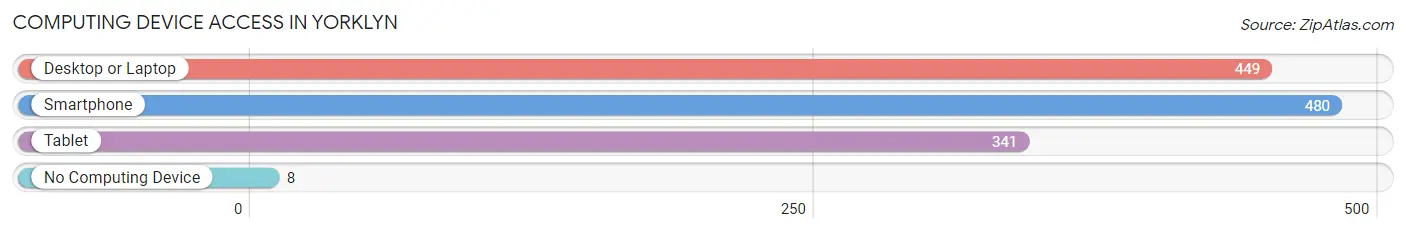
| Device Type | # Households | % Households |
| Desktop or Laptop | 449 | 82.2% |
| Smartphone | 480 | 87.9% |
| Tablet | 341 | 62.5% |
| No Computing Device | 8 | 1.5% |
| Total | 546 | 100.0% |
Internet Access in Yorklyn
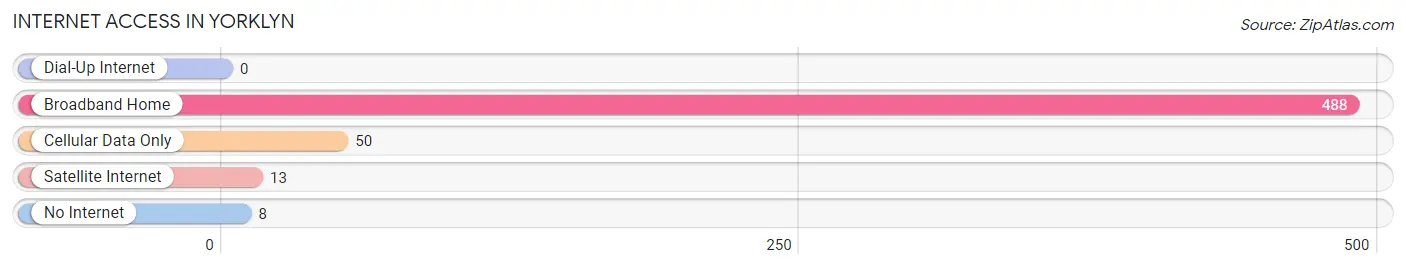
| Internet Type | # Households | % Households |
| Dial-Up Internet | 0 | 0.0% |
| Broadband Home | 488 | 89.4% |
| Cellular Data Only | 50 | 9.2% |
| Satellite Internet | 13 | 2.4% |
| No Internet | 8 | 1.5% |
| Total | 546 | 100.0% |
Yorklyn Summary
History
The area now known as Yorklyn, Pennsylvania was first settled in the late 1700s by a group of German immigrants. The area was originally known as “York’s Land”, named after the original settler, John York. The area was primarily agricultural, with the main crops being wheat, corn, and oats. In the early 1800s, the area was home to a number of small mills, including a grist mill, a saw mill, and a paper mill.
In 1832, the Yorklyn post office was established, and the area was officially incorporated as a borough in 1851. The town was named after John York, and the “lyn” was added to signify the area’s rural character.
In the late 1800s, the area began to experience a period of industrialization. The paper mill was expanded, and a number of other industries, including a brickyard, a tannery, and a furniture factory, were established. The population of the area grew rapidly, and by the early 1900s, the town had a population of over 1,000.
In the early 1900s, the area experienced a period of decline. The paper mill closed in the 1920s, and the other industries began to decline as well. By the 1950s, the population had dropped to just over 500.
In the late 1970s, the area began to experience a period of revitalization. The paper mill was reopened, and a number of other businesses, including a restaurant, a brewery, and a winery, were established. The population of the area began to grow again, and by the 2000 census, the population had grown to over 1,000.
Geography
Yorklyn is located in southeastern Pennsylvania, in the heart of Lancaster County. The town is situated on the banks of the Red Clay Creek, and is surrounded by rolling hills and farmland. The area is known for its picturesque scenery and rural character.
The climate in Yorklyn is temperate, with hot summers and cold winters. The average annual temperature is around 50 degrees Fahrenheit. The area receives an average of 40 inches of precipitation per year.
Economy
The economy of Yorklyn is primarily based on agriculture and tourism. The area is home to a number of small farms, which produce a variety of crops, including wheat, corn, and oats. The area is also home to a number of wineries and breweries, which attract tourists from all over the region.
In addition to agriculture and tourism, the area is home to a number of small businesses, including restaurants, retail stores, and professional services. The area is also home to a number of light manufacturing businesses, including a paper mill and a furniture factory.
Demographics
As of the 2000 census, the population of Yorklyn was 1,072. The population is primarily white (97.2%), with a small percentage of African Americans (1.2%) and Hispanics (1.6%). The median household income is $45,000, and the median home value is $150,000. The area is served by the Red Clay Consolidated School District.
Common Questions
What is Per Capita Income in Yorklyn?
Per Capita income in Yorklyn is $35,632.
What is the Median Family Income in Yorklyn?
Median Family Income in Yorklyn is $76,703.
What is the Median Household income in Yorklyn?
Median Household Income in Yorklyn is $75,833.
What is Income or Wage Gap in Yorklyn?
Income or Wage Gap in Yorklyn is 2.4%.
Women in Yorklyn earn 97.6 cents for every dollar earned by a man.
What is Inequality or Gini Index in Yorklyn?
Inequality or Gini Index in Yorklyn is 0.34.
What is the Total Population of Yorklyn?
Total Population of Yorklyn is 1,637.
What is the Total Male Population of Yorklyn?
Total Male Population of Yorklyn is 875.
What is the Total Female Population of Yorklyn?
Total Female Population of Yorklyn is 762.
What is the Ratio of Males per 100 Females in Yorklyn?
There are 114.83 Males per 100 Females in Yorklyn.
What is the Ratio of Females per 100 Males in Yorklyn?
There are 87.09 Females per 100 Males in Yorklyn.
What is the Median Population Age in Yorklyn?
Median Population Age in Yorklyn is 40.5 Years.
What is the Average Family Size in Yorklyn
Average Family Size in Yorklyn is 3.4 People.
What is the Average Household Size in Yorklyn
Average Household Size in Yorklyn is 3.0 People.
How Large is the Labor Force in Yorklyn?
There are 875 People in the Labor Forcein in Yorklyn.
What is the Percentage of People in the Labor Force in Yorklyn?
65.9% of People are in the Labor Force in Yorklyn.