Zip Codes with the Highest Percentage of Population Employed in Food Preparation & Serving in Butler, PA
RELATED REPORTS & OPTIONS
Food Preparation & Serving
Butler
Compare Zip Codes
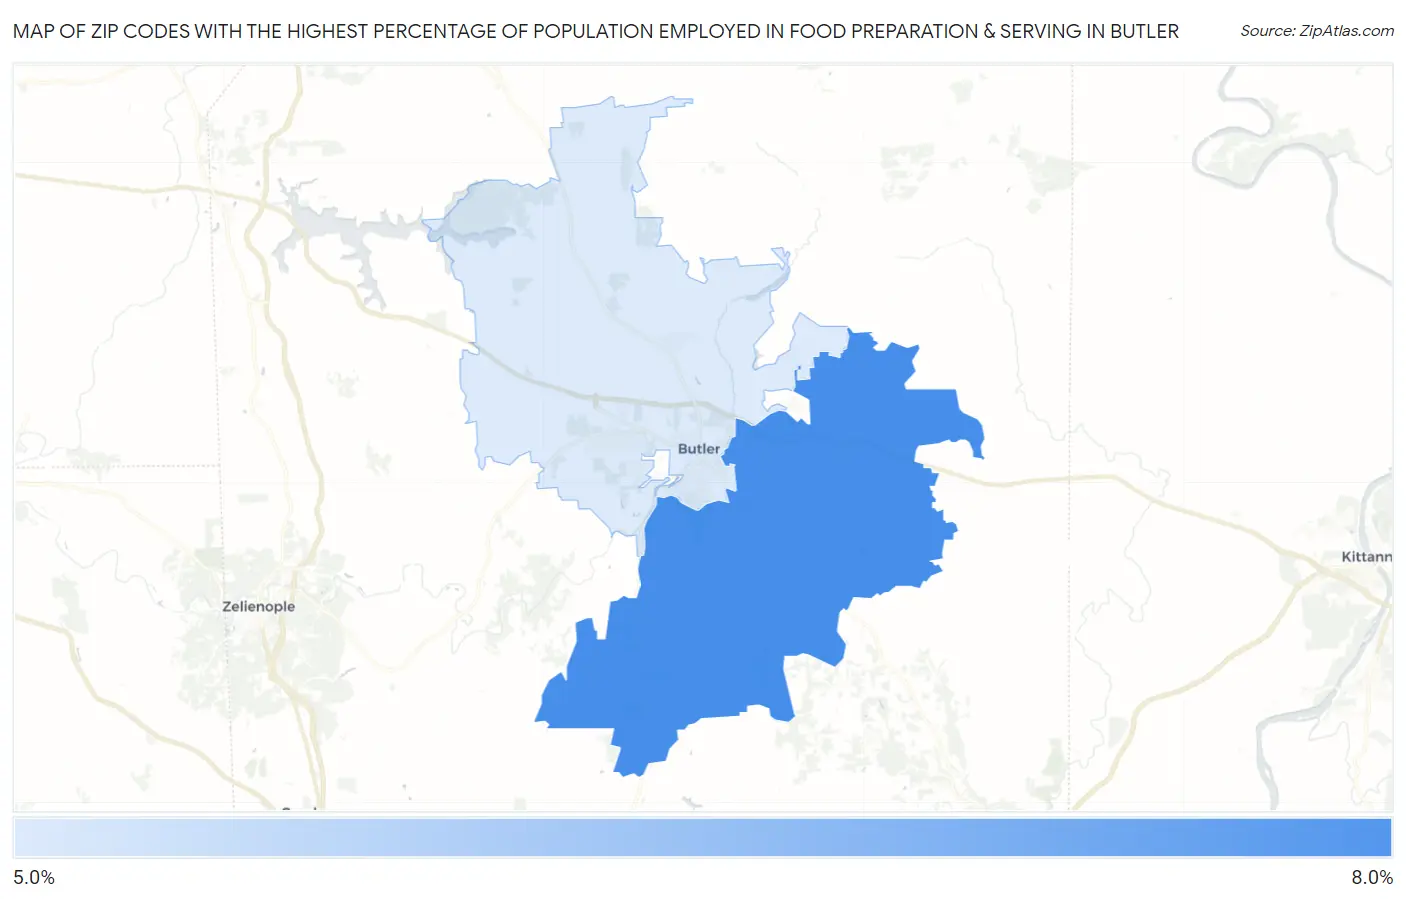
Map of Zip Codes with the Highest Percentage of Population Employed in Food Preparation & Serving in Butler
5.7%
6.0%
Zip Codes with the Highest Percentage of Population Employed in Food Preparation & Serving in Butler, PA
| Zip Code | % Employed | vs State | vs National | |
| 1. | 16002 | 6.0% | 5.0%(+1.00)#494 | 5.3%(+0.758)#9,190 |
| 2. | 16001 | 5.7% | 5.0%(+0.683)#555 | 5.3%(+0.440)#10,256 |
1
Common Questions
What are the Top Zip Codes with the Highest Percentage of Population Employed in Food Preparation & Serving in Butler, PA?
Top Zip Codes with the Highest Percentage of Population Employed in Food Preparation & Serving in Butler, PA are:
What zip code has the Highest Percentage of Population Employed in Food Preparation & Serving in Butler, PA?
16002 has the Highest Percentage of Population Employed in Food Preparation & Serving in Butler, PA with 6.0%.
What is the Percentage of Population Employed in Food Preparation & Serving in Butler, PA?
Percentage of Population Employed in Food Preparation & Serving in Butler is 9.9%.
What is the Percentage of Population Employed in Food Preparation & Serving in Pennsylvania?
Percentage of Population Employed in Food Preparation & Serving in Pennsylvania is 5.0%.
What is the Percentage of Population Employed in Food Preparation & Serving in the United States?
Percentage of Population Employed in Food Preparation & Serving in the United States is 5.3%.