Haverford College, PA Map & Demographics
Haverford College Map
Haverford College Overview
$23,607
PER CAPITA INCOME
$200,795
AVG FAMILY INCOME
$200,795
AVG HOUSEHOLD INCOME
36.8%
WAGE / INCOME GAP [ % ]
63.2¢/ $1
WAGE / INCOME GAP [ $ ]
0.43
INEQUALITY / GINI INDEX
1,463
TOTAL POPULATION
650
MALE POPULATION
813
FEMALE POPULATION
79.95
MALES / 100 FEMALES
125.08
FEMALES / 100 MALES
20.2
MEDIAN AGE
3.0
AVG FAMILY SIZE
3.0
AVG HOUSEHOLD SIZE
664
LABOR FORCE [ PEOPLE ]
47.4%
PERCENT IN LABOR FORCE
9.8%
UNEMPLOYMENT RATE
Income in Haverford College
Income Overview in Haverford College
Per Capita Income in Haverford College is $23,607, while median incomes of families and households are $200,795 and $200,795 respectively.
| Characteristic | Number | Measure |
| Per Capita Income | 1,463 | $23,607 |
| Median Family Income | 69 | $200,795 |
| Mean Family Income | 69 | $335,578 |
| Median Household Income | 69 | $200,795 |
| Mean Household Income | 69 | $335,578 |
| Income Deficit | 69 | $0 |
| Wage / Income Gap (%) | 1,463 | 36.83% |
| Wage / Income Gap ($) | 1,463 | 63.17¢ per $1 |
| Gini / Inequality Index | 1,463 | 0.43 |
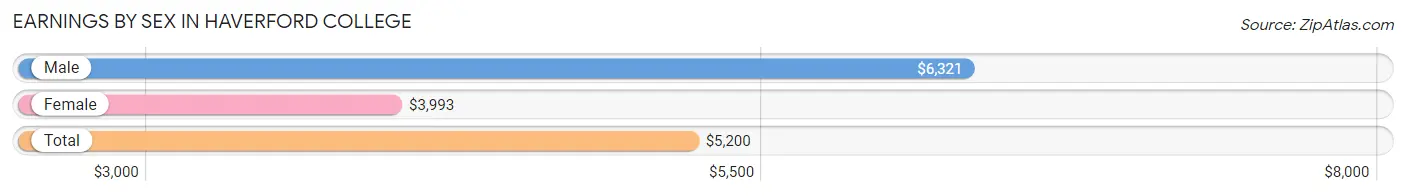
Earnings by Sex in Haverford College
Average Earnings in Haverford College are $5,200, $6,321 for men and $3,993 for women, a difference of 36.8%.
| Sex | Number | Average Earnings |
| Male | 467 (40.7%) | $6,321 |
| Female | 679 (59.3%) | $3,993 |
| Total | 1,146 (100.0%) | $5,200 |
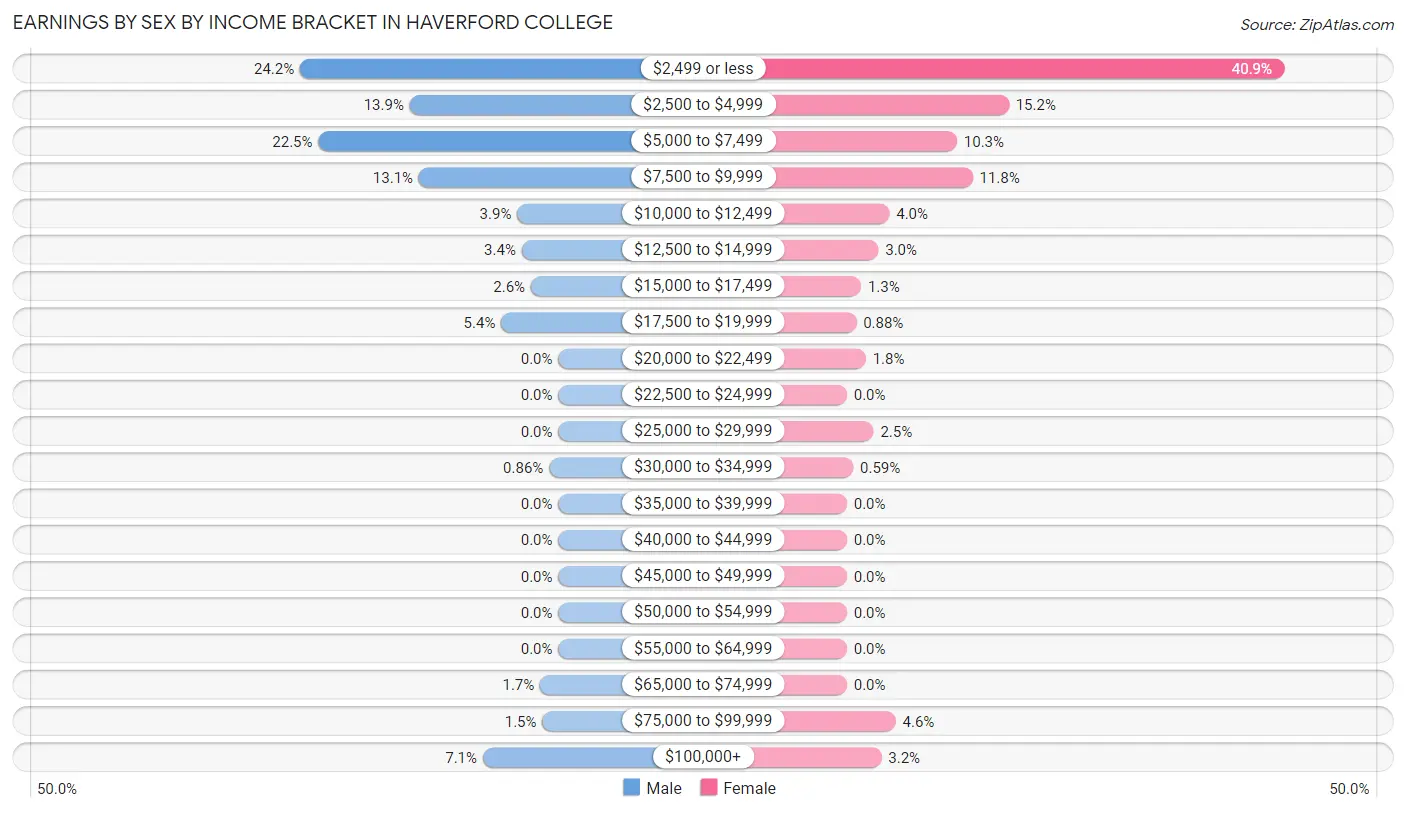
Earnings by Sex by Income Bracket in Haverford College
The most common earnings brackets in Haverford College are $2,499 or less for men (113 | 24.2%) and $2,499 or less for women (278 | 40.9%).
| Income | Male | Female |
| $2,499 or less | 113 (24.2%) | 278 (40.9%) |
| $2,500 to $4,999 | 65 (13.9%) | 103 (15.2%) |
| $5,000 to $7,499 | 105 (22.5%) | 70 (10.3%) |
| $7,500 to $9,999 | 61 (13.1%) | 80 (11.8%) |
| $10,000 to $12,499 | 18 (3.8%) | 27 (4.0%) |
| $12,500 to $14,999 | 16 (3.4%) | 20 (2.9%) |
| $15,000 to $17,499 | 12 (2.6%) | 9 (1.3%) |
| $17,500 to $19,999 | 25 (5.3%) | 6 (0.9%) |
| $20,000 to $22,499 | 0 (0.0%) | 12 (1.8%) |
| $22,500 to $24,999 | 0 (0.0%) | 0 (0.0%) |
| $25,000 to $29,999 | 0 (0.0%) | 17 (2.5%) |
| $30,000 to $34,999 | 4 (0.9%) | 4 (0.6%) |
| $35,000 to $39,999 | 0 (0.0%) | 0 (0.0%) |
| $40,000 to $44,999 | 0 (0.0%) | 0 (0.0%) |
| $45,000 to $49,999 | 0 (0.0%) | 0 (0.0%) |
| $50,000 to $54,999 | 0 (0.0%) | 0 (0.0%) |
| $55,000 to $64,999 | 0 (0.0%) | 0 (0.0%) |
| $65,000 to $74,999 | 8 (1.7%) | 0 (0.0%) |
| $75,000 to $99,999 | 7 (1.5%) | 31 (4.6%) |
| $100,000+ | 33 (7.1%) | 22 (3.2%) |
| Total | 467 (100.0%) | 679 (100.0%) |
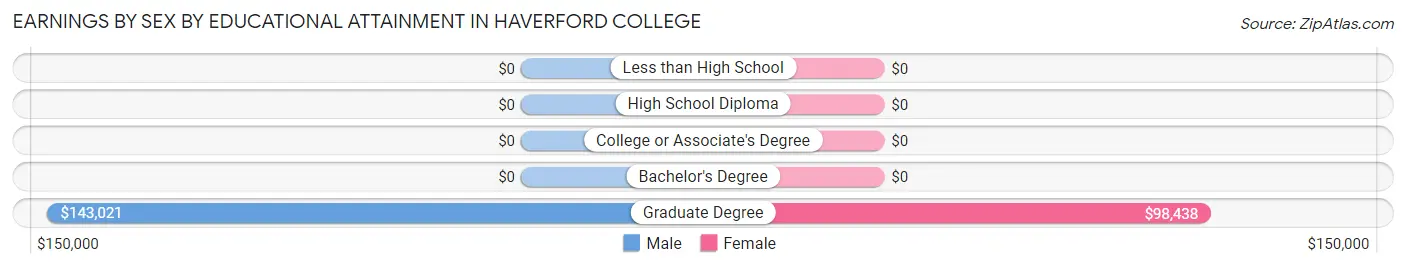
Earnings by Sex by Educational Attainment in Haverford College
Average earnings in Haverford College are $104,750 for men and $90,000 for women, a difference of 14.1%. Men with an educational attainment of graduate degree enjoy the highest average annual earnings of $143,021, while those with graduate degree education earn the least with $143,021. Women with an educational attainment of graduate degree earn the most with the average annual earnings of $98,438, while those with graduate degree education have the smallest earnings of $98,438.
| Educational Attainment | Male Income | Female Income |
| Less than High School | - | - |
| High School Diploma | - | - |
| College or Associate's Degree | - | - |
| Bachelor's Degree | - | - |
| Graduate Degree | $143,021 | $98,438 |
| Total | $104,750 | $90,000 |
Family Income in Haverford College
Family Income Brackets in Haverford College
According to the Haverford College family income data, there are 38 families falling into the $200,000+ income range, which is the most common income bracket and makes up 55.1% of all families.
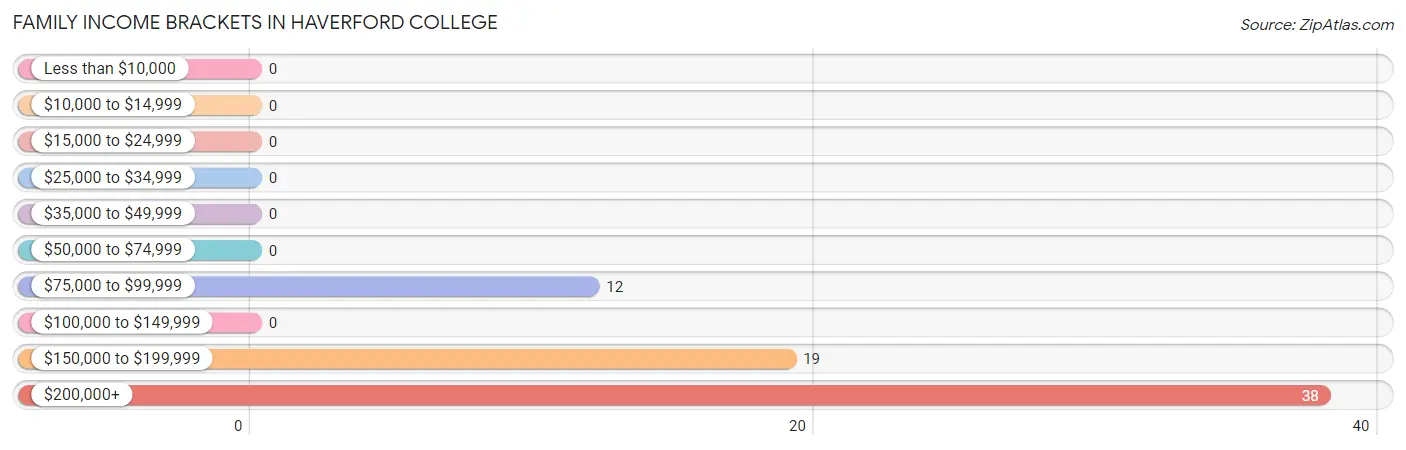
| Income Bracket | # Families | % Families |
| Less than $10,000 | 0 | 0.0% |
| $10,000 to $14,999 | 0 | 0.0% |
| $15,000 to $24,999 | 0 | 0.0% |
| $25,000 to $34,999 | 0 | 0.0% |
| $35,000 to $49,999 | 0 | 0.0% |
| $50,000 to $74,999 | 0 | 0.0% |
| $75,000 to $99,999 | 12 | 17.4% |
| $100,000 to $149,999 | 0 | 0.0% |
| $150,000 to $199,999 | 19 | 27.5% |
| $200,000+ | 38 | 55.1% |
Family Income by Famaliy Size in Haverford College
3-person families (43 | 62.3%) account for the highest median family income in Haverford College with $168,021 per family, while 3-person families (43 | 62.3%) have the highest median income of $56,007 per family member.
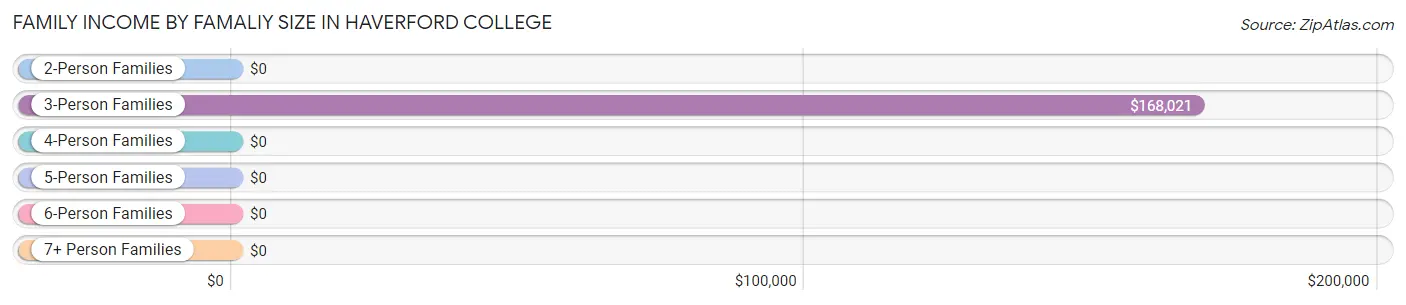
| Income Bracket | # Families | Median Income |
| 2-Person Families | 16 (23.2%) | $0 |
| 3-Person Families | 43 (62.3%) | $168,021 |
| 4-Person Families | 10 (14.5%) | $0 |
| 5-Person Families | 0 (0.0%) | $0 |
| 6-Person Families | 0 (0.0%) | $0 |
| 7+ Person Families | 0 (0.0%) | $0 |
| Total | 69 (100.0%) | $200,795 |
Family Income by Number of Earners in Haverford College
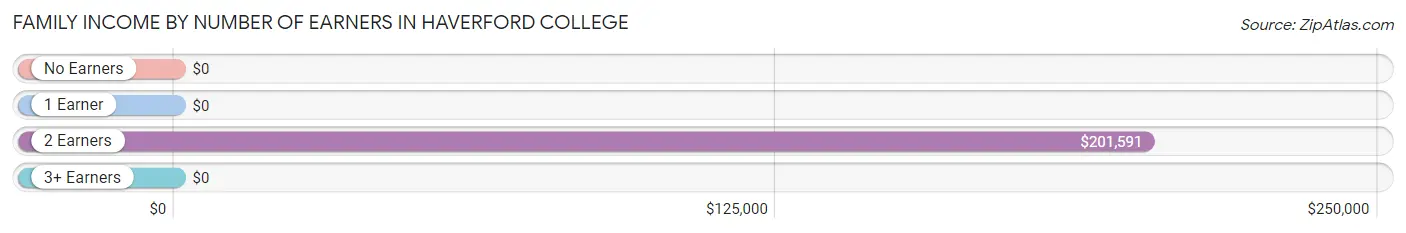
| Number of Earners | # Families | Median Income |
| No Earners | 5 (7.2%) | $0 |
| 1 Earner | 12 (17.4%) | $0 |
| 2 Earners | 52 (75.4%) | $201,591 |
| 3+ Earners | 0 (0.0%) | $0 |
| Total | 69 (100.0%) | $200,795 |
Household Income in Haverford College
Household Income Brackets in Haverford College
With 38 households falling in the category, the $200,000+ income range is the most frequent in Haverford College, accounting for 55.1% of all households.
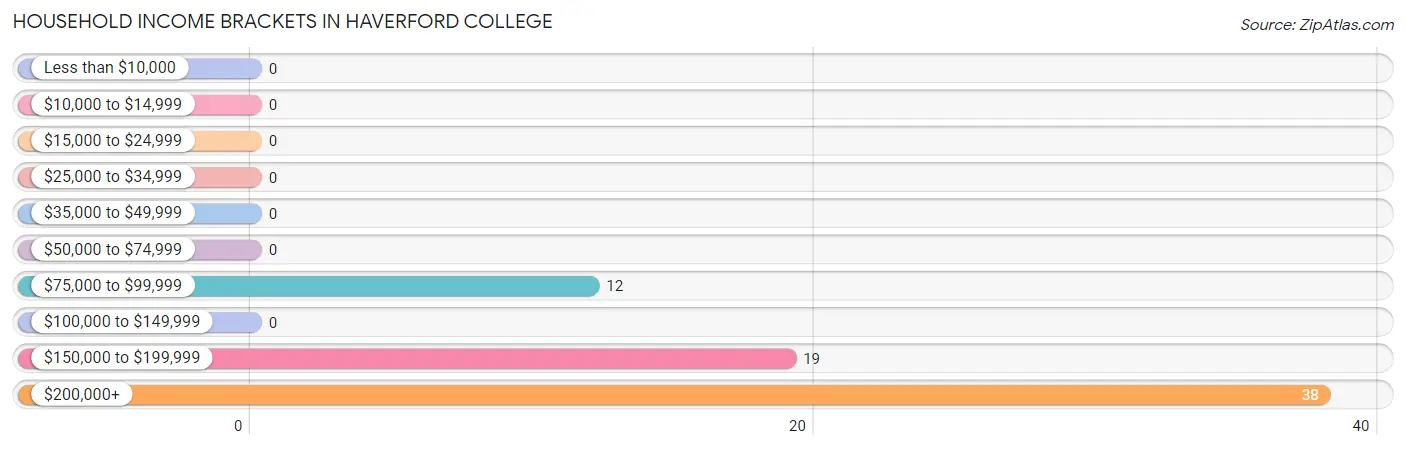
| Income Bracket | # Households | % Households |
| Less than $10,000 | 0 | 0.0% |
| $10,000 to $14,999 | 0 | 0.0% |
| $15,000 to $24,999 | 0 | 0.0% |
| $25,000 to $34,999 | 0 | 0.0% |
| $35,000 to $49,999 | 0 | 0.0% |
| $50,000 to $74,999 | 0 | 0.0% |
| $75,000 to $99,999 | 12 | 17.4% |
| $100,000 to $149,999 | 0 | 0.0% |
| $150,000 to $199,999 | 19 | 27.5% |
| $200,000+ | 38 | 55.1% |
Household Income by Householder Age in Haverford College
The median household income in Haverford College is $200,795, with the highest median household income of $250,001 found in the 25 to 44 years age bracket for the primary householder. A total of 29 households (42.0%) fall into this category.
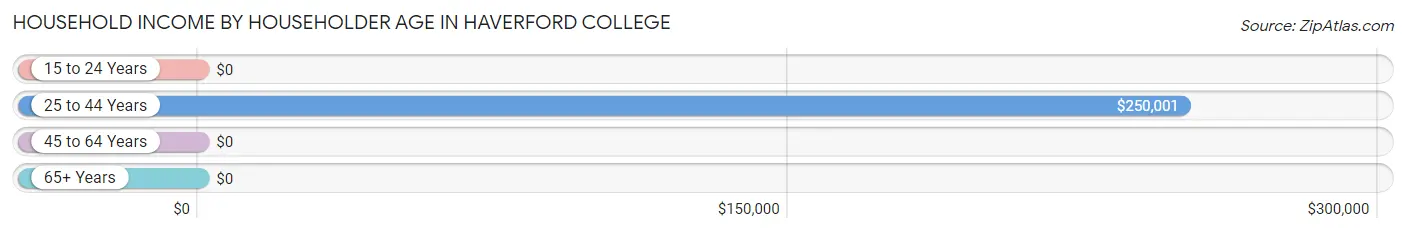
| Income Bracket | # Households | Median Income |
| 15 to 24 Years | 0 (0.0%) | $0 |
| 25 to 44 Years | 29 (42.0%) | $250,001 |
| 45 to 64 Years | 24 (34.8%) | $0 |
| 65+ Years | 16 (23.2%) | $0 |
| Total | 69 (100.0%) | $200,795 |
Poverty in Haverford College
Income Below Poverty by Sex and Age in Haverford College
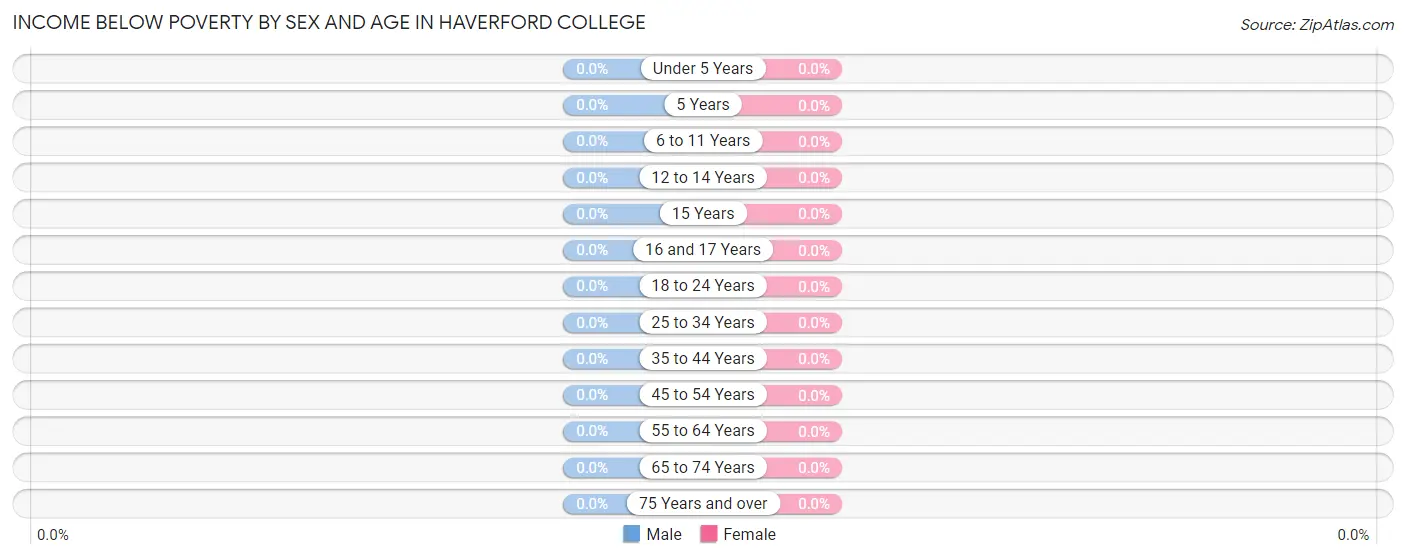
| Age Bracket | Male | Female |
| Under 5 Years | 0 (0.0%) | 0 (0.0%) |
| 5 Years | 0 (0.0%) | 0 (0.0%) |
| 6 to 11 Years | 0 (0.0%) | 0 (0.0%) |
| 12 to 14 Years | 0 (0.0%) | 0 (0.0%) |
| 15 Years | 0 (0.0%) | 0 (0.0%) |
| 16 and 17 Years | 0 (0.0%) | 0 (0.0%) |
| 18 to 24 Years | 0 (0.0%) | 0 (0.0%) |
| 25 to 34 Years | 0 (0.0%) | 0 (0.0%) |
| 35 to 44 Years | 0 (0.0%) | 0 (0.0%) |
| 45 to 54 Years | 0 (0.0%) | 0 (0.0%) |
| 55 to 64 Years | 0 (0.0%) | 0 (0.0%) |
| 65 to 74 Years | 0 (0.0%) | 0 (0.0%) |
| 75 Years and over | 0 (0.0%) | 0 (0.0%) |
| Total | 0 (0.0%) | 0 (0.0%) |
Income Above Poverty by Sex and Age in Haverford College
According to the poverty statistics in Haverford College, males aged under 5 years and females aged under 5 years are the age groups that are most secure financially, with 100.0% of males and 100.0% of females in these age groups living above the poverty line.
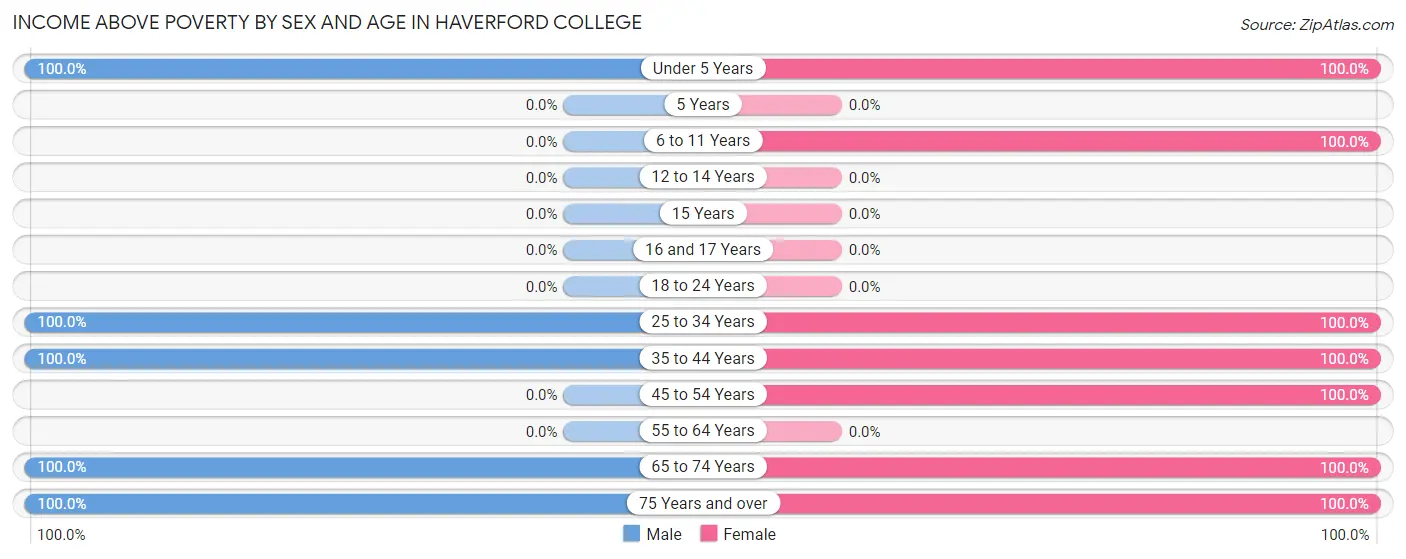
| Age Bracket | Male | Female |
| Under 5 Years | 7 (100.0%) | 55 (100.0%) |
| 5 Years | 0 (0.0%) | 0 (0.0%) |
| 6 to 11 Years | 0 (0.0%) | 1 (100.0%) |
| 12 to 14 Years | 0 (0.0%) | 0 (0.0%) |
| 15 Years | 0 (0.0%) | 0 (0.0%) |
| 16 and 17 Years | 0 (0.0%) | 0 (0.0%) |
| 18 to 24 Years | 0 (0.0%) | 0 (0.0%) |
| 25 to 34 Years | 7 (100.0%) | 7 (100.0%) |
| 35 to 44 Years | 30 (100.0%) | 22 (100.0%) |
| 45 to 54 Years | 0 (0.0%) | 24 (100.0%) |
| 55 to 64 Years | 0 (0.0%) | 0 (0.0%) |
| 65 to 74 Years | 11 (100.0%) | 13 (100.0%) |
| 75 Years and over | 5 (100.0%) | 23 (100.0%) |
| Total | 60 (100.0%) | 145 (100.0%) |
Income Below Poverty Among Married-Couple Families in Haverford College
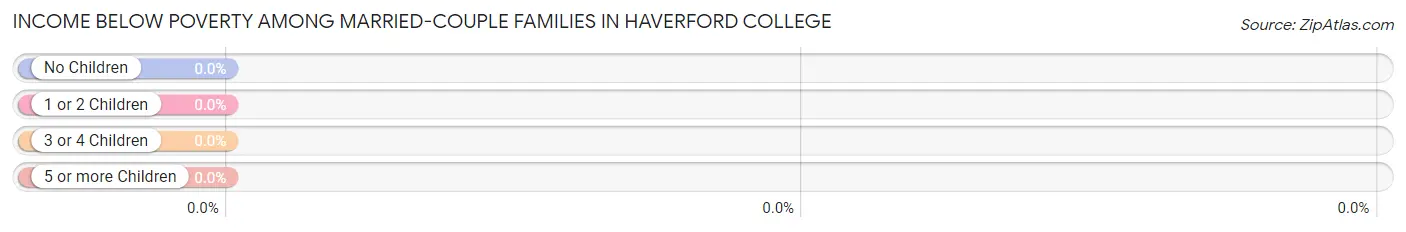
| Children | Above Poverty | Below Poverty |
| No Children | 16 (100.0%) | 0 (0.0%) |
| 1 or 2 Children | 41 (100.0%) | 0 (0.0%) |
| 3 or 4 Children | 0 (0.0%) | 0 (0.0%) |
| 5 or more Children | 0 (0.0%) | 0 (0.0%) |
| Total | 57 (100.0%) | 0 (0.0%) |
Income Below Poverty Among Single-Parent Households in Haverford College
| Children | Single Father | Single Mother |
| No Children | 0 (0.0%) | 0 (0.0%) |
| 1 or 2 Children | 0 (0.0%) | 0 (0.0%) |
| 3 or 4 Children | 0 (0.0%) | 0 (0.0%) |
| 5 or more Children | 0 (0.0%) | 0 (0.0%) |
| Total | 0 (0.0%) | 0 (0.0%) |
Income Below Poverty Among Married-Couple vs Single-Parent Households in Haverford College
| Children | Married-Couple Families | Single-Parent Households |
| No Children | 0 (0.0%) | 0 (0.0%) |
| 1 or 2 Children | 0 (0.0%) | 0 (0.0%) |
| 3 or 4 Children | 0 (0.0%) | 0 (0.0%) |
| 5 or more Children | 0 (0.0%) | 0 (0.0%) |
| Total | 0 (0.0%) | 0 (0.0%) |
Race in Haverford College
The most populous races in Haverford College are White / Caucasian (924 | 63.2%), Two or more Races (248 | 17.0%), and Hispanic or Latino (165 | 11.3%).
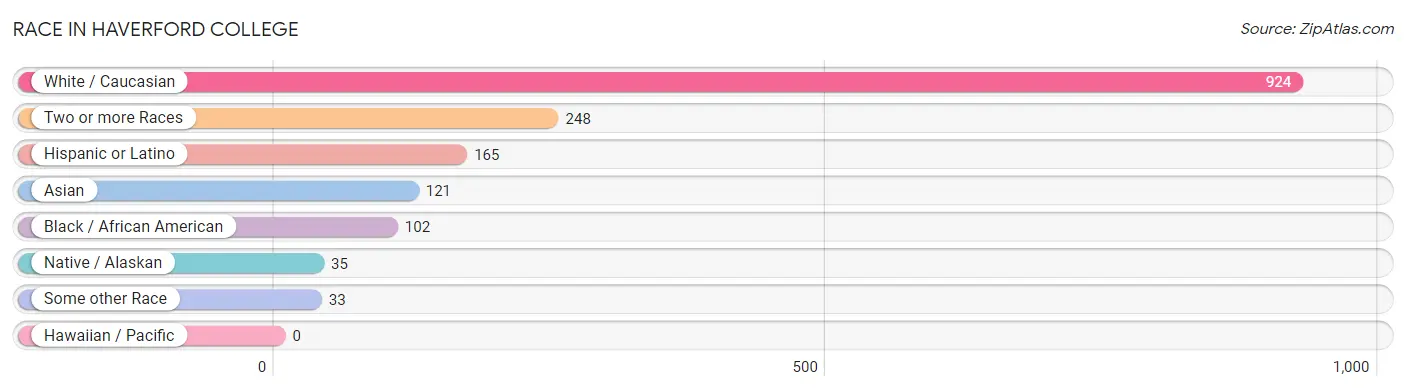
| Race | # Population | % Population |
| Asian | 121 | 8.3% |
| Black / African American | 102 | 7.0% |
| Hawaiian / Pacific | 0 | 0.0% |
| Hispanic or Latino | 165 | 11.3% |
| Native / Alaskan | 35 | 2.4% |
| White / Caucasian | 924 | 63.2% |
| Two or more Races | 248 | 17.0% |
| Some other Race | 33 | 2.3% |
| Total | 1,463 | 100.0% |
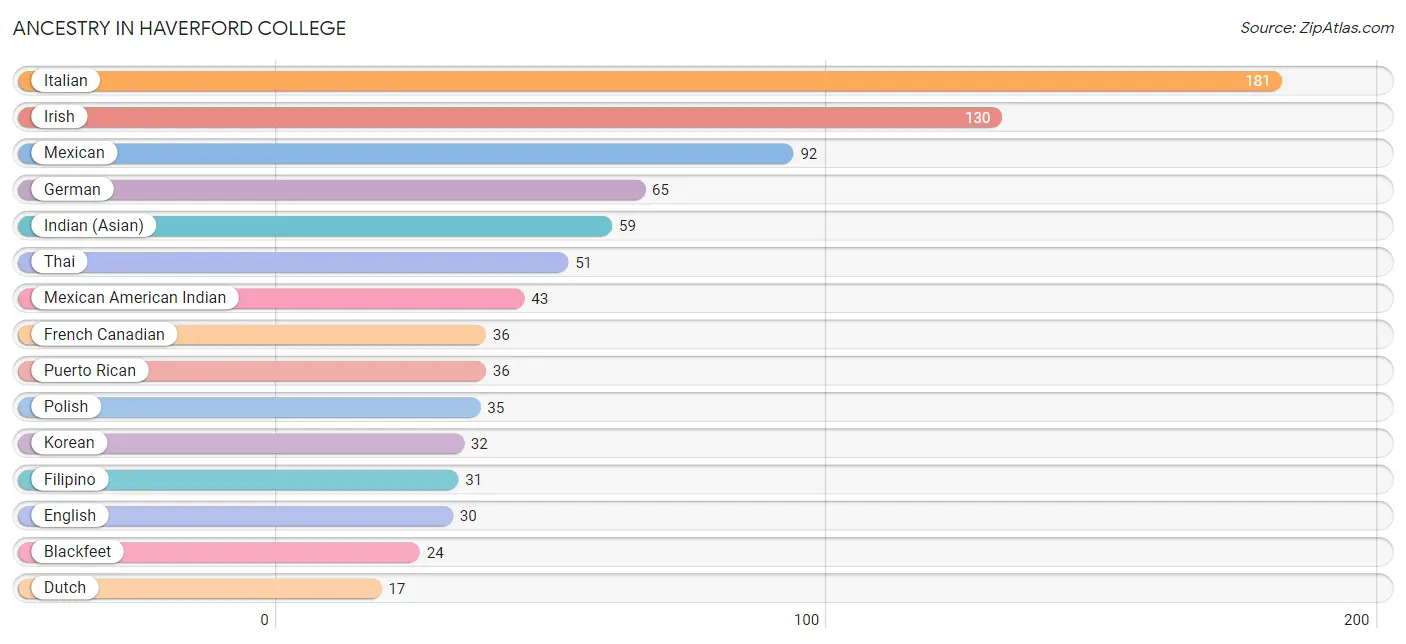
Ancestry in Haverford College
The most populous ancestries reported in Haverford College are Italian (181 | 12.4%), Irish (130 | 8.9%), Mexican (92 | 6.3%), German (65 | 4.4%), and Indian (Asian) (59 | 4.0%), together accounting for 36.0% of all Haverford College residents.
| Ancestry | # Population | % Population |
| American | 5 | 0.3% |
| Blackfeet | 24 | 1.6% |
| Brazilian | 1 | 0.1% |
| Burmese | 11 | 0.7% |
| Colombian | 15 | 1.0% |
| Dutch | 17 | 1.2% |
| English | 30 | 2.1% |
| Filipino | 31 | 2.1% |
| French | 17 | 1.2% |
| French Canadian | 36 | 2.5% |
| German | 65 | 4.4% |
| Greek | 9 | 0.6% |
| Indian (Asian) | 59 | 4.0% |
| Indonesian | 3 | 0.2% |
| Irish | 130 | 8.9% |
| Italian | 181 | 12.4% |
| Korean | 32 | 2.2% |
| Mexican | 92 | 6.3% |
| Mexican American Indian | 43 | 2.9% |
| Mongolian | 5 | 0.3% |
| Okinawan | 4 | 0.3% |
| Polish | 35 | 2.4% |
| Portuguese | 17 | 1.2% |
| Puerto Rican | 36 | 2.5% |
| Russian | 13 | 0.9% |
| Scotch-Irish | 8 | 0.5% |
| Scottish | 6 | 0.4% |
| South American | 15 | 1.0% |
| Sri Lankan | 6 | 0.4% |
| Swedish | 4 | 0.3% |
| Thai | 51 | 3.5% |
| Ukrainian | 4 | 0.3% |
| Welsh | 13 | 0.9% | View All 33 Rows |
Immigrants in Haverford College
The most numerous immigrant groups reported in Haverford College came from Latin America (67 | 4.6%), Asia (54 | 3.7%), Central America (42 | 2.9%), Mexico (42 | 2.9%), and Eastern Asia (36 | 2.5%), together accounting for 16.5% of all Haverford College residents.
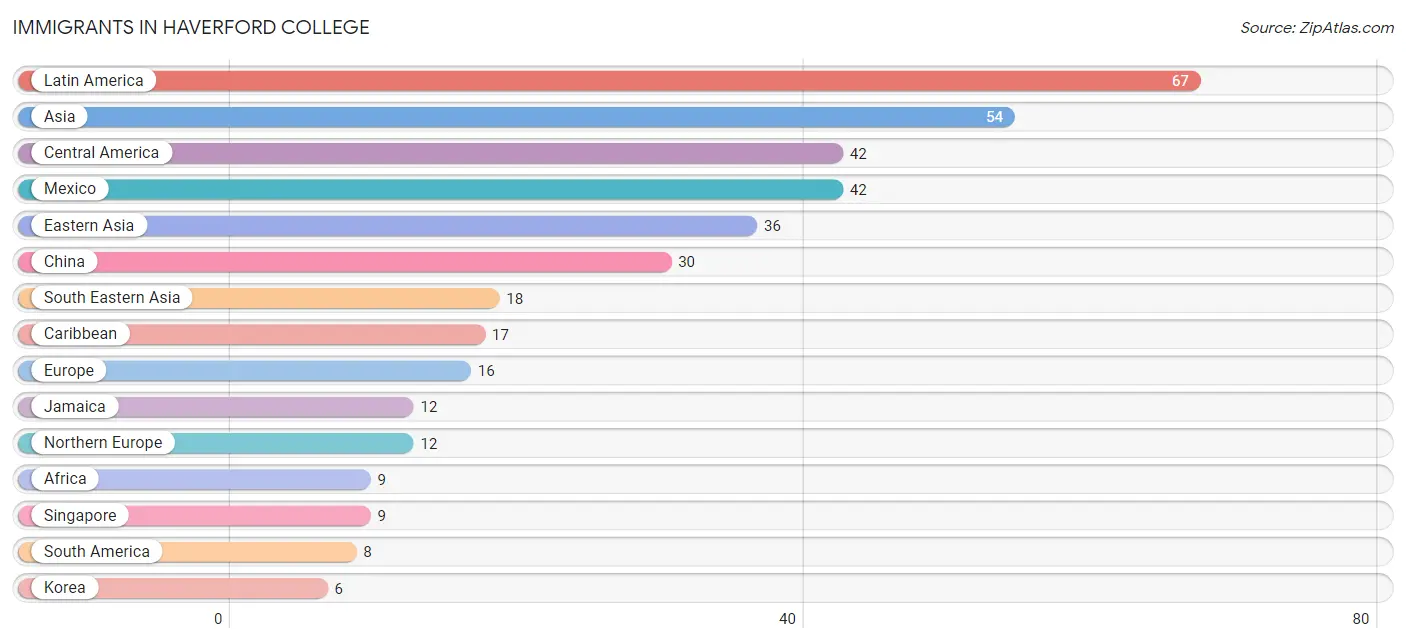
| Immigration Origin | # Population | % Population |
| Africa | 9 | 0.6% |
| Asia | 54 | 3.7% |
| Cameroon | 4 | 0.3% |
| Canada | 4 | 0.3% |
| Caribbean | 17 | 1.2% |
| Central America | 42 | 2.9% |
| China | 30 | 2.1% |
| Eastern Africa | 5 | 0.3% |
| Eastern Asia | 36 | 2.5% |
| Ecuador | 4 | 0.3% |
| Europe | 16 | 1.1% |
| France | 4 | 0.3% |
| Haiti | 5 | 0.3% |
| Jamaica | 12 | 0.8% |
| Korea | 6 | 0.4% |
| Latin America | 67 | 4.6% |
| Mexico | 42 | 2.9% |
| Middle Africa | 4 | 0.3% |
| Northern Europe | 12 | 0.8% |
| Philippines | 6 | 0.4% |
| Singapore | 9 | 0.6% |
| South America | 8 | 0.5% |
| South Eastern Asia | 18 | 1.2% |
| Western Europe | 4 | 0.3% | View All 24 Rows |
Sex and Age in Haverford College
Sex and Age in Haverford College
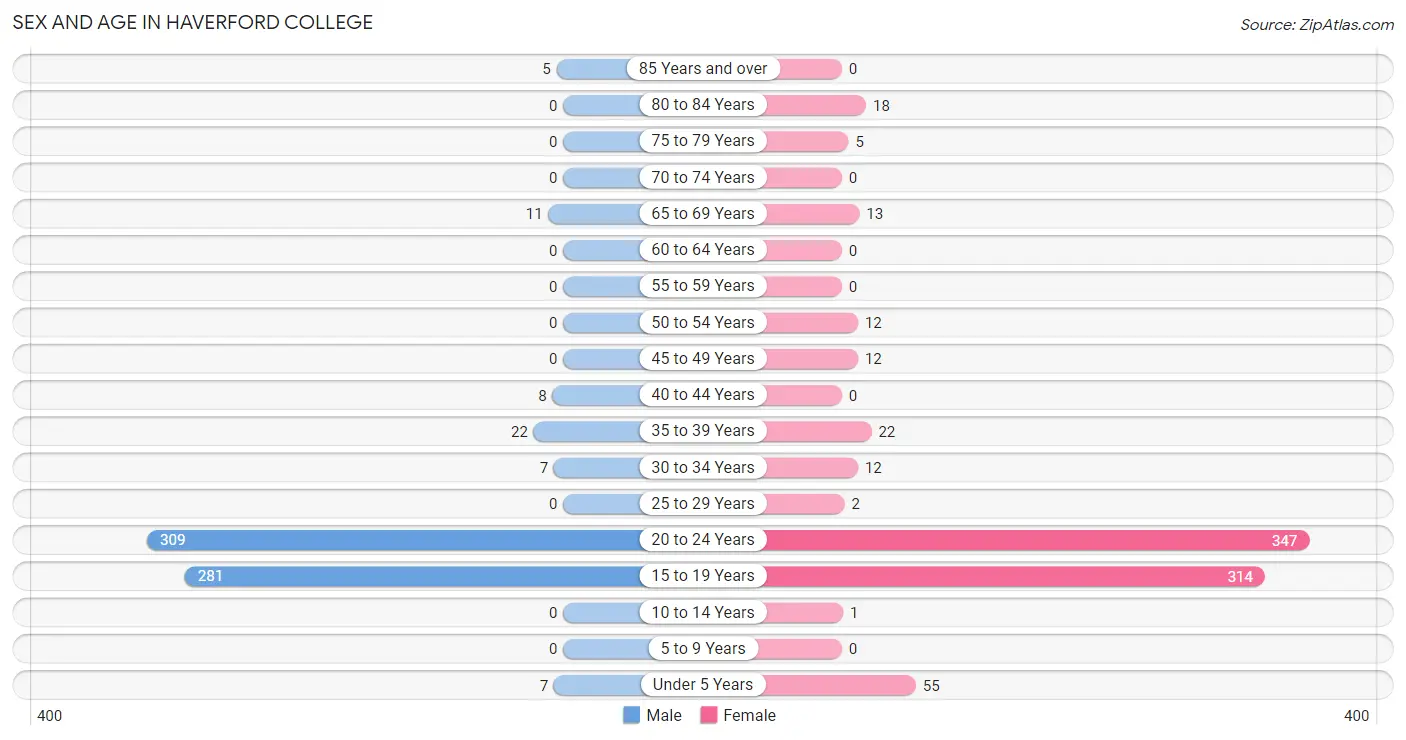
The most populous age groups in Haverford College are 20 to 24 Years (309 | 47.5%) for men and 20 to 24 Years (347 | 42.7%) for women.
| Age Bracket | Male | Female |
| Under 5 Years | 7 (1.1%) | 55 (6.8%) |
| 5 to 9 Years | 0 (0.0%) | 0 (0.0%) |
| 10 to 14 Years | 0 (0.0%) | 1 (0.1%) |
| 15 to 19 Years | 281 (43.2%) | 314 (38.6%) |
| 20 to 24 Years | 309 (47.5%) | 347 (42.7%) |
| 25 to 29 Years | 0 (0.0%) | 2 (0.3%) |
| 30 to 34 Years | 7 (1.1%) | 12 (1.5%) |
| 35 to 39 Years | 22 (3.4%) | 22 (2.7%) |
| 40 to 44 Years | 8 (1.2%) | 0 (0.0%) |
| 45 to 49 Years | 0 (0.0%) | 12 (1.5%) |
| 50 to 54 Years | 0 (0.0%) | 12 (1.5%) |
| 55 to 59 Years | 0 (0.0%) | 0 (0.0%) |
| 60 to 64 Years | 0 (0.0%) | 0 (0.0%) |
| 65 to 69 Years | 11 (1.7%) | 13 (1.6%) |
| 70 to 74 Years | 0 (0.0%) | 0 (0.0%) |
| 75 to 79 Years | 0 (0.0%) | 5 (0.6%) |
| 80 to 84 Years | 0 (0.0%) | 18 (2.2%) |
| 85 Years and over | 5 (0.8%) | 0 (0.0%) |
| Total | 650 (100.0%) | 813 (100.0%) |
Families and Households in Haverford College
Median Family Size in Haverford College
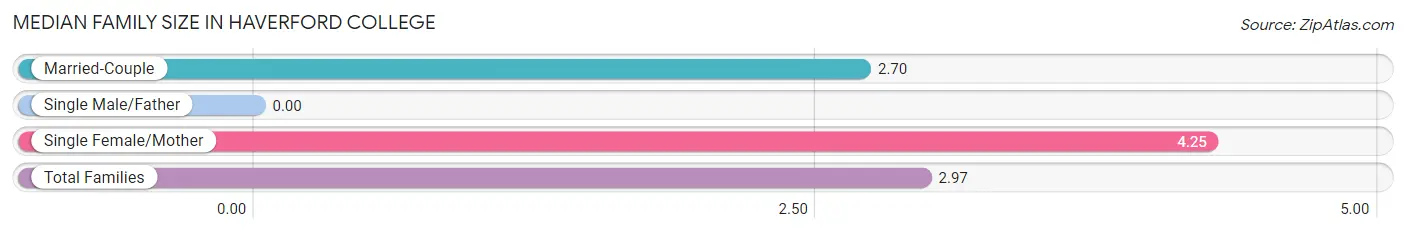
| Family Type | # Families | Family Size |
| Married-Couple | 57 (82.6%) | 2.70 |
| Single Male/Father | 0 (0.0%) | - |
| Single Female/Mother | 12 (17.4%) | 4.25 |
| Total Families | 69 (100.0%) | 2.97 |
Median Household Size in Haverford College
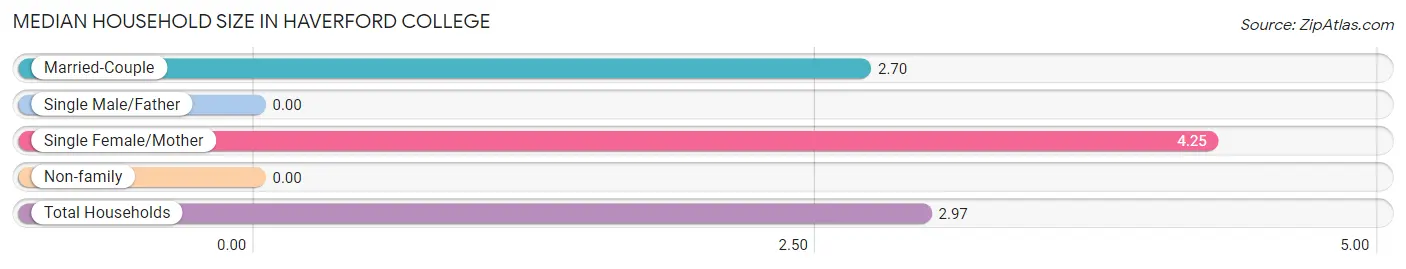
| Household Type | # Households | Household Size |
| Married-Couple | 57 (82.6%) | 2.70 |
| Single Male/Father | 0 (0.0%) | - |
| Single Female/Mother | 12 (17.4%) | 4.25 |
| Non-family | 0 (0.0%) | - |
| Total Households | 69 (100.0%) | 2.97 |
Household Size by Marriage Status in Haverford College
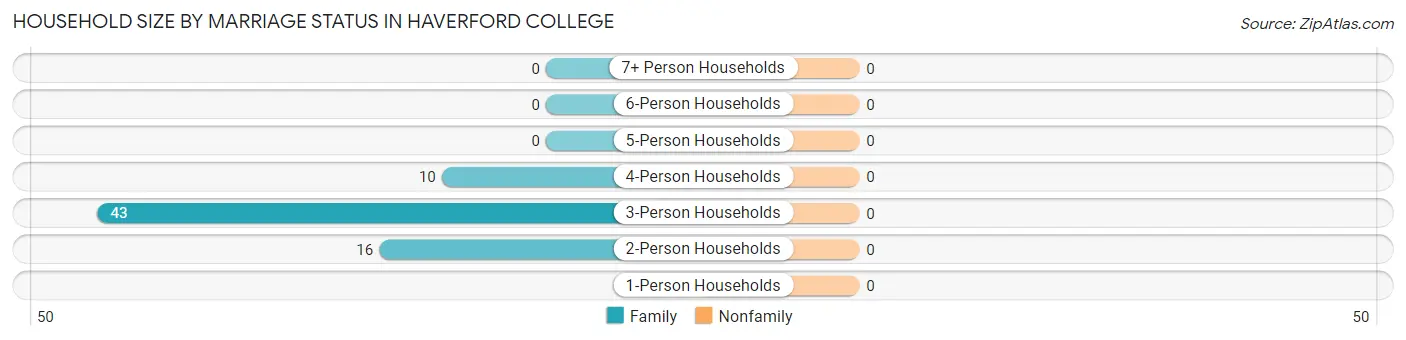
| Household Size | Family Households | Nonfamily Households |
| 1-Person Households | - | 0 (0.0%) |
| 2-Person Households | 16 (23.2%) | 0 (0.0%) |
| 3-Person Households | 43 (62.3%) | 0 (0.0%) |
| 4-Person Households | 10 (14.5%) | 0 (0.0%) |
| 5-Person Households | 0 (0.0%) | 0 (0.0%) |
| 6-Person Households | 0 (0.0%) | 0 (0.0%) |
| 7+ Person Households | 0 (0.0%) | 0 (0.0%) |
| Total | 69 (100.0%) | 0 (0.0%) |
Female Fertility in Haverford College
Fertility by Age in Haverford College
Average fertility rate in Haverford College is 14.0 births per 1,000 women. Women in the age bracket of 35 to 50 years have the highest fertility rate with 217.0 births per 1,000 women. Women in the age bracket of 35 to 50 years acount for 100.0% of all women with births.
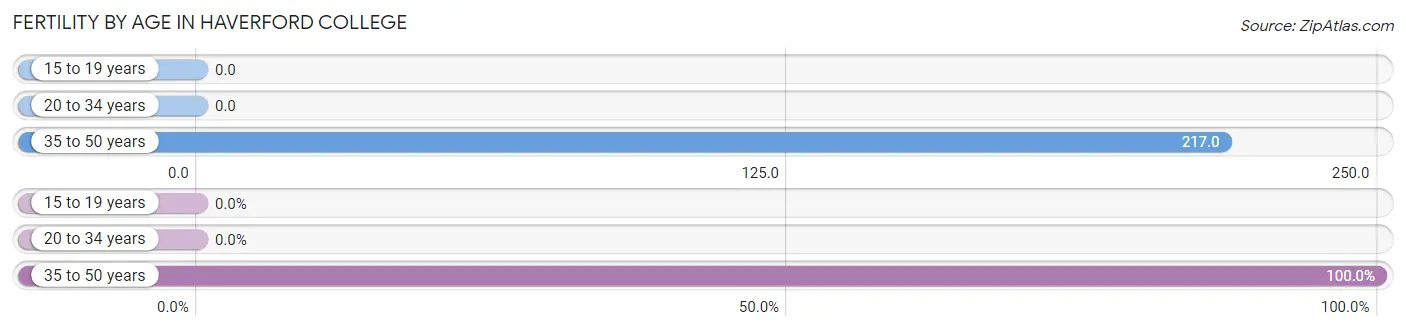
| Age Bracket | Women with Births | Births / 1,000 Women |
| 15 to 19 years | 0 (0.0%) | 0.0 |
| 20 to 34 years | 0 (0.0%) | 0.0 |
| 35 to 50 years | 10 (100.0%) | 217.0 |
| Total | 10 (100.0%) | 14.0 |
Fertility by Age by Marriage Status in Haverford College
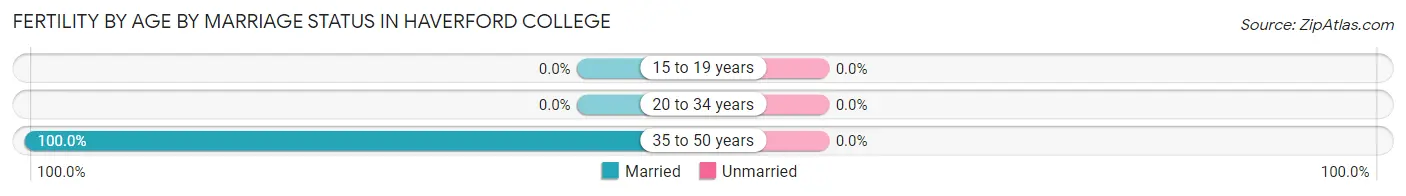
| Age Bracket | Married | Unmarried |
| 15 to 19 years | 0 (0.0%) | 0 (0.0%) |
| 20 to 34 years | 0 (0.0%) | 0 (0.0%) |
| 35 to 50 years | 10 (100.0%) | 0 (0.0%) |
| Total | 10 (100.0%) | 0 (0.0%) |
Fertility by Education in Haverford College
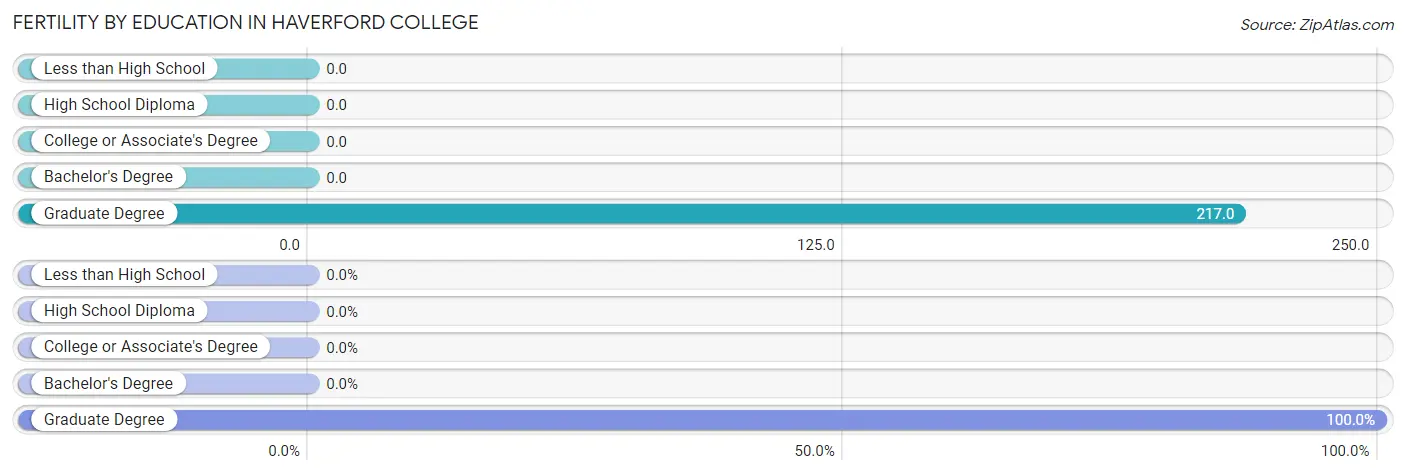
| Educational Attainment | Women with Births | Births / 1,000 Women |
| Less than High School | 0 (0.0%) | 0.0 |
| High School Diploma | 0 (0.0%) | 0.0 |
| College or Associate's Degree | 0 (0.0%) | 0.0 |
| Bachelor's Degree | 0 (0.0%) | 0.0 |
| Graduate Degree | 10 (100.0%) | 217.0 |
| Total | 10 (100.0%) | 14.0 |
Fertility by Education by Marriage Status in Haverford College
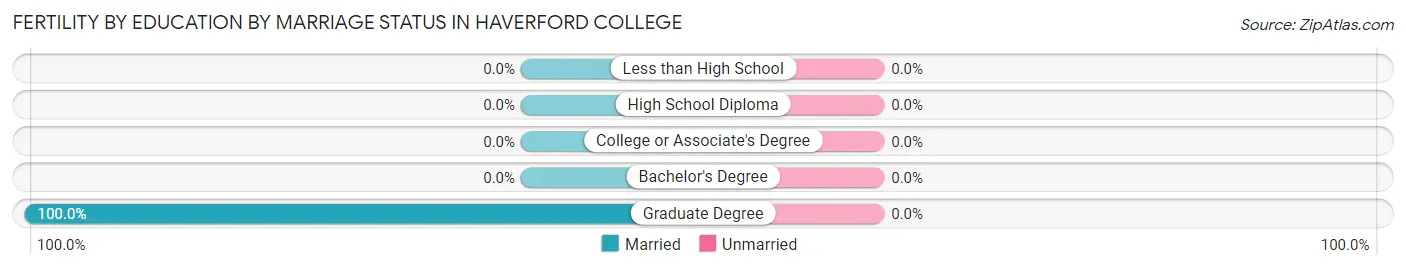
| Educational Attainment | Married | Unmarried |
| Less than High School | 0 (0.0%) | 0 (0.0%) |
| High School Diploma | 0 (0.0%) | 0 (0.0%) |
| College or Associate's Degree | 0 (0.0%) | 0 (0.0%) |
| Bachelor's Degree | 0 (0.0%) | 0 (0.0%) |
| Graduate Degree | 10 (100.0%) | 0 (0.0%) |
| Total | 10 (100.0%) | 0 (0.0%) |
Employment Characteristics in Haverford College
Employment by Class of Employer in Haverford College
Among the 548 employed individuals in Haverford College, private company employees (340 | 62.0%), not-for-profit organizations (182 | 33.2%), and self-employed (not incorporated) (13 | 2.4%) make up the most common classes of employment.
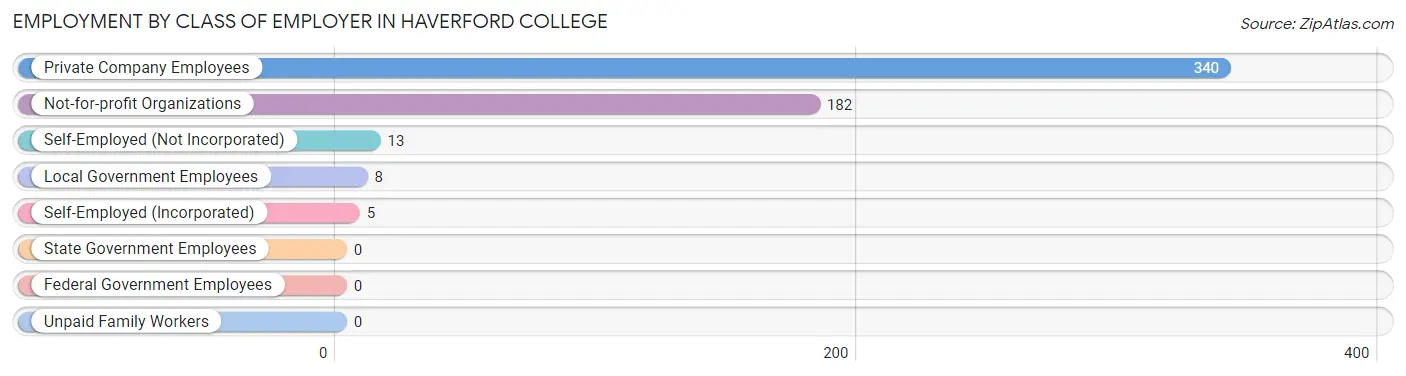
| Employer Class | # Employees | % Employees |
| Private Company Employees | 340 | 62.0% |
| Self-Employed (Incorporated) | 5 | 0.9% |
| Self-Employed (Not Incorporated) | 13 | 2.4% |
| Not-for-profit Organizations | 182 | 33.2% |
| Local Government Employees | 8 | 1.5% |
| State Government Employees | 0 | 0.0% |
| Federal Government Employees | 0 | 0.0% |
| Unpaid Family Workers | 0 | 0.0% |
| Total | 548 | 100.0% |
Employment Status by Age in Haverford College
According to the labor force statistics for Haverford College, out of the total population over 16 years of age (1,400), 47.4% or 664 individuals are in the labor force, with 9.8% or 65 of them unemployed. The age group with the highest labor force participation rate is 25 to 29 years, with 100.0% or 2 individuals in the labor force. Within the labor force, the 35 to 44 years age range has the highest percentage of unemployed individuals, with 23.1% or 12 of them being unemployed.
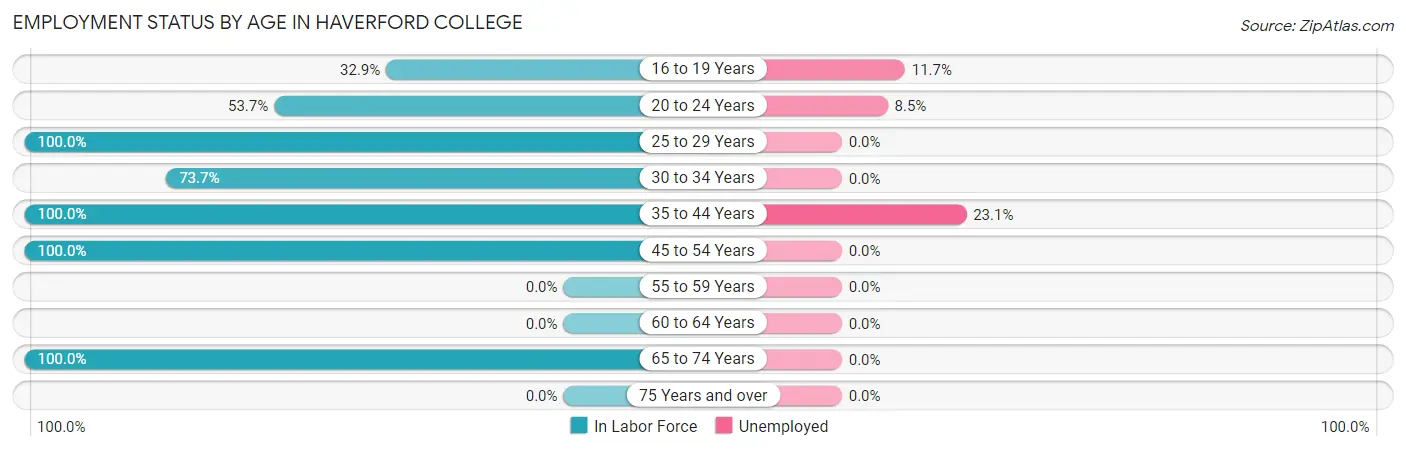
| Age Bracket | In Labor Force | Unemployed |
| 16 to 19 Years | 196 (32.9%) | 23 (11.7%) |
| 20 to 24 Years | 352 (53.7%) | 30 (8.5%) |
| 25 to 29 Years | 2 (100.0%) | 0 (0.0%) |
| 30 to 34 Years | 14 (73.7%) | 0 (0.0%) |
| 35 to 44 Years | 52 (100.0%) | 12 (23.1%) |
| 45 to 54 Years | 24 (100.0%) | 0 (0.0%) |
| 55 to 59 Years | 0 (0.0%) | 0 (0.0%) |
| 60 to 64 Years | 0 (0.0%) | 0 (0.0%) |
| 65 to 74 Years | 24 (100.0%) | 0 (0.0%) |
| 75 Years and over | 0 (0.0%) | 0 (0.0%) |
| Total | 664 (47.4%) | 65 (9.8%) |
Employment Status by Educational Attainment in Haverford College
According to labor force statistics for Haverford College, 94.8% of individuals (92) out of the total population between 25 and 64 years of age (97) are in the labor force, with 13.0% or 12 of them being unemployed. The group with the highest labor force participation rate are those with the educational attainment of bachelor's degree or higher, with 100.0% or 90 individuals in the labor force. Within the labor force, individuals with bachelor's degree or higher education have the highest percentage of unemployment, with 13.3% or 12 of them being unemployed.
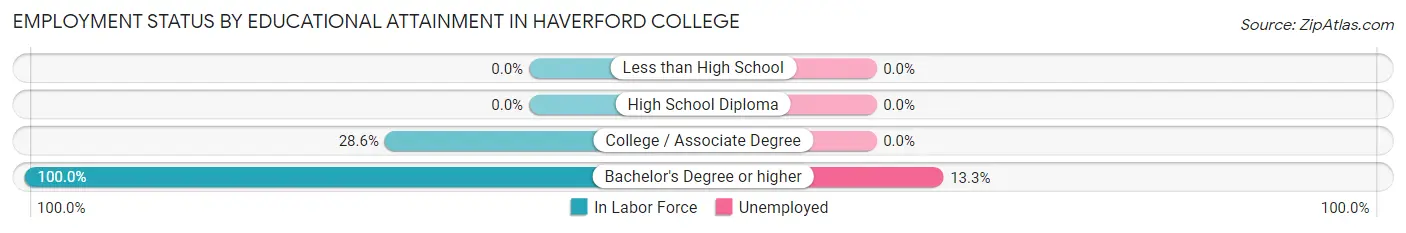
| Educational Attainment | In Labor Force | Unemployed |
| Less than High School | 0 (0.0%) | 0 (0.0%) |
| High School Diploma | 0 (0.0%) | 0 (0.0%) |
| College / Associate Degree | 2 (28.6%) | 0 (0.0%) |
| Bachelor's Degree or higher | 90 (100.0%) | 12 (13.3%) |
| Total | 92 (94.8%) | 13 (13.0%) |
Employment Occupations by Sex in Haverford College
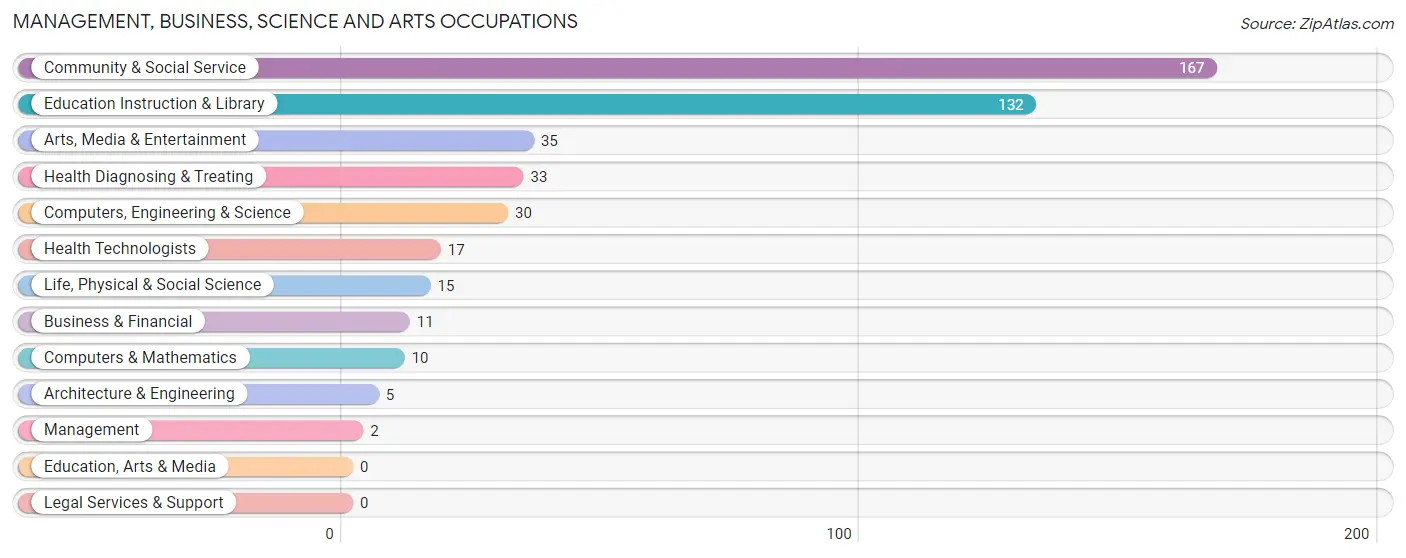
Management, Business, Science and Arts Occupations
The most common Management, Business, Science and Arts occupations in Haverford College are Community & Social Service (167 | 27.9%), Education Instruction & Library (132 | 22.0%), Arts, Media & Entertainment (35 | 5.8%), Health Diagnosing & Treating (33 | 5.5%), and Computers, Engineering & Science (30 | 5.0%).
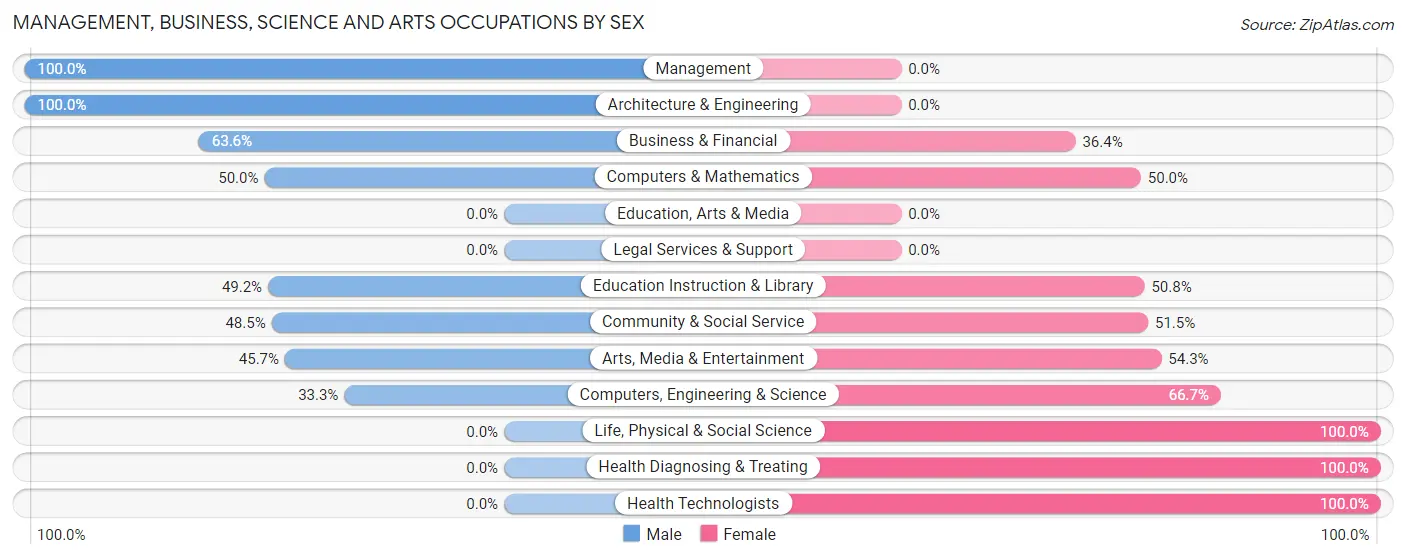
Management, Business, Science and Arts Occupations by Sex
Within the Management, Business, Science and Arts occupations in Haverford College, the most male-oriented occupations are Management (100.0%), Architecture & Engineering (100.0%), and Business & Financial (63.6%), while the most female-oriented occupations are Life, Physical & Social Science (100.0%), Health Diagnosing & Treating (100.0%), and Health Technologists (100.0%).
| Occupation | Male | Female |
| Management | 2 (100.0%) | 0 (0.0%) |
| Business & Financial | 7 (63.6%) | 4 (36.4%) |
| Computers, Engineering & Science | 10 (33.3%) | 20 (66.7%) |
| Computers & Mathematics | 5 (50.0%) | 5 (50.0%) |
| Architecture & Engineering | 5 (100.0%) | 0 (0.0%) |
| Life, Physical & Social Science | 0 (0.0%) | 15 (100.0%) |
| Community & Social Service | 81 (48.5%) | 86 (51.5%) |
| Education, Arts & Media | 0 (0.0%) | 0 (0.0%) |
| Legal Services & Support | 0 (0.0%) | 0 (0.0%) |
| Education Instruction & Library | 65 (49.2%) | 67 (50.8%) |
| Arts, Media & Entertainment | 16 (45.7%) | 19 (54.3%) |
| Health Diagnosing & Treating | 0 (0.0%) | 33 (100.0%) |
| Health Technologists | 0 (0.0%) | 17 (100.0%) |
| Total (Category) | 100 (41.1%) | 143 (58.9%) |
| Total (Overall) | 244 (40.7%) | 355 (59.3%) |
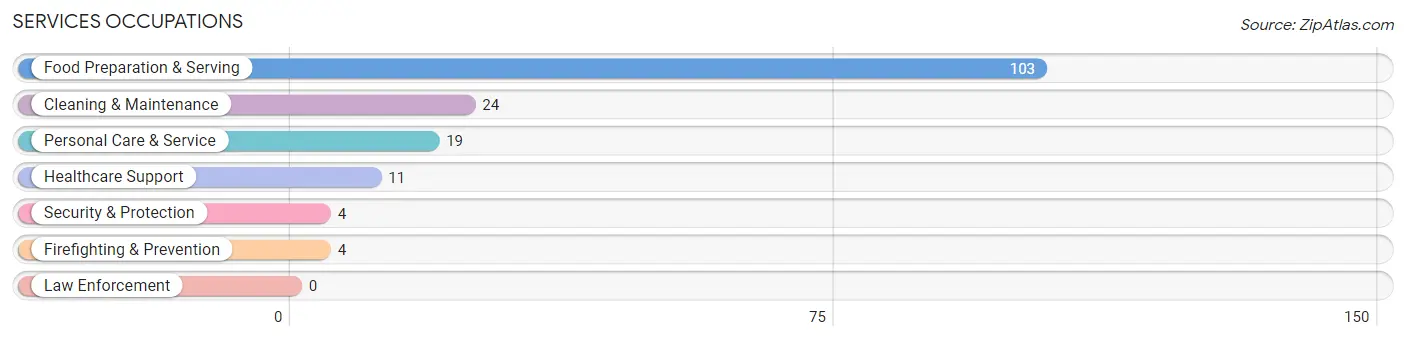
Services Occupations
The most common Services occupations in Haverford College are Food Preparation & Serving (103 | 17.2%), Cleaning & Maintenance (24 | 4.0%), Personal Care & Service (19 | 3.2%), Healthcare Support (11 | 1.8%), and Security & Protection (4 | 0.7%).
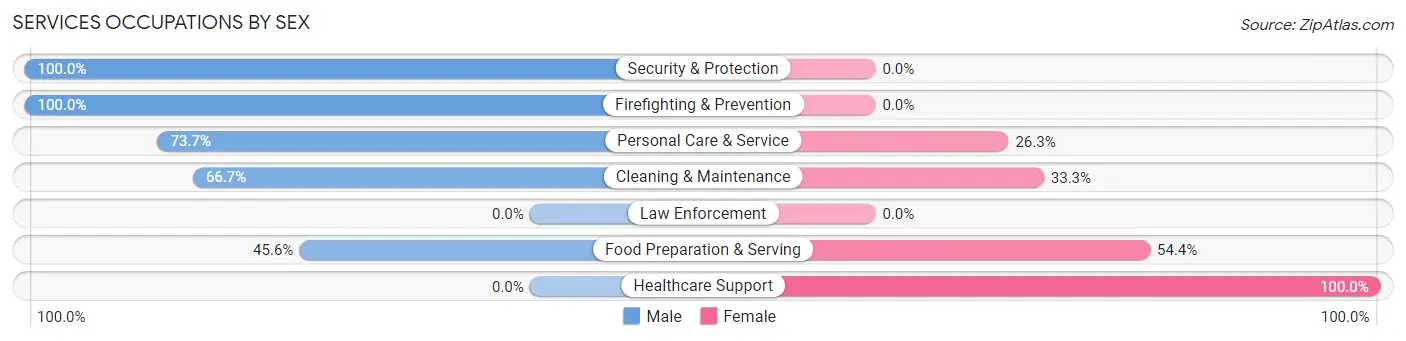
Services Occupations by Sex
Within the Services occupations in Haverford College, the most male-oriented occupations are Security & Protection (100.0%), Firefighting & Prevention (100.0%), and Personal Care & Service (73.7%), while the most female-oriented occupations are Healthcare Support (100.0%), Food Preparation & Serving (54.4%), and Cleaning & Maintenance (33.3%).
| Occupation | Male | Female |
| Healthcare Support | 0 (0.0%) | 11 (100.0%) |
| Security & Protection | 4 (100.0%) | 0 (0.0%) |
| Firefighting & Prevention | 4 (100.0%) | 0 (0.0%) |
| Law Enforcement | 0 (0.0%) | 0 (0.0%) |
| Food Preparation & Serving | 47 (45.6%) | 56 (54.4%) |
| Cleaning & Maintenance | 16 (66.7%) | 8 (33.3%) |
| Personal Care & Service | 14 (73.7%) | 5 (26.3%) |
| Total (Category) | 81 (50.3%) | 80 (49.7%) |
| Total (Overall) | 244 (40.7%) | 355 (59.3%) |
Sales and Office Occupations
The most common Sales and Office occupations in Haverford College are Sales & Related (90 | 15.0%), and Office & Administration (66 | 11.0%).

Sales and Office Occupations by Sex
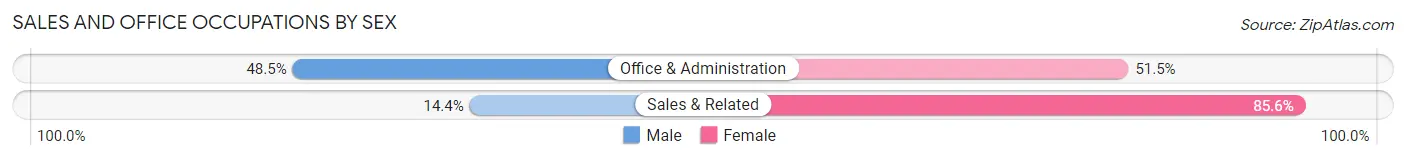
| Occupation | Male | Female |
| Sales & Related | 13 (14.4%) | 77 (85.6%) |
| Office & Administration | 32 (48.5%) | 34 (51.5%) |
| Total (Category) | 45 (28.8%) | 111 (71.2%) |
| Total (Overall) | 244 (40.7%) | 355 (59.3%) |
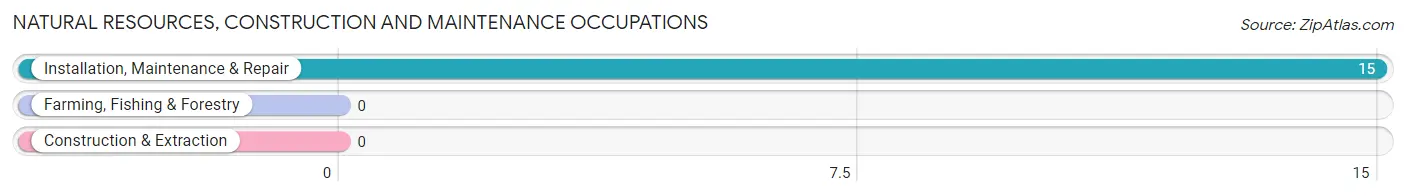
Natural Resources, Construction and Maintenance Occupations
The most common Natural Resources, Construction and Maintenance occupations in Haverford College are , and Installation, Maintenance & Repair (15 | 2.5%).
Natural Resources, Construction and Maintenance Occupations by Sex
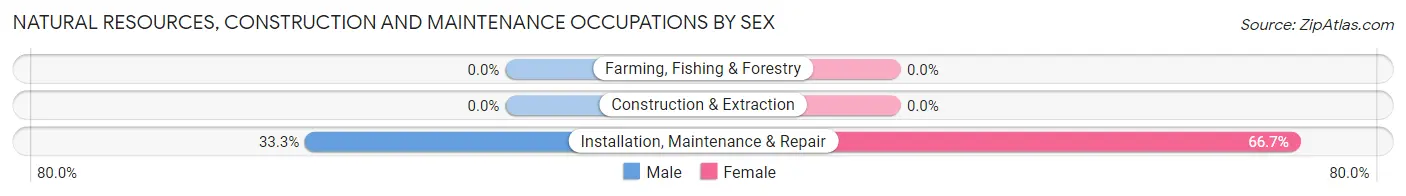
| Occupation | Male | Female |
| Farming, Fishing & Forestry | 0 (0.0%) | 0 (0.0%) |
| Construction & Extraction | 0 (0.0%) | 0 (0.0%) |
| Installation, Maintenance & Repair | 5 (33.3%) | 10 (66.7%) |
| Total (Category) | 5 (33.3%) | 10 (66.7%) |
| Total (Overall) | 244 (40.7%) | 355 (59.3%) |
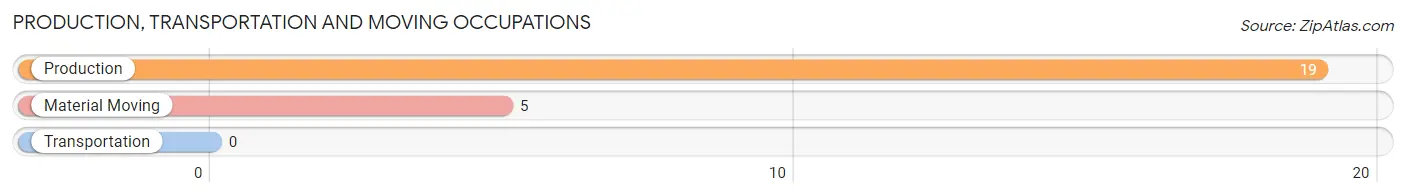
Production, Transportation and Moving Occupations
The most common Production, Transportation and Moving occupations in Haverford College are Production (19 | 3.2%), and Material Moving (5 | 0.8%).
Production, Transportation and Moving Occupations by Sex
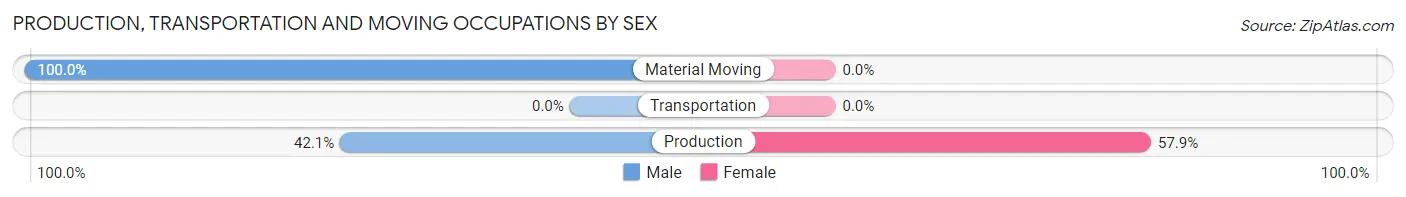
| Occupation | Male | Female |
| Production | 8 (42.1%) | 11 (57.9%) |
| Transportation | 0 (0.0%) | 0 (0.0%) |
| Material Moving | 5 (100.0%) | 0 (0.0%) |
| Total (Category) | 13 (54.2%) | 11 (45.8%) |
| Total (Overall) | 244 (40.7%) | 355 (59.3%) |
Employment Industries by Sex in Haverford College
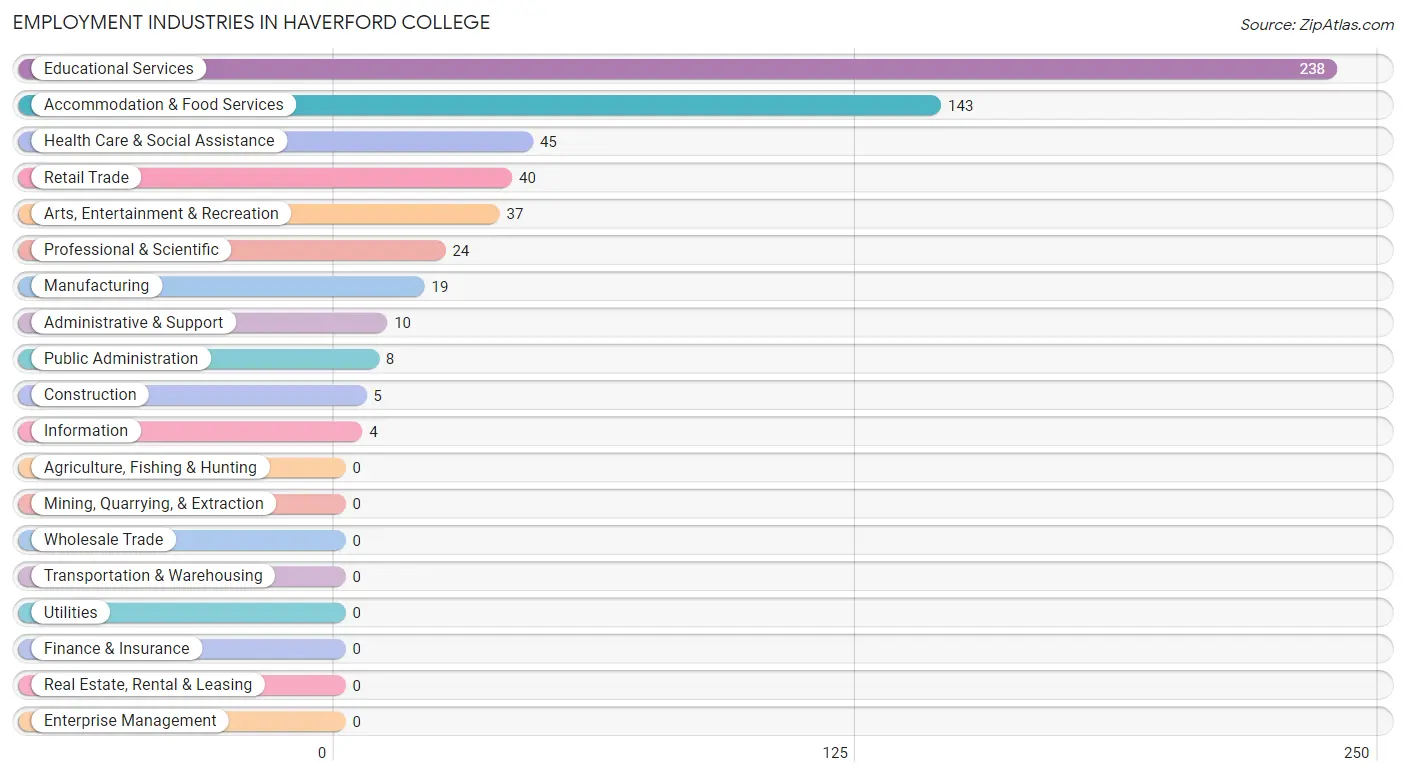
Employment Industries in Haverford College
The major employment industries in Haverford College include Educational Services (238 | 39.7%), Accommodation & Food Services (143 | 23.9%), Health Care & Social Assistance (45 | 7.5%), Retail Trade (40 | 6.7%), and Arts, Entertainment & Recreation (37 | 6.2%).
Employment Industries by Sex in Haverford College
The Haverford College industries that see more men than women are Construction (100.0%), Accommodation & Food Services (55.9%), and Professional & Scientific (45.8%), whereas the industries that tend to have a higher number of women are Information (100.0%), Administrative & Support (100.0%), and Public Administration (100.0%).
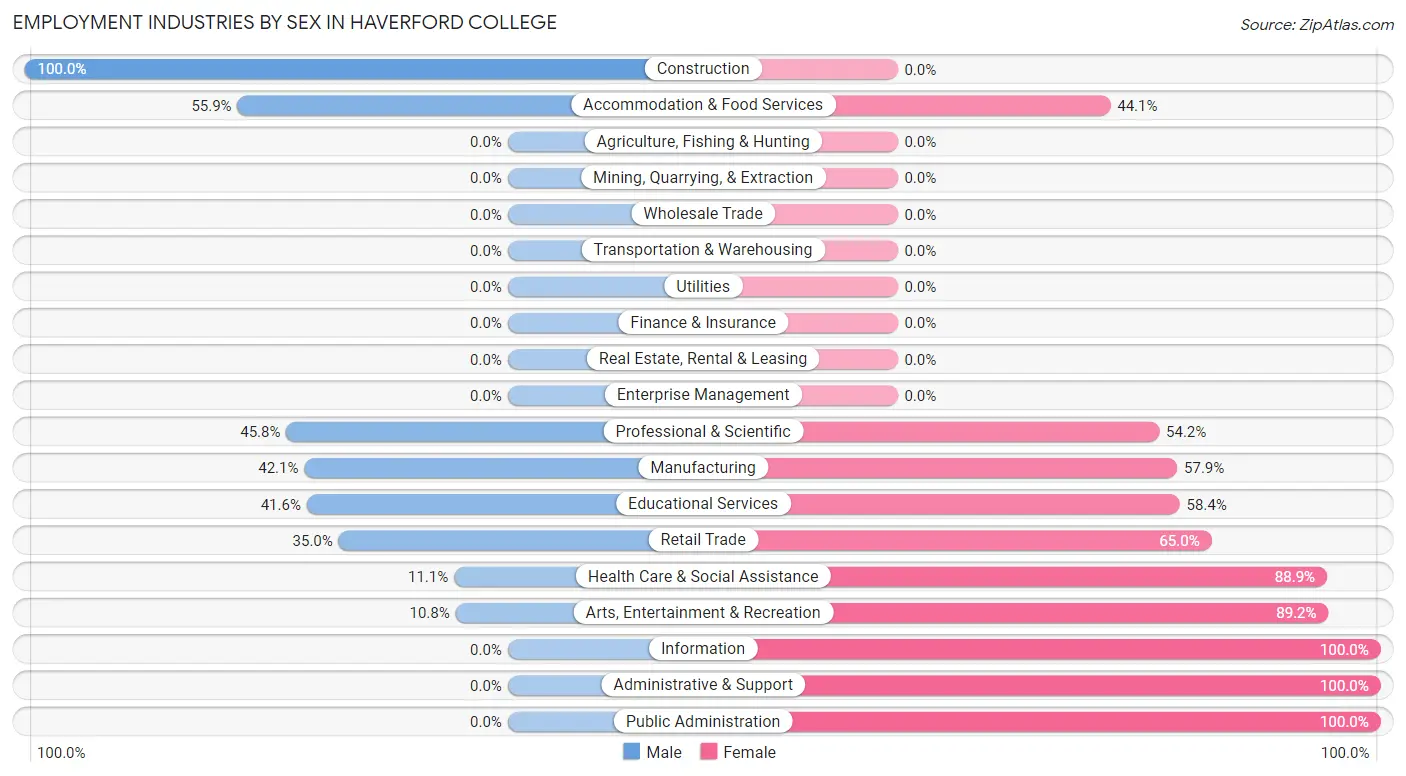
| Industry | Male | Female |
| Agriculture, Fishing & Hunting | 0 (0.0%) | 0 (0.0%) |
| Mining, Quarrying, & Extraction | 0 (0.0%) | 0 (0.0%) |
| Construction | 5 (100.0%) | 0 (0.0%) |
| Manufacturing | 8 (42.1%) | 11 (57.9%) |
| Wholesale Trade | 0 (0.0%) | 0 (0.0%) |
| Retail Trade | 14 (35.0%) | 26 (65.0%) |
| Transportation & Warehousing | 0 (0.0%) | 0 (0.0%) |
| Utilities | 0 (0.0%) | 0 (0.0%) |
| Information | 0 (0.0%) | 4 (100.0%) |
| Finance & Insurance | 0 (0.0%) | 0 (0.0%) |
| Real Estate, Rental & Leasing | 0 (0.0%) | 0 (0.0%) |
| Professional & Scientific | 11 (45.8%) | 13 (54.2%) |
| Enterprise Management | 0 (0.0%) | 0 (0.0%) |
| Administrative & Support | 0 (0.0%) | 10 (100.0%) |
| Educational Services | 99 (41.6%) | 139 (58.4%) |
| Health Care & Social Assistance | 5 (11.1%) | 40 (88.9%) |
| Arts, Entertainment & Recreation | 4 (10.8%) | 33 (89.2%) |
| Accommodation & Food Services | 80 (55.9%) | 63 (44.1%) |
| Public Administration | 0 (0.0%) | 8 (100.0%) |
| Total | 244 (40.7%) | 355 (59.3%) |
Education in Haverford College
School Enrollment in Haverford College
The most common levels of schooling among the 1,270 students in Haverford College are college / undergraduate (1,258 | 99.1%), nursery / preschool (11 | 0.9%), and elementary school (1 | 0.1%).
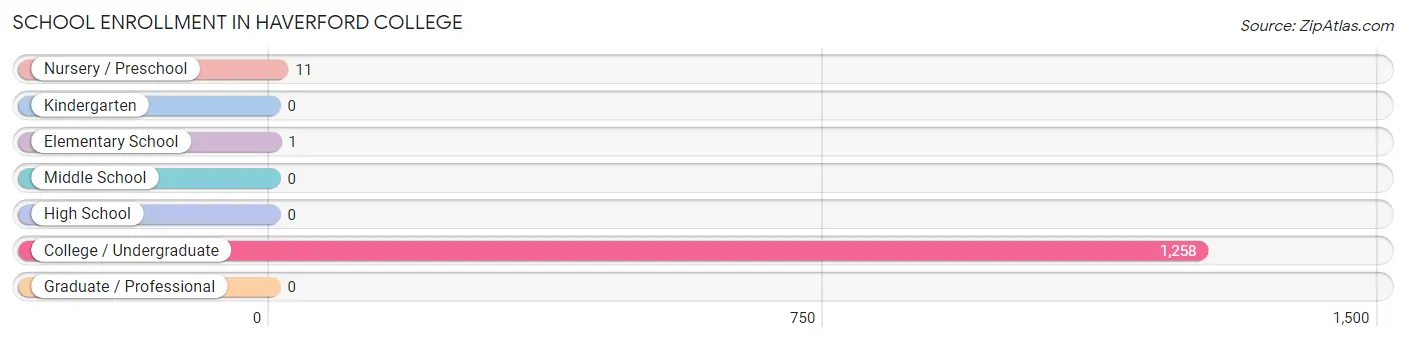
| School Level | # Students | % Students |
| Nursery / Preschool | 11 | 0.9% |
| Kindergarten | 0 | 0.0% |
| Elementary School | 1 | 0.1% |
| Middle School | 0 | 0.0% |
| High School | 0 | 0.0% |
| College / Undergraduate | 1,258 | 99.1% |
| Graduate / Professional | 0 | 0.0% |
| Total | 1,270 | 100.0% |
School Enrollment by Age by Funding Source in Haverford College
Out of a total of 1,270 students who are enrolled in schools in Haverford College, 1,242 (97.8%) attend a private institution, while the remaining 28 (2.2%) are enrolled in public schools. The age group of 3 to 4 year olds has the highest likelihood of being enrolled in private schools, with 11 (100.0% in the age bracket) enrolled. Conversely, the age group of 10 to 14 year olds has the lowest likelihood of being enrolled in a private school, with 1 (100.0% in the age bracket) attending a public institution.
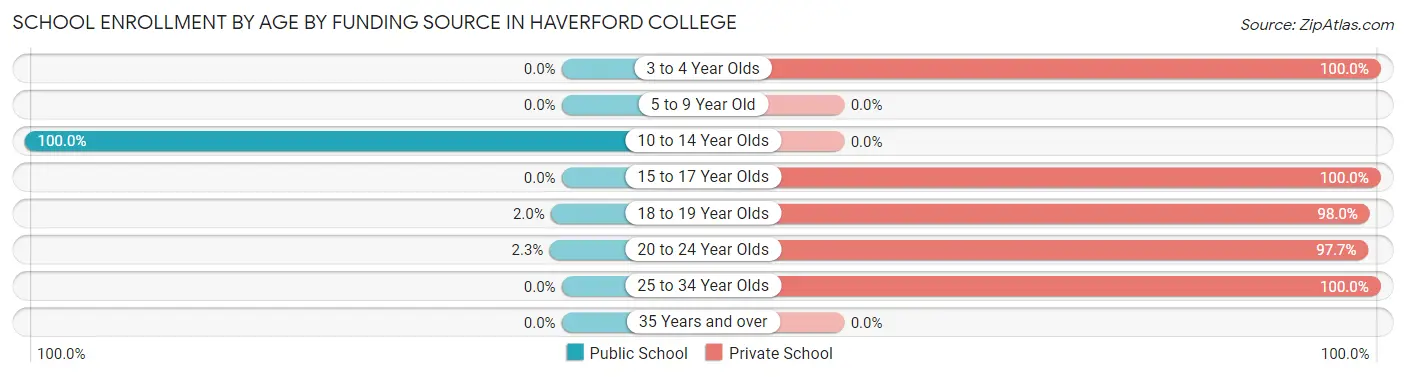
| Age Bracket | Public School | Private School |
| 3 to 4 Year Olds | 0 (0.0%) | 11 (100.0%) |
| 5 to 9 Year Old | 0 (0.0%) | 0 (0.0%) |
| 10 to 14 Year Olds | 1 (100.0%) | 0 (0.0%) |
| 15 to 17 Year Olds | 0 (0.0%) | 5 (100.0%) |
| 18 to 19 Year Olds | 12 (2.0%) | 578 (98.0%) |
| 20 to 24 Year Olds | 15 (2.3%) | 641 (97.7%) |
| 25 to 34 Year Olds | 0 (0.0%) | 7 (100.0%) |
| 35 Years and over | 0 (0.0%) | 0 (0.0%) |
| Total | 28 (2.2%) | 1,242 (97.8%) |
Educational Attainment by Field of Study in Haverford College
Social sciences (46 | 34.3%), liberal arts & history (37 | 27.6%), physical & health sciences (20 | 14.9%), literature & languages (17 | 12.7%), and science & technology (7 | 5.2%) are the most common fields of study among 134 individuals in Haverford College who have obtained a bachelor's degree or higher.
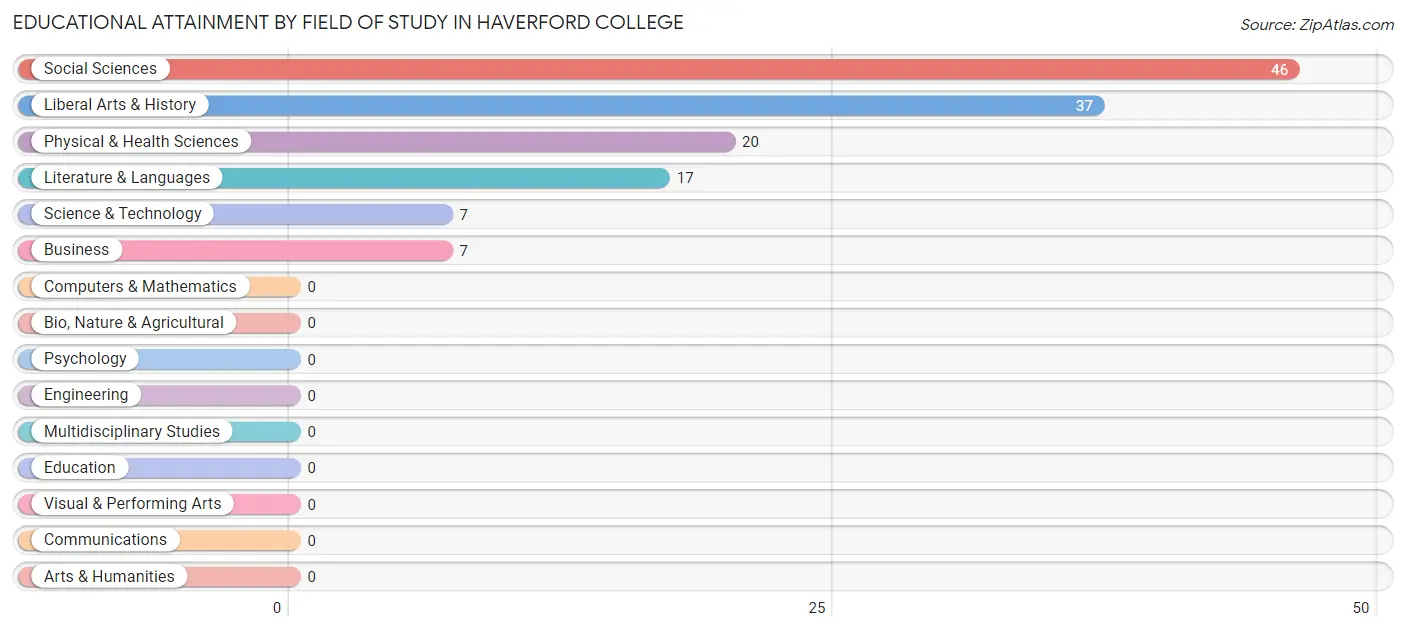
| Field of Study | # Graduates | % Graduates |
| Computers & Mathematics | 0 | 0.0% |
| Bio, Nature & Agricultural | 0 | 0.0% |
| Physical & Health Sciences | 20 | 14.9% |
| Psychology | 0 | 0.0% |
| Social Sciences | 46 | 34.3% |
| Engineering | 0 | 0.0% |
| Multidisciplinary Studies | 0 | 0.0% |
| Science & Technology | 7 | 5.2% |
| Business | 7 | 5.2% |
| Education | 0 | 0.0% |
| Literature & Languages | 17 | 12.7% |
| Liberal Arts & History | 37 | 27.6% |
| Visual & Performing Arts | 0 | 0.0% |
| Communications | 0 | 0.0% |
| Arts & Humanities | 0 | 0.0% |
| Total | 134 | 100.0% |
Transportation & Commute in Haverford College
Vehicle Availability by Sex in Haverford College
The most prevalent vehicle ownership categories in Haverford College are males with 2 vehicles (40, accounting for 83.3%) and females with 2 vehicles (30, making up 74.1%).
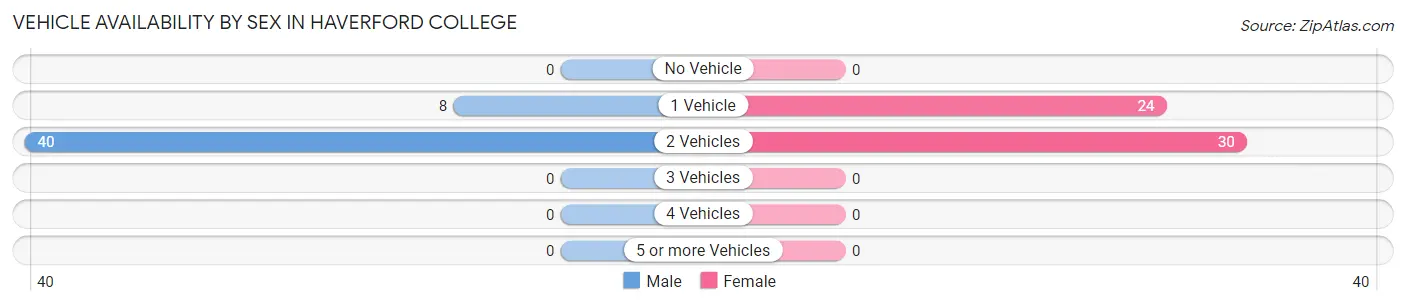
| Vehicles Available | Male | Female |
| No Vehicle | 0 (0.0%) | 0 (0.0%) |
| 1 Vehicle | 8 (16.7%) | 24 (44.4%) |
| 2 Vehicles | 40 (83.3%) | 30 (55.6%) |
| 3 Vehicles | 0 (0.0%) | 0 (0.0%) |
| 4 Vehicles | 0 (0.0%) | 0 (0.0%) |
| 5 or more Vehicles | 0 (0.0%) | 0 (0.0%) |
| Total | 48 (100.0%) | 54 (100.0%) |
Commute Time in Haverford College
The most frequently occuring commute durations in Haverford College are 10 to 14 minutes (139 commuters, 30.4%), 20 to 24 minutes (95 commuters, 20.8%), and 5 to 9 minutes (84 commuters, 18.4%).
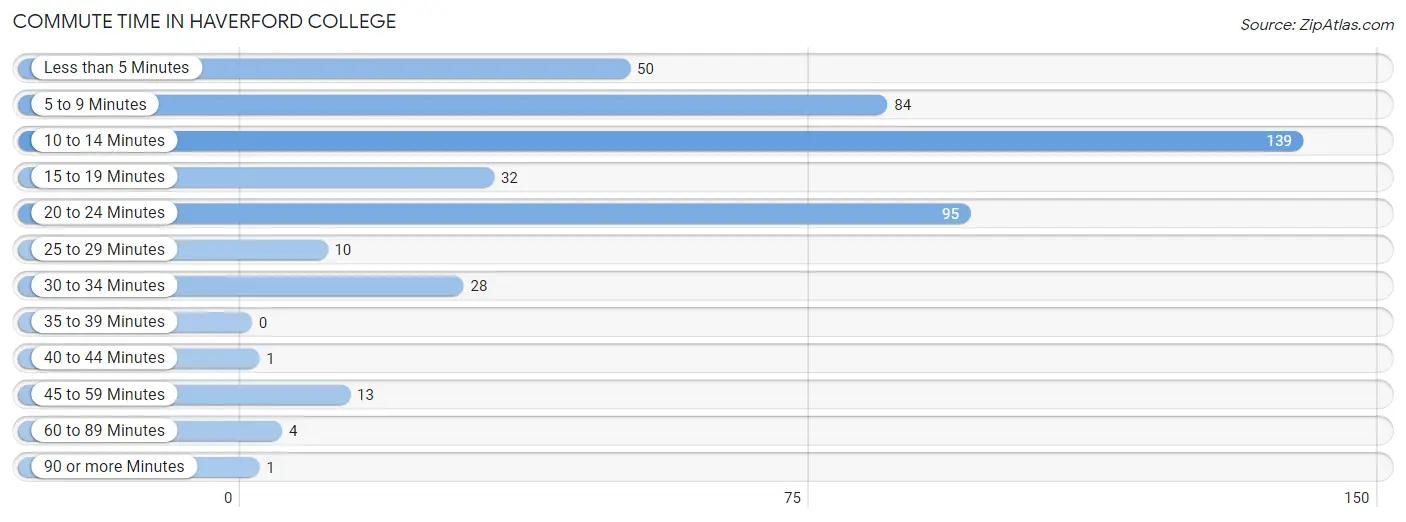
| Commute Time | # Commuters | % Commuters |
| Less than 5 Minutes | 50 | 10.9% |
| 5 to 9 Minutes | 84 | 18.4% |
| 10 to 14 Minutes | 139 | 30.4% |
| 15 to 19 Minutes | 32 | 7.0% |
| 20 to 24 Minutes | 95 | 20.8% |
| 25 to 29 Minutes | 10 | 2.2% |
| 30 to 34 Minutes | 28 | 6.1% |
| 35 to 39 Minutes | 0 | 0.0% |
| 40 to 44 Minutes | 1 | 0.2% |
| 45 to 59 Minutes | 13 | 2.8% |
| 60 to 89 Minutes | 4 | 0.9% |
| 90 or more Minutes | 1 | 0.2% |
Commute Time by Sex in Haverford College
The most common commute times in Haverford College are 10 to 14 minutes (81 commuters, 41.7%) for males and 20 to 24 minutes (73 commuters, 27.8%) for females.
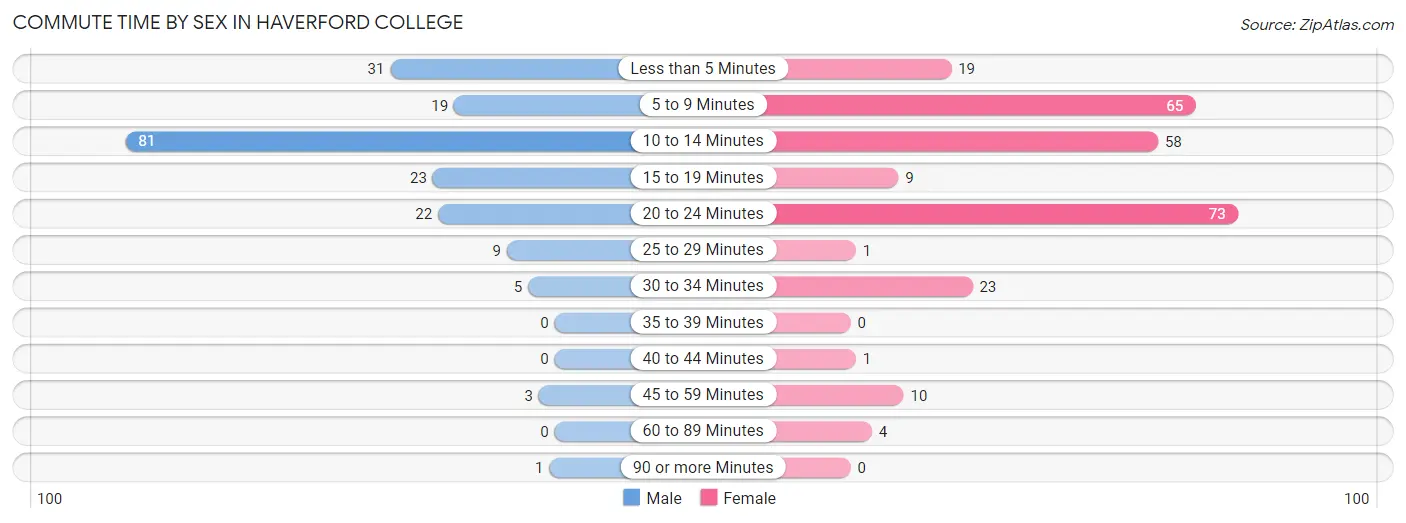
| Commute Time | Male | Female |
| Less than 5 Minutes | 31 (16.0%) | 19 (7.2%) |
| 5 to 9 Minutes | 19 (9.8%) | 65 (24.7%) |
| 10 to 14 Minutes | 81 (41.7%) | 58 (22.1%) |
| 15 to 19 Minutes | 23 (11.9%) | 9 (3.4%) |
| 20 to 24 Minutes | 22 (11.3%) | 73 (27.8%) |
| 25 to 29 Minutes | 9 (4.6%) | 1 (0.4%) |
| 30 to 34 Minutes | 5 (2.6%) | 23 (8.7%) |
| 35 to 39 Minutes | 0 (0.0%) | 0 (0.0%) |
| 40 to 44 Minutes | 0 (0.0%) | 1 (0.4%) |
| 45 to 59 Minutes | 3 (1.5%) | 10 (3.8%) |
| 60 to 89 Minutes | 0 (0.0%) | 4 (1.5%) |
| 90 or more Minutes | 1 (0.5%) | 0 (0.0%) |
Time of Departure to Work by Sex in Haverford College
The most frequent times of departure to work in Haverford College are 4:00 PM to 11:59 PM (66, 34.0%) for males and 12:00 PM to 3:59 PM (93, 35.4%) for females.
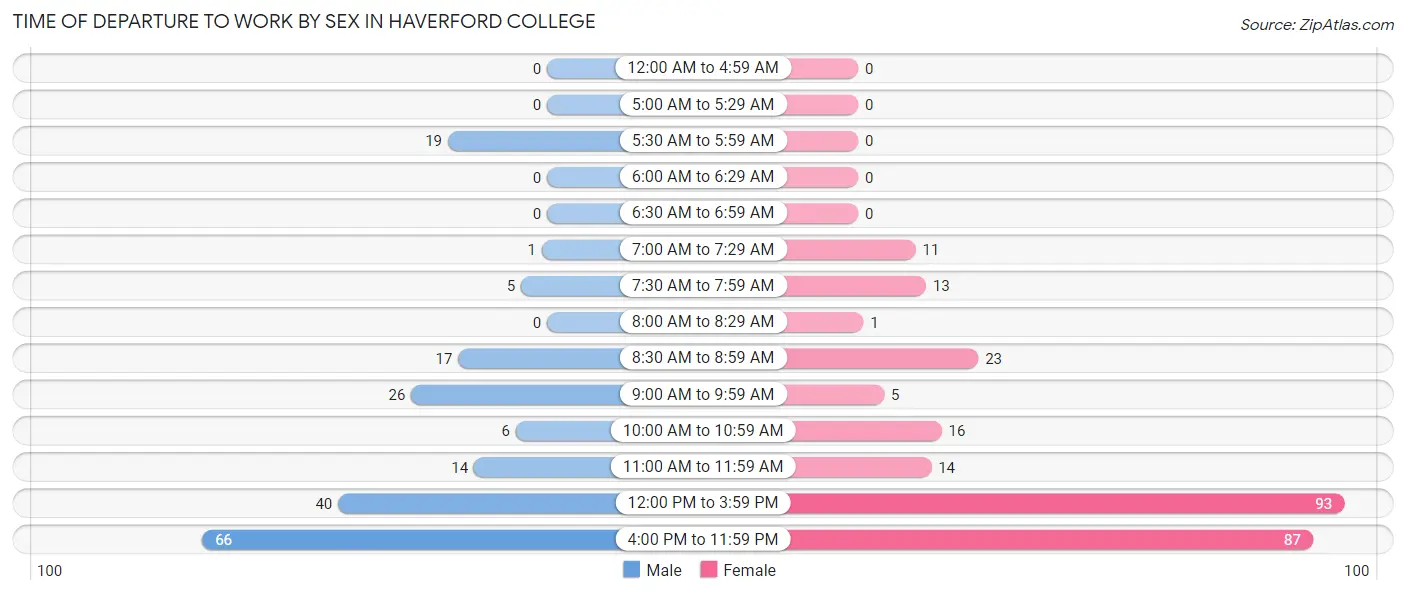
| Time of Departure | Male | Female |
| 12:00 AM to 4:59 AM | 0 (0.0%) | 0 (0.0%) |
| 5:00 AM to 5:29 AM | 0 (0.0%) | 0 (0.0%) |
| 5:30 AM to 5:59 AM | 19 (9.8%) | 0 (0.0%) |
| 6:00 AM to 6:29 AM | 0 (0.0%) | 0 (0.0%) |
| 6:30 AM to 6:59 AM | 0 (0.0%) | 0 (0.0%) |
| 7:00 AM to 7:29 AM | 1 (0.5%) | 11 (4.2%) |
| 7:30 AM to 7:59 AM | 5 (2.6%) | 13 (4.9%) |
| 8:00 AM to 8:29 AM | 0 (0.0%) | 1 (0.4%) |
| 8:30 AM to 8:59 AM | 17 (8.8%) | 23 (8.7%) |
| 9:00 AM to 9:59 AM | 26 (13.4%) | 5 (1.9%) |
| 10:00 AM to 10:59 AM | 6 (3.1%) | 16 (6.1%) |
| 11:00 AM to 11:59 AM | 14 (7.2%) | 14 (5.3%) |
| 12:00 PM to 3:59 PM | 40 (20.6%) | 93 (35.4%) |
| 4:00 PM to 11:59 PM | 66 (34.0%) | 87 (33.1%) |
| Total | 194 (100.0%) | 263 (100.0%) |
Housing Occupancy in Haverford College
Occupancy by Ownership in Haverford College
Of the total 69 dwellings in Haverford College, owner-occupied units account for 5 (7.2%), while renter-occupied units make up 64 (92.7%).
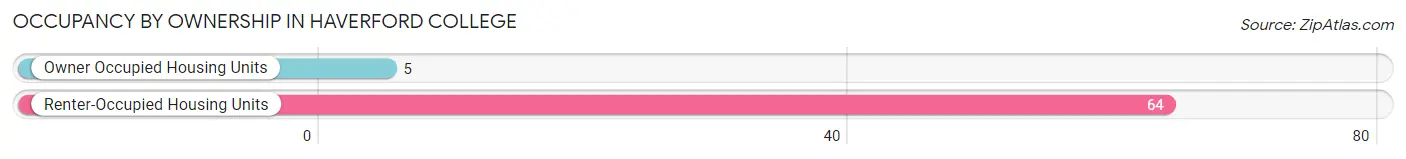
| Occupancy | # Housing Units | % Housing Units |
| Owner Occupied Housing Units | 5 | 7.2% |
| Renter-Occupied Housing Units | 64 | 92.7% |
| Total Occupied Housing Units | 69 | 100.0% |
Occupancy by Household Size in Haverford College
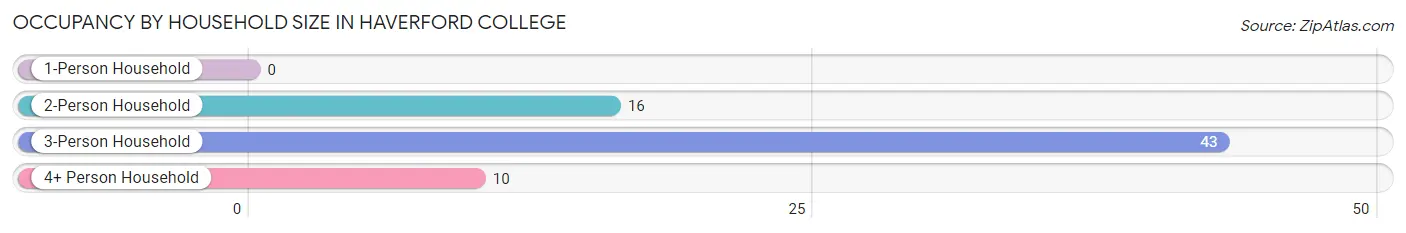
| Household Size | # Housing Units | % Housing Units |
| 1-Person Household | 0 | 0.0% |
| 2-Person Household | 16 | 23.2% |
| 3-Person Household | 43 | 62.3% |
| 4+ Person Household | 10 | 14.5% |
| Total Housing Units | 69 | 100.0% |
Occupancy by Ownership by Household Size in Haverford College
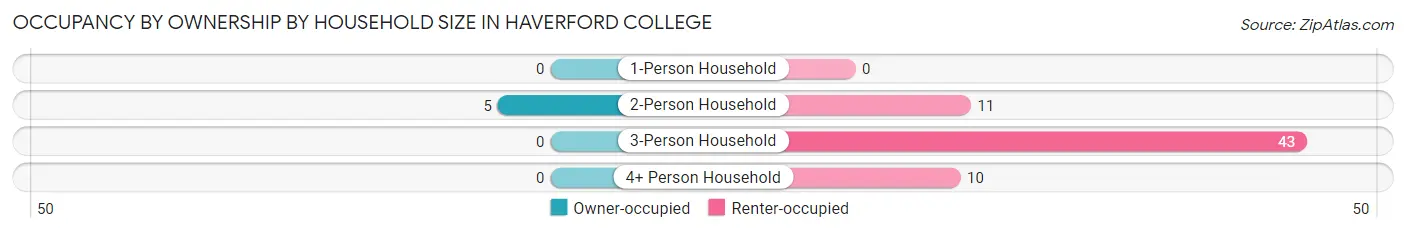
| Household Size | Owner-occupied | Renter-occupied |
| 1-Person Household | 0 (0.0%) | 0 (0.0%) |
| 2-Person Household | 5 (31.2%) | 11 (68.8%) |
| 3-Person Household | 0 (0.0%) | 43 (100.0%) |
| 4+ Person Household | 0 (0.0%) | 10 (100.0%) |
| Total Housing Units | 5 (7.2%) | 64 (92.7%) |
Occupancy by Educational Attainment in Haverford College
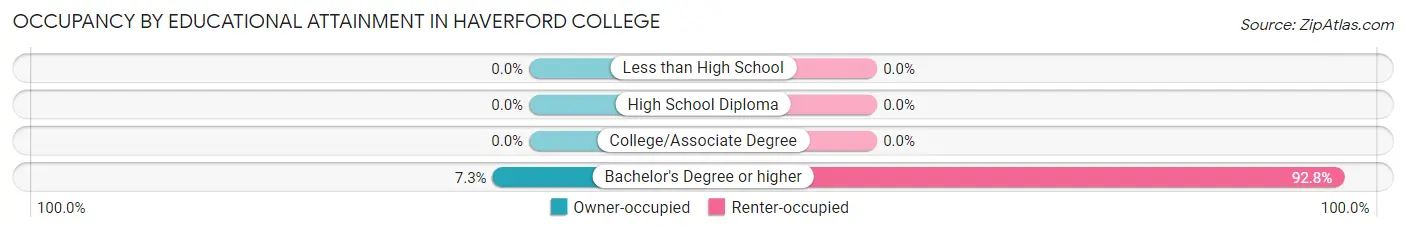
| Household Size | Owner-occupied | Renter-occupied |
| Less than High School | 0 (0.0%) | 0 (0.0%) |
| High School Diploma | 0 (0.0%) | 0 (0.0%) |
| College/Associate Degree | 0 (0.0%) | 0 (0.0%) |
| Bachelor's Degree or higher | 5 (7.2%) | 64 (92.7%) |
Occupancy by Age of Householder in Haverford College
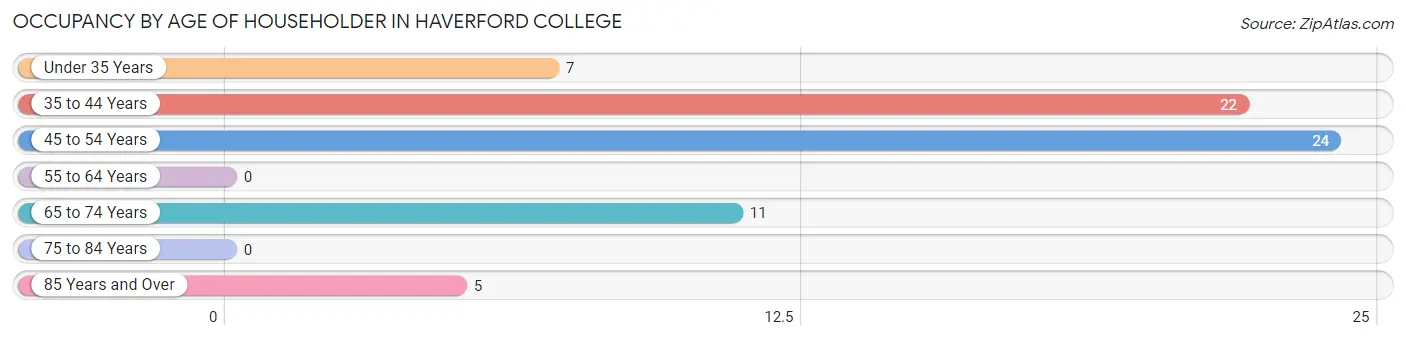
| Age Bracket | # Households | % Households |
| Under 35 Years | 7 | 10.1% |
| 35 to 44 Years | 22 | 31.9% |
| 45 to 54 Years | 24 | 34.8% |
| 55 to 64 Years | 0 | 0.0% |
| 65 to 74 Years | 11 | 15.9% |
| 75 to 84 Years | 0 | 0.0% |
| 85 Years and Over | 5 | 7.2% |
| Total | 69 | 100.0% |
Housing Finances in Haverford College
Median Income by Occupancy in Haverford College
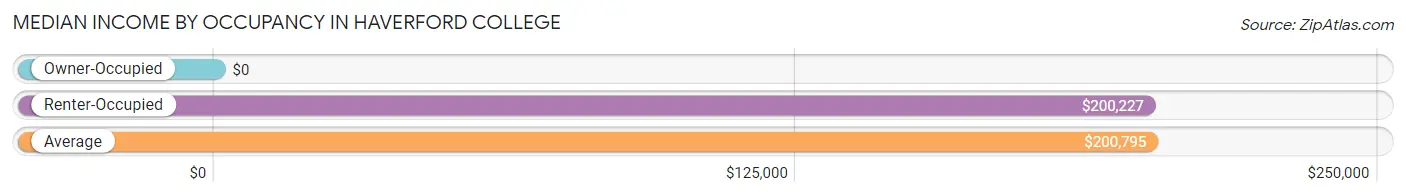
| Occupancy Type | # Households | Median Income |
| Owner-Occupied | 5 (7.2%) | $0 |
| Renter-Occupied | 64 (92.7%) | $200,227 |
| Average | 69 (100.0%) | $200,795 |
Occupancy by Householder Income Bracket in Haverford College
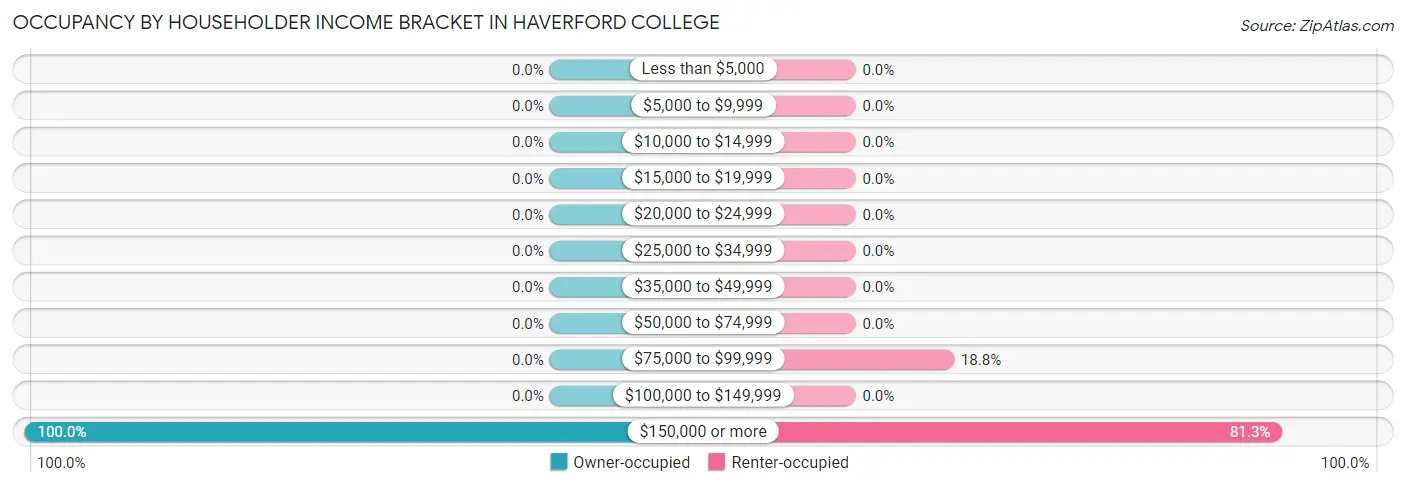
| Income Bracket | Owner-occupied | Renter-occupied |
| Less than $5,000 | 0 (0.0%) | 0 (0.0%) |
| $5,000 to $9,999 | 0 (0.0%) | 0 (0.0%) |
| $10,000 to $14,999 | 0 (0.0%) | 0 (0.0%) |
| $15,000 to $19,999 | 0 (0.0%) | 0 (0.0%) |
| $20,000 to $24,999 | 0 (0.0%) | 0 (0.0%) |
| $25,000 to $34,999 | 0 (0.0%) | 0 (0.0%) |
| $35,000 to $49,999 | 0 (0.0%) | 0 (0.0%) |
| $50,000 to $74,999 | 0 (0.0%) | 0 (0.0%) |
| $75,000 to $99,999 | 0 (0.0%) | 12 (18.8%) |
| $100,000 to $149,999 | 0 (0.0%) | 0 (0.0%) |
| $150,000 or more | 5 (100.0%) | 52 (81.2%) |
| Total | 5 (100.0%) | 64 (100.0%) |
Monthly Housing Cost Tiers in Haverford College
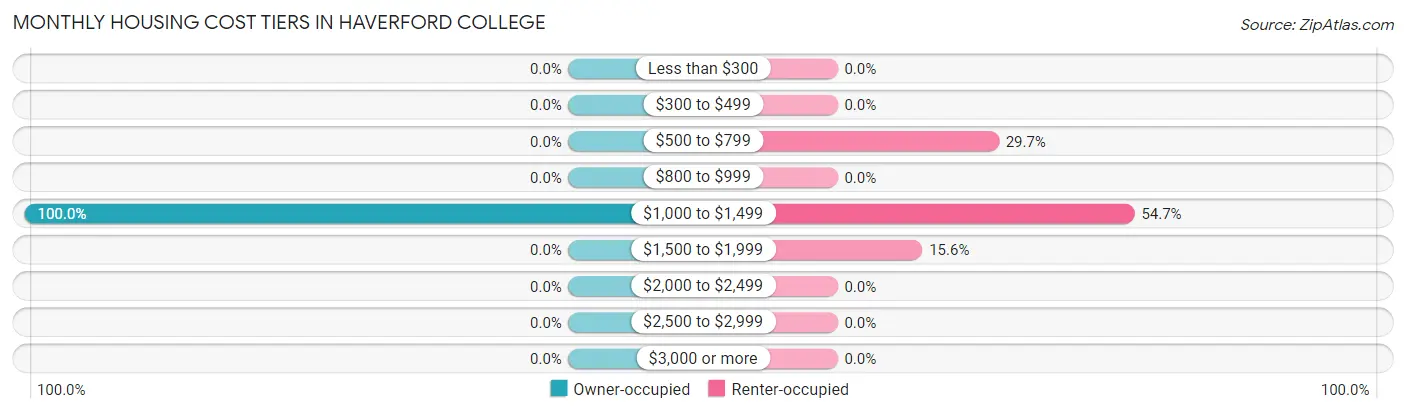
| Monthly Cost | Owner-occupied | Renter-occupied |
| Less than $300 | 0 (0.0%) | 0 (0.0%) |
| $300 to $499 | 0 (0.0%) | 0 (0.0%) |
| $500 to $799 | 0 (0.0%) | 19 (29.7%) |
| $800 to $999 | 0 (0.0%) | 0 (0.0%) |
| $1,000 to $1,499 | 5 (100.0%) | 35 (54.7%) |
| $1,500 to $1,999 | 0 (0.0%) | 10 (15.6%) |
| $2,000 to $2,499 | 0 (0.0%) | 0 (0.0%) |
| $2,500 to $2,999 | 0 (0.0%) | 0 (0.0%) |
| $3,000 or more | 0 (0.0%) | 0 (0.0%) |
| Total | 5 (100.0%) | 64 (100.0%) |
Physical Housing Characteristics in Haverford College
Housing Structures in Haverford College
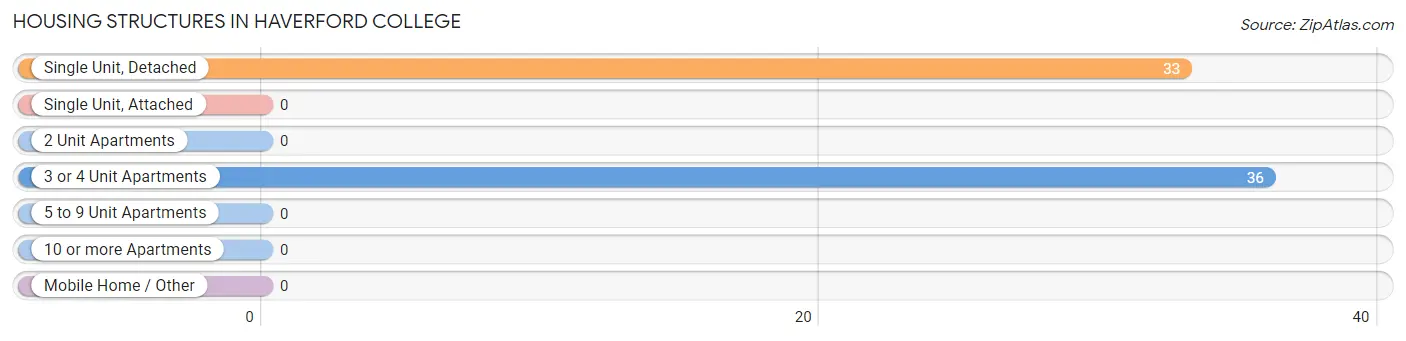
| Structure Type | # Housing Units | % Housing Units |
| Single Unit, Detached | 33 | 47.8% |
| Single Unit, Attached | 0 | 0.0% |
| 2 Unit Apartments | 0 | 0.0% |
| 3 or 4 Unit Apartments | 36 | 52.2% |
| 5 to 9 Unit Apartments | 0 | 0.0% |
| 10 or more Apartments | 0 | 0.0% |
| Mobile Home / Other | 0 | 0.0% |
| Total | 69 | 100.0% |
Housing Structures by Occupancy in Haverford College
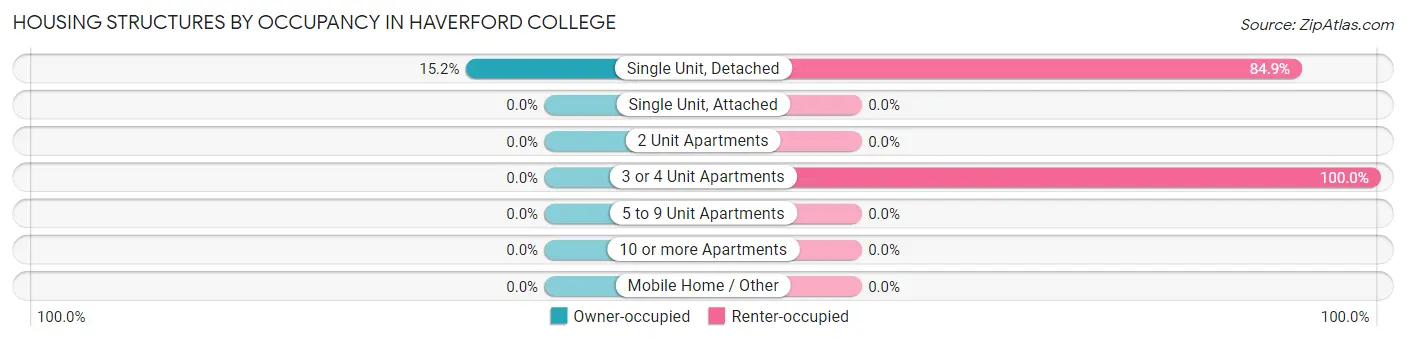
| Structure Type | Owner-occupied | Renter-occupied |
| Single Unit, Detached | 5 (15.1%) | 28 (84.9%) |
| Single Unit, Attached | 0 (0.0%) | 0 (0.0%) |
| 2 Unit Apartments | 0 (0.0%) | 0 (0.0%) |
| 3 or 4 Unit Apartments | 0 (0.0%) | 36 (100.0%) |
| 5 to 9 Unit Apartments | 0 (0.0%) | 0 (0.0%) |
| 10 or more Apartments | 0 (0.0%) | 0 (0.0%) |
| Mobile Home / Other | 0 (0.0%) | 0 (0.0%) |
| Total | 5 (7.2%) | 64 (92.7%) |
Housing Structures by Number of Rooms in Haverford College
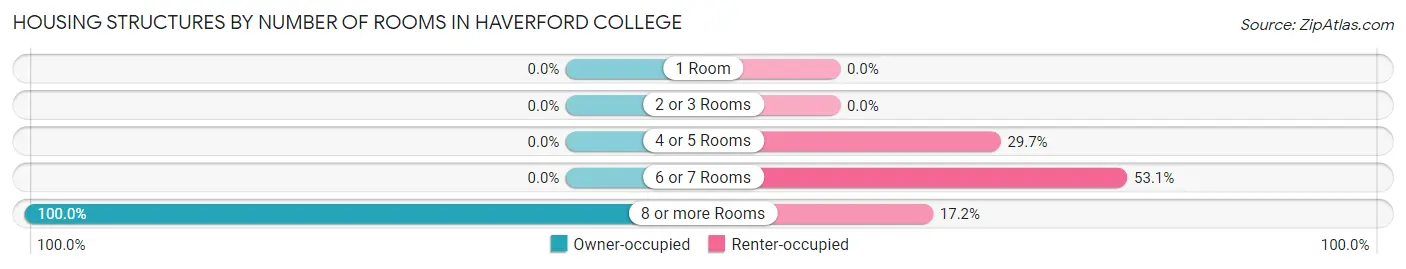
| Number of Rooms | Owner-occupied | Renter-occupied |
| 1 Room | 0 (0.0%) | 0 (0.0%) |
| 2 or 3 Rooms | 0 (0.0%) | 0 (0.0%) |
| 4 or 5 Rooms | 0 (0.0%) | 19 (29.7%) |
| 6 or 7 Rooms | 0 (0.0%) | 34 (53.1%) |
| 8 or more Rooms | 5 (100.0%) | 11 (17.2%) |
| Total | 5 (100.0%) | 64 (100.0%) |
Housing Structure by Heating Type in Haverford College
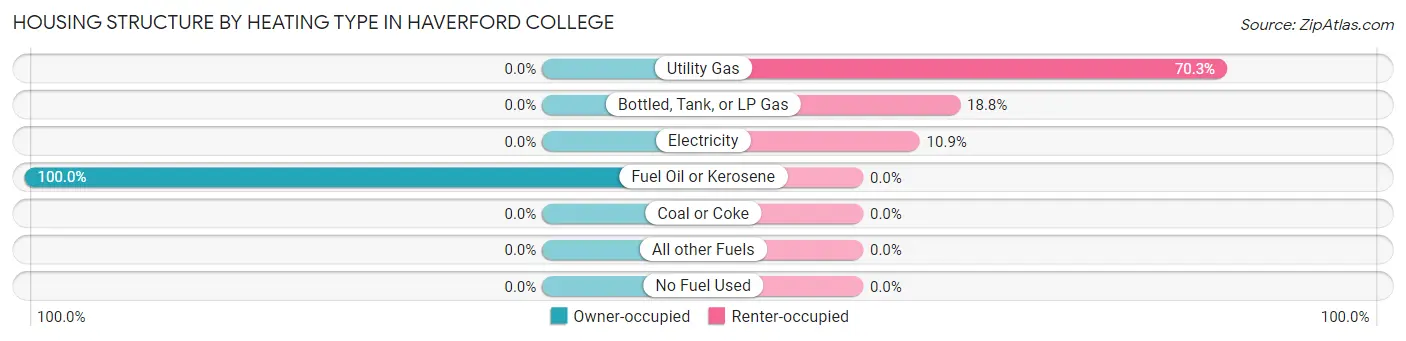
| Heating Type | Owner-occupied | Renter-occupied |
| Utility Gas | 0 (0.0%) | 45 (70.3%) |
| Bottled, Tank, or LP Gas | 0 (0.0%) | 12 (18.8%) |
| Electricity | 0 (0.0%) | 7 (10.9%) |
| Fuel Oil or Kerosene | 5 (100.0%) | 0 (0.0%) |
| Coal or Coke | 0 (0.0%) | 0 (0.0%) |
| All other Fuels | 0 (0.0%) | 0 (0.0%) |
| No Fuel Used | 0 (0.0%) | 0 (0.0%) |
| Total | 5 (100.0%) | 64 (100.0%) |
Household Vehicle Usage in Haverford College
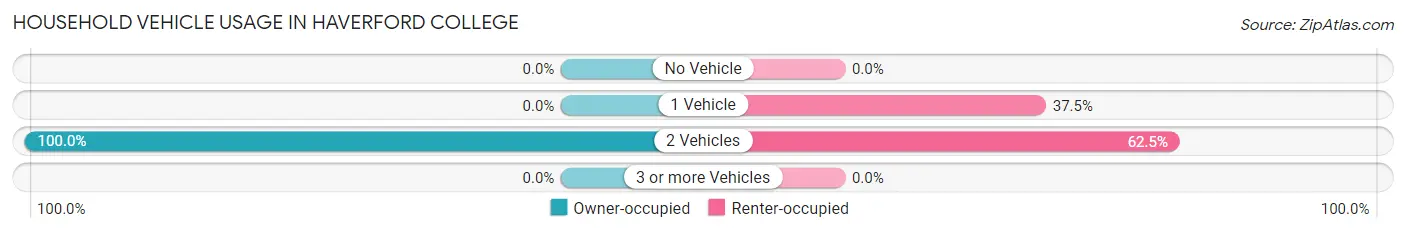
| Vehicles per Household | Owner-occupied | Renter-occupied |
| No Vehicle | 0 (0.0%) | 0 (0.0%) |
| 1 Vehicle | 0 (0.0%) | 24 (37.5%) |
| 2 Vehicles | 5 (100.0%) | 40 (62.5%) |
| 3 or more Vehicles | 0 (0.0%) | 0 (0.0%) |
| Total | 5 (100.0%) | 64 (100.0%) |
Real Estate & Mortgages in Haverford College
Real Estate and Mortgage Overview in Haverford College
| Characteristic | Without Mortgage | With Mortgage |
| Housing Units | 5 | 0 |
| Median Property Value | - | - |
| Median Household Income | - | - |
| Monthly Housing Costs | - | - |
| Real Estate Taxes | - | - |
Property Value by Mortgage Status in Haverford College
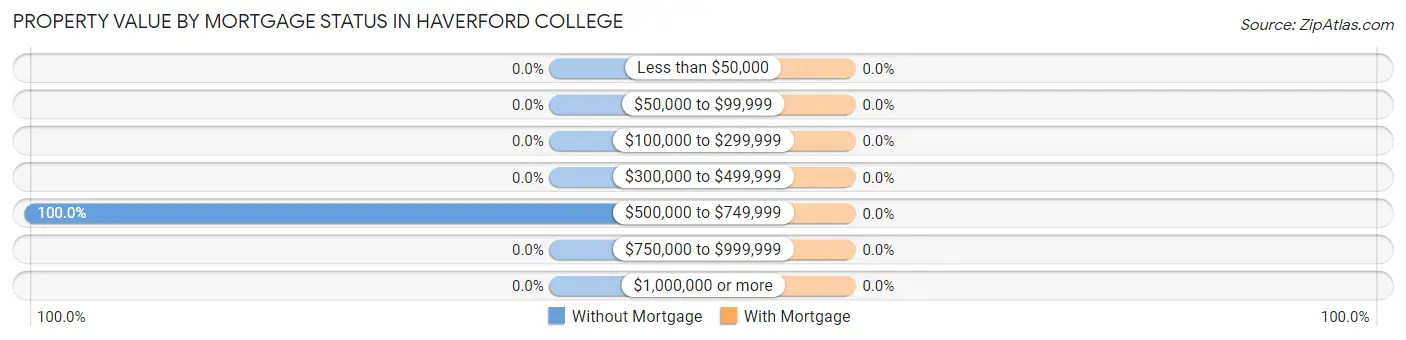
| Property Value | Without Mortgage | With Mortgage |
| Less than $50,000 | 0 (0.0%) | 0 (0.0%) |
| $50,000 to $99,999 | 0 (0.0%) | 0 (0.0%) |
| $100,000 to $299,999 | 0 (0.0%) | 0 (0.0%) |
| $300,000 to $499,999 | 0 (0.0%) | 0 (0.0%) |
| $500,000 to $749,999 | 5 (100.0%) | 0 (0.0%) |
| $750,000 to $999,999 | 0 (0.0%) | 0 (0.0%) |
| $1,000,000 or more | 0 (0.0%) | 0 (0.0%) |
| Total | 5 (100.0%) | 0 (0.0%) |
Household Income by Mortgage Status in Haverford College
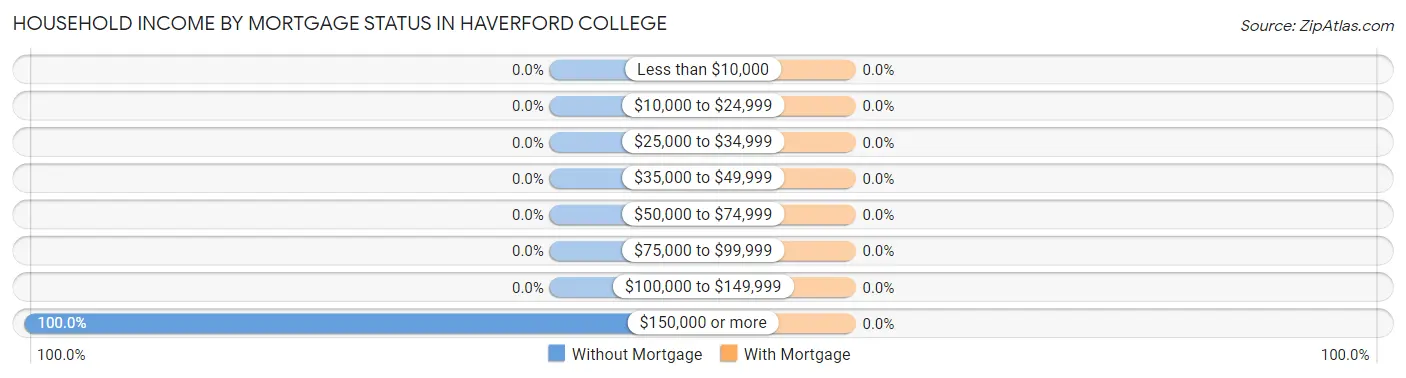
| Household Income | Without Mortgage | With Mortgage |
| Less than $10,000 | 0 (0.0%) | 0 (0.0%) |
| $10,000 to $24,999 | 0 (0.0%) | 0 (0.0%) |
| $25,000 to $34,999 | 0 (0.0%) | 0 (0.0%) |
| $35,000 to $49,999 | 0 (0.0%) | 0 (0.0%) |
| $50,000 to $74,999 | 0 (0.0%) | 0 (0.0%) |
| $75,000 to $99,999 | 0 (0.0%) | 0 (0.0%) |
| $100,000 to $149,999 | 0 (0.0%) | 0 (0.0%) |
| $150,000 or more | 5 (100.0%) | 0 (0.0%) |
| Total | 5 (100.0%) | 0 (0.0%) |
Property Value to Household Income Ratio in Haverford College
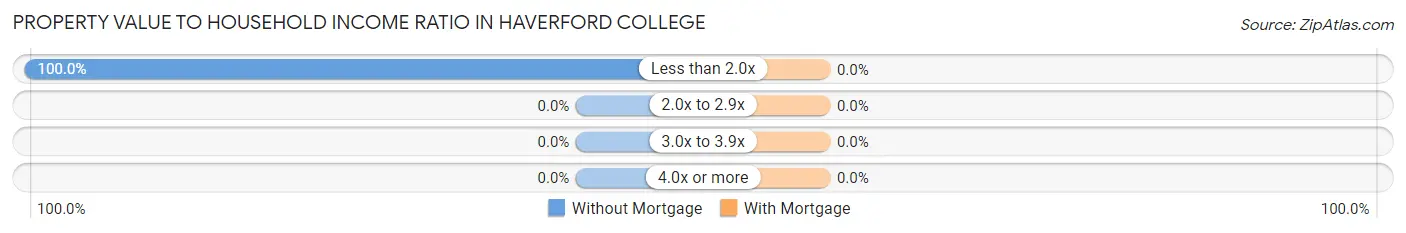
| Value-to-Income Ratio | Without Mortgage | With Mortgage |
| Less than 2.0x | 5 (100.0%) | 0 (0.0%) |
| 2.0x to 2.9x | 0 (0.0%) | 0 (0.0%) |
| 3.0x to 3.9x | 0 (0.0%) | 0 (0.0%) |
| 4.0x or more | 0 (0.0%) | 0 (0.0%) |
| Total | 5 (100.0%) | 0 (0.0%) |
Real Estate Taxes by Mortgage Status in Haverford College
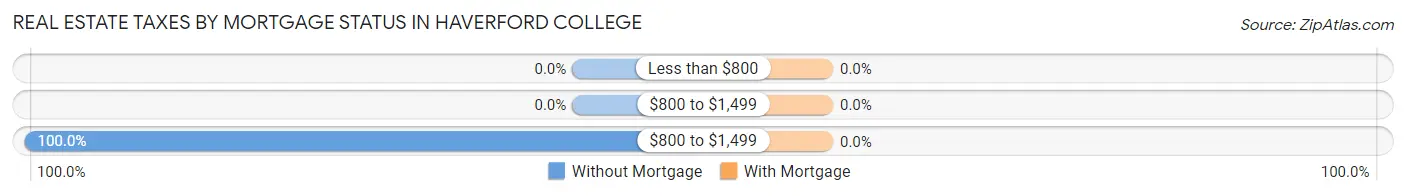
| Property Taxes | Without Mortgage | With Mortgage |
| Less than $800 | 0 (0.0%) | 0 (0.0%) |
| $800 to $1,499 | 0 (0.0%) | 0 (0.0%) |
| $800 to $1,499 | 5 (100.0%) | 0 (0.0%) |
| Total | 5 (100.0%) | 0 (0.0%) |
Health & Disability in Haverford College
Health Insurance Coverage by Age in Haverford College
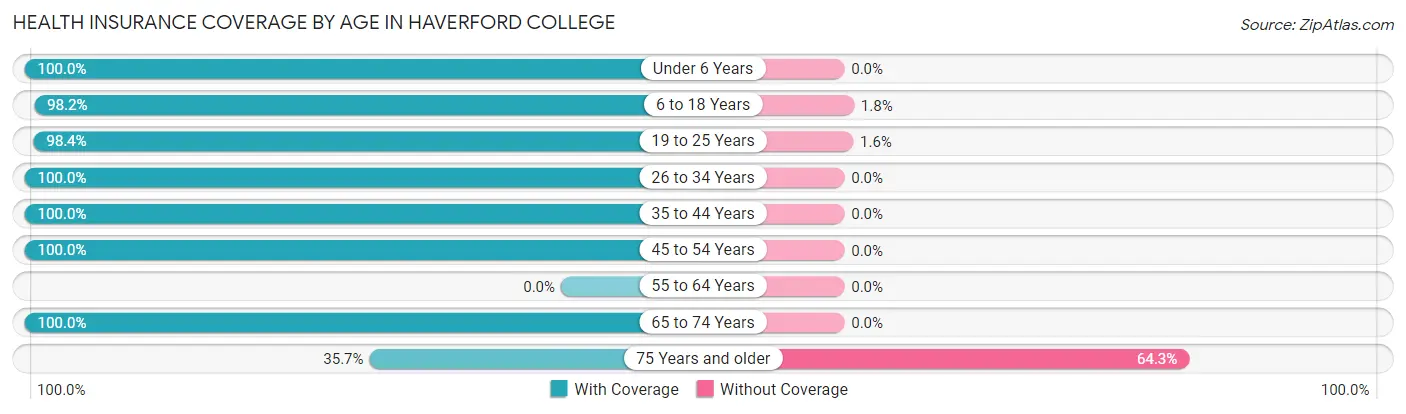
| Age Bracket | With Coverage | Without Coverage |
| Under 6 Years | 62 (100.0%) | 0 (0.0%) |
| 6 to 18 Years | 330 (98.2%) | 6 (1.8%) |
| 19 to 25 Years | 901 (98.4%) | 15 (1.6%) |
| 26 to 34 Years | 21 (100.0%) | 0 (0.0%) |
| 35 to 44 Years | 52 (100.0%) | 0 (0.0%) |
| 45 to 54 Years | 24 (100.0%) | 0 (0.0%) |
| 55 to 64 Years | 0 (0.0%) | 0 (0.0%) |
| 65 to 74 Years | 24 (100.0%) | 0 (0.0%) |
| 75 Years and older | 10 (35.7%) | 18 (64.3%) |
| Total | 1,424 (97.3%) | 39 (2.7%) |
Health Insurance Coverage by Citizenship Status in Haverford College
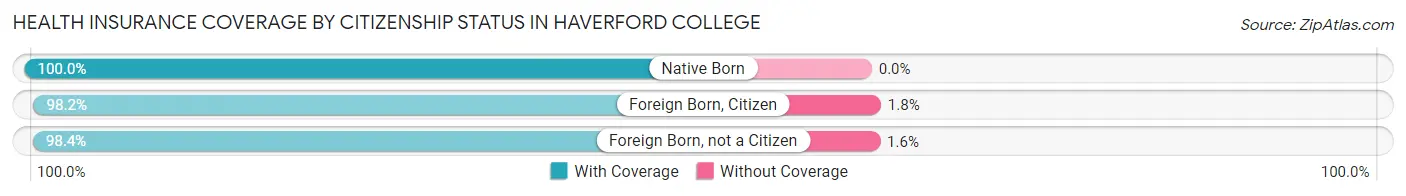
| Citizenship Status | With Coverage | Without Coverage |
| Native Born | 62 (100.0%) | 0 (0.0%) |
| Foreign Born, Citizen | 330 (98.2%) | 6 (1.8%) |
| Foreign Born, not a Citizen | 901 (98.4%) | 15 (1.6%) |
Health Insurance Coverage by Household Income in Haverford College
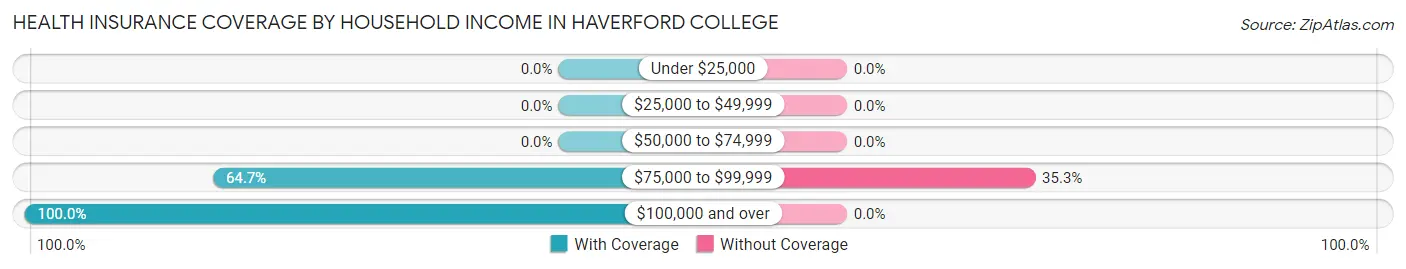
| Household Income | With Coverage | Without Coverage |
| Under $25,000 | 0 (0.0%) | 0 (0.0%) |
| $25,000 to $49,999 | 0 (0.0%) | 0 (0.0%) |
| $50,000 to $74,999 | 0 (0.0%) | 0 (0.0%) |
| $75,000 to $99,999 | 33 (64.7%) | 18 (35.3%) |
| $100,000 and over | 154 (100.0%) | 0 (0.0%) |
Public vs Private Health Insurance Coverage by Age in Haverford College
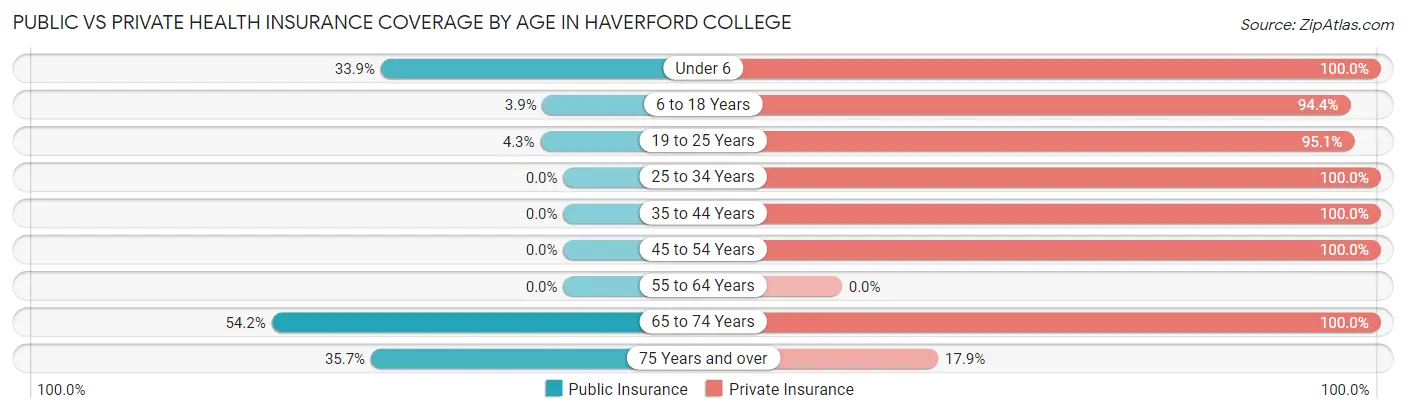
| Age Bracket | Public Insurance | Private Insurance |
| Under 6 | 21 (33.9%) | 62 (100.0%) |
| 6 to 18 Years | 13 (3.9%) | 317 (94.4%) |
| 19 to 25 Years | 39 (4.3%) | 871 (95.1%) |
| 25 to 34 Years | 0 (0.0%) | 21 (100.0%) |
| 35 to 44 Years | 0 (0.0%) | 52 (100.0%) |
| 45 to 54 Years | 0 (0.0%) | 24 (100.0%) |
| 55 to 64 Years | 0 (0.0%) | 0 (0.0%) |
| 65 to 74 Years | 13 (54.2%) | 24 (100.0%) |
| 75 Years and over | 10 (35.7%) | 5 (17.9%) |
| Total | 96 (6.6%) | 1,376 (94.1%) |
Disability Status by Sex by Age in Haverford College
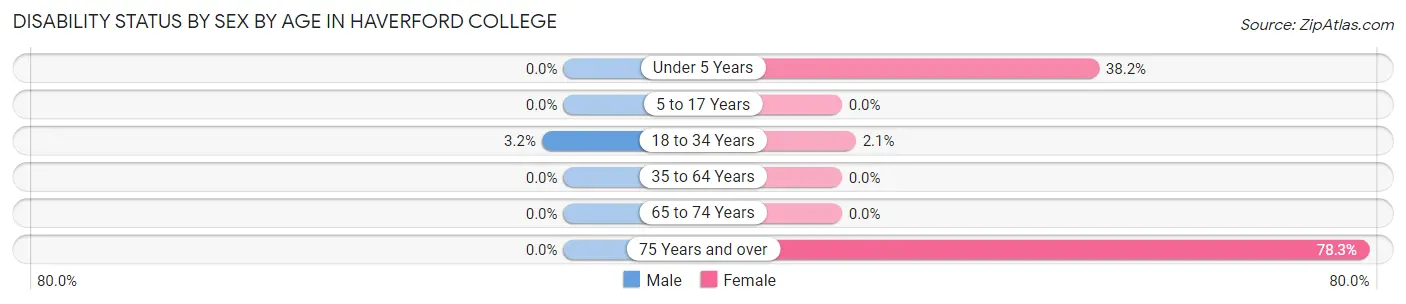
| Age Bracket | Male | Female |
| Under 5 Years | 0 (0.0%) | 21 (38.2%) |
| 5 to 17 Years | 0 (0.0%) | 0 (0.0%) |
| 18 to 34 Years | 19 (3.2%) | 14 (2.1%) |
| 35 to 64 Years | 0 (0.0%) | 0 (0.0%) |
| 65 to 74 Years | 0 (0.0%) | 0 (0.0%) |
| 75 Years and over | 0 (0.0%) | 18 (78.3%) |
Disability Class by Sex by Age in Haverford College
Disability Class: Hearing Difficulty
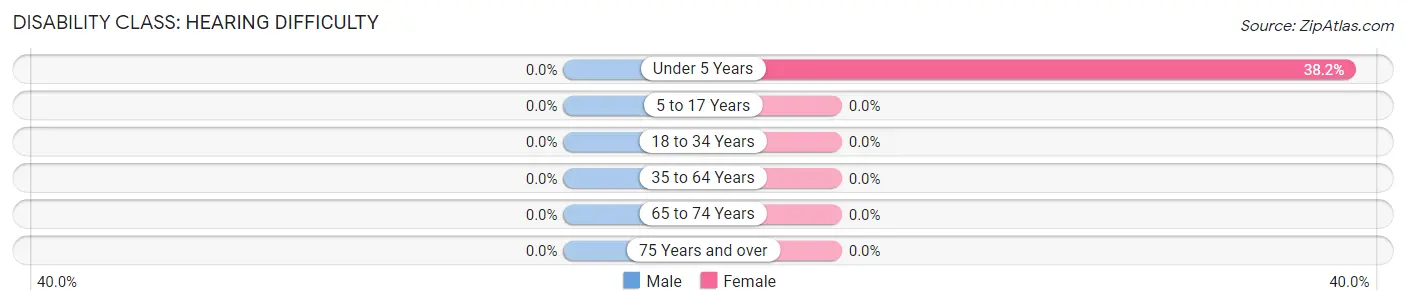
| Age Bracket | Male | Female |
| Under 5 Years | 0 (0.0%) | 21 (38.2%) |
| 5 to 17 Years | 0 (0.0%) | 0 (0.0%) |
| 18 to 34 Years | 0 (0.0%) | 0 (0.0%) |
| 35 to 64 Years | 0 (0.0%) | 0 (0.0%) |
| 65 to 74 Years | 0 (0.0%) | 0 (0.0%) |
| 75 Years and over | 0 (0.0%) | 0 (0.0%) |
Disability Class: Vision Difficulty
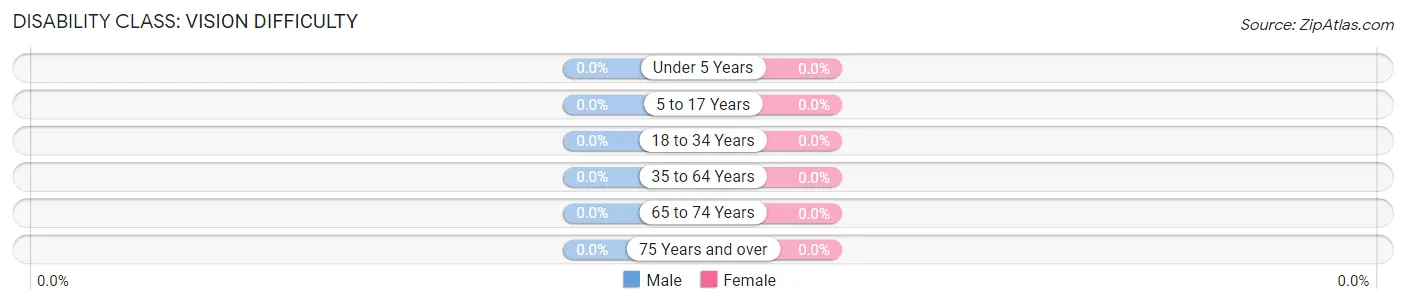
| Age Bracket | Male | Female |
| Under 5 Years | 0 (0.0%) | 0 (0.0%) |
| 5 to 17 Years | 0 (0.0%) | 0 (0.0%) |
| 18 to 34 Years | 0 (0.0%) | 0 (0.0%) |
| 35 to 64 Years | 0 (0.0%) | 0 (0.0%) |
| 65 to 74 Years | 0 (0.0%) | 0 (0.0%) |
| 75 Years and over | 0 (0.0%) | 0 (0.0%) |
Disability Class: Cognitive Difficulty
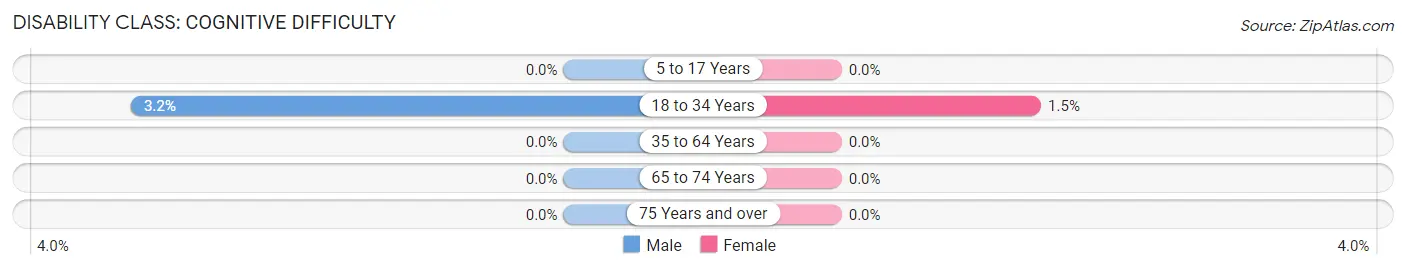
| Age Bracket | Male | Female |
| 5 to 17 Years | 0 (0.0%) | 0 (0.0%) |
| 18 to 34 Years | 19 (3.2%) | 10 (1.5%) |
| 35 to 64 Years | 0 (0.0%) | 0 (0.0%) |
| 65 to 74 Years | 0 (0.0%) | 0 (0.0%) |
| 75 Years and over | 0 (0.0%) | 0 (0.0%) |
Disability Class: Ambulatory Difficulty
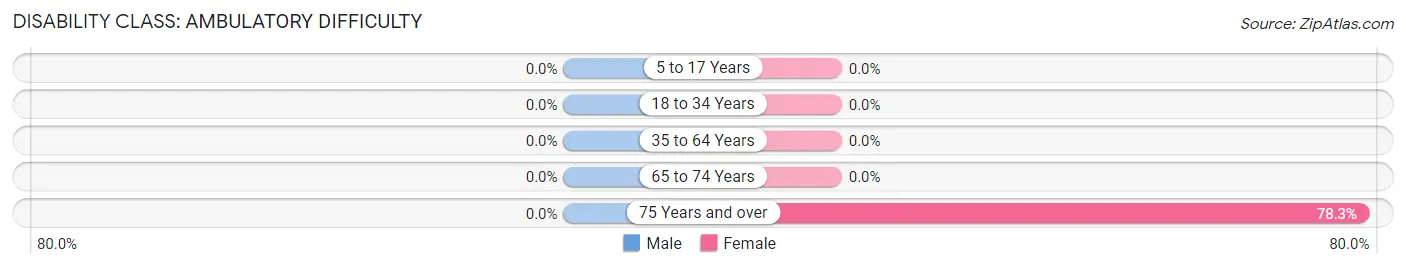
| Age Bracket | Male | Female |
| 5 to 17 Years | 0 (0.0%) | 0 (0.0%) |
| 18 to 34 Years | 0 (0.0%) | 0 (0.0%) |
| 35 to 64 Years | 0 (0.0%) | 0 (0.0%) |
| 65 to 74 Years | 0 (0.0%) | 0 (0.0%) |
| 75 Years and over | 0 (0.0%) | 18 (78.3%) |
Disability Class: Self-Care Difficulty
| Age Bracket | Male | Female |
| 5 to 17 Years | 0 (0.0%) | 0 (0.0%) |
| 18 to 34 Years | 0 (0.0%) | 0 (0.0%) |
| 35 to 64 Years | 0 (0.0%) | 0 (0.0%) |
| 65 to 74 Years | 0 (0.0%) | 0 (0.0%) |
| 75 Years and over | 0 (0.0%) | 0 (0.0%) |
Technology Access in Haverford College
Computing Device Access in Haverford College
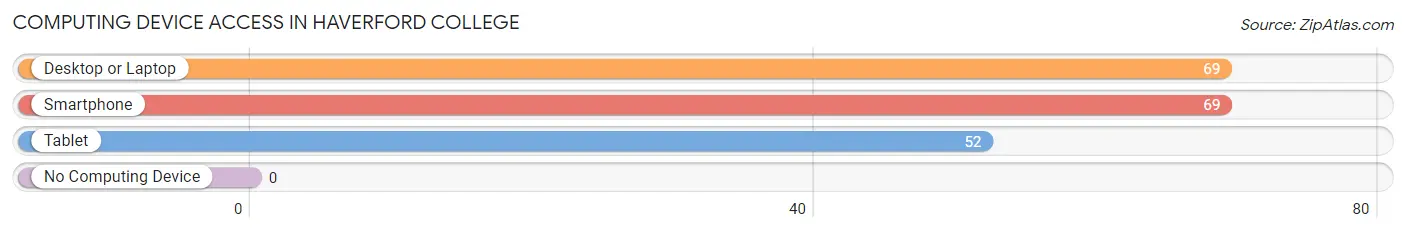
| Device Type | # Households | % Households |
| Desktop or Laptop | 69 | 100.0% |
| Smartphone | 69 | 100.0% |
| Tablet | 52 | 75.4% |
| No Computing Device | 0 | 0.0% |
| Total | 69 | 100.0% |
Internet Access in Haverford College
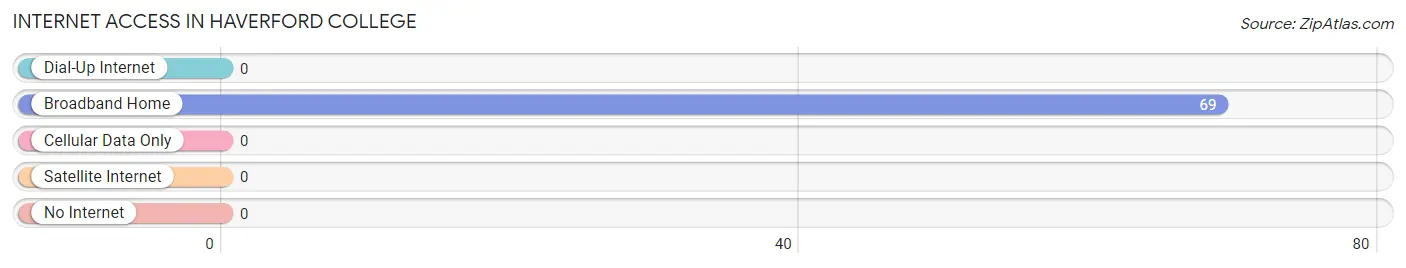
| Internet Type | # Households | % Households |
| Dial-Up Internet | 0 | 0.0% |
| Broadband Home | 69 | 100.0% |
| Cellular Data Only | 0 | 0.0% |
| Satellite Internet | 0 | 0.0% |
| No Internet | 0 | 0.0% |
| Total | 69 | 100.0% |
Haverford College Summary
Haverford College is a private liberal arts college located in Haverford, Pennsylvania. Founded in 1833, it is one of the oldest colleges in the United States. The college is known for its rigorous academic standards and its commitment to social justice. Haverford College is a member of the Tri-College Consortium, which includes Bryn Mawr College and Swarthmore College.
Geography
Haverford College is located in Haverford Township, Delaware County, Pennsylvania. The college is situated on a hill overlooking the Main Line suburbs of Philadelphia. The campus is approximately 20 miles from downtown Philadelphia and is easily accessible by public transportation. The college is surrounded by a variety of parks and recreational areas, including Haverford Reserve, Haverford College Nature Trail, and Haverford College Arboretum.
History
Haverford College was founded in 1833 by a group of Quakers who wanted to provide a quality education to their children. The college was originally known as the Haverford Institute and was located in a small building in the center of Haverford Township. In 1833, the college moved to its current location on the hill overlooking the Main Line suburbs of Philadelphia.
The college was initially a men’s college, but in 1880, it became coeducational. In the early 20th century, the college began to expand its curriculum and facilities. In the 1950s, the college began to focus on social justice and civil rights. In the 1960s, the college became a leader in the anti-war movement and the civil rights movement.
Economy
Haverford College is a major economic force in the region. The college has an annual operating budget of over $200 million and employs over 1,000 people. The college also has a large endowment of over $1 billion. The college’s economic impact on the region is estimated to be over $1 billion annually.
The college is also a major employer in the region. The college employs over 1,000 people, including faculty, staff, and students. The college also provides jobs for local businesses, such as restaurants, hotels, and retail stores.
Demographics
Haverford College is a diverse and inclusive community. The college has a student body of over 1,500 students from all over the world. The student body is approximately 50% male and 50% female. The college also has a diverse faculty and staff, with over 40% of faculty and staff members identifying as people of color.
Conclusion
Haverford College is a private liberal arts college located in Haverford, Pennsylvania. Founded in 1833, it is one of the oldest colleges in the United States. The college is known for its rigorous academic standards and its commitment to social justice. Haverford College is a member of the Tri-College Consortium, which includes Bryn Mawr College and Swarthmore College. The college is located in Haverford Township, Delaware County, Pennsylvania and is surrounded by a variety of parks and recreational areas. The college has an annual operating budget of over $200 million and employs over 1,000 people. The college also has a large endowment of over $1 billion and its economic impact on the region is estimated to be over $1 billion annually. The college has a student body of over 1,500 students from all over the world and a diverse faculty and staff.
Common Questions
What is Per Capita Income in Haverford College?
Per Capita income in Haverford College is $23,607.
What is the Median Family Income in Haverford College?
Median Family Income in Haverford College is $200,795.
What is the Median Household income in Haverford College?
Median Household Income in Haverford College is $200,795.
What is Income or Wage Gap in Haverford College?
Income or Wage Gap in Haverford College is 36.8%.
Women in Haverford College earn 63.2 cents for every dollar earned by a man.
What is Inequality or Gini Index in Haverford College?
Inequality or Gini Index in Haverford College is 0.43.
What is the Total Population of Haverford College?
Total Population of Haverford College is 1,463.
What is the Total Male Population of Haverford College?
Total Male Population of Haverford College is 650.
What is the Total Female Population of Haverford College?
Total Female Population of Haverford College is 813.
What is the Ratio of Males per 100 Females in Haverford College?
There are 79.95 Males per 100 Females in Haverford College.
What is the Ratio of Females per 100 Males in Haverford College?
There are 125.08 Females per 100 Males in Haverford College.
What is the Median Population Age in Haverford College?
Median Population Age in Haverford College is 20.2 Years.
What is the Average Family Size in Haverford College
Average Family Size in Haverford College is 3.0 People.
What is the Average Household Size in Haverford College
Average Household Size in Haverford College is 3.0 People.
How Large is the Labor Force in Haverford College?
There are 664 People in the Labor Forcein in Haverford College.
What is the Percentage of People in the Labor Force in Haverford College?
47.4% of People are in the Labor Force in Haverford College.
What is the Unemployment Rate in Haverford College?
Unemployment Rate in Haverford College is 9.8%.