Cities with the Largest Hispanic or Latino Community in Pennsylvania
RELATED REPORTS & OPTIONS
Hispanic or Latino
Pennsylvania
Compare Cities
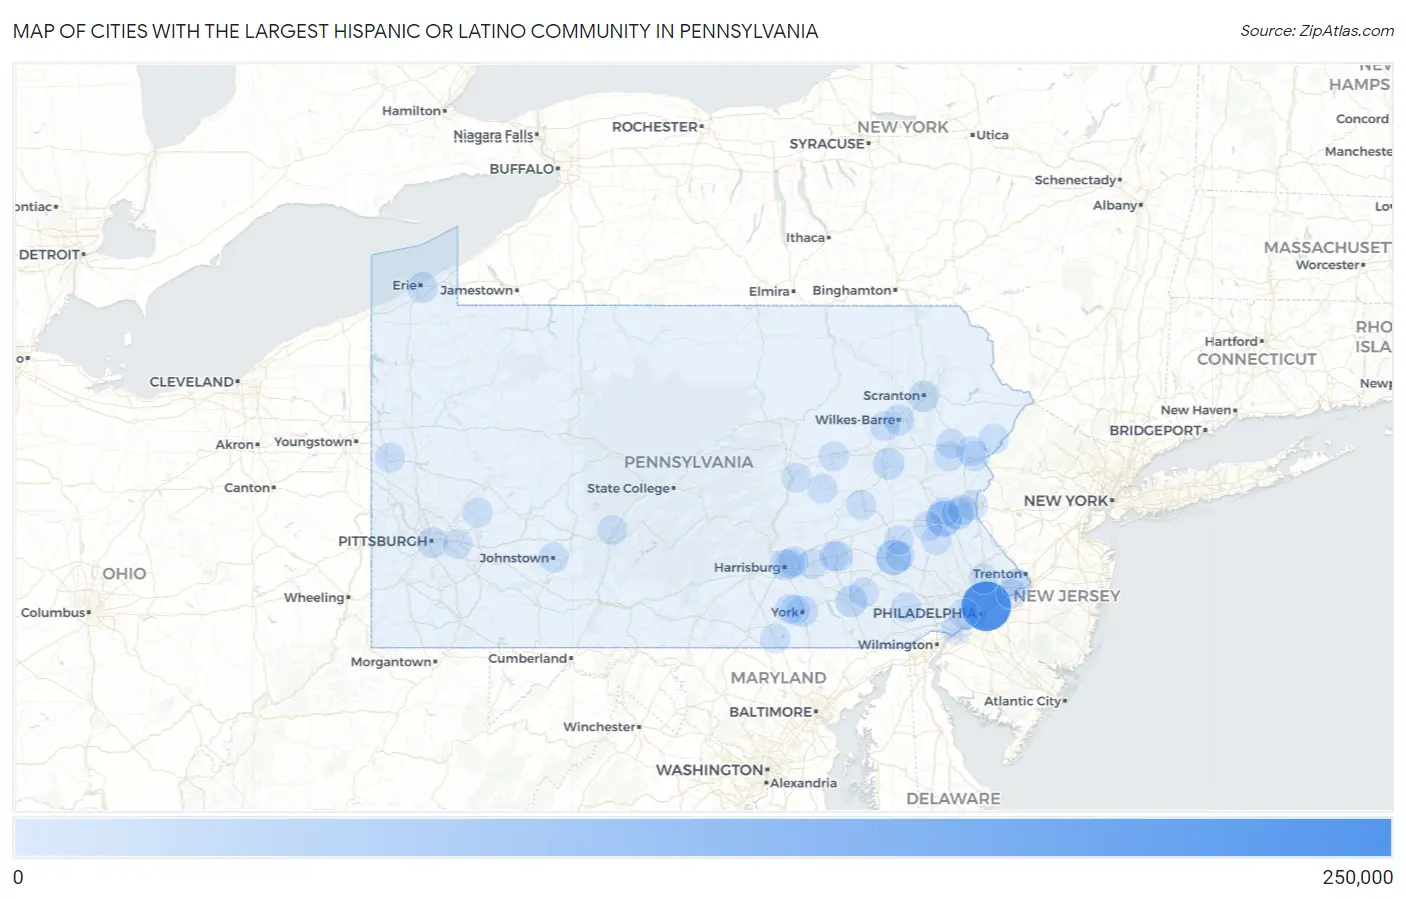
Map of Cities with the Largest Hispanic or Latino Community in Pennsylvania
0
250,000
Cities with the Largest Hispanic or Latino Community in Pennsylvania
| City | Hispanic or Latino | vs State | vs National | |
| 1. | Philadelphia | 249,723 | 1,055,108(23.67%)#1 | 61,755,866(0.40%)#17 |
| 2. | Allentown | 68,077 | 1,055,108(6.45%)#2 | 61,755,866(0.11%)#107 |
| 3. | Reading | 63,542 | 1,055,108(6.02%)#3 | 61,755,866(0.10%)#114 |
| 4. | Bethlehem | 23,083 | 1,055,108(2.19%)#4 | 61,755,866(0.04%)#405 |
| 5. | Lancaster | 22,822 | 1,055,108(2.16%)#5 | 61,755,866(0.04%)#411 |
| 6. | Hazleton | 18,461 | 1,055,108(1.75%)#6 | 61,755,866(0.03%)#507 |
| 7. | York | 15,239 | 1,055,108(1.44%)#7 | 61,755,866(0.02%)#610 |
| 8. | Wilkes Barre | 12,844 | 1,055,108(1.22%)#8 | 61,755,866(0.02%)#717 |
| 9. | Harrisburg | 12,362 | 1,055,108(1.17%)#9 | 61,755,866(0.02%)#742 |
| 10. | Scranton | 12,262 | 1,055,108(1.16%)#10 | 61,755,866(0.02%)#749 |
| 11. | Lebanon | 11,721 | 1,055,108(1.11%)#11 | 61,755,866(0.02%)#785 |
| 12. | Pittsburgh | 11,074 | 1,055,108(1.05%)#12 | 61,755,866(0.02%)#826 |
| 13. | Norristown Borough | 9,783 | 1,055,108(0.93%)#13 | 61,755,866(0.02%)#936 |
| 14. | Erie | 7,898 | 1,055,108(0.75%)#14 | 61,755,866(0.01%)#1,122 |
| 15. | Easton | 6,704 | 1,055,108(0.64%)#15 | 61,755,866(0.01%)#1,261 |
| 16. | Levittown | 5,026 | 1,055,108(0.48%)#16 | 61,755,866(0.01%)#1,554 |
| 17. | Fullerton | 5,012 | 1,055,108(0.48%)#17 | 61,755,866(0.01%)#1,560 |
| 18. | Chambersburg Borough | 4,306 | 1,055,108(0.41%)#18 | 61,755,866(0.01%)#1,760 |
| 19. | Coatesville | 3,706 | 1,055,108(0.35%)#19 | 61,755,866(0.01%)#1,977 |
| 20. | West Hazleton Borough | 3,409 | 1,055,108(0.32%)#20 | 61,755,866(0.01%)#2,100 |
| 21. | Pottstown Borough | 2,616 | 1,055,108(0.25%)#21 | 61,755,866(0.00%)#2,527 |
| 22. | Chester | 2,414 | 1,055,108(0.23%)#22 | 61,755,866(0.00%)#2,664 |
| 23. | Columbia Borough | 2,393 | 1,055,108(0.23%)#23 | 61,755,866(0.00%)#2,678 |
| 24. | Oxford Borough | 2,179 | 1,055,108(0.21%)#24 | 61,755,866(0.00%)#2,846 |
| 25. | West Chester Borough | 2,151 | 1,055,108(0.20%)#25 | 61,755,866(0.00%)#2,878 |
| 26. | Kennett Square Borough | 2,119 | 1,055,108(0.20%)#26 | 61,755,866(0.00%)#2,918 |
| 27. | Hanover Borough | 1,981 | 1,055,108(0.19%)#27 | 61,755,866(0.00%)#3,055 |
| 28. | Wilson Borough | 1,981 | 1,055,108(0.19%)#28 | 61,755,866(0.00%)#3,056 |
| 29. | Breinigsville | 1,944 | 1,055,108(0.18%)#29 | 61,755,866(0.00%)#3,102 |
| 30. | Horsham | 1,918 | 1,055,108(0.18%)#30 | 61,755,866(0.00%)#3,134 |
| 31. | Carlisle Borough | 1,823 | 1,055,108(0.17%)#31 | 61,755,866(0.00%)#3,221 |
| 32. | Hershey | 1,764 | 1,055,108(0.17%)#32 | 61,755,866(0.00%)#3,288 |
| 33. | East Stroudsburg Borough | 1,739 | 1,055,108(0.16%)#33 | 61,755,866(0.00%)#3,316 |
| 34. | Fountain Hill Borough | 1,674 | 1,055,108(0.16%)#34 | 61,755,866(0.00%)#3,393 |
| 35. | State College Borough | 1,649 | 1,055,108(0.16%)#35 | 61,755,866(0.00%)#3,417 |
| 36. | Arlington Heights | 1,649 | 1,055,108(0.16%)#36 | 61,755,866(0.00%)#3,419 |
| 37. | Laureldale Borough | 1,625 | 1,055,108(0.15%)#37 | 61,755,866(0.00%)#3,456 |
| 38. | Bristol Borough | 1,582 | 1,055,108(0.15%)#38 | 61,755,866(0.00%)#3,509 |
| 39. | Shenandoah Borough | 1,562 | 1,055,108(0.15%)#39 | 61,755,866(0.00%)#3,539 |
| 40. | Drexel Hill | 1,552 | 1,055,108(0.15%)#40 | 61,755,866(0.00%)#3,551 |
| 41. | Colonial Park | 1,501 | 1,055,108(0.14%)#41 | 61,755,866(0.00%)#3,629 |
| 42. | Croydon | 1,461 | 1,055,108(0.14%)#42 | 61,755,866(0.00%)#3,686 |
| 43. | Steelton Borough | 1,441 | 1,055,108(0.14%)#43 | 61,755,866(0.00%)#3,721 |
| 44. | West Reading Borough | 1,416 | 1,055,108(0.13%)#44 | 61,755,866(0.00%)#3,760 |
| 45. | Penn Estates | 1,396 | 1,055,108(0.13%)#45 | 61,755,866(0.00%)#3,798 |
| 46. | Middletown | 1,384 | 1,055,108(0.13%)#46 | 61,755,866(0.00%)#3,814 |
| 47. | Shiloh | 1,321 | 1,055,108(0.13%)#47 | 61,755,866(0.00%)#3,929 |
| 48. | Quakertown Borough | 1,320 | 1,055,108(0.13%)#48 | 61,755,866(0.00%)#3,932 |
| 49. | Saw Creek | 1,314 | 1,055,108(0.12%)#49 | 61,755,866(0.00%)#3,947 |
| 50. | Gettysburg Borough | 1,257 | 1,055,108(0.12%)#50 | 61,755,866(0.00%)#4,033 |
| 51. | Ephrata Borough | 1,246 | 1,055,108(0.12%)#51 | 61,755,866(0.00%)#4,059 |
| 52. | Palmyra Borough | 1,211 | 1,055,108(0.11%)#52 | 61,755,866(0.00%)#4,131 |
| 53. | Wyomissing Borough | 1,184 | 1,055,108(0.11%)#53 | 61,755,866(0.00%)#4,190 |
| 54. | Shillington Borough | 1,172 | 1,055,108(0.11%)#54 | 61,755,866(0.00%)#4,224 |
| 55. | Lansdale Borough | 1,144 | 1,055,108(0.11%)#55 | 61,755,866(0.00%)#4,266 |
| 56. | Stroudsburg Borough | 1,144 | 1,055,108(0.11%)#56 | 61,755,866(0.00%)#4,268 |
| 57. | Catasauqua Borough | 1,135 | 1,055,108(0.11%)#57 | 61,755,866(0.00%)#4,280 |
| 58. | Souderton Borough | 1,133 | 1,055,108(0.11%)#58 | 61,755,866(0.00%)#4,285 |
| 59. | Hyde Park | 1,133 | 1,055,108(0.11%)#59 | 61,755,866(0.00%)#4,286 |
| 60. | Roslyn | 1,127 | 1,055,108(0.11%)#60 | 61,755,866(0.00%)#4,299 |
| 61. | West York Borough | 1,125 | 1,055,108(0.11%)#61 | 61,755,866(0.00%)#4,307 |
| 62. | Nanticoke | 1,115 | 1,055,108(0.11%)#62 | 61,755,866(0.00%)#4,324 |
| 63. | Mount Joy Borough | 1,107 | 1,055,108(0.10%)#63 | 61,755,866(0.00%)#4,345 |
| 64. | Bloomsburg | 1,053 | 1,055,108(0.10%)#64 | 61,755,866(0.00%)#4,485 |
| 65. | Leola | 1,037 | 1,055,108(0.10%)#65 | 61,755,866(0.00%)#4,525 |
| 66. | Northampton Borough | 1,029 | 1,055,108(0.10%)#66 | 61,755,866(0.00%)#4,540 |
| 67. | Mount Pocono Borough | 1,027 | 1,055,108(0.10%)#67 | 61,755,866(0.00%)#4,545 |
| 68. | Pennside | 1,025 | 1,055,108(0.10%)#68 | 61,755,866(0.00%)#4,550 |
| 69. | Pleasant Hill | 1,000 | 1,055,108(0.09%)#69 | 61,755,866(0.00%)#4,615 |
| 70. | Pottsville | 997 | 1,055,108(0.09%)#70 | 61,755,866(0.00%)#4,624 |
| 71. | Middletown Borough | 966 | 1,055,108(0.09%)#71 | 61,755,866(0.00%)#4,719 |
| 72. | Taylor Borough | 959 | 1,055,108(0.09%)#72 | 61,755,866(0.00%)#4,739 |
| 73. | Sierra View | 953 | 1,055,108(0.09%)#73 | 61,755,866(0.00%)#4,758 |
| 74. | Dunmore Borough | 945 | 1,055,108(0.09%)#74 | 61,755,866(0.00%)#4,775 |
| 75. | Coplay Borough | 943 | 1,055,108(0.09%)#75 | 61,755,866(0.00%)#4,781 |
| 76. | Kenhorst Borough | 940 | 1,055,108(0.09%)#76 | 61,755,866(0.00%)#4,792 |
| 77. | Progress | 931 | 1,055,108(0.09%)#77 | 61,755,866(0.00%)#4,827 |
| 78. | Millersville Borough | 928 | 1,055,108(0.09%)#78 | 61,755,866(0.00%)#4,837 |
| 79. | Parkville | 922 | 1,055,108(0.09%)#79 | 61,755,866(0.00%)#4,858 |
| 80. | Tamaqua Borough | 914 | 1,055,108(0.09%)#80 | 61,755,866(0.00%)#4,881 |
| 81. | Mount Penn Borough | 903 | 1,055,108(0.09%)#81 | 61,755,866(0.00%)#4,913 |
| 82. | New Castle | 902 | 1,055,108(0.09%)#82 | 61,755,866(0.00%)#4,915 |
| 83. | Freemansburg Borough | 898 | 1,055,108(0.09%)#83 | 61,755,866(0.00%)#4,928 |
| 84. | Sunbury | 881 | 1,055,108(0.08%)#84 | 61,755,866(0.00%)#4,974 |
| 85. | Bridgeport Borough | 852 | 1,055,108(0.08%)#85 | 61,755,866(0.00%)#5,062 |
| 86. | Edwardsville Borough | 845 | 1,055,108(0.08%)#86 | 61,755,866(0.00%)#5,088 |
| 87. | Avondale Borough | 842 | 1,055,108(0.08%)#87 | 61,755,866(0.00%)#5,096 |
| 88. | Telford Borough | 837 | 1,055,108(0.08%)#88 | 61,755,866(0.00%)#5,107 |
| 89. | Altoona | 827 | 1,055,108(0.08%)#89 | 61,755,866(0.00%)#5,147 |
| 90. | Mcadoo Borough | 819 | 1,055,108(0.08%)#90 | 61,755,866(0.00%)#5,177 |
| 91. | Emerald Lakes | 813 | 1,055,108(0.08%)#91 | 61,755,866(0.00%)#5,191 |
| 92. | Monroeville | 806 | 1,055,108(0.08%)#92 | 61,755,866(0.00%)#5,212 |
| 93. | Weigelstown | 801 | 1,055,108(0.08%)#93 | 61,755,866(0.00%)#5,233 |
| 94. | Johnstown | 790 | 1,055,108(0.07%)#94 | 61,755,866(0.00%)#5,269 |
| 95. | Shamokin | 788 | 1,055,108(0.07%)#95 | 61,755,866(0.00%)#5,278 |
| 96. | Hereford | 776 | 1,055,108(0.07%)#96 | 61,755,866(0.00%)#5,324 |
| 97. | Phoenixville Borough | 767 | 1,055,108(0.07%)#97 | 61,755,866(0.00%)#5,359 |
| 98. | Blandon | 762 | 1,055,108(0.07%)#98 | 61,755,866(0.00%)#5,378 |
| 99. | Macungie Borough | 761 | 1,055,108(0.07%)#99 | 61,755,866(0.00%)#5,383 |
| 100. | Old Forge Borough | 758 | 1,055,108(0.07%)#100 | 61,755,866(0.00%)#5,390 |
Common Questions
What are the Top 10 Cities with the Largest Hispanic or Latino Community in Pennsylvania?
Top 10 Cities with the Largest Hispanic or Latino Community in Pennsylvania are:
#1
249,723
#2
68,077
#3
63,542
#4
23,083
#5
22,822
#6
18,461
#7
15,239
#8
12,844
#9
12,362
#10
12,262
What city has the Largest Hispanic or Latino Community in Pennsylvania?
Philadelphia has the Largest Hispanic or Latino Community in Pennsylvania with 249,723.
What is the Total Hispanic or Latino Population in the State of Pennsylvania?
Total Hispanic or Latino Population in Pennsylvania is 1,055,108.
What is the Total Hispanic or Latino Population in the United States?
Total Hispanic or Latino Population in the United States is 61,755,866.