Cities with the Most Immigrants from Iran in Pennsylvania
RELATED REPORTS & OPTIONS
Iran
Pennsylvania
Compare Cities
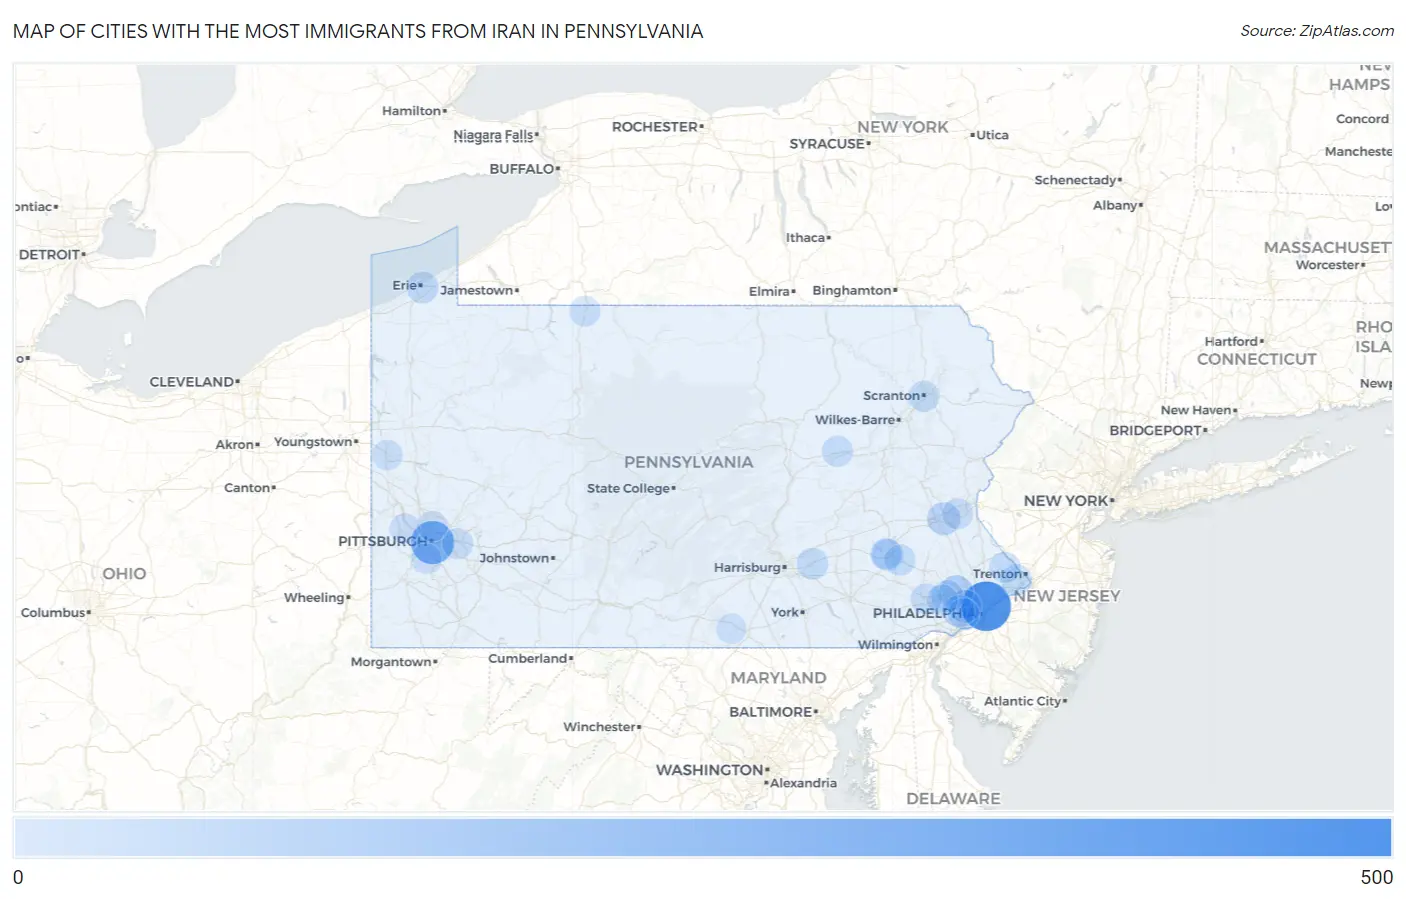
Map of Cities with the Most Immigrants from Iran in Pennsylvania
0
500
Cities with the Most Immigrants from Iran in Pennsylvania
| City | Iran | vs State | vs National | |
| 1. | Philadelphia | 419 | 4,204(9.97%)#1 | 391,354(0.11%)#125 |
| 2. | State College Borough | 357 | 4,204(8.49%)#2 | 391,354(0.09%)#148 |
| 3. | Pittsburgh | 278 | 4,204(6.61%)#3 | 391,354(0.07%)#199 |
| 4. | Wayne | 134 | 4,204(3.19%)#4 | 391,354(0.03%)#415 |
| 5. | Carlisle Borough | 96 | 4,204(2.28%)#5 | 391,354(0.02%)#543 |
| 6. | King Of Prussia | 89 | 4,204(2.12%)#6 | 391,354(0.02%)#578 |
| 7. | Lansdowne Borough | 64 | 4,204(1.52%)#7 | 391,354(0.02%)#752 |
| 8. | Allentown | 59 | 4,204(1.40%)#8 | 391,354(0.02%)#787 |
| 9. | Ardmore | 57 | 4,204(1.36%)#9 | 391,354(0.01%)#807 |
| 10. | Bala Cynwyd | 57 | 4,204(1.36%)#10 | 391,354(0.01%)#808 |
| 11. | Oakland Cdp Cambria County | 51 | 4,204(1.21%)#11 | 391,354(0.01%)#871 |
| 12. | Indiana Borough | 47 | 4,204(1.12%)#12 | 391,354(0.01%)#915 |
| 13. | Broomall | 39 | 4,204(0.93%)#13 | 391,354(0.01%)#1,029 |
| 14. | Chesterbrook | 38 | 4,204(0.90%)#14 | 391,354(0.01%)#1,046 |
| 15. | Erie | 34 | 4,204(0.81%)#15 | 391,354(0.01%)#1,098 |
| 16. | Colony Park | 30 | 4,204(0.71%)#16 | 391,354(0.01%)#1,215 |
| 17. | Chester Heights Borough | 29 | 4,204(0.69%)#17 | 391,354(0.01%)#1,234 |
| 18. | Hershey | 28 | 4,204(0.67%)#18 | 391,354(0.01%)#1,250 |
| 19. | Spring Ridge | 28 | 4,204(0.67%)#19 | 391,354(0.01%)#1,262 |
| 20. | Fairless Hills | 26 | 4,204(0.62%)#20 | 391,354(0.01%)#1,315 |
| 21. | Wilkinsburg Borough | 22 | 4,204(0.52%)#21 | 391,354(0.01%)#1,403 |
| 22. | Mount Joy Borough | 22 | 4,204(0.52%)#22 | 391,354(0.01%)#1,408 |
| 23. | Lightstreet | 21 | 4,204(0.50%)#23 | 391,354(0.01%)#1,435 |
| 24. | Phoenixville Borough | 20 | 4,204(0.48%)#24 | 391,354(0.01%)#1,454 |
| 25. | Scranton | 19 | 4,204(0.45%)#25 | 391,354(0.00%)#1,471 |
| 26. | Monroeville | 19 | 4,204(0.45%)#26 | 391,354(0.00%)#1,481 |
| 27. | Hatboro Borough | 19 | 4,204(0.45%)#27 | 391,354(0.00%)#1,489 |
| 28. | Lionville | 19 | 4,204(0.45%)#28 | 391,354(0.00%)#1,491 |
| 29. | Newtown Grant | 19 | 4,204(0.45%)#29 | 391,354(0.00%)#1,495 |
| 30. | Reiffton | 19 | 4,204(0.45%)#30 | 391,354(0.00%)#1,499 |
| 31. | Drexel Hill | 18 | 4,204(0.43%)#31 | 391,354(0.00%)#1,515 |
| 32. | Baldwin Borough | 18 | 4,204(0.43%)#32 | 391,354(0.00%)#1,521 |
| 33. | West View Borough | 18 | 4,204(0.43%)#33 | 391,354(0.00%)#1,535 |
| 34. | Paoli | 18 | 4,204(0.43%)#34 | 391,354(0.00%)#1,536 |
| 35. | Collegeville Borough | 18 | 4,204(0.43%)#35 | 391,354(0.00%)#1,537 |
| 36. | Edgewood Borough | 18 | 4,204(0.43%)#36 | 391,354(0.00%)#1,542 |
| 37. | Bethlehem | 17 | 4,204(0.40%)#37 | 391,354(0.00%)#1,548 |
| 38. | Exeter Borough | 17 | 4,204(0.40%)#38 | 391,354(0.00%)#1,581 |
| 39. | Lansdale Borough | 15 | 4,204(0.36%)#39 | 391,354(0.00%)#1,628 |
| 40. | East Stroudsburg Borough | 14 | 4,204(0.33%)#40 | 391,354(0.00%)#1,676 |
| 41. | Bradford | 13 | 4,204(0.31%)#41 | 391,354(0.00%)#1,730 |
| 42. | Merion Station | 11 | 4,204(0.26%)#42 | 391,354(0.00%)#1,827 |
| 43. | Bethel Park | 10 | 4,204(0.24%)#43 | 391,354(0.00%)#1,856 |
| 44. | Doylestown Borough | 10 | 4,204(0.24%)#44 | 391,354(0.00%)#1,887 |
| 45. | Crafton Borough | 10 | 4,204(0.24%)#45 | 391,354(0.00%)#1,892 |
| 46. | Carnot Moon | 9 | 4,204(0.21%)#46 | 391,354(0.00%)#1,948 |
| 47. | Pennsburg Borough | 9 | 4,204(0.21%)#47 | 391,354(0.00%)#1,967 |
| 48. | West Chester Borough | 8 | 4,204(0.19%)#48 | 391,354(0.00%)#2,015 |
| 49. | Kingston Borough | 8 | 4,204(0.19%)#49 | 391,354(0.00%)#2,024 |
| 50. | Oakwood | 8 | 4,204(0.19%)#50 | 391,354(0.00%)#2,055 |
| 51. | Glenshaw | 6 | 4,204(0.14%)#51 | 391,354(0.00%)#2,133 |
| 52. | Lewistown Borough | 6 | 4,204(0.14%)#52 | 391,354(0.00%)#2,135 |
| 53. | Sewickley Hills Borough | 6 | 4,204(0.14%)#53 | 391,354(0.00%)#2,163 |
| 54. | Rosemont | 4 | 4,204(0.10%)#54 | 391,354(0.00%)#2,239 |
| 55. | Pen Argyl Borough | 4 | 4,204(0.10%)#55 | 391,354(0.00%)#2,240 |
| 56. | Sewickley Heights Borough | 4 | 4,204(0.10%)#56 | 391,354(0.00%)#2,255 |
| 57. | Marietta Borough | 3 | 4,204(0.07%)#57 | 391,354(0.00%)#2,275 |
| 58. | Orrtanna | 2 | 4,204(0.05%)#58 | 391,354(0.00%)#2,340 |
| 59. | Thornburg Borough | 1 | 4,204(0.02%)#59 | 391,354(0.00%)#2,351 |
Common Questions
What are the Top 10 Cities with the Most Immigrants from Iran in Pennsylvania?
Top 10 Cities with the Most Immigrants from Iran in Pennsylvania are:
#1
419
#2
278
#3
89
#4
59
#5
57
#6
39
#7
38
#8
34
#9
30
#10
28
What city has the Most Immigrants from Iran in Pennsylvania?
Philadelphia has the Most Immigrants from Iran in Pennsylvania with 419.
What is the Total Immigrants from Iran in the State of Pennsylvania?
Total Immigrants from Iran in Pennsylvania is 4,204.
What is the Total Immigrants from Iran in the United States?
Total Immigrants from Iran in the United States is 391,354.