Zip Codes with the Highest Percentage of Population Employed in Food Preparation & Serving in Mckeesport, PA
RELATED REPORTS & OPTIONS
Food Preparation & Serving
Mckeesport
Compare Zip Codes
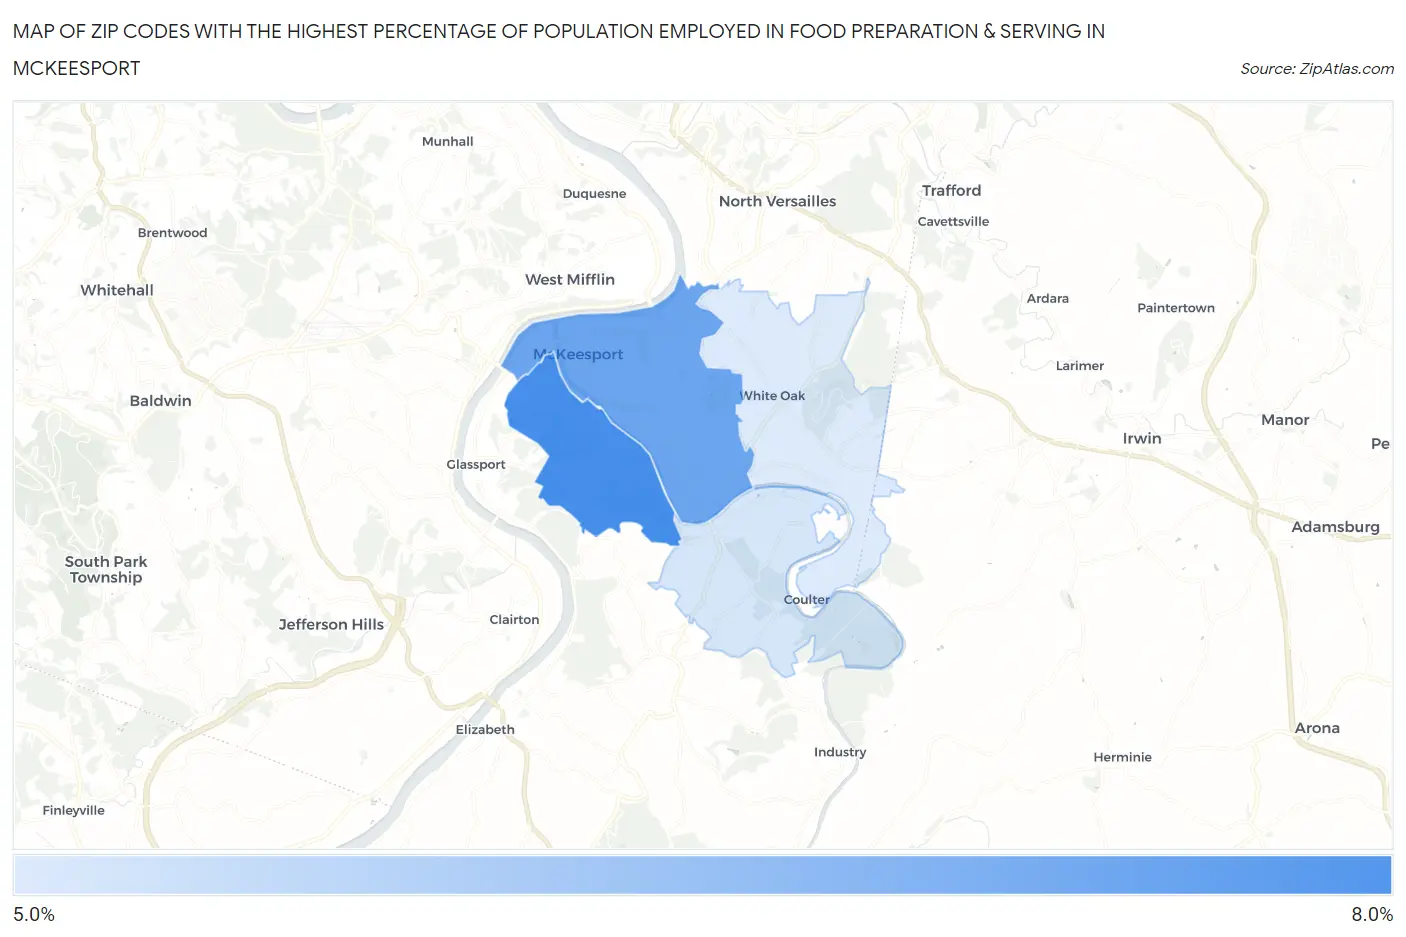
Map of Zip Codes with the Highest Percentage of Population Employed in Food Preparation & Serving in Mckeesport
5.6%
7.1%
Zip Codes with the Highest Percentage of Population Employed in Food Preparation & Serving in Mckeesport, PA
| Zip Code | % Employed | vs State | vs National | |
| 1. | 15133 | 7.1% | 5.0%(+2.01)#338 | 5.3%(+1.77)#6,425 |
| 2. | 15132 | 6.7% | 5.0%(+1.65)#380 | 5.3%(+1.41)#7,348 |
| 3. | 15135 | 5.7% | 5.0%(+0.635)#571 | 5.3%(+0.393)#10,431 |
| 4. | 15131 | 5.6% | 5.0%(+0.559)#585 | 5.3%(+0.317)#10,688 |
1
Common Questions
What are the Top 3 Zip Codes with the Highest Percentage of Population Employed in Food Preparation & Serving in Mckeesport, PA?
Top 3 Zip Codes with the Highest Percentage of Population Employed in Food Preparation & Serving in Mckeesport, PA are:
What zip code has the Highest Percentage of Population Employed in Food Preparation & Serving in Mckeesport, PA?
15133 has the Highest Percentage of Population Employed in Food Preparation & Serving in Mckeesport, PA with 7.1%.
What is the Percentage of Population Employed in Food Preparation & Serving in Mckeesport, PA?
Percentage of Population Employed in Food Preparation & Serving in Mckeesport is 6.2%.
What is the Percentage of Population Employed in Food Preparation & Serving in Pennsylvania?
Percentage of Population Employed in Food Preparation & Serving in Pennsylvania is 5.0%.
What is the Percentage of Population Employed in Food Preparation & Serving in the United States?
Percentage of Population Employed in Food Preparation & Serving in the United States is 5.3%.