Indiana borough, PA Map & Demographics
Indiana borough Overview
$21,332
PER CAPITA INCOME
$87,090
AVG FAMILY INCOME
$40,013
AVG HOUSEHOLD INCOME
47.7%
WAGE / INCOME GAP [ % ]
52.3¢/ $1
WAGE / INCOME GAP [ $ ]
0.50
INEQUALITY / GINI INDEX
14,082
TOTAL POPULATION
6,693
MALE POPULATION
7,389
FEMALE POPULATION
90.58
MALES / 100 FEMALES
110.40
FEMALES / 100 MALES
21.8
MEDIAN AGE
3.2
AVG FAMILY SIZE
2.3
AVG HOUSEHOLD SIZE
7,054
LABOR FORCE [ PEOPLE ]
55.1%
PERCENT IN LABOR FORCE
8.3%
UNEMPLOYMENT RATE
Income in Indiana borough
Income Overview in Indiana borough
Per Capita Income in Indiana borough is $21,332, while median incomes of families and households are $87,090 and $40,013 respectively.
| Characteristic | Number | Measure |
| Per Capita Income | 14,082 | $21,332 |
| Median Family Income | 1,662 | $87,090 |
| Mean Family Income | 1,662 | $110,024 |
| Median Household Income | 4,268 | $40,013 |
| Mean Household Income | 4,268 | $65,270 |
| Income Deficit | 1,662 | $0 |
| Wage / Income Gap (%) | 14,082 | 47.74% |
| Wage / Income Gap ($) | 14,082 | 52.26¢ per $1 |
| Gini / Inequality Index | 14,082 | 0.50 |
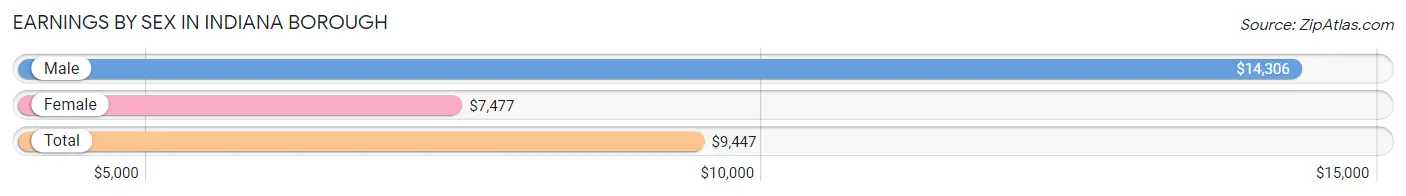
Earnings by Sex in Indiana borough
Average Earnings in Indiana borough are $9,447, $14,306 for men and $7,477 for women, a difference of 47.7%.
| Sex | Number | Average Earnings |
| Male | 4,522 (46.5%) | $14,306 |
| Female | 5,196 (53.5%) | $7,477 |
| Total | 9,718 (100.0%) | $9,447 |
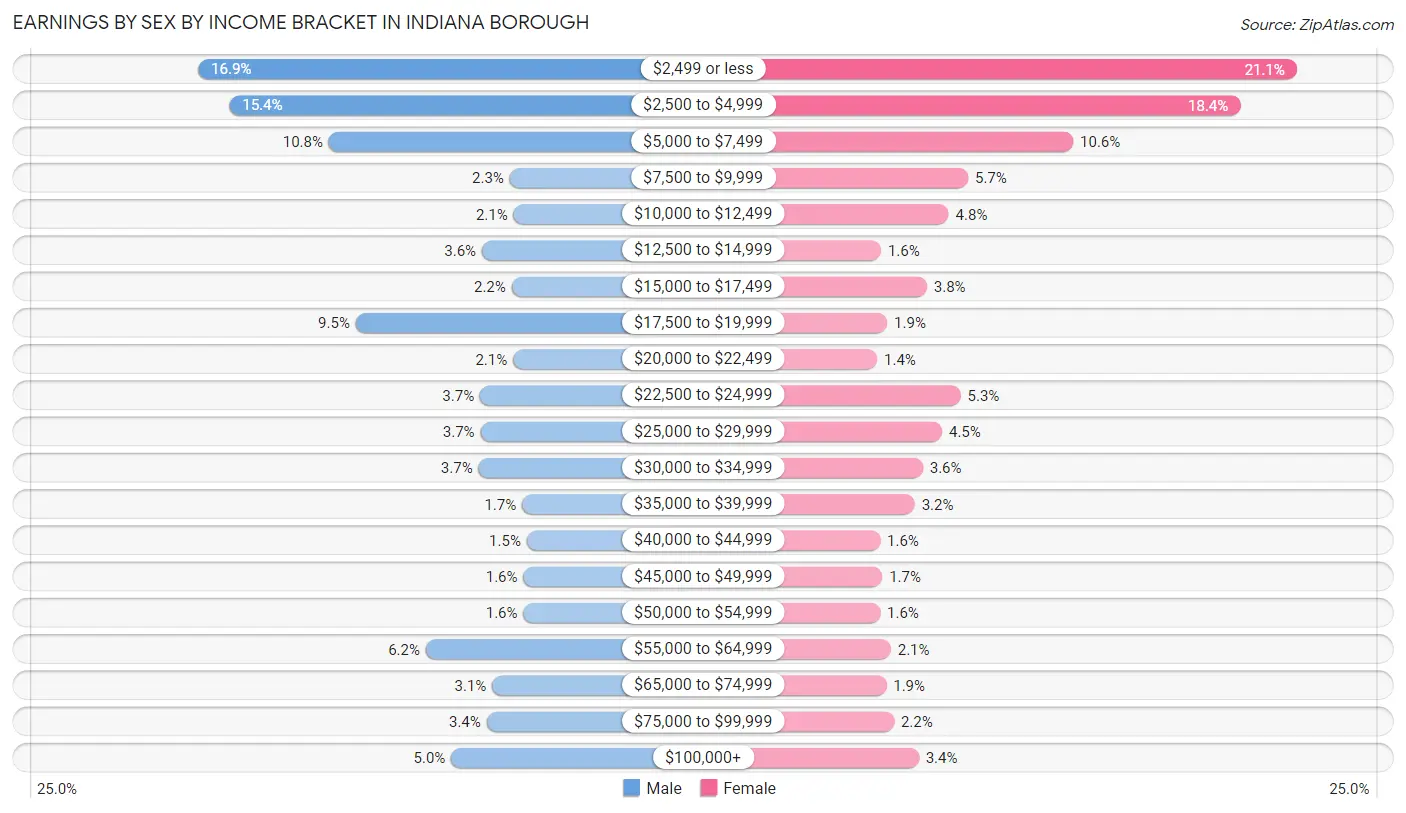
Earnings by Sex by Income Bracket in Indiana borough
The most common earnings brackets in Indiana borough are $2,499 or less for men (763 | 16.9%) and $2,499 or less for women (1,095 | 21.1%).
| Income | Male | Female |
| $2,499 or less | 763 (16.9%) | 1,095 (21.1%) |
| $2,500 to $4,999 | 697 (15.4%) | 957 (18.4%) |
| $5,000 to $7,499 | 486 (10.7%) | 551 (10.6%) |
| $7,500 to $9,999 | 103 (2.3%) | 295 (5.7%) |
| $10,000 to $12,499 | 95 (2.1%) | 248 (4.8%) |
| $12,500 to $14,999 | 162 (3.6%) | 83 (1.6%) |
| $15,000 to $17,499 | 99 (2.2%) | 195 (3.7%) |
| $17,500 to $19,999 | 429 (9.5%) | 98 (1.9%) |
| $20,000 to $22,499 | 96 (2.1%) | 74 (1.4%) |
| $22,500 to $24,999 | 166 (3.7%) | 277 (5.3%) |
| $25,000 to $29,999 | 165 (3.6%) | 232 (4.5%) |
| $30,000 to $34,999 | 169 (3.7%) | 185 (3.6%) |
| $35,000 to $39,999 | 77 (1.7%) | 165 (3.2%) |
| $40,000 to $44,999 | 67 (1.5%) | 81 (1.6%) |
| $45,000 to $49,999 | 74 (1.6%) | 86 (1.7%) |
| $50,000 to $54,999 | 74 (1.6%) | 81 (1.6%) |
| $55,000 to $64,999 | 281 (6.2%) | 107 (2.1%) |
| $65,000 to $74,999 | 140 (3.1%) | 96 (1.8%) |
| $75,000 to $99,999 | 152 (3.4%) | 115 (2.2%) |
| $100,000+ | 227 (5.0%) | 175 (3.4%) |
| Total | 4,522 (100.0%) | 5,196 (100.0%) |
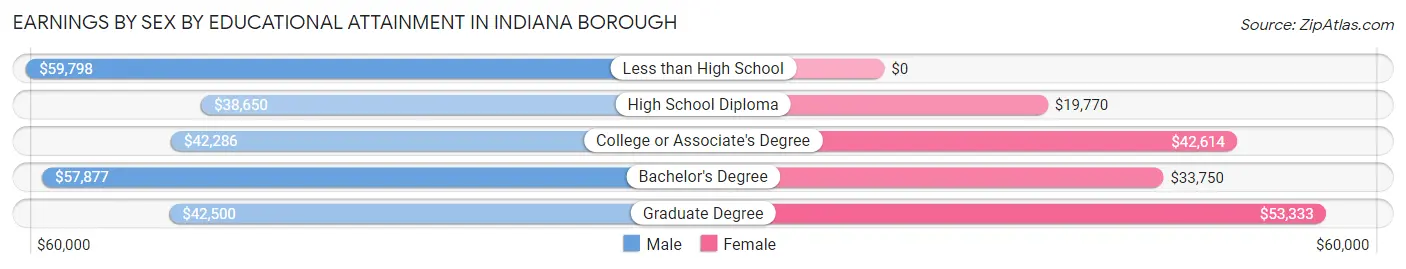
Earnings by Sex by Educational Attainment in Indiana borough
Average earnings in Indiana borough are $49,932 for men and $33,714 for women, a difference of 32.5%. Men with an educational attainment of less than high school enjoy the highest average annual earnings of $59,798, while those with high school diploma education earn the least with $38,650. Women with an educational attainment of graduate degree earn the most with the average annual earnings of $53,333, while those with high school diploma education have the smallest earnings of $19,770.
| Educational Attainment | Male Income | Female Income |
| Less than High School | $59,798 | $0 |
| High School Diploma | $38,650 | $19,770 |
| College or Associate's Degree | $42,286 | $42,614 |
| Bachelor's Degree | $57,877 | $33,750 |
| Graduate Degree | $42,500 | $53,333 |
| Total | $49,932 | $33,714 |
Family Income in Indiana borough
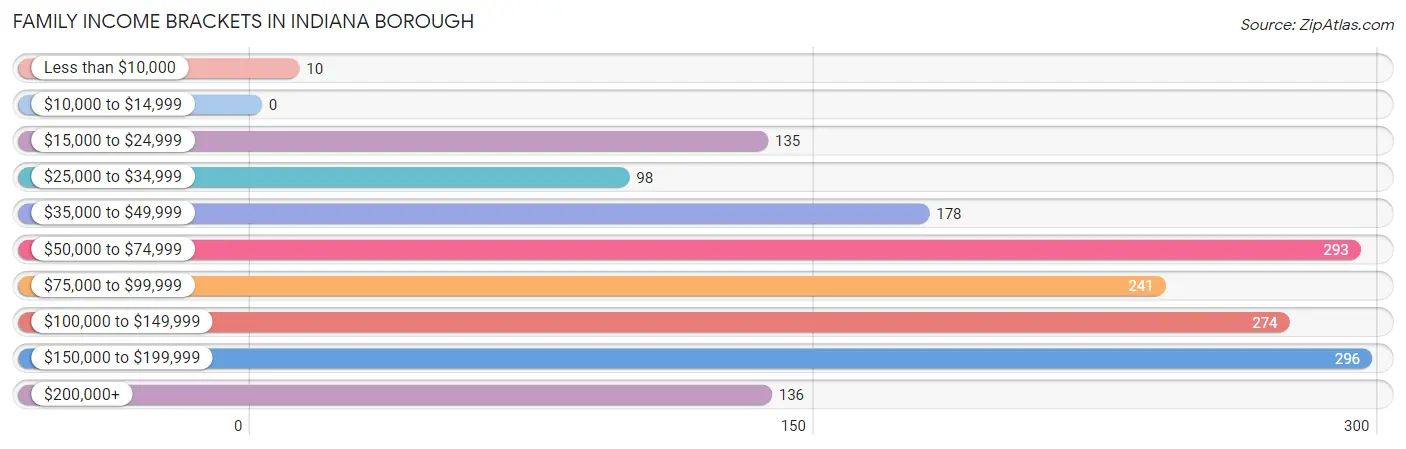
Family Income Brackets in Indiana borough
According to the Indiana borough family income data, there are 296 families falling into the $150,000 to $199,999 income range, which is the most common income bracket and makes up 17.8% of all families.
| Income Bracket | # Families | % Families |
| Less than $10,000 | 10 | 0.6% |
| $10,000 to $14,999 | 0 | 0.0% |
| $15,000 to $24,999 | 135 | 8.1% |
| $25,000 to $34,999 | 98 | 5.9% |
| $35,000 to $49,999 | 178 | 10.7% |
| $50,000 to $74,999 | 293 | 17.6% |
| $75,000 to $99,999 | 241 | 14.5% |
| $100,000 to $149,999 | 274 | 16.5% |
| $150,000 to $199,999 | 296 | 17.8% |
| $200,000+ | 136 | 8.2% |
Family Income by Famaliy Size in Indiana borough
5-person families (87 | 5.2%) account for the highest median family income in Indiana borough with $179,063 per family, while 5-person families (87 | 5.2%) have the highest median income of $35,813 per family member.
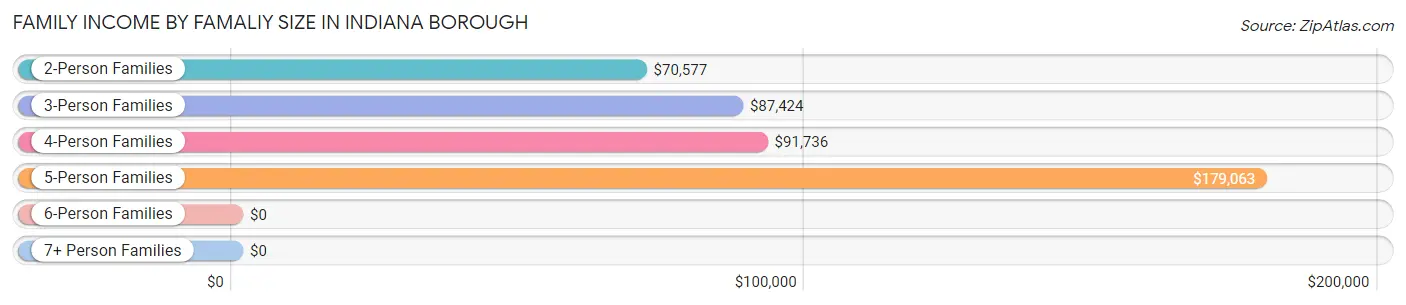
| Income Bracket | # Families | Median Income |
| 2-Person Families | 748 (45.0%) | $70,577 |
| 3-Person Families | 458 (27.6%) | $87,424 |
| 4-Person Families | 351 (21.1%) | $91,736 |
| 5-Person Families | 87 (5.2%) | $179,063 |
| 6-Person Families | 0 (0.0%) | $0 |
| 7+ Person Families | 18 (1.1%) | $0 |
| Total | 1,662 (100.0%) | $87,090 |
Family Income by Number of Earners in Indiana borough
The median family income in Indiana borough is $87,090, with families comprising 2 earners (748) having the highest median family income of $117,778, while families with 1 earner (454) have the lowest median family income of $48,824, accounting for 45.0% and 27.3% of families, respectively.
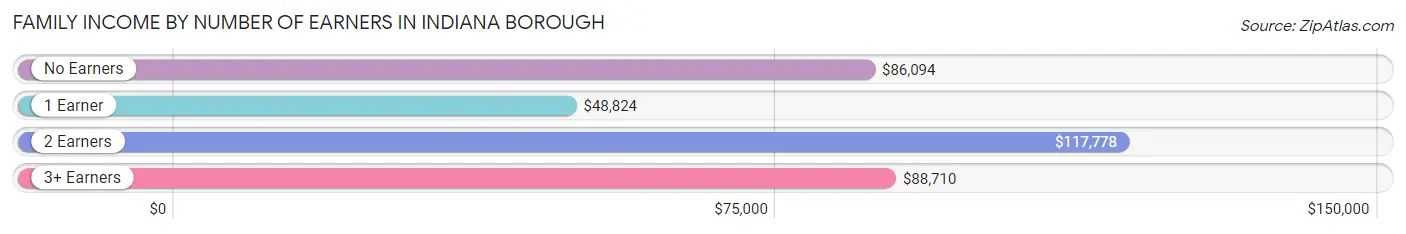
| Number of Earners | # Families | Median Income |
| No Earners | 230 (13.8%) | $86,094 |
| 1 Earner | 454 (27.3%) | $48,824 |
| 2 Earners | 748 (45.0%) | $117,778 |
| 3+ Earners | 230 (13.8%) | $88,710 |
| Total | 1,662 (100.0%) | $87,090 |
Household Income in Indiana borough
Household Income Brackets in Indiana borough
With 730 households falling in the category, the $15,000 to $24,999 income range is the most frequent in Indiana borough, accounting for 17.1% of all households. In contrast, only 145 households (3.4%) fall into the $200,000+ income bracket, making it the least populous group.
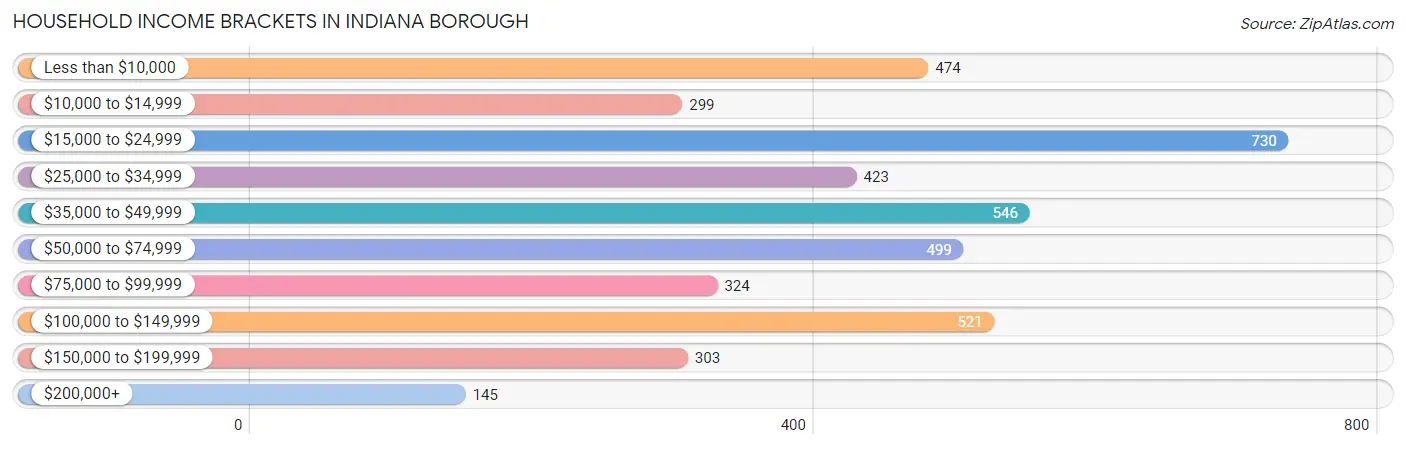
| Income Bracket | # Households | % Households |
| Less than $10,000 | 474 | 11.1% |
| $10,000 to $14,999 | 299 | 7.0% |
| $15,000 to $24,999 | 730 | 17.1% |
| $25,000 to $34,999 | 423 | 9.9% |
| $35,000 to $49,999 | 546 | 12.8% |
| $50,000 to $74,999 | 499 | 11.7% |
| $75,000 to $99,999 | 324 | 7.6% |
| $100,000 to $149,999 | 521 | 12.2% |
| $150,000 to $199,999 | 303 | 7.1% |
| $200,000+ | 145 | 3.4% |
Household Income by Householder Age in Indiana borough
The median household income in Indiana borough is $40,013, with the highest median household income of $66,607 found in the 45 to 64 years age bracket for the primary householder. A total of 1,065 households (24.9%) fall into this category. Meanwhile, the 15 to 24 years age bracket for the primary householder has the lowest median household income of $23,236, with 1,078 households (25.3%) in this group.
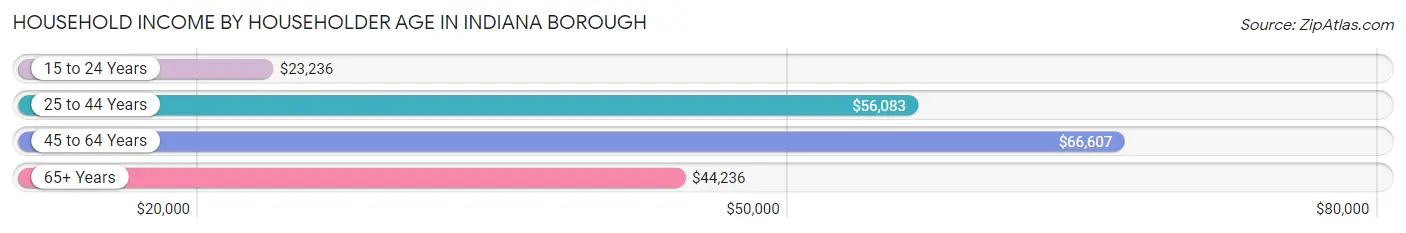
| Income Bracket | # Households | Median Income |
| 15 to 24 Years | 1,078 (25.3%) | $23,236 |
| 25 to 44 Years | 1,452 (34.0%) | $56,083 |
| 45 to 64 Years | 1,065 (24.9%) | $66,607 |
| 65+ Years | 673 (15.8%) | $44,236 |
| Total | 4,268 (100.0%) | $40,013 |
Poverty in Indiana borough
Income Below Poverty by Sex and Age in Indiana borough
With 22.3% poverty level for males and 26.7% for females among the residents of Indiana borough, 15 year old males and 18 to 24 year old females are the most vulnerable to poverty, with 11 males (55.0%) and 970 females (53.5%) in their respective age groups living below the poverty level.
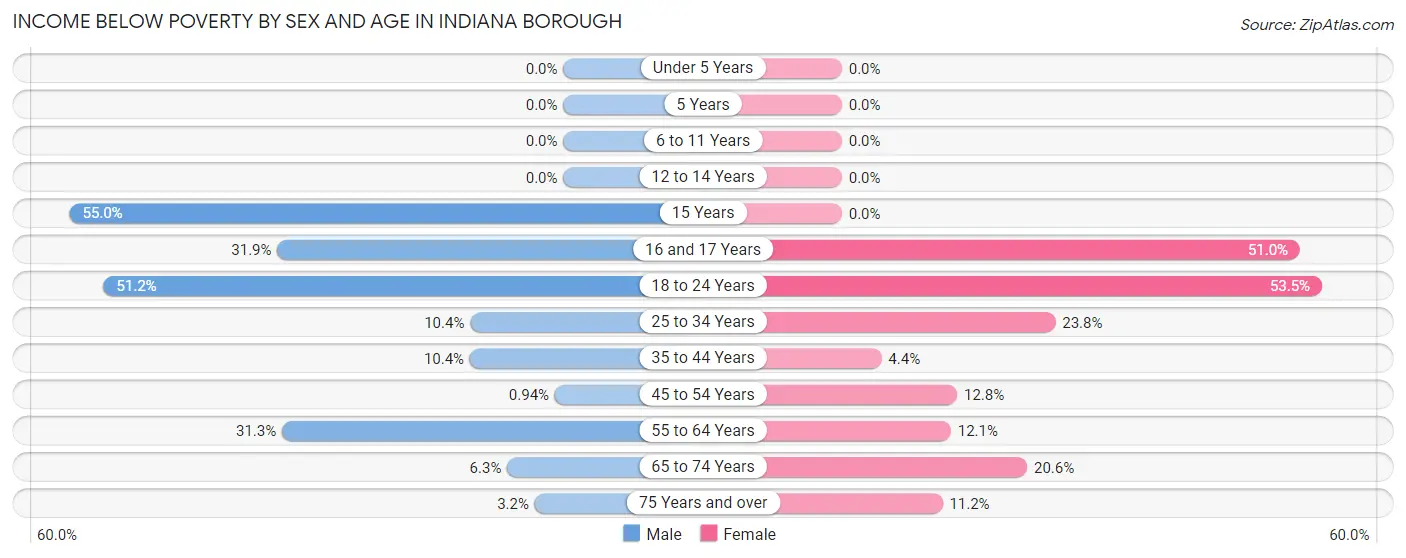
| Age Bracket | Male | Female |
| Under 5 Years | 0 (0.0%) | 0 (0.0%) |
| 5 Years | 0 (0.0%) | 0 (0.0%) |
| 6 to 11 Years | 0 (0.0%) | 0 (0.0%) |
| 12 to 14 Years | 0 (0.0%) | 0 (0.0%) |
| 15 Years | 11 (55.0%) | 0 (0.0%) |
| 16 and 17 Years | 50 (31.9%) | 25 (51.0%) |
| 18 to 24 Years | 711 (51.2%) | 970 (53.5%) |
| 25 to 34 Years | 70 (10.4%) | 175 (23.8%) |
| 35 to 44 Years | 50 (10.4%) | 26 (4.4%) |
| 45 to 54 Years | 5 (0.9%) | 43 (12.8%) |
| 55 to 64 Years | 141 (31.3%) | 64 (12.1%) |
| 65 to 74 Years | 14 (6.2%) | 79 (20.6%) |
| 75 Years and over | 5 (3.2%) | 24 (11.2%) |
| Total | 1,057 (22.3%) | 1,406 (26.7%) |
Income Above Poverty by Sex and Age in Indiana borough
According to the poverty statistics in Indiana borough, males aged under 5 years and females aged under 5 years are the age groups that are most secure financially, with 100.0% of males and 100.0% of females in these age groups living above the poverty line.
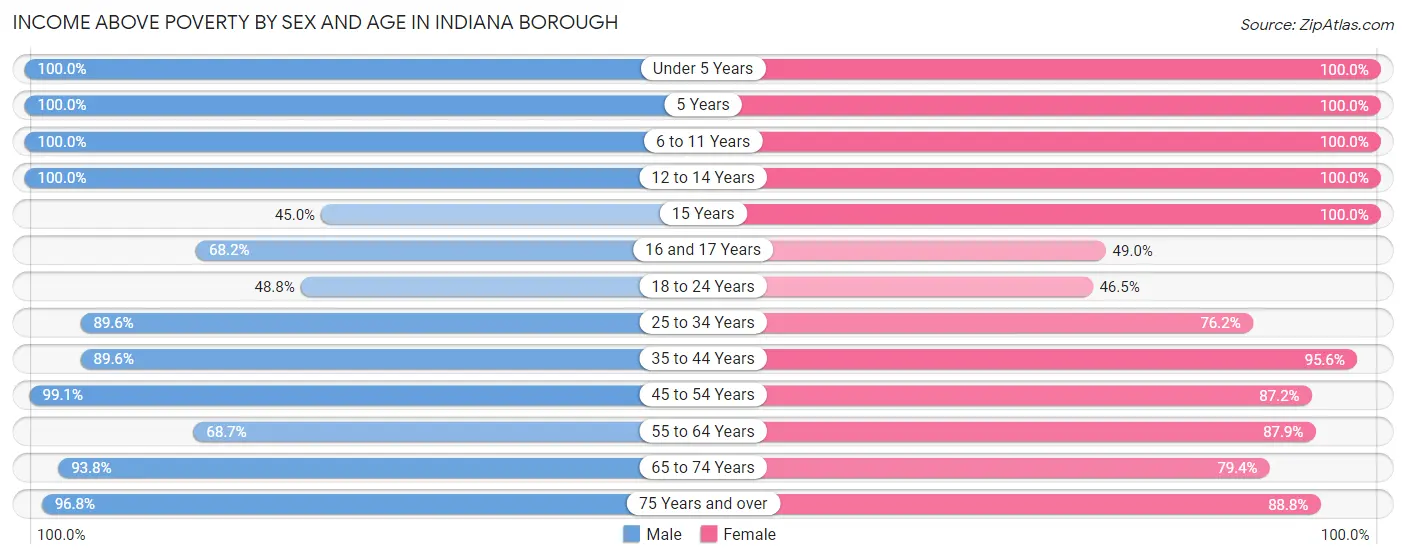
| Age Bracket | Male | Female |
| Under 5 Years | 244 (100.0%) | 206 (100.0%) |
| 5 Years | 51 (100.0%) | 30 (100.0%) |
| 6 to 11 Years | 227 (100.0%) | 200 (100.0%) |
| 12 to 14 Years | 125 (100.0%) | 124 (100.0%) |
| 15 Years | 9 (45.0%) | 53 (100.0%) |
| 16 and 17 Years | 107 (68.1%) | 24 (49.0%) |
| 18 to 24 Years | 677 (48.8%) | 844 (46.5%) |
| 25 to 34 Years | 605 (89.6%) | 561 (76.2%) |
| 35 to 44 Years | 431 (89.6%) | 564 (95.6%) |
| 45 to 54 Years | 527 (99.1%) | 292 (87.2%) |
| 55 to 64 Years | 309 (68.7%) | 463 (87.9%) |
| 65 to 74 Years | 210 (93.8%) | 304 (79.4%) |
| 75 Years and over | 152 (96.8%) | 190 (88.8%) |
| Total | 3,674 (77.7%) | 3,855 (73.3%) |
Income Below Poverty Among Married-Couple Families in Indiana borough
The poverty statistics for married-couple families in Indiana borough show that 1.1% or 15 of the total 1,319 families live below the poverty line. Families with 1 or 2 children have the highest poverty rate of 2.3%, comprising of 10 families. On the other hand, families with 3 or 4 children have the lowest poverty rate of 0.0%, which includes 0 families.
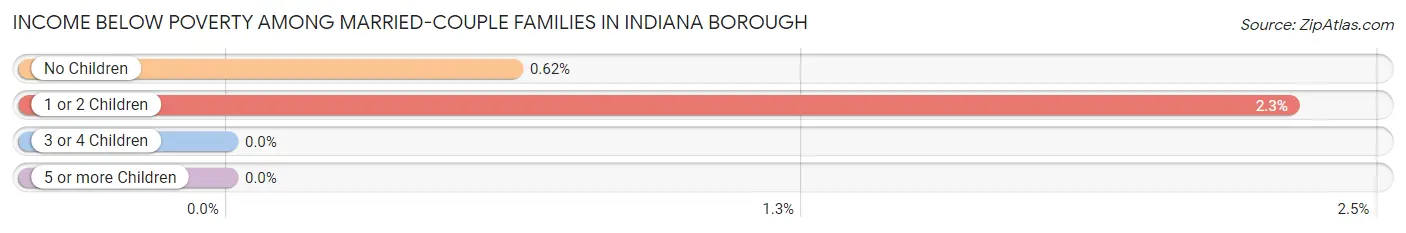
| Children | Above Poverty | Below Poverty |
| No Children | 803 (99.4%) | 5 (0.6%) |
| 1 or 2 Children | 422 (97.7%) | 10 (2.3%) |
| 3 or 4 Children | 61 (100.0%) | 0 (0.0%) |
| 5 or more Children | 18 (100.0%) | 0 (0.0%) |
| Total | 1,304 (98.9%) | 15 (1.1%) |
Income Below Poverty Among Single-Parent Households in Indiana borough
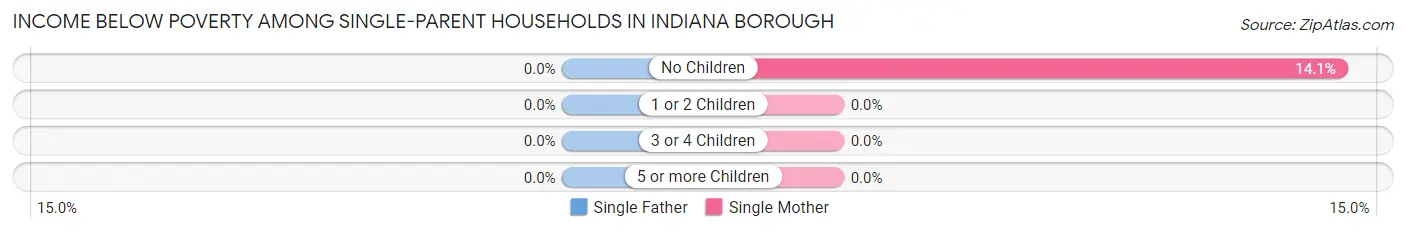
| Children | Single Father | Single Mother |
| No Children | 0 (0.0%) | 10 (14.1%) |
| 1 or 2 Children | 0 (0.0%) | 0 (0.0%) |
| 3 or 4 Children | 0 (0.0%) | 0 (0.0%) |
| 5 or more Children | 0 (0.0%) | 0 (0.0%) |
| Total | 0 (0.0%) | 10 (4.8%) |
Income Below Poverty Among Married-Couple vs Single-Parent Households in Indiana borough
The poverty data for Indiana borough shows that 15 of the married-couple family households (1.1%) and 10 of the single-parent households (2.9%) are living below the poverty level. Within the married-couple family households, those with 1 or 2 children have the highest poverty rate, with 10 households (2.3%) falling below the poverty line. Among the single-parent households, those with no children have the highest poverty rate, with 10 household (11.6%) living below poverty.
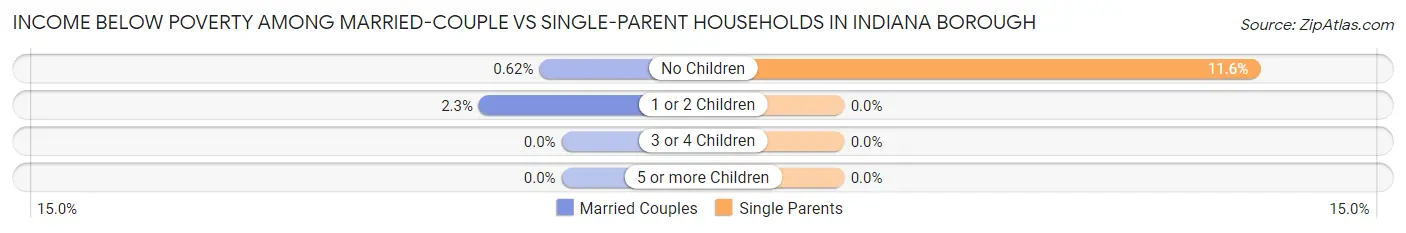
| Children | Married-Couple Families | Single-Parent Households |
| No Children | 5 (0.6%) | 10 (11.6%) |
| 1 or 2 Children | 10 (2.3%) | 0 (0.0%) |
| 3 or 4 Children | 0 (0.0%) | 0 (0.0%) |
| 5 or more Children | 0 (0.0%) | 0 (0.0%) |
| Total | 15 (1.1%) | 10 (2.9%) |
Race in Indiana borough
The most populous races in Indiana borough are White / Caucasian (12,505 | 88.8%), Two or more Races (680 | 4.8%), and Black / African American (647 | 4.6%).
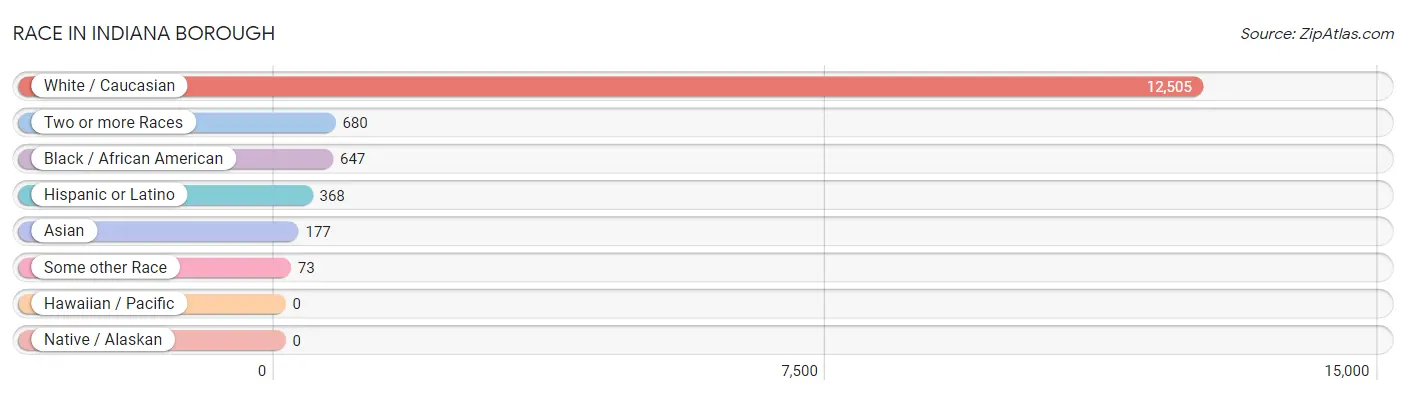
| Race | # Population | % Population |
| Asian | 177 | 1.3% |
| Black / African American | 647 | 4.6% |
| Hawaiian / Pacific | 0 | 0.0% |
| Hispanic or Latino | 368 | 2.6% |
| Native / Alaskan | 0 | 0.0% |
| White / Caucasian | 12,505 | 88.8% |
| Two or more Races | 680 | 4.8% |
| Some other Race | 73 | 0.5% |
| Total | 14,082 | 100.0% |
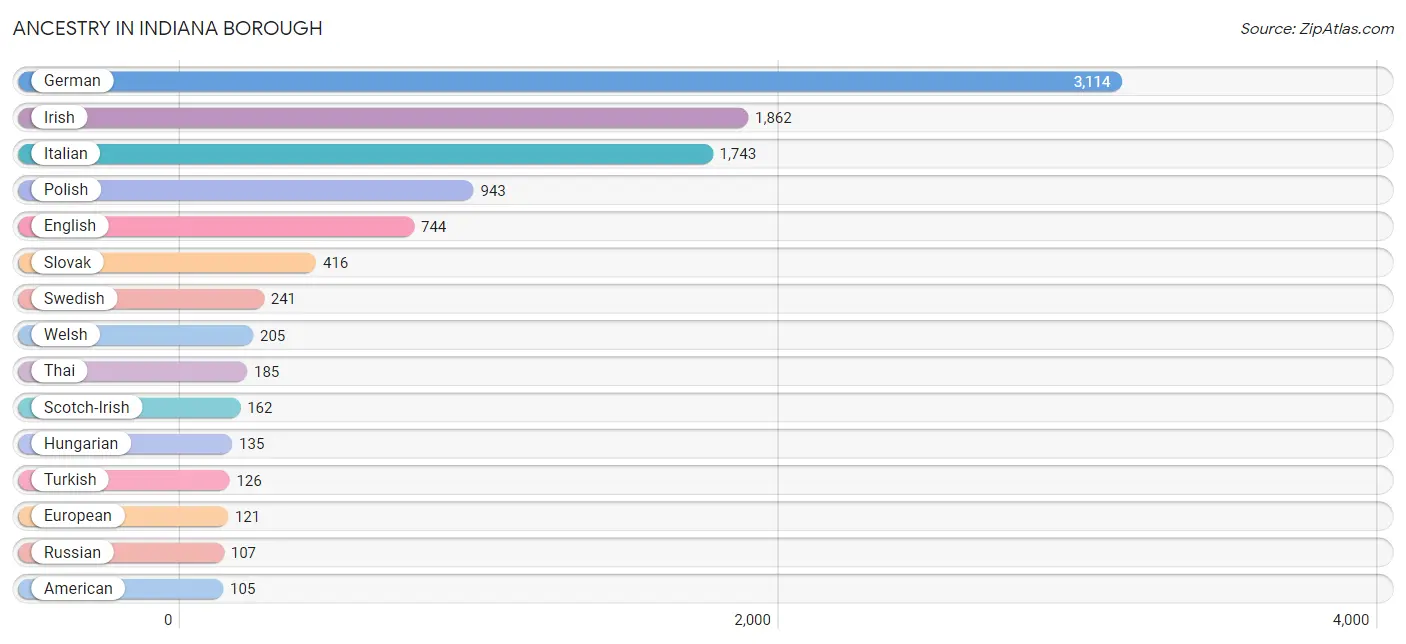
Ancestry in Indiana borough
The most populous ancestries reported in Indiana borough are German (3,114 | 22.1%), Irish (1,862 | 13.2%), Italian (1,743 | 12.4%), Polish (943 | 6.7%), and English (744 | 5.3%), together accounting for 59.7% of all Indiana borough residents.
| Ancestry | # Population | % Population |
| African | 7 | 0.1% |
| American | 105 | 0.7% |
| Arab | 25 | 0.2% |
| Armenian | 13 | 0.1% |
| Basque | 17 | 0.1% |
| Belgian | 11 | 0.1% |
| British | 98 | 0.7% |
| Burmese | 81 | 0.6% |
| Canadian | 18 | 0.1% |
| Central American | 78 | 0.5% |
| Cherokee | 14 | 0.1% |
| Colombian | 35 | 0.3% |
| Croatian | 61 | 0.4% |
| Cuban | 86 | 0.6% |
| Czechoslovakian | 22 | 0.2% |
| Dominican | 28 | 0.2% |
| Dutch | 104 | 0.7% |
| Eastern European | 64 | 0.4% |
| English | 744 | 5.3% |
| European | 121 | 0.9% |
| Finnish | 9 | 0.1% |
| French | 55 | 0.4% |
| French Canadian | 21 | 0.2% |
| German | 3,114 | 22.1% |
| Greek | 46 | 0.3% |
| Guatemalan | 78 | 0.5% |
| Haitian | 55 | 0.4% |
| Hungarian | 135 | 1.0% |
| Indian (Asian) | 80 | 0.6% |
| Iranian | 47 | 0.3% |
| Irish | 1,862 | 13.2% |
| Italian | 1,743 | 12.4% |
| Jamaican | 21 | 0.2% |
| Macedonian | 7 | 0.1% |
| Mexican | 51 | 0.4% |
| Pennsylvania German | 14 | 0.1% |
| Peruvian | 7 | 0.1% |
| Polish | 943 | 6.7% |
| Portuguese | 23 | 0.2% |
| Puerto Rican | 64 | 0.4% |
| Russian | 107 | 0.8% |
| Scandinavian | 28 | 0.2% |
| Scotch-Irish | 162 | 1.1% |
| Scottish | 105 | 0.7% |
| Slavic | 47 | 0.3% |
| Slovak | 416 | 2.9% |
| South American | 47 | 0.3% |
| Spanish | 8 | 0.1% |
| Subsaharan African | 7 | 0.1% |
| Swedish | 241 | 1.7% |
| Swiss | 17 | 0.1% |
| Syrian | 15 | 0.1% |
| Thai | 185 | 1.3% |
| Tohono O'Odham | 7 | 0.1% |
| Turkish | 126 | 0.9% |
| Ukrainian | 80 | 0.6% |
| Venezuelan | 5 | 0.0% |
| Welsh | 205 | 1.5% | View All 58 Rows |
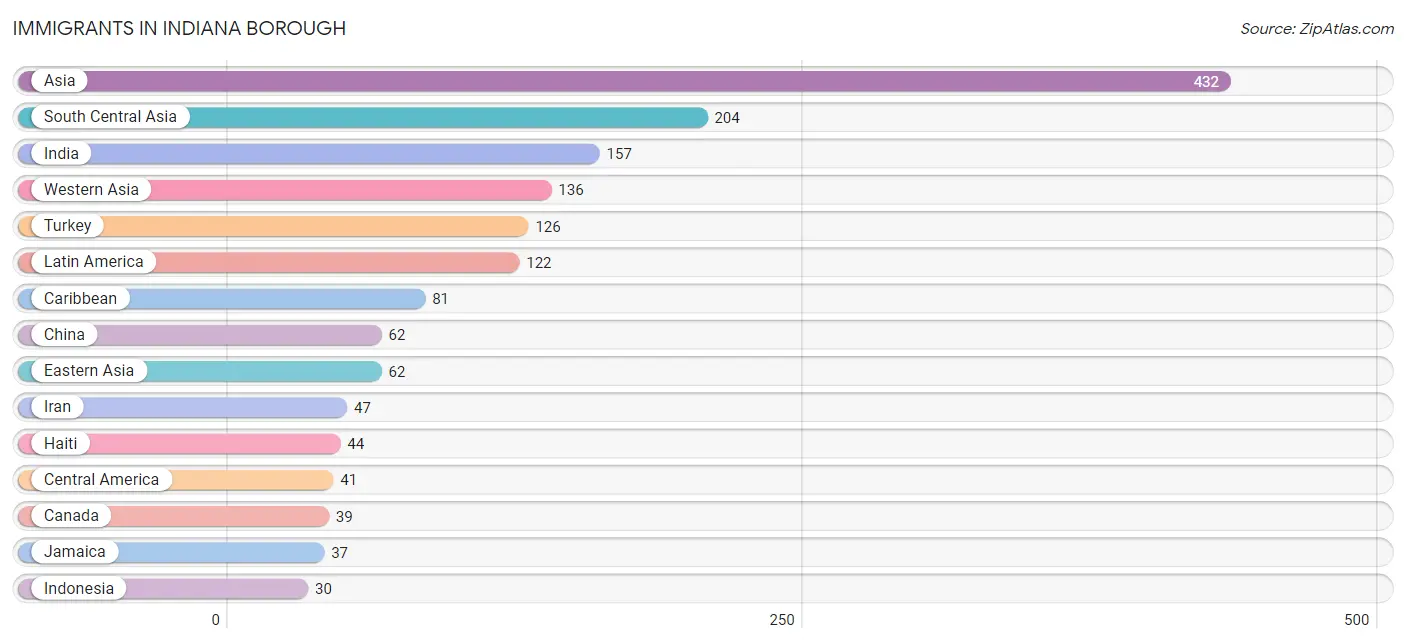
Immigrants in Indiana borough
The most numerous immigrant groups reported in Indiana borough came from Asia (432 | 3.1%), South Central Asia (204 | 1.5%), India (157 | 1.1%), Western Asia (136 | 1.0%), and Turkey (126 | 0.9%), together accounting for 7.5% of all Indiana borough residents.
| Immigration Origin | # Population | % Population |
| Africa | 23 | 0.2% |
| Asia | 432 | 3.1% |
| Canada | 39 | 0.3% |
| Caribbean | 81 | 0.6% |
| Central America | 41 | 0.3% |
| China | 62 | 0.4% |
| Eastern Africa | 6 | 0.0% |
| Eastern Asia | 62 | 0.4% |
| Europe | 28 | 0.2% |
| France | 16 | 0.1% |
| Ghana | 17 | 0.1% |
| Guatemala | 25 | 0.2% |
| Haiti | 44 | 0.3% |
| India | 157 | 1.1% |
| Indonesia | 30 | 0.2% |
| Iran | 47 | 0.3% |
| Jamaica | 37 | 0.3% |
| Jordan | 10 | 0.1% |
| Kenya | 6 | 0.0% |
| Latin America | 122 | 0.9% |
| Mexico | 16 | 0.1% |
| Northern Europe | 12 | 0.1% |
| South Central Asia | 204 | 1.5% |
| South Eastern Asia | 30 | 0.2% |
| Taiwan | 13 | 0.1% |
| Turkey | 126 | 0.9% |
| Western Africa | 17 | 0.1% |
| Western Asia | 136 | 1.0% |
| Western Europe | 16 | 0.1% | View All 29 Rows |
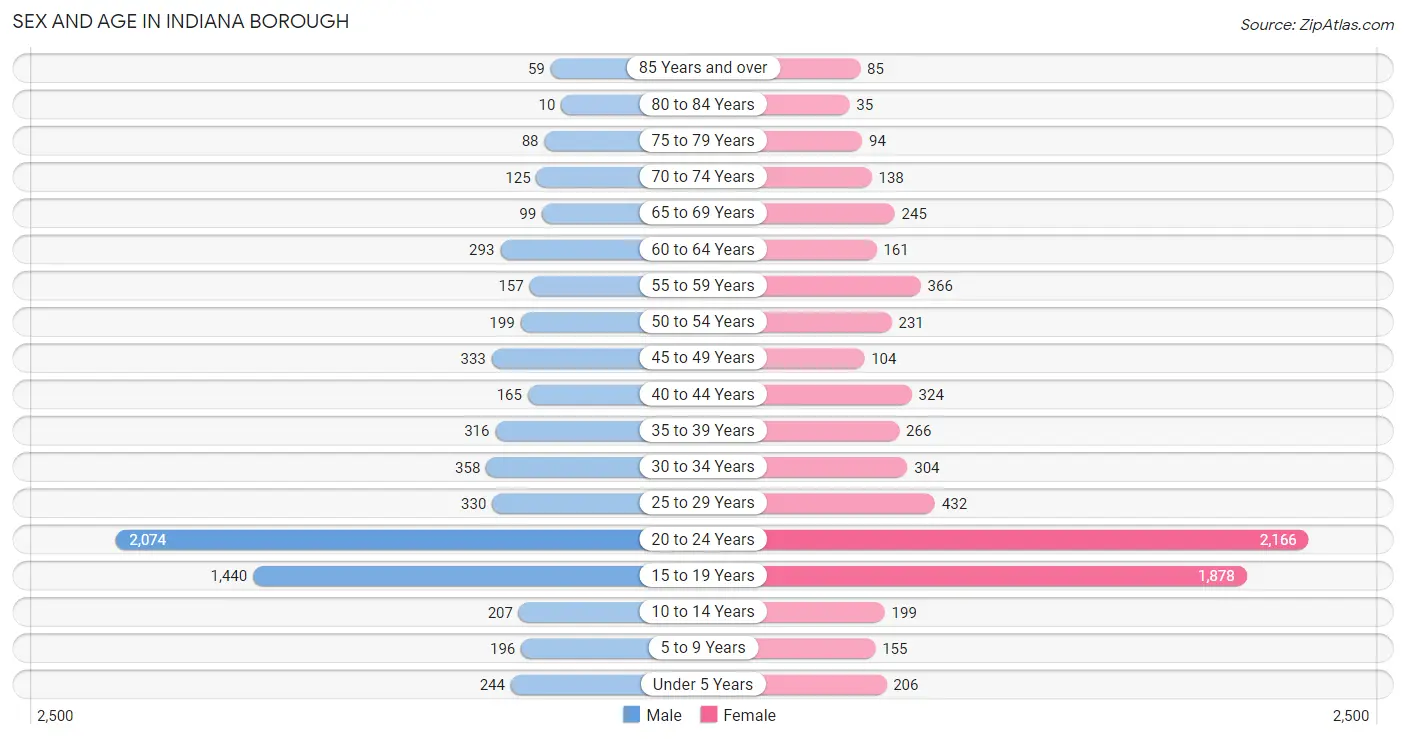
Sex and Age in Indiana borough
Sex and Age in Indiana borough
The most populous age groups in Indiana borough are 20 to 24 Years (2,074 | 31.0%) for men and 20 to 24 Years (2,166 | 29.3%) for women.
| Age Bracket | Male | Female |
| Under 5 Years | 244 (3.6%) | 206 (2.8%) |
| 5 to 9 Years | 196 (2.9%) | 155 (2.1%) |
| 10 to 14 Years | 207 (3.1%) | 199 (2.7%) |
| 15 to 19 Years | 1,440 (21.5%) | 1,878 (25.4%) |
| 20 to 24 Years | 2,074 (31.0%) | 2,166 (29.3%) |
| 25 to 29 Years | 330 (4.9%) | 432 (5.9%) |
| 30 to 34 Years | 358 (5.3%) | 304 (4.1%) |
| 35 to 39 Years | 316 (4.7%) | 266 (3.6%) |
| 40 to 44 Years | 165 (2.5%) | 324 (4.4%) |
| 45 to 49 Years | 333 (5.0%) | 104 (1.4%) |
| 50 to 54 Years | 199 (3.0%) | 231 (3.1%) |
| 55 to 59 Years | 157 (2.4%) | 366 (5.0%) |
| 60 to 64 Years | 293 (4.4%) | 161 (2.2%) |
| 65 to 69 Years | 99 (1.5%) | 245 (3.3%) |
| 70 to 74 Years | 125 (1.9%) | 138 (1.9%) |
| 75 to 79 Years | 88 (1.3%) | 94 (1.3%) |
| 80 to 84 Years | 10 (0.2%) | 35 (0.5%) |
| 85 Years and over | 59 (0.9%) | 85 (1.1%) |
| Total | 6,693 (100.0%) | 7,389 (100.0%) |
Families and Households in Indiana borough
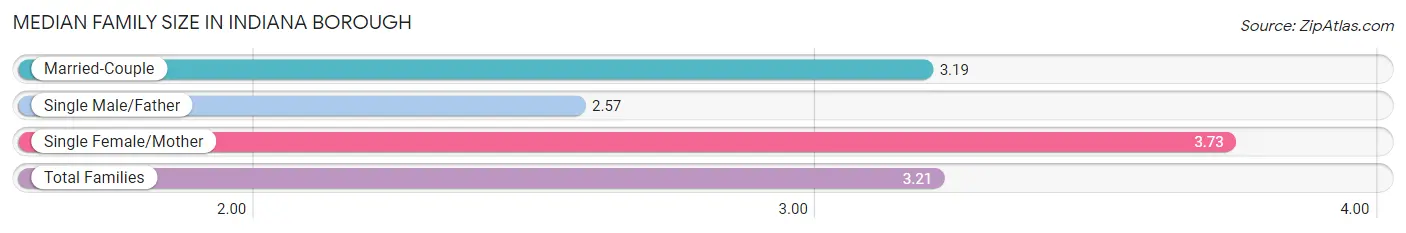
Median Family Size in Indiana borough
The median family size in Indiana borough is 3.21 persons per family, with single female/mother families (209 | 12.6%) accounting for the largest median family size of 3.73 persons per family. On the other hand, single male/father families (134 | 8.1%) represent the smallest median family size with 2.57 persons per family.
| Family Type | # Families | Family Size |
| Married-Couple | 1,319 (79.4%) | 3.19 |
| Single Male/Father | 134 (8.1%) | 2.57 |
| Single Female/Mother | 209 (12.6%) | 3.73 |
| Total Families | 1,662 (100.0%) | 3.21 |
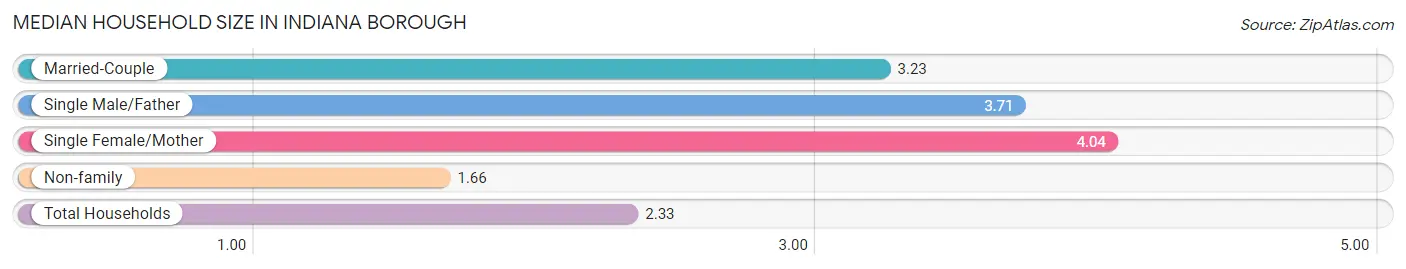
Median Household Size in Indiana borough
The median household size in Indiana borough is 2.33 persons per household, with single female/mother households (209 | 4.9%) accounting for the largest median household size of 4.04 persons per household. non-family households (2,606 | 61.1%) represent the smallest median household size with 1.66 persons per household.
| Household Type | # Households | Household Size |
| Married-Couple | 1,319 (30.9%) | 3.23 |
| Single Male/Father | 134 (3.1%) | 3.71 |
| Single Female/Mother | 209 (4.9%) | 4.04 |
| Non-family | 2,606 (61.1%) | 1.66 |
| Total Households | 4,268 (100.0%) | 2.33 |
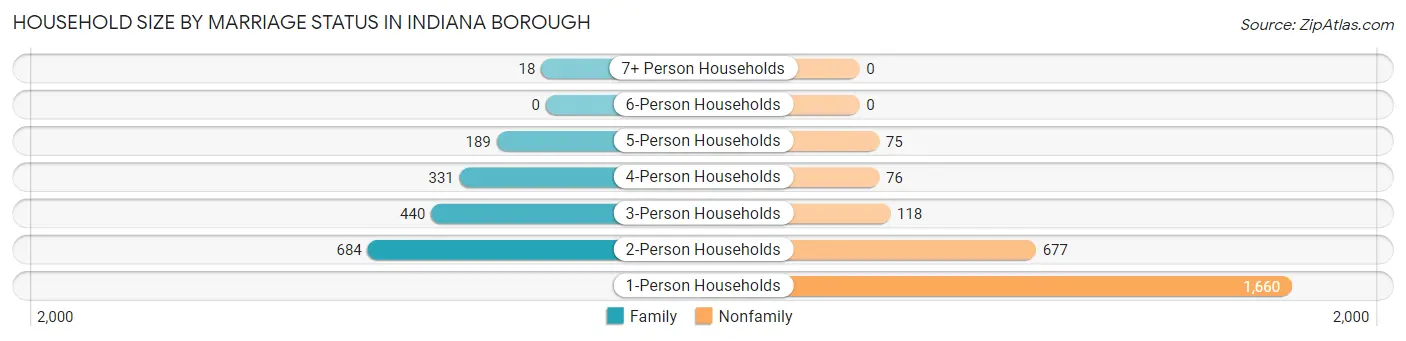
Household Size by Marriage Status in Indiana borough
Out of a total of 4,268 households in Indiana borough, 1,662 (38.9%) are family households, while 2,606 (61.1%) are nonfamily households. The most numerous type of family households are 2-person households, comprising 684, and the most common type of nonfamily households are 1-person households, comprising 1,660.
| Household Size | Family Households | Nonfamily Households |
| 1-Person Households | - | 1,660 (38.9%) |
| 2-Person Households | 684 (16.0%) | 677 (15.9%) |
| 3-Person Households | 440 (10.3%) | 118 (2.8%) |
| 4-Person Households | 331 (7.8%) | 76 (1.8%) |
| 5-Person Households | 189 (4.4%) | 75 (1.8%) |
| 6-Person Households | 0 (0.0%) | 0 (0.0%) |
| 7+ Person Households | 18 (0.4%) | 0 (0.0%) |
| Total | 1,662 (38.9%) | 2,606 (61.1%) |
Female Fertility in Indiana borough
Fertility by Age in Indiana borough
Average fertility rate in Indiana borough is 30.0 births per 1,000 women. Women in the age bracket of 20 to 34 years have the highest fertility rate with 46.0 births per 1,000 women. Women in the age bracket of 20 to 34 years acount for 80.6% of all women with births.
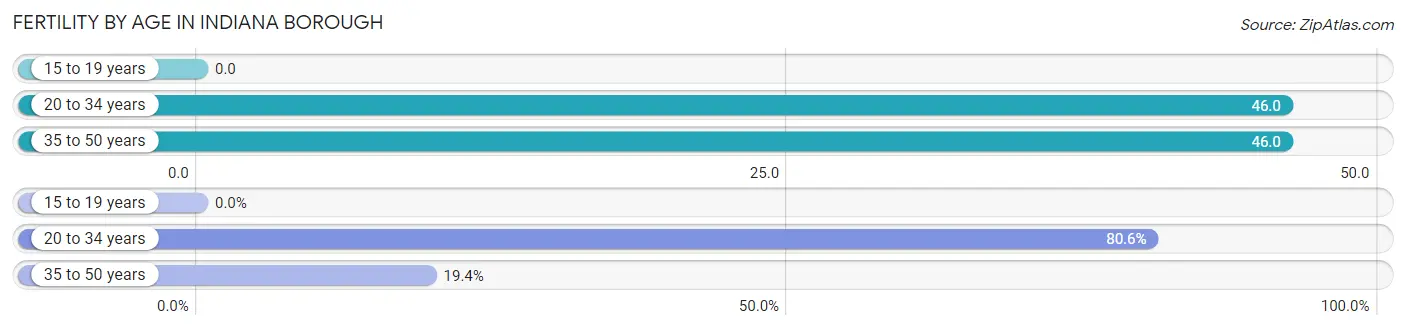
| Age Bracket | Women with Births | Births / 1,000 Women |
| 15 to 19 years | 0 (0.0%) | 0.0 |
| 20 to 34 years | 133 (80.6%) | 46.0 |
| 35 to 50 years | 32 (19.4%) | 46.0 |
| Total | 165 (100.0%) | 30.0 |
Fertility by Age by Marriage Status in Indiana borough
43.6% of women with births (165) in Indiana borough are married. The highest percentage of unmarried women with births falls into 20 to 34 years age bracket with 69.9% of them unmarried at the time of birth, while the lowest percentage of unmarried women with births belong to 35 to 50 years age bracket with 0.0% of them unmarried.
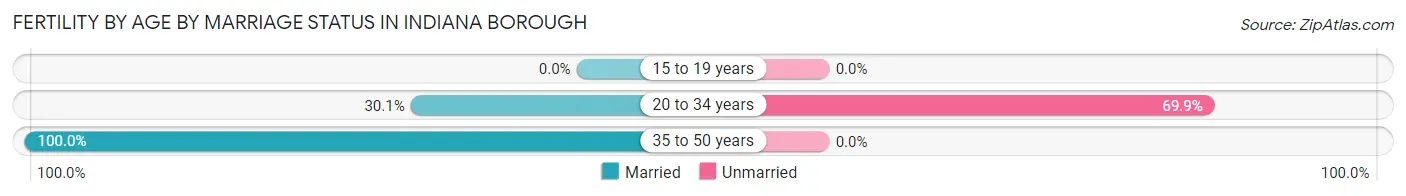
| Age Bracket | Married | Unmarried |
| 15 to 19 years | 0 (0.0%) | 0 (0.0%) |
| 20 to 34 years | 40 (30.1%) | 93 (69.9%) |
| 35 to 50 years | 32 (100.0%) | 0 (0.0%) |
| Total | 72 (43.6%) | 93 (56.4%) |
Fertility by Education in Indiana borough
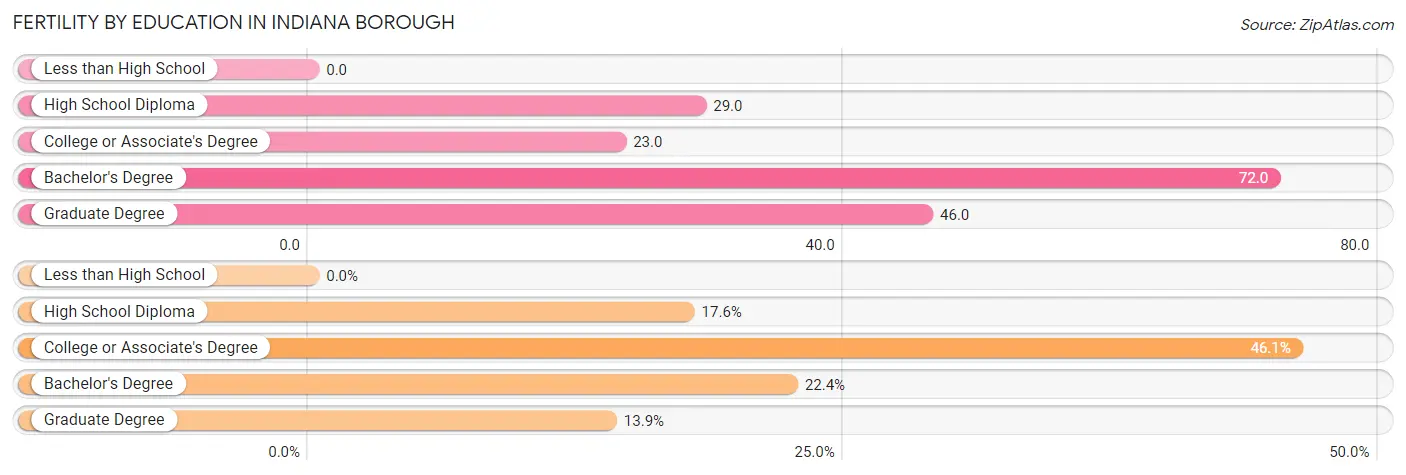
| Educational Attainment | Women with Births | Births / 1,000 Women |
| Less than High School | 0 (0.0%) | 0.0 |
| High School Diploma | 29 (17.6%) | 29.0 |
| College or Associate's Degree | 76 (46.1%) | 23.0 |
| Bachelor's Degree | 37 (22.4%) | 72.0 |
| Graduate Degree | 23 (13.9%) | 46.0 |
| Total | 165 (100.0%) | 30.0 |
Fertility by Education by Marriage Status in Indiana borough
56.4% of women with births in Indiana borough are unmarried. Women with the educational attainment of graduate degree are most likely to be married with 100.0% of them married at childbirth, while women with the educational attainment of high school diploma are least likely to be married with 100.0% of them unmarried at childbirth.
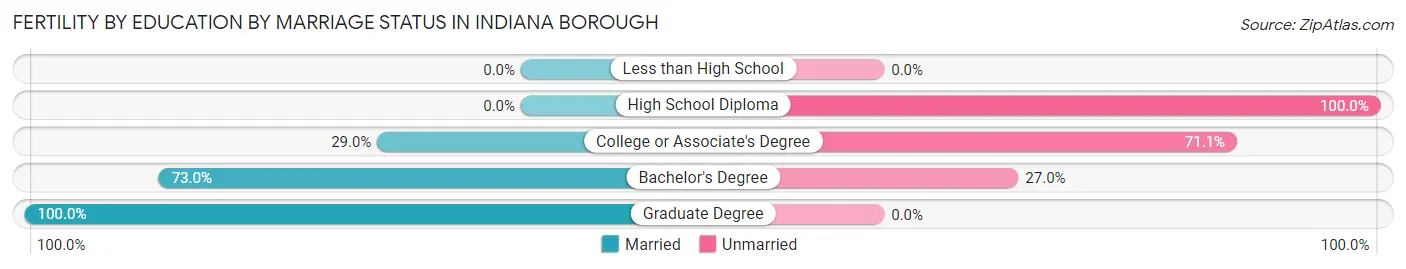
| Educational Attainment | Married | Unmarried |
| Less than High School | 0 (0.0%) | 0 (0.0%) |
| High School Diploma | 0 (0.0%) | 29 (100.0%) |
| College or Associate's Degree | 22 (28.9%) | 54 (71.1%) |
| Bachelor's Degree | 27 (73.0%) | 10 (27.0%) |
| Graduate Degree | 23 (100.0%) | 0 (0.0%) |
| Total | 72 (43.6%) | 93 (56.4%) |
Employment Characteristics in Indiana borough
Employment by Class of Employer in Indiana borough
Among the 6,094 employed individuals in Indiana borough, private company employees (4,122 | 67.6%), state government employees (627 | 10.3%), and not-for-profit organizations (567 | 9.3%) make up the most common classes of employment.
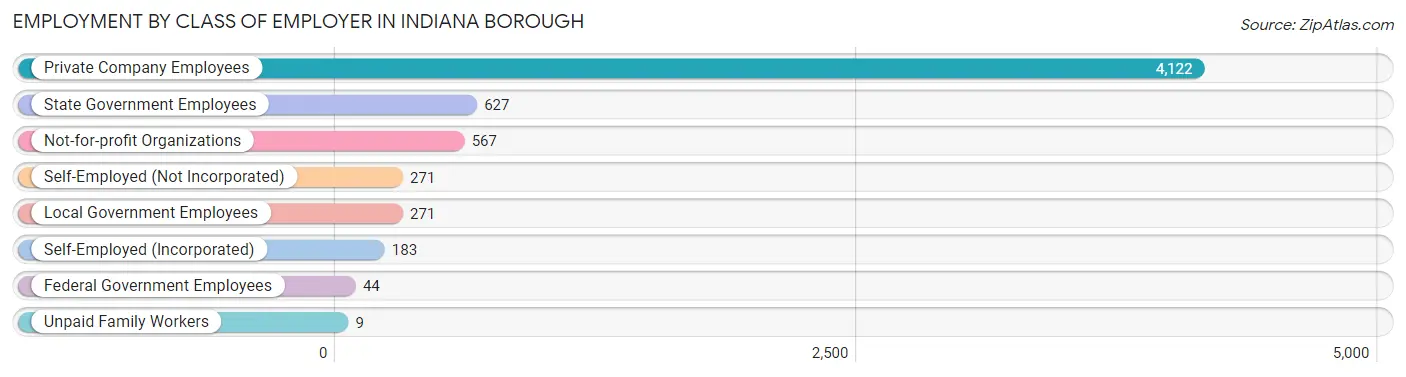
| Employer Class | # Employees | % Employees |
| Private Company Employees | 4,122 | 67.6% |
| Self-Employed (Incorporated) | 183 | 3.0% |
| Self-Employed (Not Incorporated) | 271 | 4.4% |
| Not-for-profit Organizations | 567 | 9.3% |
| Local Government Employees | 271 | 4.4% |
| State Government Employees | 627 | 10.3% |
| Federal Government Employees | 44 | 0.7% |
| Unpaid Family Workers | 9 | 0.2% |
| Total | 6,094 | 100.0% |
Employment Status by Age in Indiana borough
According to the labor force statistics for Indiana borough, out of the total population over 16 years of age (12,802), 55.1% or 7,054 individuals are in the labor force, with 8.3% or 585 of them unemployed. The age group with the highest labor force participation rate is 35 to 44 years, with 87.9% or 941 individuals in the labor force. Within the labor force, the 16 to 19 years age range has the highest percentage of unemployed individuals, with 20.6% or 241 of them being unemployed.
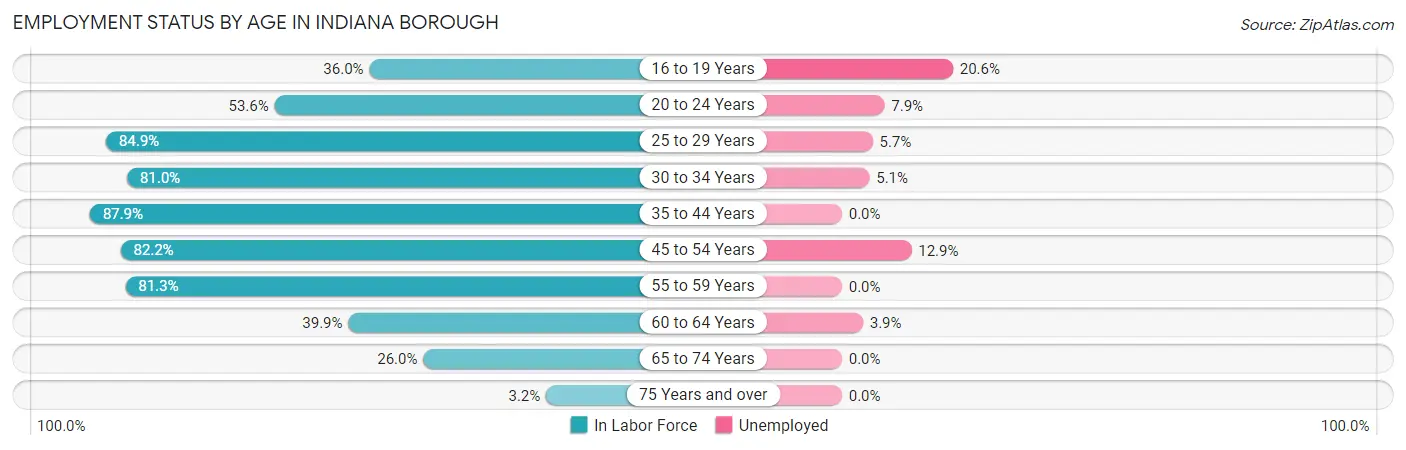
| Age Bracket | In Labor Force | Unemployed |
| 16 to 19 Years | 1,168 (36.0%) | 241 (20.6%) |
| 20 to 24 Years | 2,273 (53.6%) | 180 (7.9%) |
| 25 to 29 Years | 647 (84.9%) | 37 (5.7%) |
| 30 to 34 Years | 536 (81.0%) | 27 (5.1%) |
| 35 to 44 Years | 941 (87.9%) | 0 (0.0%) |
| 45 to 54 Years | 713 (82.2%) | 92 (12.9%) |
| 55 to 59 Years | 425 (81.3%) | 0 (0.0%) |
| 60 to 64 Years | 181 (39.9%) | 7 (3.9%) |
| 65 to 74 Years | 158 (26.0%) | 0 (0.0%) |
| 75 Years and over | 12 (3.2%) | 0 (0.0%) |
| Total | 7,054 (55.1%) | 585 (8.3%) |
Employment Status by Educational Attainment in Indiana borough
According to labor force statistics for Indiana borough, 79.4% of individuals (3,445) out of the total population between 25 and 64 years of age (4,339) are in the labor force, with 4.7% or 162 of them being unemployed. The group with the highest labor force participation rate are those with the educational attainment of bachelor's degree or higher, with 85.6% or 2,007 individuals in the labor force. Within the labor force, individuals with high school diploma education have the highest percentage of unemployment, with 5.2% or 34 of them being unemployed.
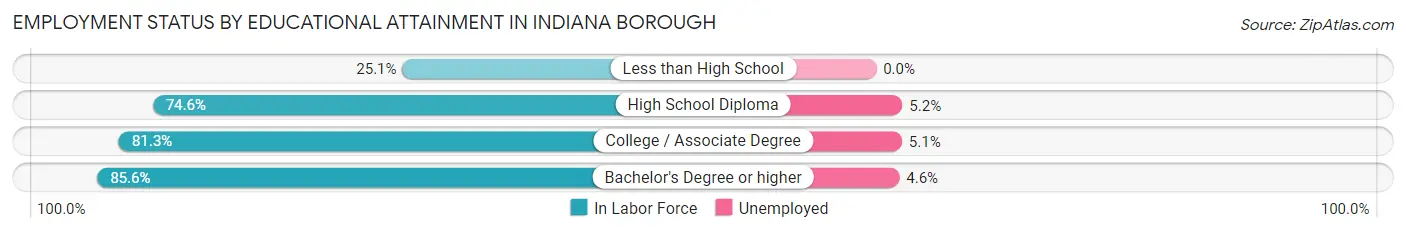
| Educational Attainment | In Labor Force | Unemployed |
| Less than High School | 57 (25.1%) | 0 (0.0%) |
| High School Diploma | 656 (74.6%) | 46 (5.2%) |
| College / Associate Degree | 722 (81.3%) | 45 (5.1%) |
| Bachelor's Degree or higher | 2,007 (85.6%) | 108 (4.6%) |
| Total | 3,445 (79.4%) | 204 (4.7%) |
Employment Occupations by Sex in Indiana borough
Management, Business, Science and Arts Occupations
The most common Management, Business, Science and Arts occupations in Indiana borough are Community & Social Service (1,054 | 16.3%), Education Instruction & Library (686 | 10.6%), Computers, Engineering & Science (386 | 6.0%), Health Diagnosing & Treating (348 | 5.4%), and Management (274 | 4.2%).
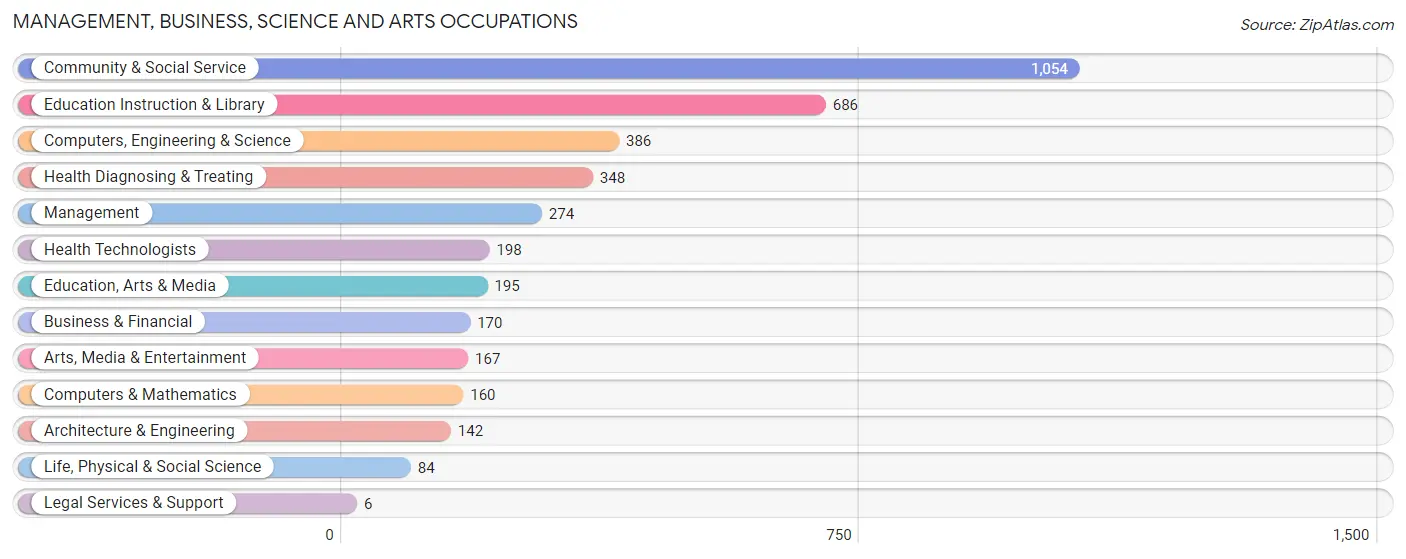
Management, Business, Science and Arts Occupations by Sex
Within the Management, Business, Science and Arts occupations in Indiana borough, the most male-oriented occupations are Architecture & Engineering (100.0%), Legal Services & Support (100.0%), and Computers, Engineering & Science (74.6%), while the most female-oriented occupations are Education Instruction & Library (79.7%), Health Diagnosing & Treating (79.0%), and Health Technologists (70.7%).
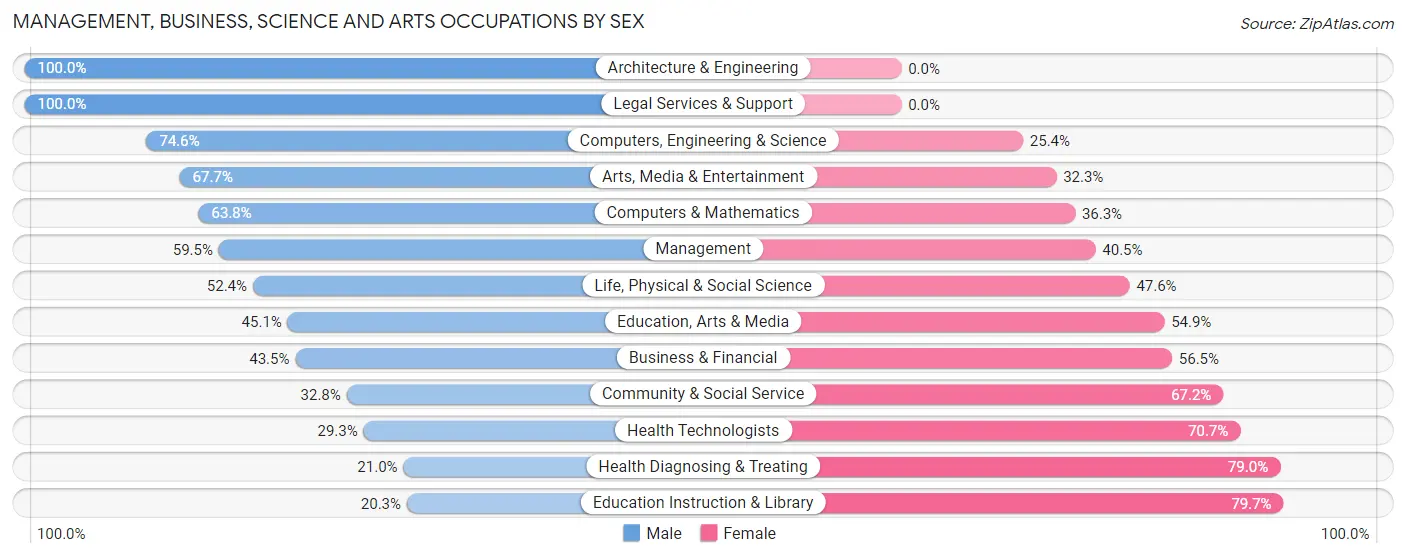
| Occupation | Male | Female |
| Management | 163 (59.5%) | 111 (40.5%) |
| Business & Financial | 74 (43.5%) | 96 (56.5%) |
| Computers, Engineering & Science | 288 (74.6%) | 98 (25.4%) |
| Computers & Mathematics | 102 (63.7%) | 58 (36.2%) |
| Architecture & Engineering | 142 (100.0%) | 0 (0.0%) |
| Life, Physical & Social Science | 44 (52.4%) | 40 (47.6%) |
| Community & Social Service | 346 (32.8%) | 708 (67.2%) |
| Education, Arts & Media | 88 (45.1%) | 107 (54.9%) |
| Legal Services & Support | 6 (100.0%) | 0 (0.0%) |
| Education Instruction & Library | 139 (20.3%) | 547 (79.7%) |
| Arts, Media & Entertainment | 113 (67.7%) | 54 (32.3%) |
| Health Diagnosing & Treating | 73 (21.0%) | 275 (79.0%) |
| Health Technologists | 58 (29.3%) | 140 (70.7%) |
| Total (Category) | 944 (42.3%) | 1,288 (57.7%) |
| Total (Overall) | 3,006 (46.5%) | 3,462 (53.5%) |
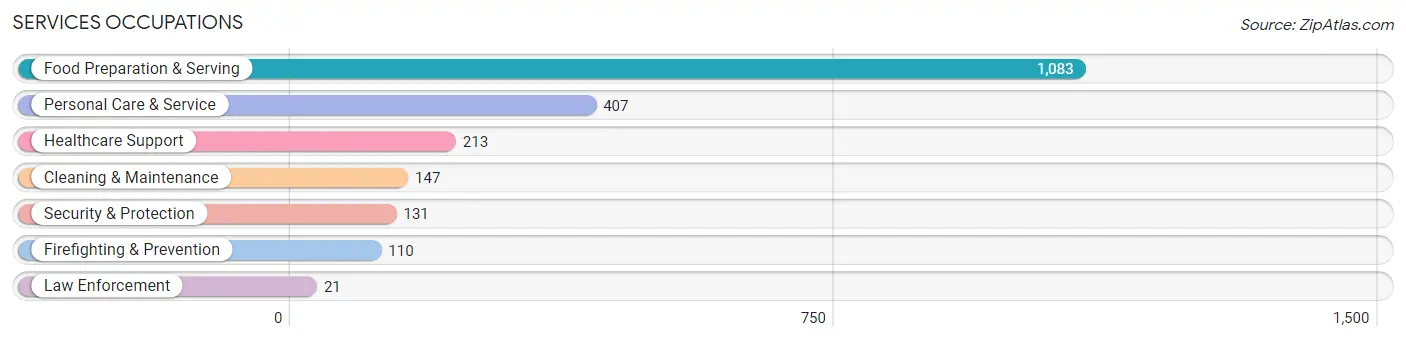
Services Occupations
The most common Services occupations in Indiana borough are Food Preparation & Serving (1,083 | 16.7%), Personal Care & Service (407 | 6.3%), Healthcare Support (213 | 3.3%), Cleaning & Maintenance (147 | 2.3%), and Security & Protection (131 | 2.0%).
Services Occupations by Sex
Within the Services occupations in Indiana borough, the most male-oriented occupations are Law Enforcement (100.0%), Cleaning & Maintenance (55.8%), and Food Preparation & Serving (47.0%), while the most female-oriented occupations are Healthcare Support (77.5%), Firefighting & Prevention (72.7%), and Personal Care & Service (63.1%).
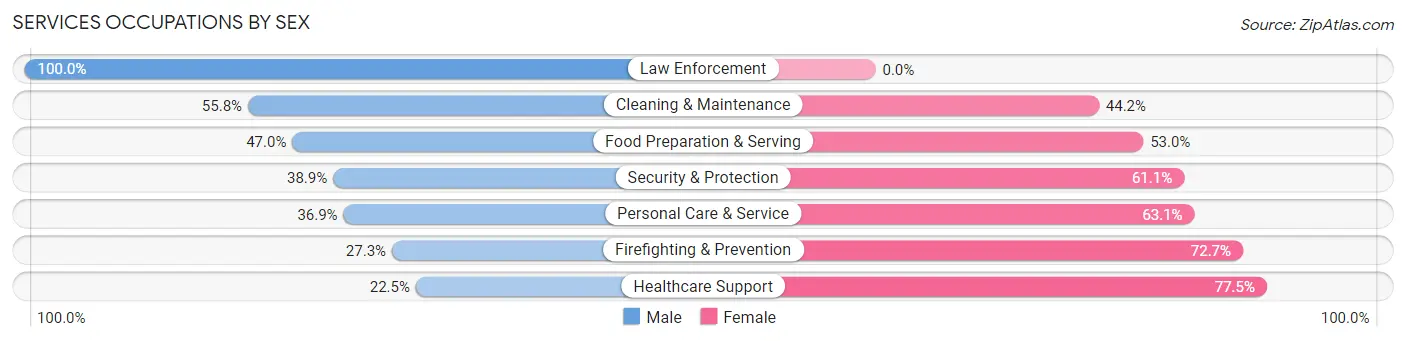
| Occupation | Male | Female |
| Healthcare Support | 48 (22.5%) | 165 (77.5%) |
| Security & Protection | 51 (38.9%) | 80 (61.1%) |
| Firefighting & Prevention | 30 (27.3%) | 80 (72.7%) |
| Law Enforcement | 21 (100.0%) | 0 (0.0%) |
| Food Preparation & Serving | 509 (47.0%) | 574 (53.0%) |
| Cleaning & Maintenance | 82 (55.8%) | 65 (44.2%) |
| Personal Care & Service | 150 (36.9%) | 257 (63.1%) |
| Total (Category) | 840 (42.4%) | 1,141 (57.6%) |
| Total (Overall) | 3,006 (46.5%) | 3,462 (53.5%) |
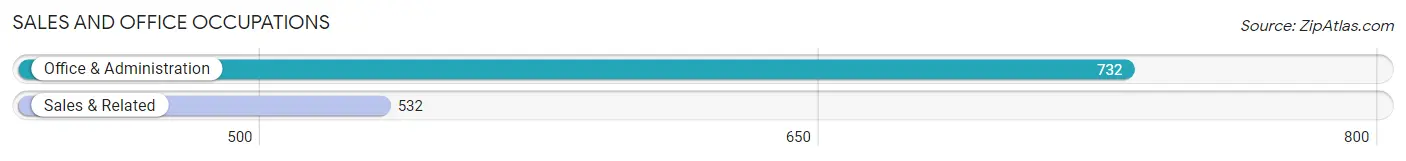
Sales and Office Occupations
The most common Sales and Office occupations in Indiana borough are Office & Administration (732 | 11.3%), and Sales & Related (532 | 8.2%).
Sales and Office Occupations by Sex
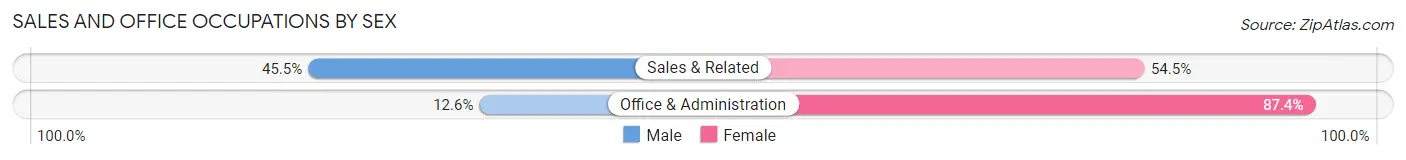
| Occupation | Male | Female |
| Sales & Related | 242 (45.5%) | 290 (54.5%) |
| Office & Administration | 92 (12.6%) | 640 (87.4%) |
| Total (Category) | 334 (26.4%) | 930 (73.6%) |
| Total (Overall) | 3,006 (46.5%) | 3,462 (53.5%) |
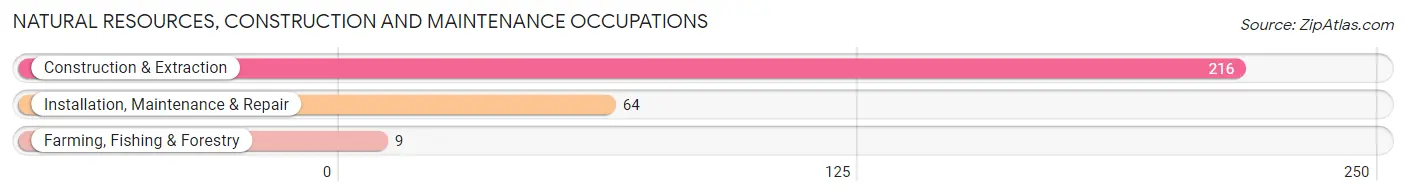
Natural Resources, Construction and Maintenance Occupations
The most common Natural Resources, Construction and Maintenance occupations in Indiana borough are Construction & Extraction (216 | 3.3%), Installation, Maintenance & Repair (64 | 1.0%), and Farming, Fishing & Forestry (9 | 0.1%).
Natural Resources, Construction and Maintenance Occupations by Sex
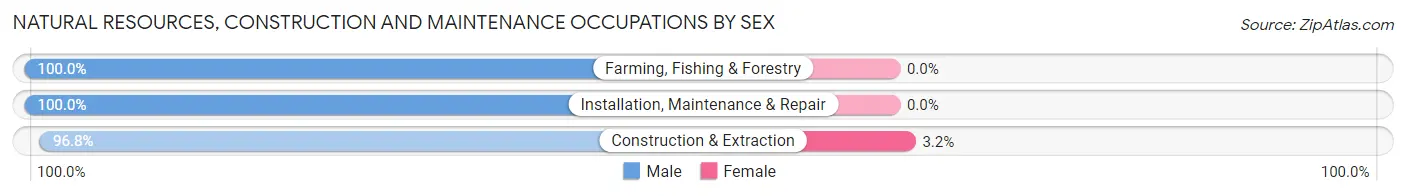
| Occupation | Male | Female |
| Farming, Fishing & Forestry | 9 (100.0%) | 0 (0.0%) |
| Construction & Extraction | 209 (96.8%) | 7 (3.2%) |
| Installation, Maintenance & Repair | 64 (100.0%) | 0 (0.0%) |
| Total (Category) | 282 (97.6%) | 7 (2.4%) |
| Total (Overall) | 3,006 (46.5%) | 3,462 (53.5%) |
Production, Transportation and Moving Occupations
The most common Production, Transportation and Moving occupations in Indiana borough are Transportation (374 | 5.8%), Material Moving (192 | 3.0%), and Production (136 | 2.1%).
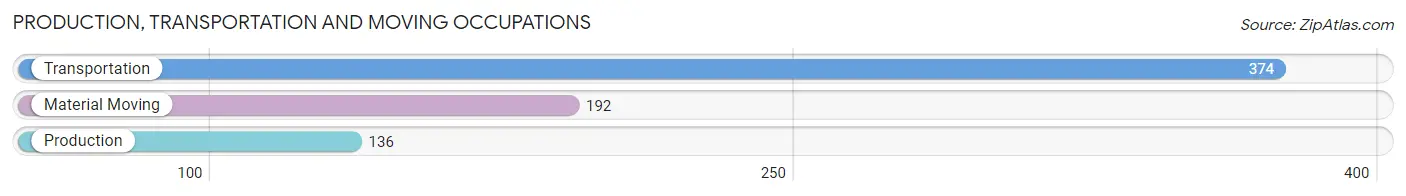
Production, Transportation and Moving Occupations by Sex
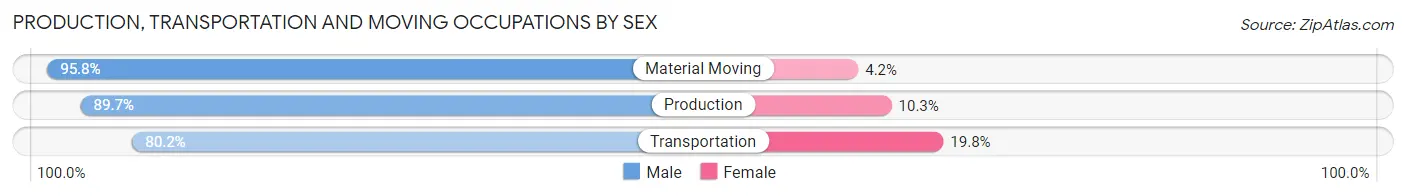
| Occupation | Male | Female |
| Production | 122 (89.7%) | 14 (10.3%) |
| Transportation | 300 (80.2%) | 74 (19.8%) |
| Material Moving | 184 (95.8%) | 8 (4.2%) |
| Total (Category) | 606 (86.3%) | 96 (13.7%) |
| Total (Overall) | 3,006 (46.5%) | 3,462 (53.5%) |
Employment Industries by Sex in Indiana borough
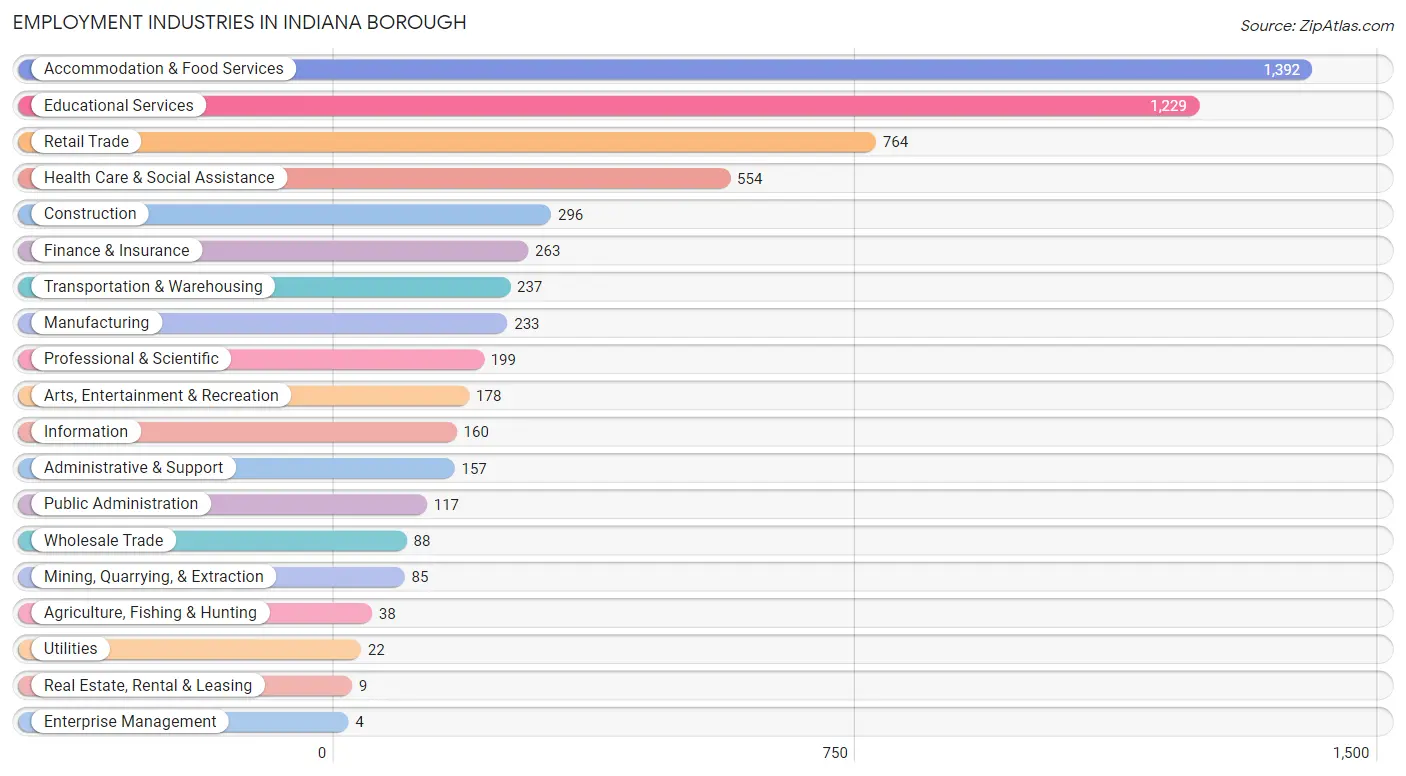
Employment Industries in Indiana borough
The major employment industries in Indiana borough include Accommodation & Food Services (1,392 | 21.5%), Educational Services (1,229 | 19.0%), Retail Trade (764 | 11.8%), Health Care & Social Assistance (554 | 8.6%), and Construction (296 | 4.6%).
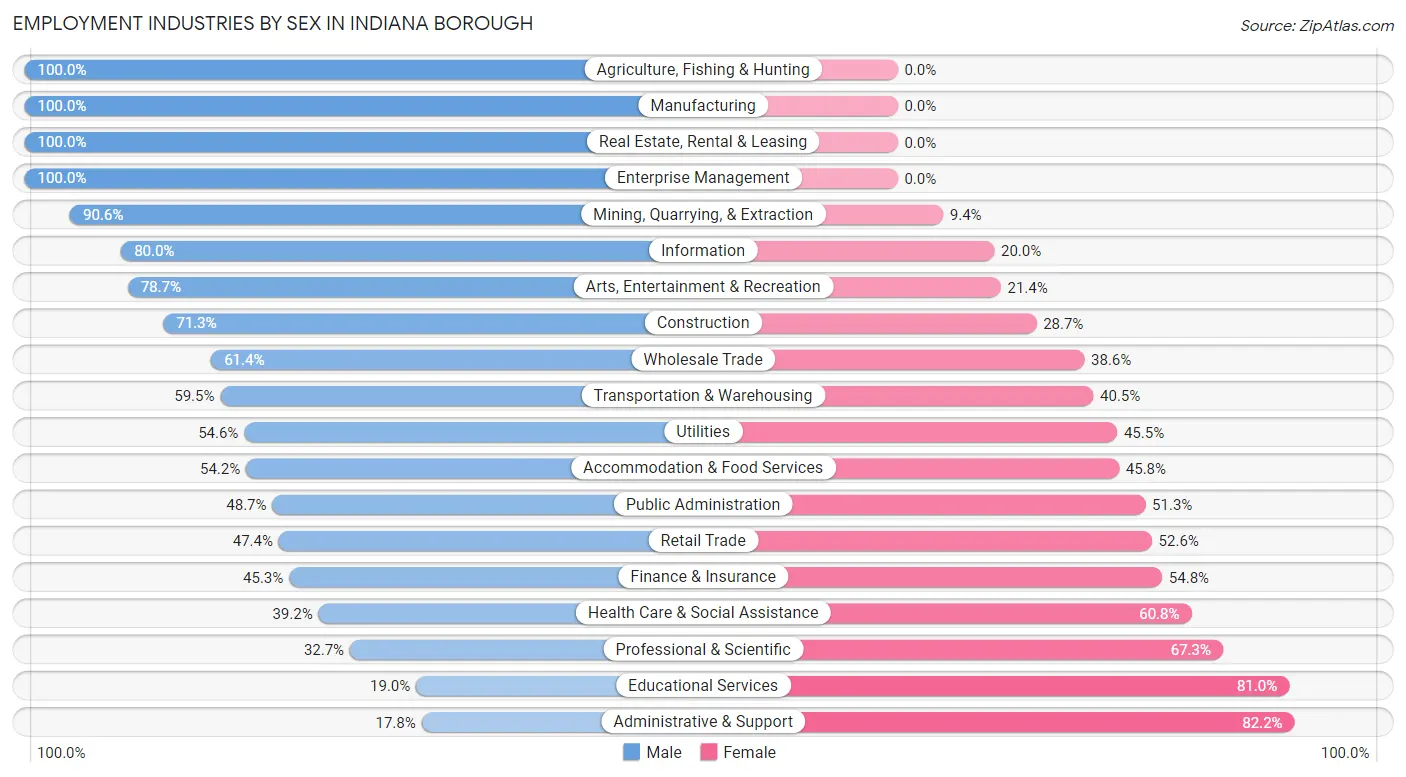
Employment Industries by Sex in Indiana borough
The Indiana borough industries that see more men than women are Agriculture, Fishing & Hunting (100.0%), Manufacturing (100.0%), and Real Estate, Rental & Leasing (100.0%), whereas the industries that tend to have a higher number of women are Administrative & Support (82.2%), Educational Services (81.0%), and Professional & Scientific (67.3%).
| Industry | Male | Female |
| Agriculture, Fishing & Hunting | 38 (100.0%) | 0 (0.0%) |
| Mining, Quarrying, & Extraction | 77 (90.6%) | 8 (9.4%) |
| Construction | 211 (71.3%) | 85 (28.7%) |
| Manufacturing | 233 (100.0%) | 0 (0.0%) |
| Wholesale Trade | 54 (61.4%) | 34 (38.6%) |
| Retail Trade | 362 (47.4%) | 402 (52.6%) |
| Transportation & Warehousing | 141 (59.5%) | 96 (40.5%) |
| Utilities | 12 (54.5%) | 10 (45.5%) |
| Information | 128 (80.0%) | 32 (20.0%) |
| Finance & Insurance | 119 (45.3%) | 144 (54.7%) |
| Real Estate, Rental & Leasing | 9 (100.0%) | 0 (0.0%) |
| Professional & Scientific | 65 (32.7%) | 134 (67.3%) |
| Enterprise Management | 4 (100.0%) | 0 (0.0%) |
| Administrative & Support | 28 (17.8%) | 129 (82.2%) |
| Educational Services | 233 (19.0%) | 996 (81.0%) |
| Health Care & Social Assistance | 217 (39.2%) | 337 (60.8%) |
| Arts, Entertainment & Recreation | 140 (78.6%) | 38 (21.3%) |
| Accommodation & Food Services | 754 (54.2%) | 638 (45.8%) |
| Public Administration | 57 (48.7%) | 60 (51.3%) |
| Total | 3,006 (46.5%) | 3,462 (53.5%) |
Education in Indiana borough
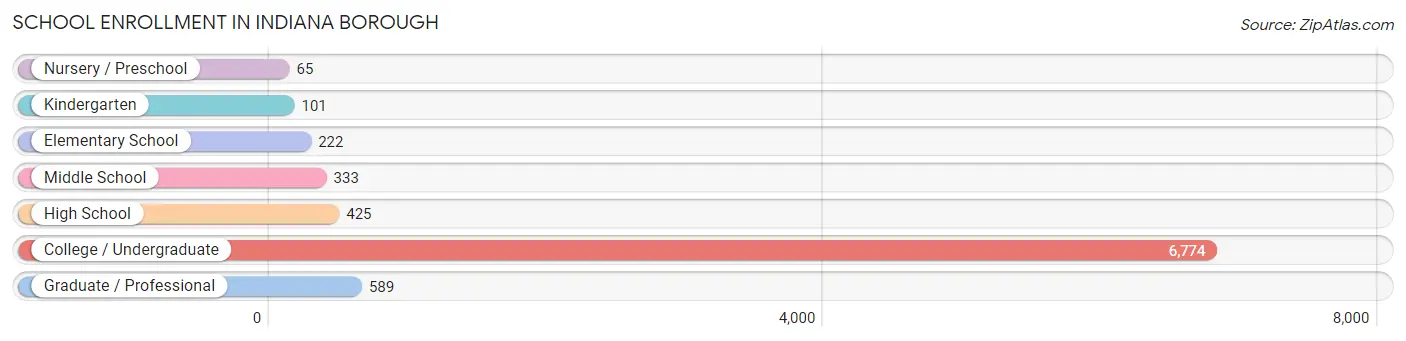
School Enrollment in Indiana borough
The most common levels of schooling among the 8,509 students in Indiana borough are college / undergraduate (6,774 | 79.6%), graduate / professional (589 | 6.9%), and high school (425 | 5.0%).
| School Level | # Students | % Students |
| Nursery / Preschool | 65 | 0.8% |
| Kindergarten | 101 | 1.2% |
| Elementary School | 222 | 2.6% |
| Middle School | 333 | 3.9% |
| High School | 425 | 5.0% |
| College / Undergraduate | 6,774 | 79.6% |
| Graduate / Professional | 589 | 6.9% |
| Total | 8,509 | 100.0% |
School Enrollment by Age by Funding Source in Indiana borough
Out of a total of 8,509 students who are enrolled in schools in Indiana borough, 1,846 (21.7%) attend a private institution, while the remaining 6,663 (78.3%) are enrolled in public schools. The age group of 35 years and over has the highest likelihood of being enrolled in private schools, with 113 (50.7% in the age bracket) enrolled. Conversely, the age group of 25 to 34 year olds has the lowest likelihood of being enrolled in a private school, with 377 (92.6% in the age bracket) attending a public institution.
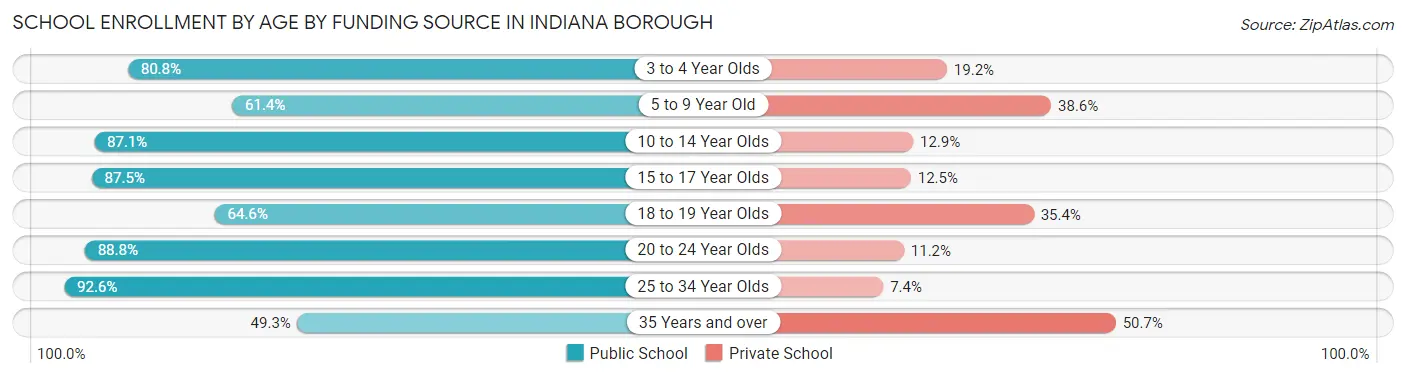
| Age Bracket | Public School | Private School |
| 3 to 4 Year Olds | 42 (80.8%) | 10 (19.2%) |
| 5 to 9 Year Old | 189 (61.4%) | 119 (38.6%) |
| 10 to 14 Year Olds | 337 (87.1%) | 50 (12.9%) |
| 15 to 17 Year Olds | 273 (87.5%) | 39 (12.5%) |
| 18 to 19 Year Olds | 1,917 (64.6%) | 1,050 (35.4%) |
| 20 to 24 Year Olds | 3,421 (88.8%) | 432 (11.2%) |
| 25 to 34 Year Olds | 377 (92.6%) | 30 (7.4%) |
| 35 Years and over | 110 (49.3%) | 113 (50.7%) |
| Total | 6,663 (78.3%) | 1,846 (21.7%) |
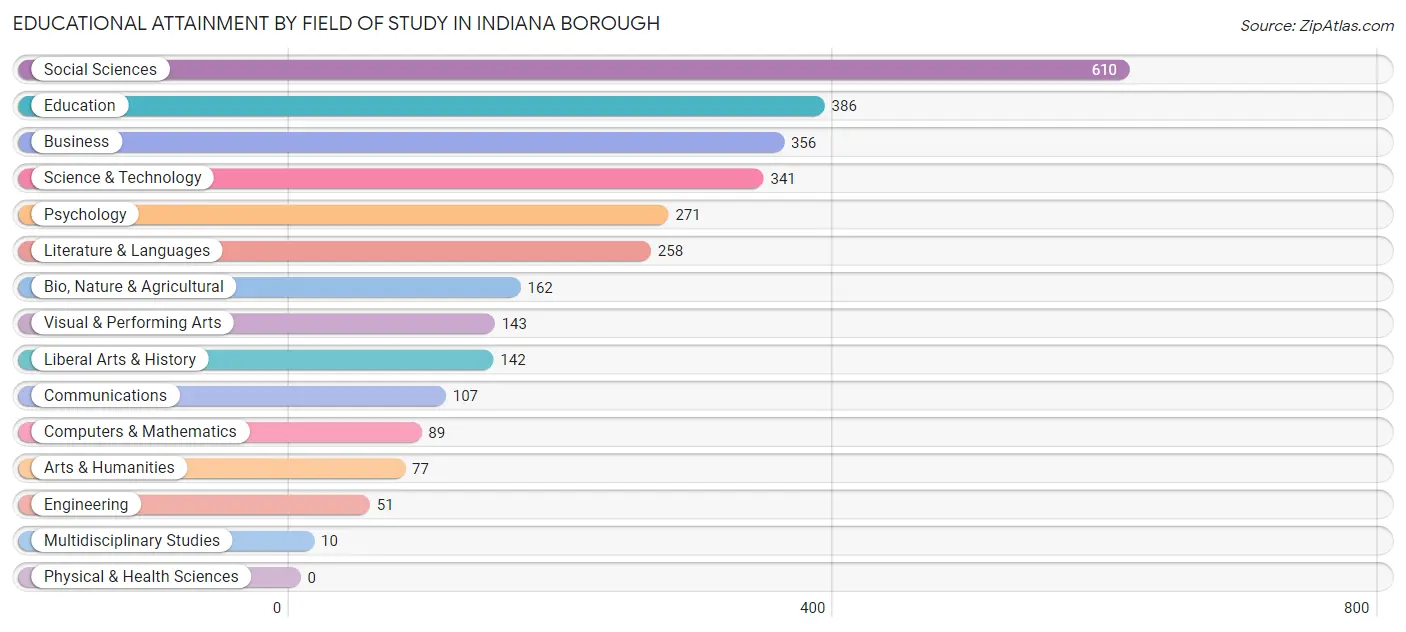
Educational Attainment by Field of Study in Indiana borough
Social sciences (610 | 20.3%), education (386 | 12.9%), business (356 | 11.8%), science & technology (341 | 11.4%), and psychology (271 | 9.0%) are the most common fields of study among 3,003 individuals in Indiana borough who have obtained a bachelor's degree or higher.
| Field of Study | # Graduates | % Graduates |
| Computers & Mathematics | 89 | 3.0% |
| Bio, Nature & Agricultural | 162 | 5.4% |
| Physical & Health Sciences | 0 | 0.0% |
| Psychology | 271 | 9.0% |
| Social Sciences | 610 | 20.3% |
| Engineering | 51 | 1.7% |
| Multidisciplinary Studies | 10 | 0.3% |
| Science & Technology | 341 | 11.4% |
| Business | 356 | 11.8% |
| Education | 386 | 12.9% |
| Literature & Languages | 258 | 8.6% |
| Liberal Arts & History | 142 | 4.7% |
| Visual & Performing Arts | 143 | 4.8% |
| Communications | 107 | 3.6% |
| Arts & Humanities | 77 | 2.6% |
| Total | 3,003 | 100.0% |
Transportation & Commute in Indiana borough
Vehicle Availability by Sex in Indiana borough
The most prevalent vehicle ownership categories in Indiana borough are males with 2 vehicles (1,062, accounting for 43.7%) and females with 2 vehicles (1,280, making up 38.2%).
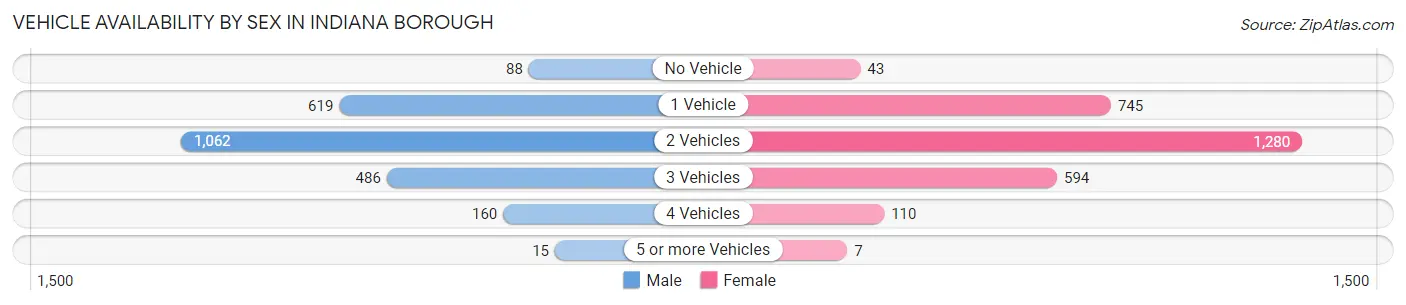
| Vehicles Available | Male | Female |
| No Vehicle | 88 (3.6%) | 43 (1.5%) |
| 1 Vehicle | 619 (25.5%) | 745 (26.8%) |
| 2 Vehicles | 1,062 (43.7%) | 1,280 (46.1%) |
| 3 Vehicles | 486 (20.0%) | 594 (21.4%) |
| 4 Vehicles | 160 (6.6%) | 110 (4.0%) |
| 5 or more Vehicles | 15 (0.6%) | 7 (0.3%) |
| Total | 2,430 (100.0%) | 2,779 (100.0%) |
Commute Time in Indiana borough
The most frequently occuring commute durations in Indiana borough are 5 to 9 minutes (1,724 commuters, 31.1%), 10 to 14 minutes (971 commuters, 17.5%), and 15 to 19 minutes (880 commuters, 15.9%).
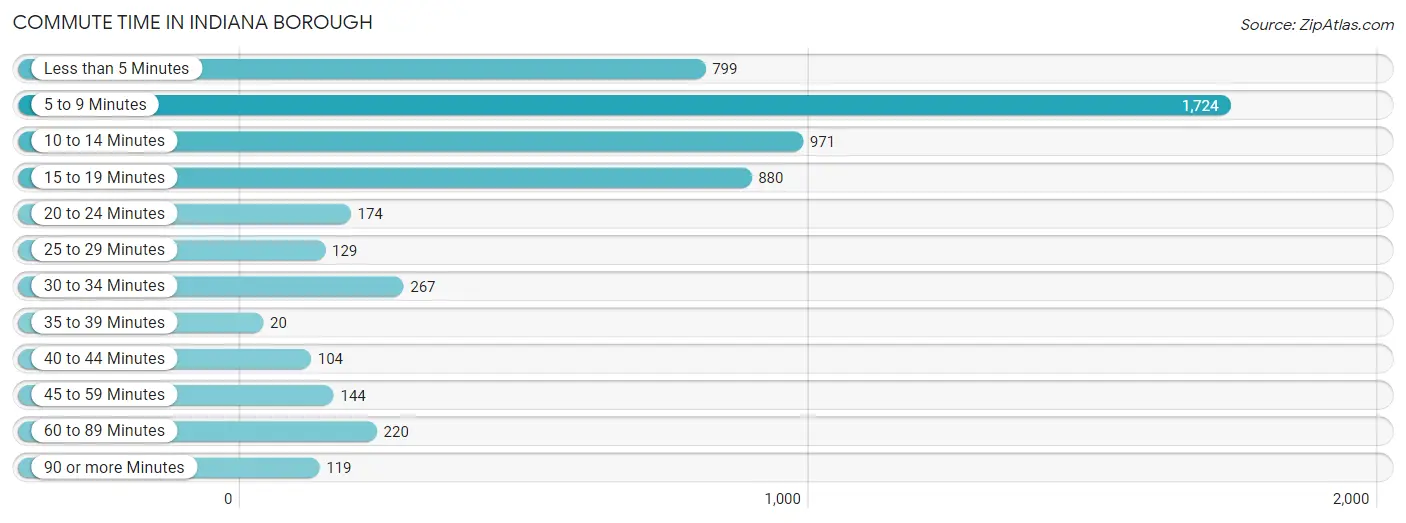
| Commute Time | # Commuters | % Commuters |
| Less than 5 Minutes | 799 | 14.4% |
| 5 to 9 Minutes | 1,724 | 31.1% |
| 10 to 14 Minutes | 971 | 17.5% |
| 15 to 19 Minutes | 880 | 15.9% |
| 20 to 24 Minutes | 174 | 3.1% |
| 25 to 29 Minutes | 129 | 2.3% |
| 30 to 34 Minutes | 267 | 4.8% |
| 35 to 39 Minutes | 20 | 0.4% |
| 40 to 44 Minutes | 104 | 1.9% |
| 45 to 59 Minutes | 144 | 2.6% |
| 60 to 89 Minutes | 220 | 4.0% |
| 90 or more Minutes | 119 | 2.1% |
Commute Time by Sex in Indiana borough
The most common commute times in Indiana borough are 5 to 9 minutes (614 commuters, 23.8%) for males and 5 to 9 minutes (1,110 commuters, 37.3%) for females.
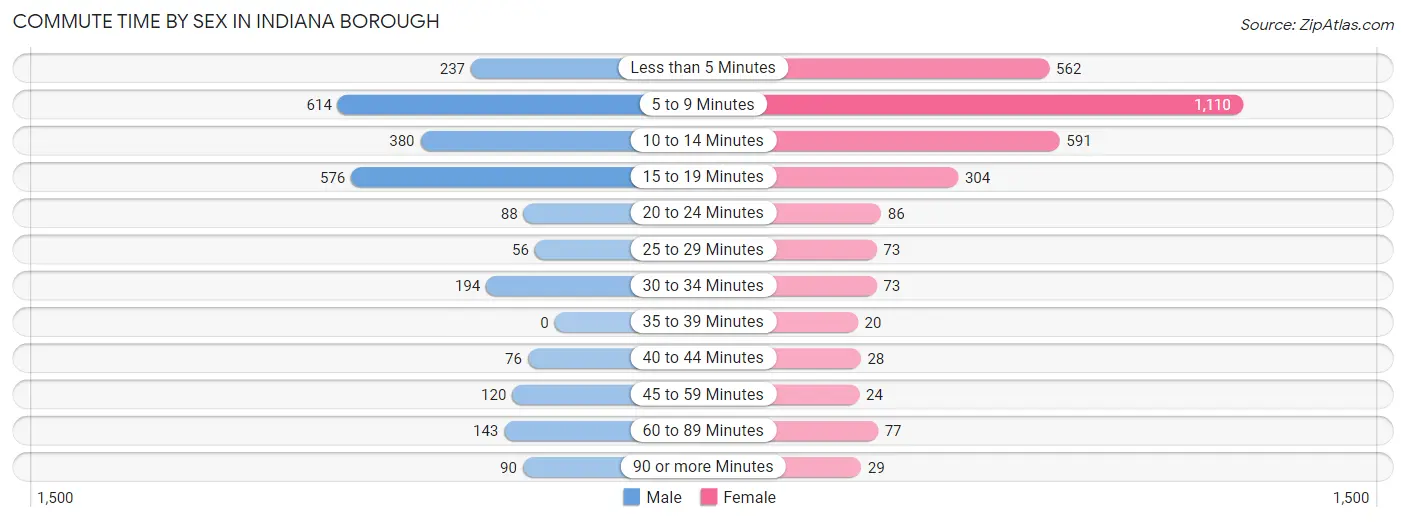
| Commute Time | Male | Female |
| Less than 5 Minutes | 237 (9.2%) | 562 (18.9%) |
| 5 to 9 Minutes | 614 (23.8%) | 1,110 (37.3%) |
| 10 to 14 Minutes | 380 (14.8%) | 591 (19.9%) |
| 15 to 19 Minutes | 576 (22.4%) | 304 (10.2%) |
| 20 to 24 Minutes | 88 (3.4%) | 86 (2.9%) |
| 25 to 29 Minutes | 56 (2.2%) | 73 (2.5%) |
| 30 to 34 Minutes | 194 (7.5%) | 73 (2.5%) |
| 35 to 39 Minutes | 0 (0.0%) | 20 (0.7%) |
| 40 to 44 Minutes | 76 (2.9%) | 28 (0.9%) |
| 45 to 59 Minutes | 120 (4.7%) | 24 (0.8%) |
| 60 to 89 Minutes | 143 (5.6%) | 77 (2.6%) |
| 90 or more Minutes | 90 (3.5%) | 29 (1.0%) |
Time of Departure to Work by Sex in Indiana borough
The most frequent times of departure to work in Indiana borough are 7:30 AM to 7:59 AM (446, 17.3%) for males and 12:00 PM to 3:59 PM (545, 18.3%) for females.
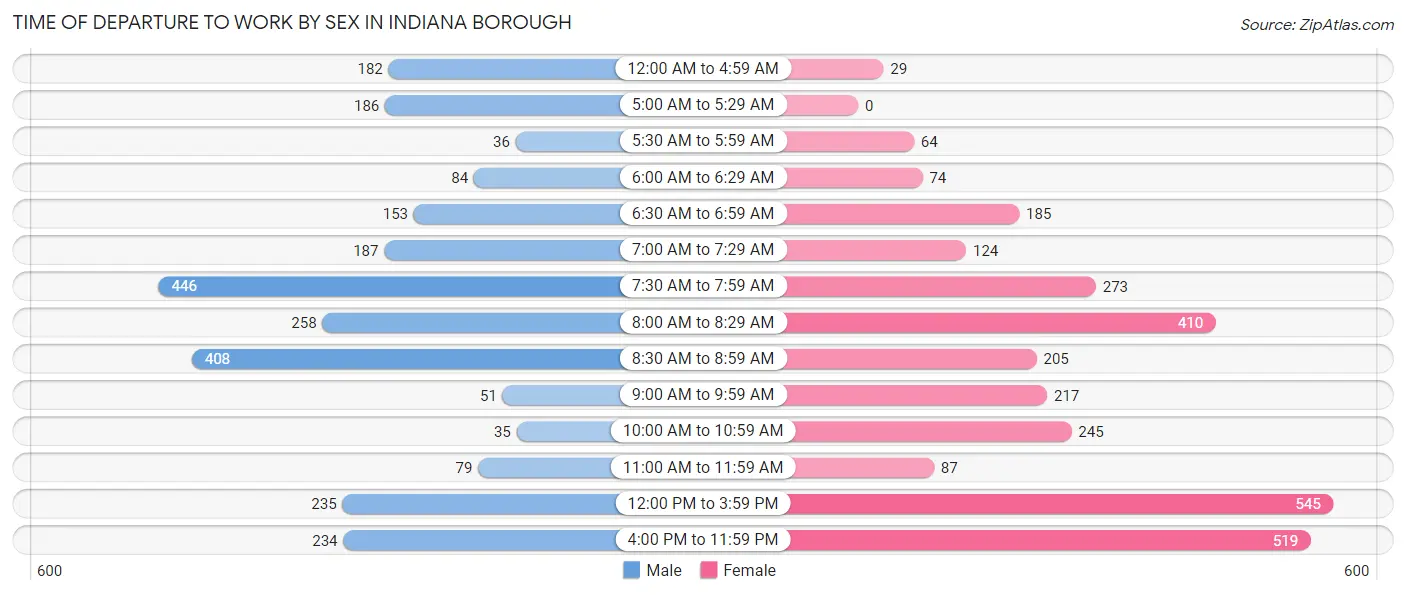
| Time of Departure | Male | Female |
| 12:00 AM to 4:59 AM | 182 (7.1%) | 29 (1.0%) |
| 5:00 AM to 5:29 AM | 186 (7.2%) | 0 (0.0%) |
| 5:30 AM to 5:59 AM | 36 (1.4%) | 64 (2.1%) |
| 6:00 AM to 6:29 AM | 84 (3.3%) | 74 (2.5%) |
| 6:30 AM to 6:59 AM | 153 (5.9%) | 185 (6.2%) |
| 7:00 AM to 7:29 AM | 187 (7.3%) | 124 (4.2%) |
| 7:30 AM to 7:59 AM | 446 (17.3%) | 273 (9.2%) |
| 8:00 AM to 8:29 AM | 258 (10.0%) | 410 (13.8%) |
| 8:30 AM to 8:59 AM | 408 (15.9%) | 205 (6.9%) |
| 9:00 AM to 9:59 AM | 51 (2.0%) | 217 (7.3%) |
| 10:00 AM to 10:59 AM | 35 (1.4%) | 245 (8.2%) |
| 11:00 AM to 11:59 AM | 79 (3.1%) | 87 (2.9%) |
| 12:00 PM to 3:59 PM | 235 (9.1%) | 545 (18.3%) |
| 4:00 PM to 11:59 PM | 234 (9.1%) | 519 (17.4%) |
| Total | 2,574 (100.0%) | 2,977 (100.0%) |
Housing Occupancy in Indiana borough
Occupancy by Ownership in Indiana borough
Of the total 4,268 dwellings in Indiana borough, owner-occupied units account for 1,810 (42.4%), while renter-occupied units make up 2,458 (57.6%).
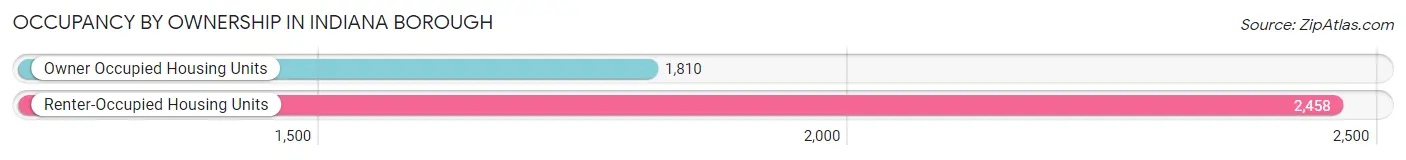
| Occupancy | # Housing Units | % Housing Units |
| Owner Occupied Housing Units | 1,810 | 42.4% |
| Renter-Occupied Housing Units | 2,458 | 57.6% |
| Total Occupied Housing Units | 4,268 | 100.0% |
Occupancy by Household Size in Indiana borough
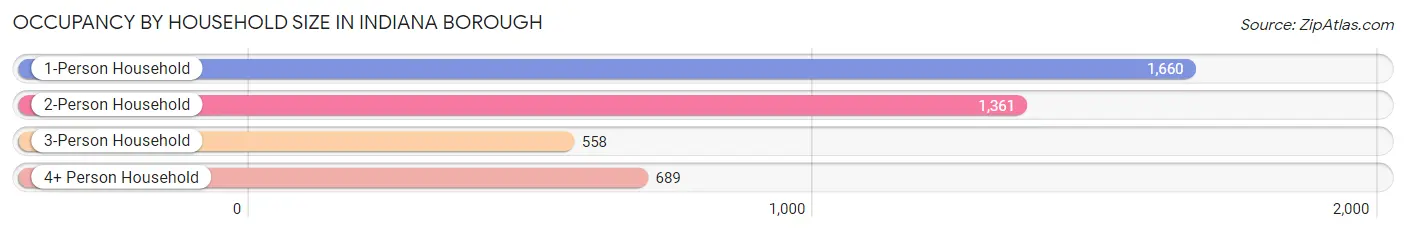
| Household Size | # Housing Units | % Housing Units |
| 1-Person Household | 1,660 | 38.9% |
| 2-Person Household | 1,361 | 31.9% |
| 3-Person Household | 558 | 13.1% |
| 4+ Person Household | 689 | 16.1% |
| Total Housing Units | 4,268 | 100.0% |
Occupancy by Ownership by Household Size in Indiana borough
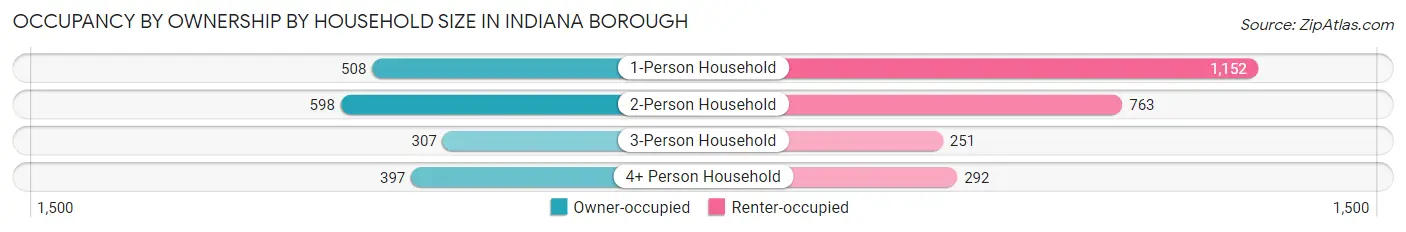
| Household Size | Owner-occupied | Renter-occupied |
| 1-Person Household | 508 (30.6%) | 1,152 (69.4%) |
| 2-Person Household | 598 (43.9%) | 763 (56.1%) |
| 3-Person Household | 307 (55.0%) | 251 (45.0%) |
| 4+ Person Household | 397 (57.6%) | 292 (42.4%) |
| Total Housing Units | 1,810 (42.4%) | 2,458 (57.6%) |
Occupancy by Educational Attainment in Indiana borough
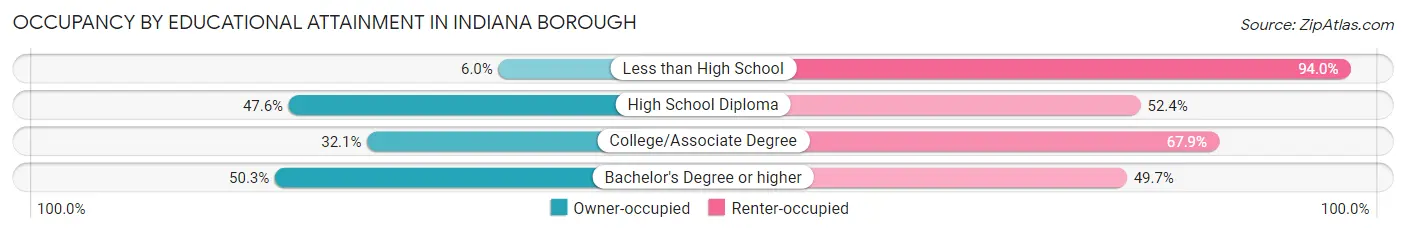
| Household Size | Owner-occupied | Renter-occupied |
| Less than High School | 8 (6.0%) | 125 (94.0%) |
| High School Diploma | 365 (47.6%) | 402 (52.4%) |
| College/Associate Degree | 453 (32.1%) | 960 (67.9%) |
| Bachelor's Degree or higher | 984 (50.3%) | 971 (49.7%) |
Occupancy by Age of Householder in Indiana borough
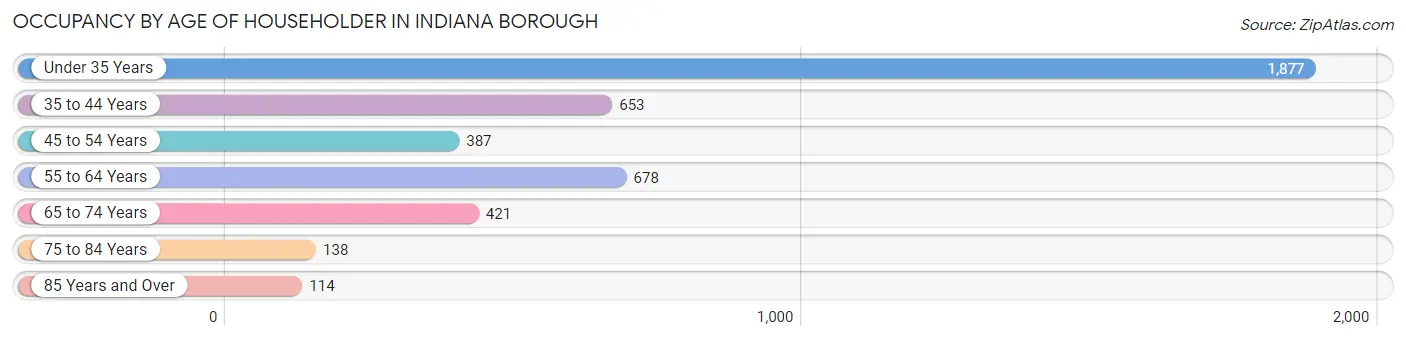
| Age Bracket | # Households | % Households |
| Under 35 Years | 1,877 | 44.0% |
| 35 to 44 Years | 653 | 15.3% |
| 45 to 54 Years | 387 | 9.1% |
| 55 to 64 Years | 678 | 15.9% |
| 65 to 74 Years | 421 | 9.9% |
| 75 to 84 Years | 138 | 3.2% |
| 85 Years and Over | 114 | 2.7% |
| Total | 4,268 | 100.0% |
Housing Finances in Indiana borough
Median Income by Occupancy in Indiana borough
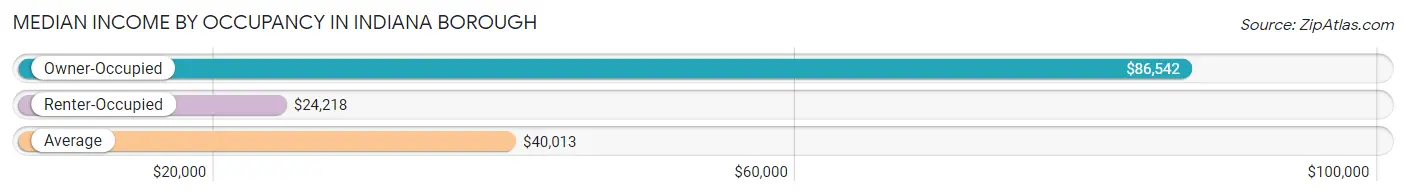
| Occupancy Type | # Households | Median Income |
| Owner-Occupied | 1,810 (42.4%) | $86,542 |
| Renter-Occupied | 2,458 (57.6%) | $24,218 |
| Average | 4,268 (100.0%) | $40,013 |
Occupancy by Householder Income Bracket in Indiana borough
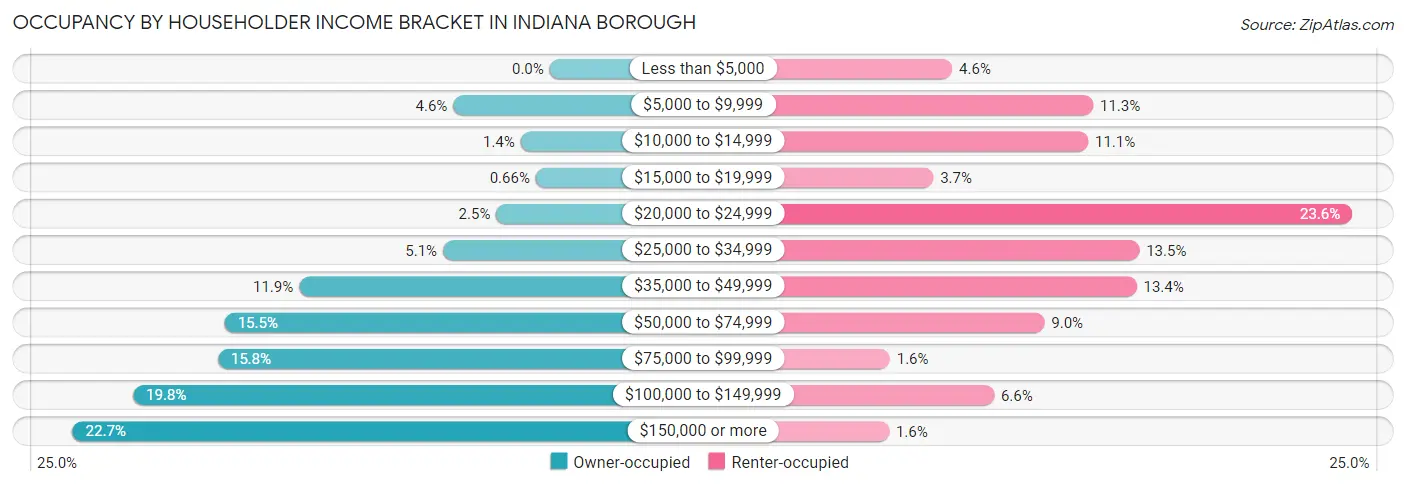
| Income Bracket | Owner-occupied | Renter-occupied |
| Less than $5,000 | 0 (0.0%) | 113 (4.6%) |
| $5,000 to $9,999 | 83 (4.6%) | 278 (11.3%) |
| $10,000 to $14,999 | 25 (1.4%) | 272 (11.1%) |
| $15,000 to $19,999 | 12 (0.7%) | 91 (3.7%) |
| $20,000 to $24,999 | 46 (2.5%) | 581 (23.6%) |
| $25,000 to $34,999 | 92 (5.1%) | 332 (13.5%) |
| $35,000 to $49,999 | 216 (11.9%) | 329 (13.4%) |
| $50,000 to $74,999 | 280 (15.5%) | 221 (9.0%) |
| $75,000 to $99,999 | 286 (15.8%) | 40 (1.6%) |
| $100,000 to $149,999 | 359 (19.8%) | 162 (6.6%) |
| $150,000 or more | 411 (22.7%) | 39 (1.6%) |
| Total | 1,810 (100.0%) | 2,458 (100.0%) |
Monthly Housing Cost Tiers in Indiana borough
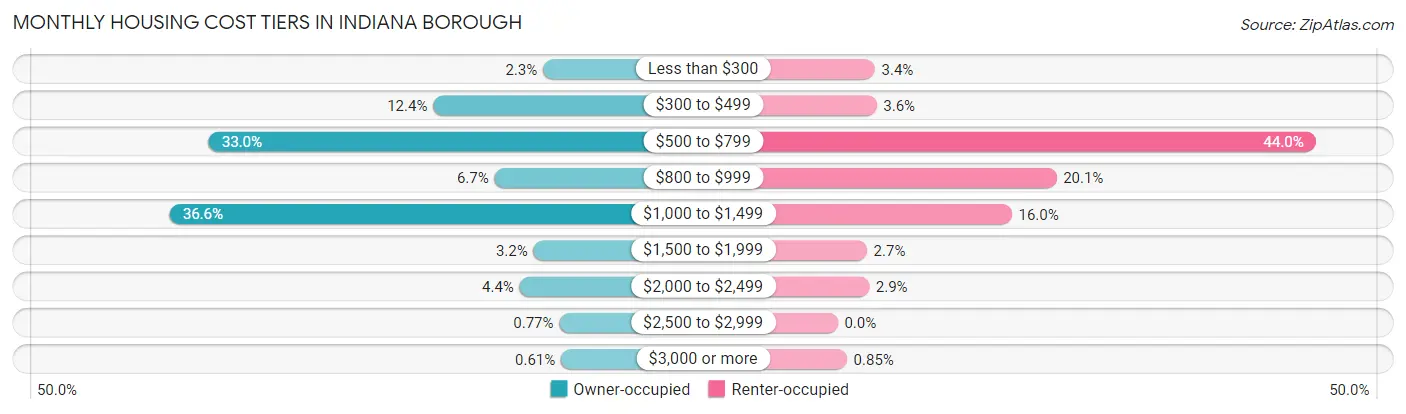
| Monthly Cost | Owner-occupied | Renter-occupied |
| Less than $300 | 41 (2.3%) | 84 (3.4%) |
| $300 to $499 | 224 (12.4%) | 88 (3.6%) |
| $500 to $799 | 598 (33.0%) | 1,082 (44.0%) |
| $800 to $999 | 122 (6.7%) | 495 (20.1%) |
| $1,000 to $1,499 | 663 (36.6%) | 394 (16.0%) |
| $1,500 to $1,999 | 57 (3.2%) | 66 (2.7%) |
| $2,000 to $2,499 | 80 (4.4%) | 71 (2.9%) |
| $2,500 to $2,999 | 14 (0.8%) | 0 (0.0%) |
| $3,000 or more | 11 (0.6%) | 21 (0.9%) |
| Total | 1,810 (100.0%) | 2,458 (100.0%) |
Physical Housing Characteristics in Indiana borough
Housing Structures in Indiana borough
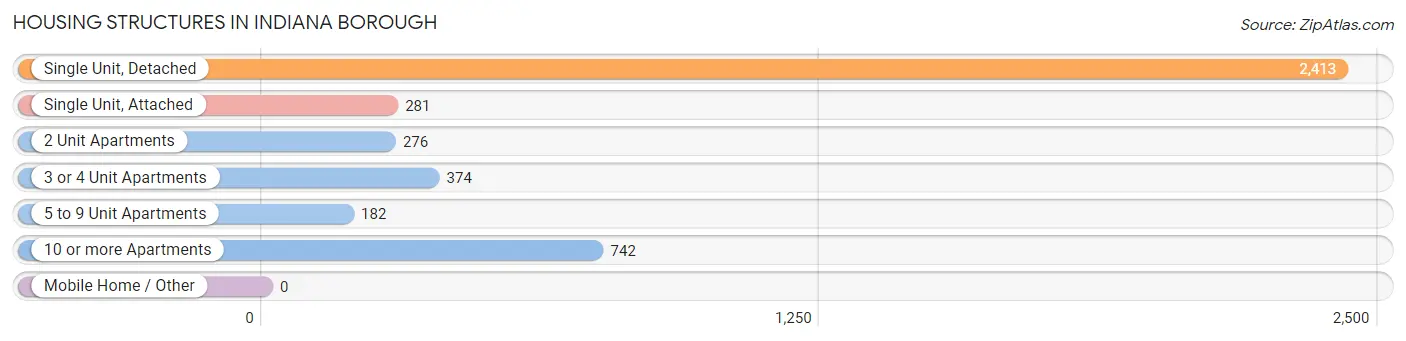
| Structure Type | # Housing Units | % Housing Units |
| Single Unit, Detached | 2,413 | 56.5% |
| Single Unit, Attached | 281 | 6.6% |
| 2 Unit Apartments | 276 | 6.5% |
| 3 or 4 Unit Apartments | 374 | 8.8% |
| 5 to 9 Unit Apartments | 182 | 4.3% |
| 10 or more Apartments | 742 | 17.4% |
| Mobile Home / Other | 0 | 0.0% |
| Total | 4,268 | 100.0% |
Housing Structures by Occupancy in Indiana borough
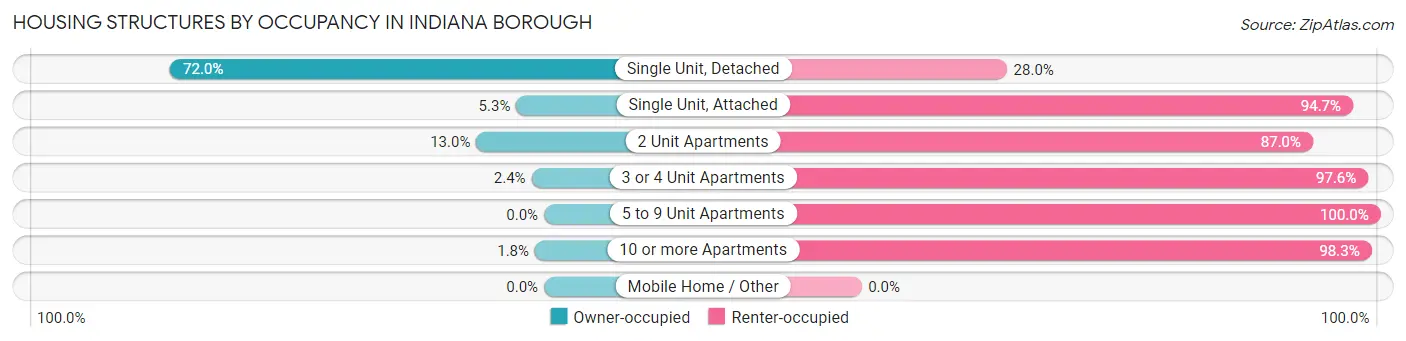
| Structure Type | Owner-occupied | Renter-occupied |
| Single Unit, Detached | 1,737 (72.0%) | 676 (28.0%) |
| Single Unit, Attached | 15 (5.3%) | 266 (94.7%) |
| 2 Unit Apartments | 36 (13.0%) | 240 (87.0%) |
| 3 or 4 Unit Apartments | 9 (2.4%) | 365 (97.6%) |
| 5 to 9 Unit Apartments | 0 (0.0%) | 182 (100.0%) |
| 10 or more Apartments | 13 (1.8%) | 729 (98.3%) |
| Mobile Home / Other | 0 (0.0%) | 0 (0.0%) |
| Total | 1,810 (42.4%) | 2,458 (57.6%) |
Housing Structures by Number of Rooms in Indiana borough
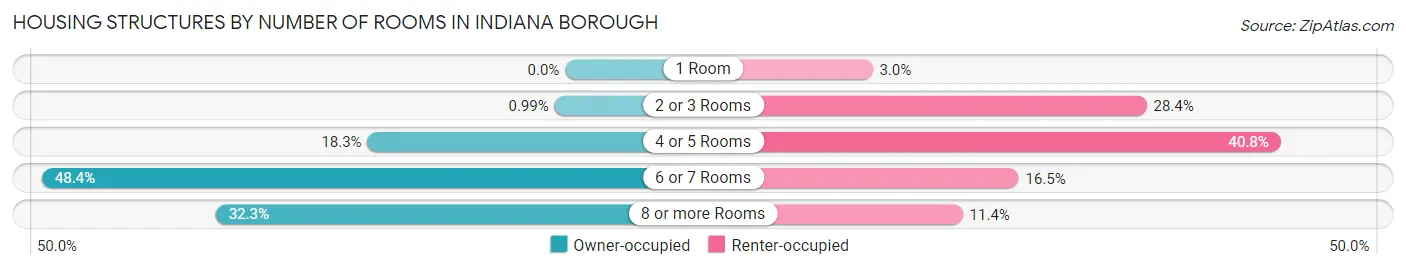
| Number of Rooms | Owner-occupied | Renter-occupied |
| 1 Room | 0 (0.0%) | 74 (3.0%) |
| 2 or 3 Rooms | 18 (1.0%) | 697 (28.4%) |
| 4 or 5 Rooms | 331 (18.3%) | 1,002 (40.8%) |
| 6 or 7 Rooms | 876 (48.4%) | 406 (16.5%) |
| 8 or more Rooms | 585 (32.3%) | 279 (11.4%) |
| Total | 1,810 (100.0%) | 2,458 (100.0%) |
Housing Structure by Heating Type in Indiana borough
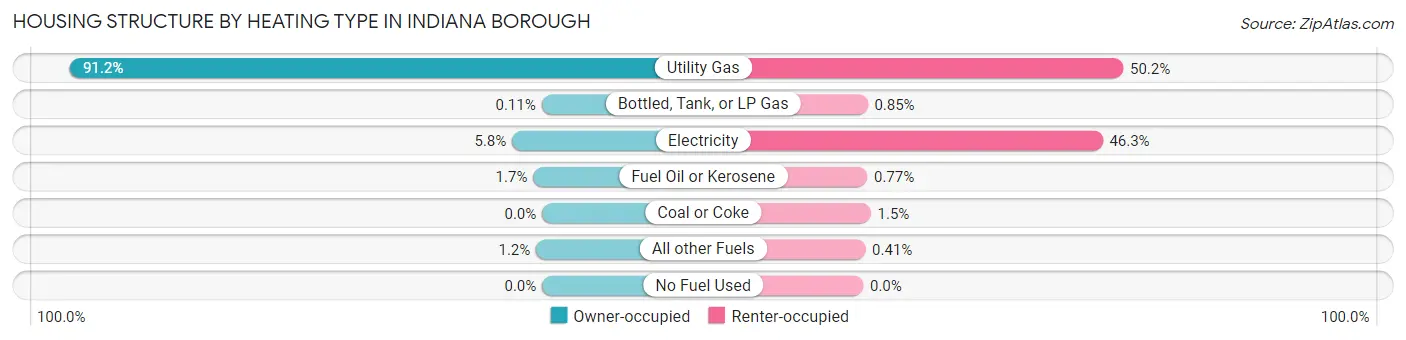
| Heating Type | Owner-occupied | Renter-occupied |
| Utility Gas | 1,651 (91.2%) | 1,235 (50.2%) |
| Bottled, Tank, or LP Gas | 2 (0.1%) | 21 (0.9%) |
| Electricity | 105 (5.8%) | 1,137 (46.3%) |
| Fuel Oil or Kerosene | 31 (1.7%) | 19 (0.8%) |
| Coal or Coke | 0 (0.0%) | 36 (1.5%) |
| All other Fuels | 21 (1.2%) | 10 (0.4%) |
| No Fuel Used | 0 (0.0%) | 0 (0.0%) |
| Total | 1,810 (100.0%) | 2,458 (100.0%) |
Household Vehicle Usage in Indiana borough
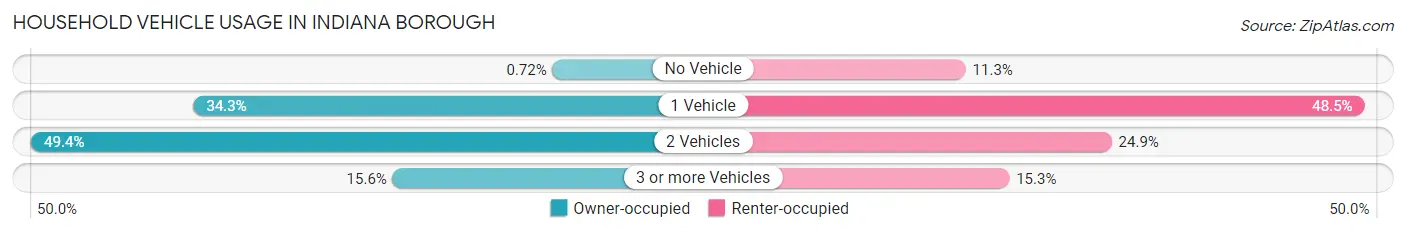
| Vehicles per Household | Owner-occupied | Renter-occupied |
| No Vehicle | 13 (0.7%) | 277 (11.3%) |
| 1 Vehicle | 620 (34.3%) | 1,192 (48.5%) |
| 2 Vehicles | 894 (49.4%) | 612 (24.9%) |
| 3 or more Vehicles | 283 (15.6%) | 377 (15.3%) |
| Total | 1,810 (100.0%) | 2,458 (100.0%) |
Real Estate & Mortgages in Indiana borough
Real Estate and Mortgage Overview in Indiana borough
| Characteristic | Without Mortgage | With Mortgage |
| Housing Units | 763 | 1,047 |
| Median Property Value | $132,000 | $119,800 |
| Median Household Income | $82,443 | $279 |
| Monthly Housing Costs | $574 | $11 |
| Real Estate Taxes | $3,057 | $0 |
Property Value by Mortgage Status in Indiana borough
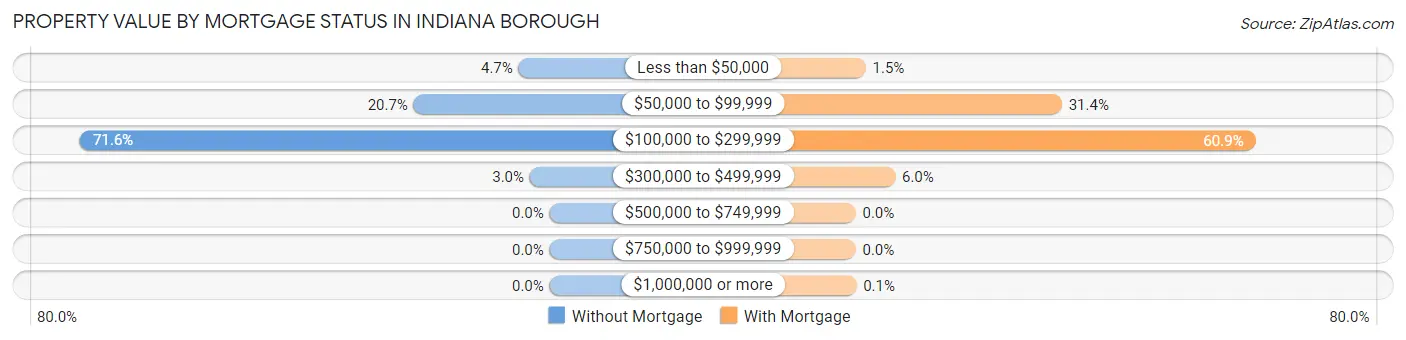
| Property Value | Without Mortgage | With Mortgage |
| Less than $50,000 | 36 (4.7%) | 16 (1.5%) |
| $50,000 to $99,999 | 158 (20.7%) | 329 (31.4%) |
| $100,000 to $299,999 | 546 (71.6%) | 638 (60.9%) |
| $300,000 to $499,999 | 23 (3.0%) | 63 (6.0%) |
| $500,000 to $749,999 | 0 (0.0%) | 0 (0.0%) |
| $750,000 to $999,999 | 0 (0.0%) | 0 (0.0%) |
| $1,000,000 or more | 0 (0.0%) | 1 (0.1%) |
| Total | 763 (100.0%) | 1,047 (100.0%) |
Household Income by Mortgage Status in Indiana borough
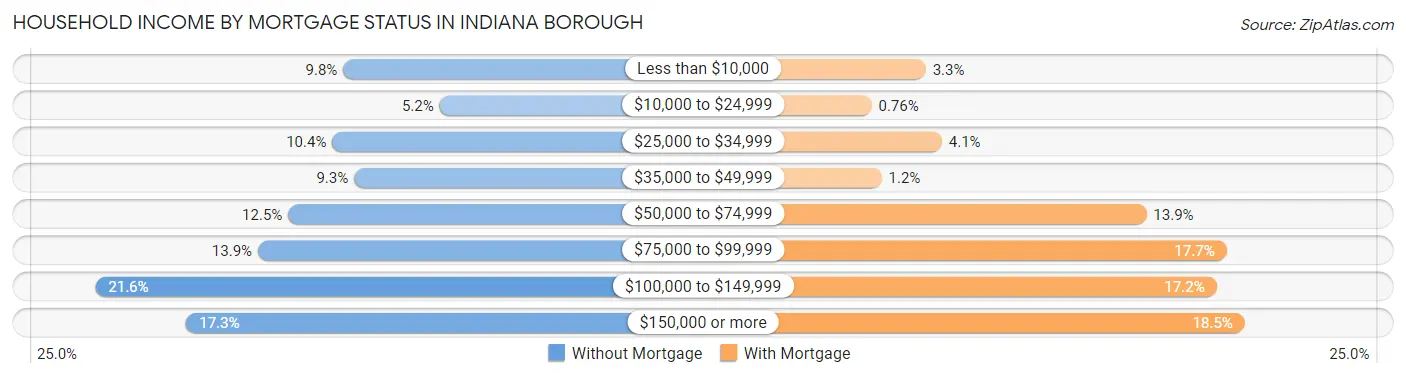
| Household Income | Without Mortgage | With Mortgage |
| Less than $10,000 | 75 (9.8%) | 35 (3.3%) |
| $10,000 to $24,999 | 40 (5.2%) | 8 (0.8%) |
| $25,000 to $34,999 | 79 (10.3%) | 43 (4.1%) |
| $35,000 to $49,999 | 71 (9.3%) | 13 (1.2%) |
| $50,000 to $74,999 | 95 (12.4%) | 145 (13.9%) |
| $75,000 to $99,999 | 106 (13.9%) | 185 (17.7%) |
| $100,000 to $149,999 | 165 (21.6%) | 180 (17.2%) |
| $150,000 or more | 132 (17.3%) | 194 (18.5%) |
| Total | 763 (100.0%) | 1,047 (100.0%) |
Property Value to Household Income Ratio in Indiana borough
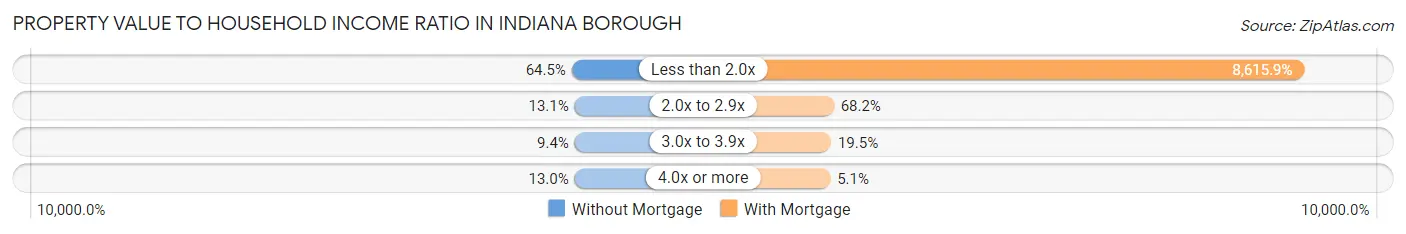
| Value-to-Income Ratio | Without Mortgage | With Mortgage |
| Less than 2.0x | 492 (64.5%) | 90,208 (8,615.9%) |
| 2.0x to 2.9x | 100 (13.1%) | 714 (68.2%) |
| 3.0x to 3.9x | 72 (9.4%) | 204 (19.5%) |
| 4.0x or more | 99 (13.0%) | 53 (5.1%) |
| Total | 763 (100.0%) | 1,047 (100.0%) |
Real Estate Taxes by Mortgage Status in Indiana borough
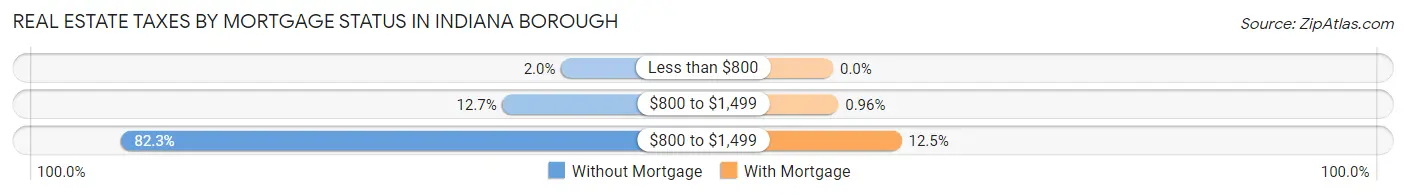
| Property Taxes | Without Mortgage | With Mortgage |
| Less than $800 | 15 (2.0%) | 0 (0.0%) |
| $800 to $1,499 | 97 (12.7%) | 10 (1.0%) |
| $800 to $1,499 | 628 (82.3%) | 131 (12.5%) |
| Total | 763 (100.0%) | 1,047 (100.0%) |
Health & Disability in Indiana borough
Health Insurance Coverage by Age in Indiana borough
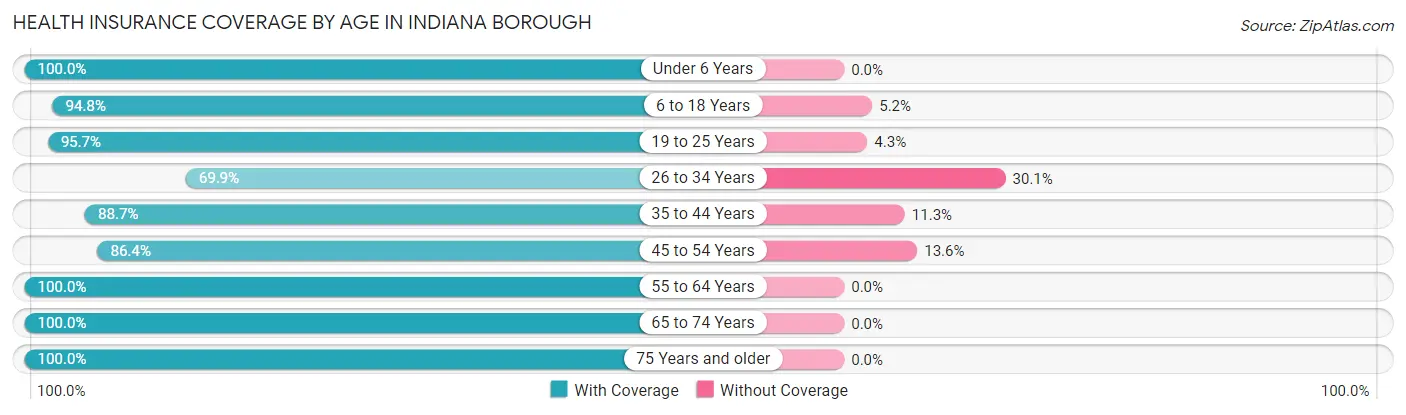
| Age Bracket | With Coverage | Without Coverage |
| Under 6 Years | 531 (100.0%) | 0 (0.0%) |
| 6 to 18 Years | 2,304 (94.8%) | 127 (5.2%) |
| 19 to 25 Years | 5,814 (95.7%) | 262 (4.3%) |
| 26 to 34 Years | 802 (69.9%) | 345 (30.1%) |
| 35 to 44 Years | 950 (88.7%) | 121 (11.3%) |
| 45 to 54 Years | 749 (86.4%) | 118 (13.6%) |
| 55 to 64 Years | 977 (100.0%) | 0 (0.0%) |
| 65 to 74 Years | 607 (100.0%) | 0 (0.0%) |
| 75 Years and older | 371 (100.0%) | 0 (0.0%) |
| Total | 13,105 (93.1%) | 973 (6.9%) |
Health Insurance Coverage by Citizenship Status in Indiana borough
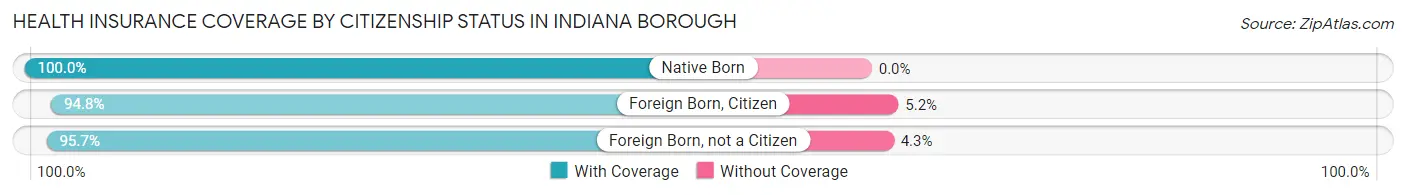
| Citizenship Status | With Coverage | Without Coverage |
| Native Born | 531 (100.0%) | 0 (0.0%) |
| Foreign Born, Citizen | 2,304 (94.8%) | 127 (5.2%) |
| Foreign Born, not a Citizen | 5,814 (95.7%) | 262 (4.3%) |
Health Insurance Coverage by Household Income in Indiana borough
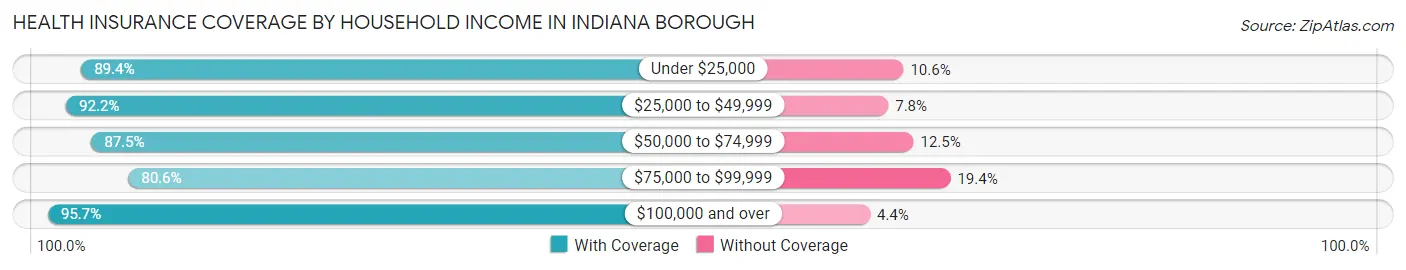
| Household Income | With Coverage | Without Coverage |
| Under $25,000 | 2,113 (89.4%) | 251 (10.6%) |
| $25,000 to $49,999 | 2,149 (92.2%) | 181 (7.8%) |
| $50,000 to $74,999 | 1,085 (87.5%) | 155 (12.5%) |
| $75,000 to $99,999 | 796 (80.6%) | 192 (19.4%) |
| $100,000 and over | 2,879 (95.7%) | 131 (4.3%) |
Public vs Private Health Insurance Coverage by Age in Indiana borough
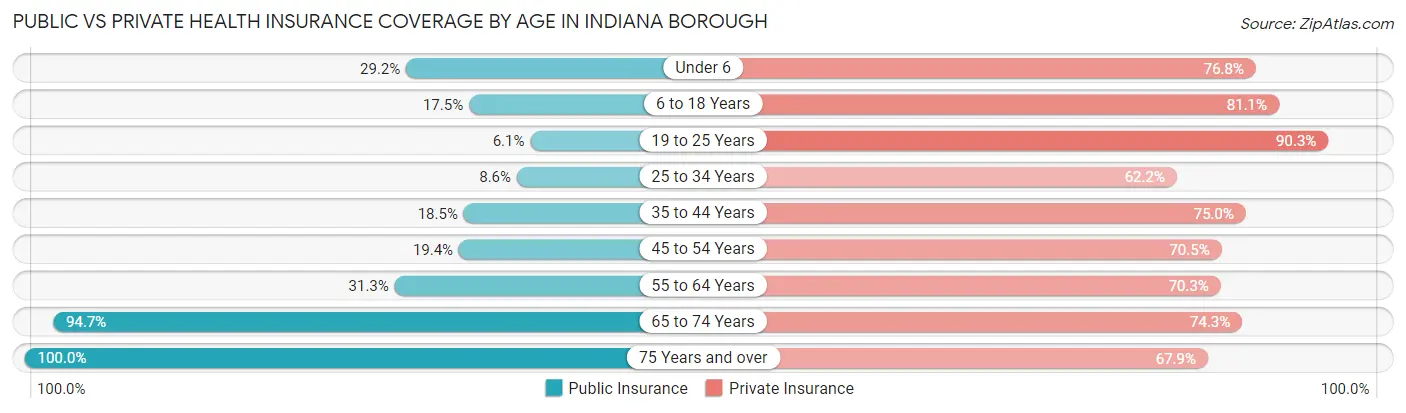
| Age Bracket | Public Insurance | Private Insurance |
| Under 6 | 155 (29.2%) | 408 (76.8%) |
| 6 to 18 Years | 426 (17.5%) | 1,972 (81.1%) |
| 19 to 25 Years | 373 (6.1%) | 5,485 (90.3%) |
| 25 to 34 Years | 99 (8.6%) | 713 (62.2%) |
| 35 to 44 Years | 198 (18.5%) | 803 (75.0%) |
| 45 to 54 Years | 168 (19.4%) | 611 (70.5%) |
| 55 to 64 Years | 306 (31.3%) | 687 (70.3%) |
| 65 to 74 Years | 575 (94.7%) | 451 (74.3%) |
| 75 Years and over | 371 (100.0%) | 252 (67.9%) |
| Total | 2,671 (19.0%) | 11,382 (80.8%) |
Disability Status by Sex by Age in Indiana borough
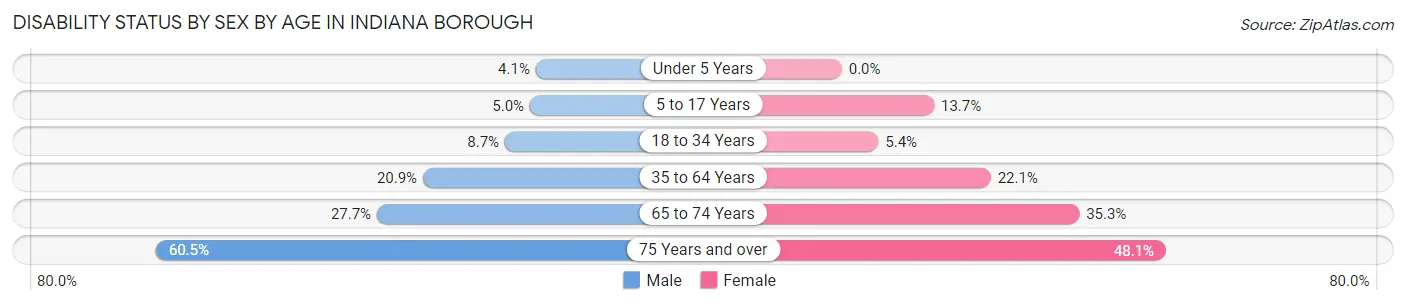
| Age Bracket | Male | Female |
| Under 5 Years | 10 (4.1%) | 0 (0.0%) |
| 5 to 17 Years | 29 (5.0%) | 67 (13.7%) |
| 18 to 34 Years | 348 (8.7%) | 252 (5.4%) |
| 35 to 64 Years | 305 (20.8%) | 321 (22.1%) |
| 65 to 74 Years | 62 (27.7%) | 135 (35.2%) |
| 75 Years and over | 95 (60.5%) | 103 (48.1%) |
Disability Class by Sex by Age in Indiana borough
Disability Class: Hearing Difficulty
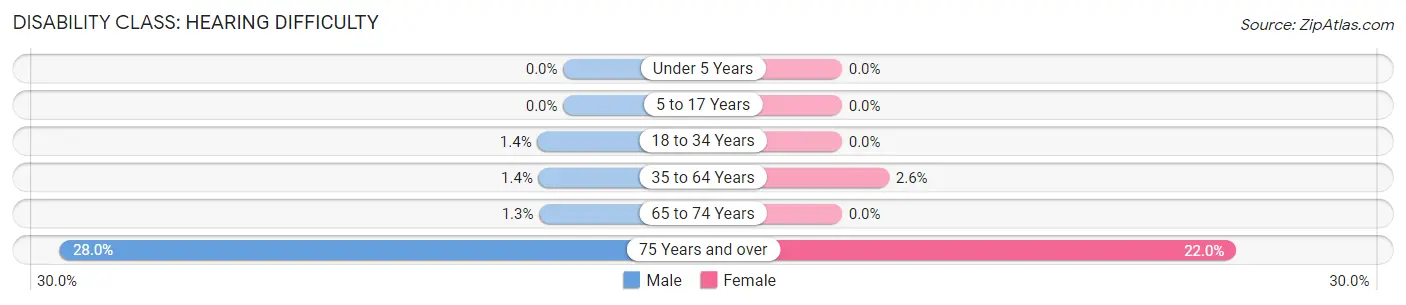
| Age Bracket | Male | Female |
| Under 5 Years | 0 (0.0%) | 0 (0.0%) |
| 5 to 17 Years | 0 (0.0%) | 0 (0.0%) |
| 18 to 34 Years | 58 (1.4%) | 0 (0.0%) |
| 35 to 64 Years | 20 (1.4%) | 38 (2.6%) |
| 65 to 74 Years | 3 (1.3%) | 0 (0.0%) |
| 75 Years and over | 44 (28.0%) | 47 (22.0%) |
Disability Class: Vision Difficulty
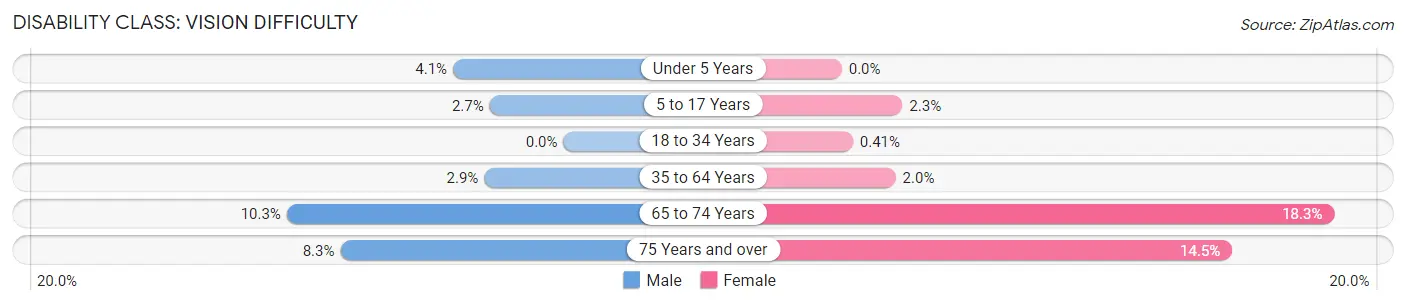
| Age Bracket | Male | Female |
| Under 5 Years | 10 (4.1%) | 0 (0.0%) |
| 5 to 17 Years | 16 (2.7%) | 11 (2.2%) |
| 18 to 34 Years | 0 (0.0%) | 19 (0.4%) |
| 35 to 64 Years | 43 (2.9%) | 29 (2.0%) |
| 65 to 74 Years | 23 (10.3%) | 70 (18.3%) |
| 75 Years and over | 13 (8.3%) | 31 (14.5%) |
Disability Class: Cognitive Difficulty
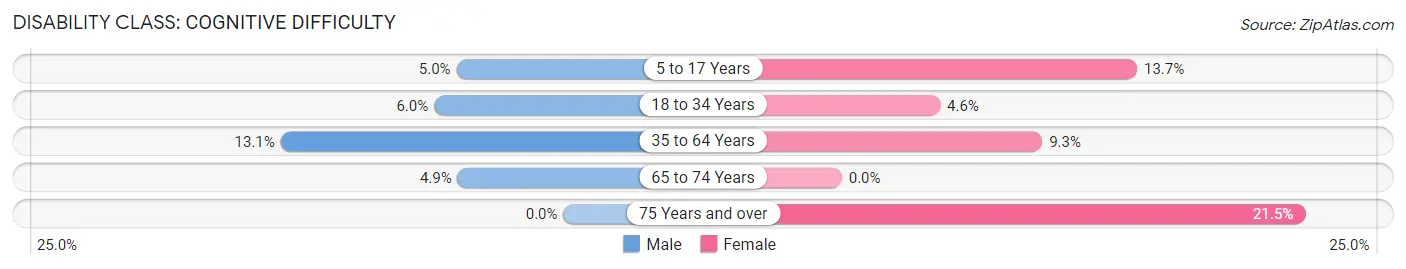
| Age Bracket | Male | Female |
| 5 to 17 Years | 29 (5.0%) | 67 (13.7%) |
| 18 to 34 Years | 241 (6.0%) | 212 (4.6%) |
| 35 to 64 Years | 192 (13.1%) | 135 (9.3%) |
| 65 to 74 Years | 11 (4.9%) | 0 (0.0%) |
| 75 Years and over | 0 (0.0%) | 46 (21.5%) |
Disability Class: Ambulatory Difficulty
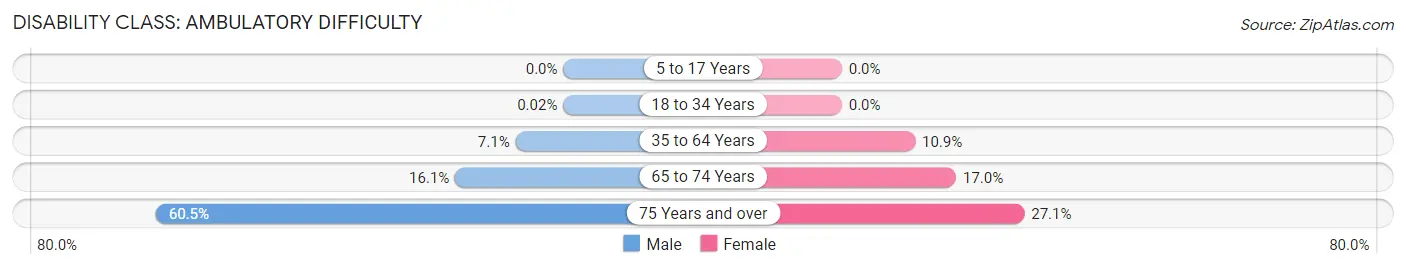
| Age Bracket | Male | Female |
| 5 to 17 Years | 0 (0.0%) | 0 (0.0%) |
| 18 to 34 Years | 1 (0.0%) | 0 (0.0%) |
| 35 to 64 Years | 104 (7.1%) | 158 (10.9%) |
| 65 to 74 Years | 36 (16.1%) | 65 (17.0%) |
| 75 Years and over | 95 (60.5%) | 58 (27.1%) |
Disability Class: Self-Care Difficulty
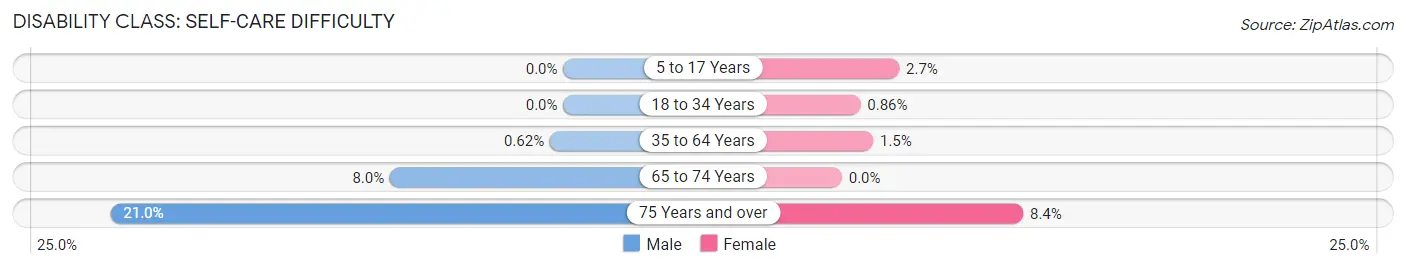
| Age Bracket | Male | Female |
| 5 to 17 Years | 0 (0.0%) | 13 (2.7%) |
| 18 to 34 Years | 0 (0.0%) | 40 (0.9%) |
| 35 to 64 Years | 9 (0.6%) | 21 (1.5%) |
| 65 to 74 Years | 18 (8.0%) | 0 (0.0%) |
| 75 Years and over | 33 (21.0%) | 18 (8.4%) |
Technology Access in Indiana borough
Computing Device Access in Indiana borough
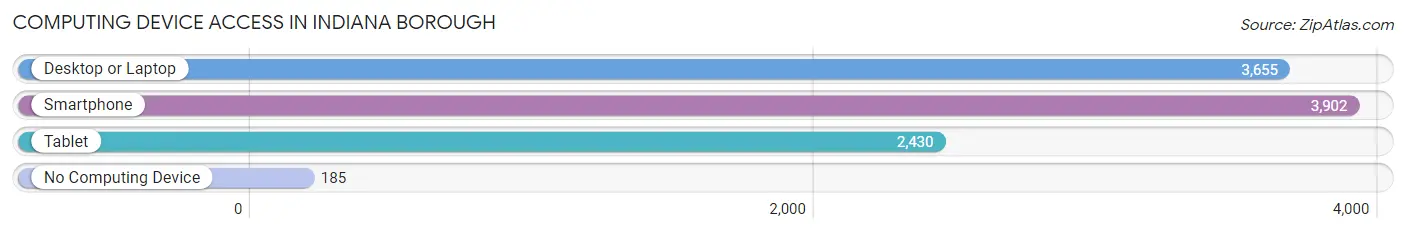
| Device Type | # Households | % Households |
| Desktop or Laptop | 3,655 | 85.6% |
| Smartphone | 3,902 | 91.4% |
| Tablet | 2,430 | 56.9% |
| No Computing Device | 185 | 4.3% |
| Total | 4,268 | 100.0% |
Internet Access in Indiana borough
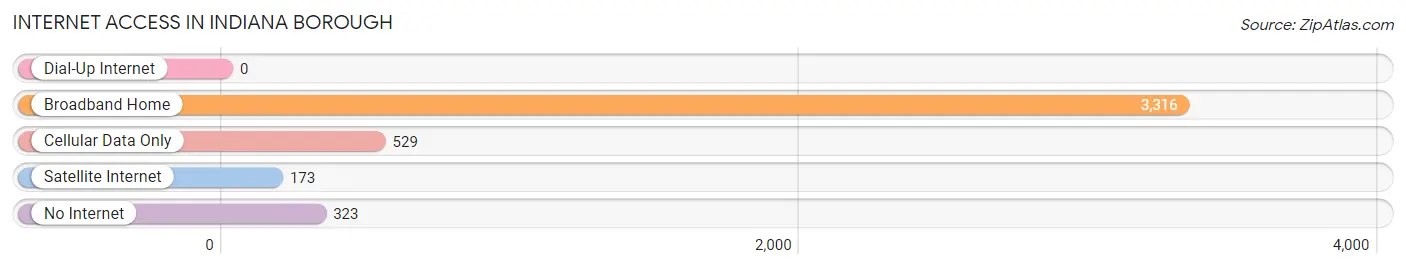
| Internet Type | # Households | % Households |
| Dial-Up Internet | 0 | 0.0% |
| Broadband Home | 3,316 | 77.7% |
| Cellular Data Only | 529 | 12.4% |
| Satellite Internet | 173 | 4.1% |
| No Internet | 323 | 7.6% |
| Total | 4,268 | 100.0% |
Indiana borough Summary
History
The borough of Indiana, Pennsylvania is located in the western part of the state, in Indiana County. It is the county seat of Indiana County and is the largest borough in the county. The borough was founded in 1805 and was named after the Indiana Territory, which was created in 1800. The borough was originally part of the larger Indiana Township, which was divided into two parts in 1805. The borough was incorporated in 1816 and has since grown to become the largest borough in the county.
The borough of Indiana has a rich history that dates back to the early 1800s. The first settlers in the area were mostly of German and Scotch-Irish descent. The first settlers were attracted to the area due to its abundance of natural resources, such as timber and coal. The first industry in the area was the lumber industry, which was established in 1810. The lumber industry was followed by the coal industry, which was established in 1820.
The borough of Indiana was an important center of industry during the 19th century. The borough was home to several factories, including a glass factory, a paper mill, a tannery, and a foundry. The borough was also home to several railroads, which connected the borough to other parts of the state.
The borough of Indiana was also an important center of education during the 19th century. The borough was home to several colleges, including Indiana State Normal School (now Indiana University of Pennsylvania), Indiana Normal School (now Indiana University of Pennsylvania), and Indiana Normal Institute (now Indiana University of Pennsylvania).
Geography
The borough of Indiana is located in the western part of Pennsylvania, in Indiana County. It is the county seat of Indiana County and is the largest borough in the county. The borough is located in the Allegheny Plateau region of the state and is situated on the banks of the Conemaugh River. The borough is located approximately 50 miles northeast of Pittsburgh and is bordered by the boroughs of White Township, Black Lick Township, and Burrell Township.
The borough of Indiana has a total area of 4.2 square miles, all of which is land. The borough is located at an elevation of 1,068 feet above sea level. The borough has a humid continental climate, with cold winters and hot, humid summers.
Economy
The economy of the borough of Indiana is largely based on the service industry. The borough is home to several retail stores, restaurants, and other businesses. The borough is also home to several manufacturing companies, including a glass factory, a paper mill, a tannery, and a foundry. The borough is also home to several educational institutions, including Indiana University of Pennsylvania, Indiana State Normal School, and Indiana Normal Institute.
The borough of Indiana is also home to several healthcare facilities, including Indiana Regional Medical Center and Indiana Hospital. The borough is also home to several parks and recreational facilities, including the Indiana County Park and the Indiana County Fairgrounds.
Demographics
As of the 2010 census, the borough of Indiana had a population of 13,975. The population was spread out, with 51.2% of the population being male and 48.8% being female. The median age of the population was 40.7 years. The racial makeup of the borough was 95.2% White, 1.3% African American, 0.3% Native American, 0.7% Asian, 0.1% Pacific Islander, 0.9% from other races, and 1.5% from two or more races.
The median household income in the borough was $37,945, and the median family income was $45,945. The per capita income in the borough was $20,945. About 11.2% of the population was below the poverty line.
Common Questions
What is Per Capita Income in Indiana borough?
Per Capita income in Indiana borough is $21,332.
What is the Median Family Income in Indiana borough?
Median Family Income in Indiana borough is $87,090.
What is the Median Household income in Indiana borough?
Median Household Income in Indiana borough is $40,013.
What is Income or Wage Gap in Indiana borough?
Income or Wage Gap in Indiana borough is 47.7%.
Women in Indiana borough earn 52.3 cents for every dollar earned by a man.
What is Inequality or Gini Index in Indiana borough?
Inequality or Gini Index in Indiana borough is 0.50.
What is the Total Population of Indiana borough?
Total Population of Indiana borough is 14,082.
What is the Total Male Population of Indiana borough?
Total Male Population of Indiana borough is 6,693.
What is the Total Female Population of Indiana borough?
Total Female Population of Indiana borough is 7,389.
What is the Ratio of Males per 100 Females in Indiana borough?
There are 90.58 Males per 100 Females in Indiana borough.
What is the Ratio of Females per 100 Males in Indiana borough?
There are 110.40 Females per 100 Males in Indiana borough.
What is the Median Population Age in Indiana borough?
Median Population Age in Indiana borough is 21.8 Years.
What is the Average Family Size in Indiana borough
Average Family Size in Indiana borough is 3.2 People.
What is the Average Household Size in Indiana borough
Average Household Size in Indiana borough is 2.3 People.
How Large is the Labor Force in Indiana borough?
There are 7,054 People in the Labor Forcein in Indiana borough.
What is the Percentage of People in the Labor Force in Indiana borough?
55.1% of People are in the Labor Force in Indiana borough.
What is the Unemployment Rate in Indiana borough?
Unemployment Rate in Indiana borough is 8.3%.