Cities with the Highest Percentage of Immigrants from Asia in Pennsylvania
RELATED REPORTS & OPTIONS
Asia
Pennsylvania
Compare Cities
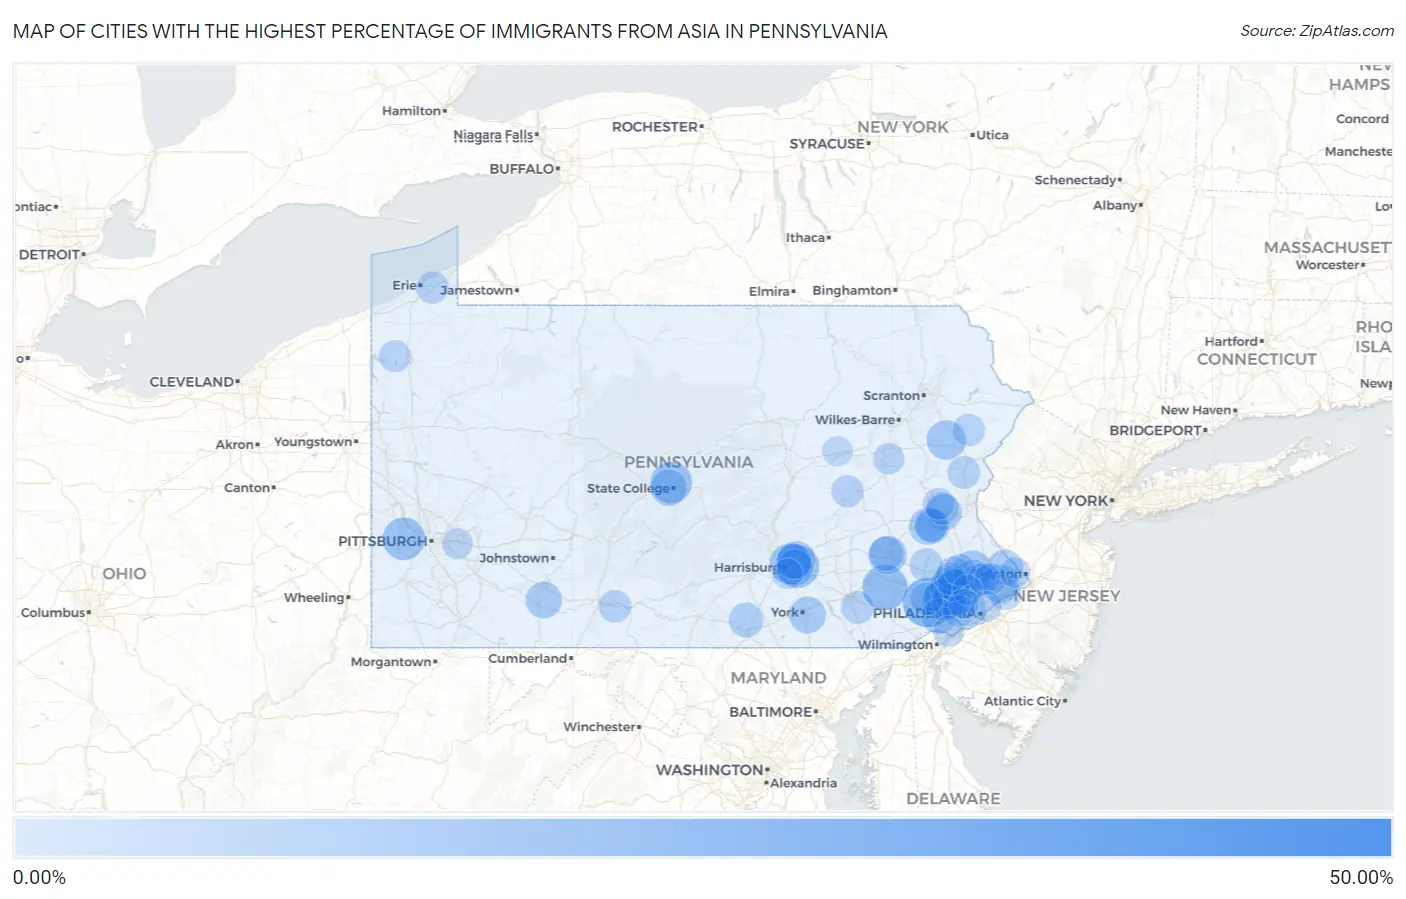
Map of Cities with the Highest Percentage of Immigrants from Asia in Pennsylvania
0.00%
50.00%
Cities with the Highest Percentage of Immigrants from Asia in Pennsylvania
| City | Asia | vs State | vs National | |
| 1. | Millbourne Borough | 42.32% | 2.81%(+39.5)#1 | 4.26%(+38.1)#34 |
| 2. | Morgan Hill | 34.18% | 2.81%(+31.4)#2 | 4.26%(+29.9)#73 |
| 3. | Frazer | 32.29% | 2.81%(+29.5)#3 | 4.26%(+28.0)#89 |
| 4. | Exton | 21.38% | 2.81%(+18.6)#4 | 4.26%(+17.1)#246 |
| 5. | Chesterbrook | 18.70% | 2.81%(+15.9)#5 | 4.26%(+14.4)#326 |
| 6. | Goodville | 17.79% | 2.81%(+15.0)#6 | 4.26%(+13.5)#362 |
| 7. | King Of Prussia | 17.45% | 2.81%(+14.6)#7 | 4.26%(+13.2)#376 |
| 8. | Rutherford | 16.21% | 2.81%(+13.4)#8 | 4.26%(+11.9)#425 |
| 9. | Hatfield Borough | 15.87% | 2.81%(+13.1)#9 | 4.26%(+11.6)#436 |
| 10. | Enlow | 15.52% | 2.81%(+12.7)#10 | 4.26%(+11.3)#453 |
| 11. | Toftrees | 14.77% | 2.81%(+12.0)#11 | 4.26%(+10.5)#500 |
| 12. | Progress | 14.10% | 2.81%(+11.3)#12 | 4.26%(+9.84)#532 |
| 13. | Paoli | 13.76% | 2.81%(+11.0)#13 | 4.26%(+9.50)#555 |
| 14. | Audubon | 13.46% | 2.81%(+10.6)#14 | 4.26%(+9.20)#576 |
| 15. | Montgomeryville | 12.88% | 2.81%(+10.1)#15 | 4.26%(+8.62)#615 |
| 16. | Aspinwall Borough | 12.73% | 2.81%(+9.93)#16 | 4.26%(+8.47)#628 |
| 17. | Pocono Pines | 12.69% | 2.81%(+9.89)#17 | 4.26%(+8.43)#632 |
| 18. | Spring House | 12.02% | 2.81%(+9.22)#18 | 4.26%(+7.76)#682 |
| 19. | Colony Park | 11.88% | 2.81%(+9.07)#19 | 4.26%(+7.62)#701 |
| 20. | Feasterville | 11.85% | 2.81%(+9.04)#20 | 4.26%(+7.59)#704 |
| 21. | Paxtonia | 11.55% | 2.81%(+8.75)#21 | 4.26%(+7.29)#730 |
| 22. | Whitehall Borough | 10.79% | 2.81%(+7.98)#22 | 4.26%(+6.53)#810 |
| 23. | Breinigsville | 10.76% | 2.81%(+7.95)#23 | 4.26%(+6.50)#814 |
| 24. | Lansdale Borough | 10.67% | 2.81%(+7.87)#24 | 4.26%(+6.41)#825 |
| 25. | Queens Gate | 10.63% | 2.81%(+7.82)#25 | 4.26%(+6.37)#828 |
| 26. | Dilworthtown | 10.42% | 2.81%(+7.62)#26 | 4.26%(+6.16)#859 |
| 27. | Friedens | 10.42% | 2.81%(+7.61)#27 | 4.26%(+6.16)#861 |
| 28. | Lawnton | 10.34% | 2.81%(+7.53)#28 | 4.26%(+6.08)#873 |
| 29. | Park Forest Village | 10.32% | 2.81%(+7.52)#29 | 4.26%(+6.06)#876 |
| 30. | Malvern Borough | 10.30% | 2.81%(+7.49)#30 | 4.26%(+6.04)#877 |
| 31. | Fullerton | 10.17% | 2.81%(+7.37)#31 | 4.26%(+5.91)#899 |
| 32. | Newtown Grant | 9.91% | 2.81%(+7.11)#32 | 4.26%(+5.65)#938 |
| 33. | Paxtang Borough | 9.82% | 2.81%(+7.01)#33 | 4.26%(+5.56)#948 |
| 34. | Franklin Park Borough | 9.59% | 2.81%(+6.78)#34 | 4.26%(+5.32)#979 |
| 35. | Colonial Park | 9.50% | 2.81%(+6.70)#35 | 4.26%(+5.24)#986 |
| 36. | Penn Wynne | 9.45% | 2.81%(+6.64)#36 | 4.26%(+5.19)#990 |
| 37. | Cheyney University | 9.21% | 2.81%(+6.40)#37 | 4.26%(+4.95)#1,026 |
| 38. | State College Borough | 9.09% | 2.81%(+6.29)#38 | 4.26%(+4.83)#1,047 |
| 39. | Table Rock | 9.00% | 2.81%(+6.19)#39 | 4.26%(+4.74)#1,068 |
| 40. | Rosemont | 8.81% | 2.81%(+6.00)#40 | 4.26%(+4.55)#1,099 |
| 41. | Spring Ridge | 8.69% | 2.81%(+5.88)#41 | 4.26%(+4.43)#1,124 |
| 42. | Berwyn | 8.62% | 2.81%(+5.82)#42 | 4.26%(+4.36)#1,144 |
| 43. | Blawnox Borough | 8.62% | 2.81%(+5.81)#43 | 4.26%(+4.36)#1,146 |
| 44. | Rutledge Borough | 8.41% | 2.81%(+5.60)#44 | 4.26%(+4.15)#1,186 |
| 45. | Ancient Oaks | 8.34% | 2.81%(+5.53)#45 | 4.26%(+4.08)#1,198 |
| 46. | Skippack | 8.25% | 2.81%(+5.45)#46 | 4.26%(+3.99)#1,216 |
| 47. | Trexlertown | 8.17% | 2.81%(+5.36)#47 | 4.26%(+3.91)#1,233 |
| 48. | Halfway House | 8.02% | 2.81%(+5.21)#48 | 4.26%(+3.76)#1,254 |
| 49. | Maple Glen | 7.58% | 2.81%(+4.77)#49 | 4.26%(+3.32)#1,353 |
| 50. | Eagleville Cdp Montgomery County | 7.54% | 2.81%(+4.73)#50 | 4.26%(+3.28)#1,364 |
| 51. | Lionville | 7.38% | 2.81%(+4.57)#51 | 4.26%(+3.12)#1,403 |
| 52. | Lampeter | 7.37% | 2.81%(+4.56)#52 | 4.26%(+3.11)#1,407 |
| 53. | Earlston | 7.21% | 2.81%(+4.40)#53 | 4.26%(+2.95)#1,447 |
| 54. | Saylorsburg | 7.15% | 2.81%(+4.34)#54 | 4.26%(+2.89)#1,464 |
| 55. | Downingtown Borough | 7.02% | 2.81%(+4.22)#55 | 4.26%(+2.76)#1,493 |
| 56. | Matamoras Borough | 6.93% | 2.81%(+4.12)#56 | 4.26%(+2.67)#1,526 |
| 57. | Hokendauqua | 6.93% | 2.81%(+4.12)#57 | 4.26%(+2.67)#1,528 |
| 58. | Merion Station | 6.92% | 2.81%(+4.11)#58 | 4.26%(+2.66)#1,531 |
| 59. | Fountain Springs | 6.90% | 2.81%(+4.09)#59 | 4.26%(+2.64)#1,538 |
| 60. | Baldwin Borough | 6.89% | 2.81%(+4.09)#60 | 4.26%(+2.63)#1,539 |
| 61. | Mountainhome | 6.87% | 2.81%(+4.07)#61 | 4.26%(+2.61)#1,544 |
| 62. | Penn State Erie Behrend | 6.87% | 2.81%(+4.06)#62 | 4.26%(+2.61)#1,547 |
| 63. | Eddington | 6.78% | 2.81%(+3.98)#63 | 4.26%(+2.52)#1,568 |
| 64. | Trooper | 6.75% | 2.81%(+3.94)#64 | 4.26%(+2.49)#1,582 |
| 65. | Evansburg | 6.71% | 2.81%(+3.91)#65 | 4.26%(+2.45)#1,590 |
| 66. | Clarks Green Borough | 6.71% | 2.81%(+3.91)#66 | 4.26%(+2.45)#1,591 |
| 67. | Castle Shannon Borough | 6.69% | 2.81%(+3.88)#67 | 4.26%(+2.43)#1,597 |
| 68. | Horsham | 6.68% | 2.81%(+3.88)#68 | 4.26%(+2.42)#1,600 |
| 69. | Kulpsville | 6.68% | 2.81%(+3.88)#69 | 4.26%(+2.42)#1,601 |
| 70. | St. Davids | 6.65% | 2.81%(+3.84)#70 | 4.26%(+2.39)#1,612 |
| 71. | Eagle | 6.58% | 2.81%(+3.77)#71 | 4.26%(+2.32)#1,630 |
| 72. | Harmonsburg | 6.56% | 2.81%(+3.75)#72 | 4.26%(+2.30)#1,636 |
| 73. | Wayne | 6.55% | 2.81%(+3.74)#73 | 4.26%(+2.29)#1,638 |
| 74. | Broomall | 6.55% | 2.81%(+3.74)#74 | 4.26%(+2.29)#1,639 |
| 75. | Bala Cynwyd | 6.47% | 2.81%(+3.67)#75 | 4.26%(+2.21)#1,651 |
| 76. | Warminster Heights | 6.36% | 2.81%(+3.55)#76 | 4.26%(+2.10)#1,689 |
| 77. | Egypt | 6.30% | 2.81%(+3.50)#77 | 4.26%(+2.04)#1,704 |
| 78. | Swarthmore Borough | 6.07% | 2.81%(+3.26)#78 | 4.26%(+1.81)#1,765 |
| 79. | Harleigh | 6.05% | 2.81%(+3.24)#79 | 4.26%(+1.79)#1,770 |
| 80. | Villanova | 6.04% | 2.81%(+3.23)#80 | 4.26%(+1.78)#1,774 |
| 81. | Boothwyn | 6.03% | 2.81%(+3.22)#81 | 4.26%(+1.77)#1,777 |
| 82. | East Lansdowne Borough | 5.85% | 2.81%(+3.04)#82 | 4.26%(+1.59)#1,852 |
| 83. | Millville Borough | 5.80% | 2.81%(+2.99)#83 | 4.26%(+1.54)#1,873 |
| 84. | Wormleysburg Borough | 5.69% | 2.81%(+2.88)#84 | 4.26%(+1.43)#1,913 |
| 85. | Stroudsburg Borough | 5.66% | 2.81%(+2.86)#85 | 4.26%(+1.40)#1,920 |
| 86. | Monroeville | 5.66% | 2.81%(+2.85)#86 | 4.26%(+1.40)#1,924 |
| 87. | Narberth Borough | 5.63% | 2.81%(+2.82)#87 | 4.26%(+1.37)#1,935 |
| 88. | Mcadoo Borough | 5.61% | 2.81%(+2.81)#88 | 4.26%(+1.35)#1,942 |
| 89. | Philadelphia | 5.57% | 2.81%(+2.76)#89 | 4.26%(+1.31)#1,962 |
| 90. | Mckinley | 5.44% | 2.81%(+2.63)#90 | 4.26%(+1.18)#2,008 |
| 91. | New Market | 5.41% | 2.81%(+2.61)#91 | 4.26%(+1.15)#2,019 |
| 92. | Woodside | 5.39% | 2.81%(+2.58)#92 | 4.26%(+1.13)#2,032 |
| 93. | Dudley Borough | 5.35% | 2.81%(+2.54)#93 | 4.26%(+1.09)#2,047 |
| 94. | Plymouth Meeting | 5.28% | 2.81%(+2.48)#94 | 4.26%(+1.02)#2,074 |
| 95. | Enon Valley Borough | 5.21% | 2.81%(+2.41)#95 | 4.26%(+0.954)#2,096 |
| 96. | Middletown Borough | 5.21% | 2.81%(+2.40)#96 | 4.26%(+0.947)#2,102 |
| 97. | Fox Chapel Borough | 5.13% | 2.81%(+2.33)#97 | 4.26%(+0.873)#2,134 |
| 98. | Millersville Borough | 5.13% | 2.81%(+2.32)#98 | 4.26%(+0.867)#2,138 |
| 99. | Bryn Mawr | 5.10% | 2.81%(+2.30)#99 | 4.26%(+0.841)#2,151 |
| 100. | Lightstreet | 5.08% | 2.81%(+2.28)#100 | 4.26%(+0.824)#2,159 |
Common Questions
What are the Top 10 Cities with the Highest Percentage of Immigrants from Asia in Pennsylvania?
Top 10 Cities with the Highest Percentage of Immigrants from Asia in Pennsylvania are:
#1
21.38%
#2
18.70%
#3
17.79%
#4
17.45%
#5
16.21%
#6
15.52%
#7
14.77%
#8
14.10%
#9
13.76%
#10
13.46%
What city has the Highest Percentage of Immigrants from Asia in Pennsylvania?
Exton has the Highest Percentage of Immigrants from Asia in Pennsylvania with 21.38%.
What is the Percentage of Immigrants from Asia in the State of Pennsylvania?
Percentage of Immigrants from Asia in Pennsylvania is 2.81%.
What is the Percentage of Immigrants from Asia in the United States?
Percentage of Immigrants from Asia in the United States is 4.26%.