Slippery Rock University, PA Map & Demographics
Slippery Rock University Map
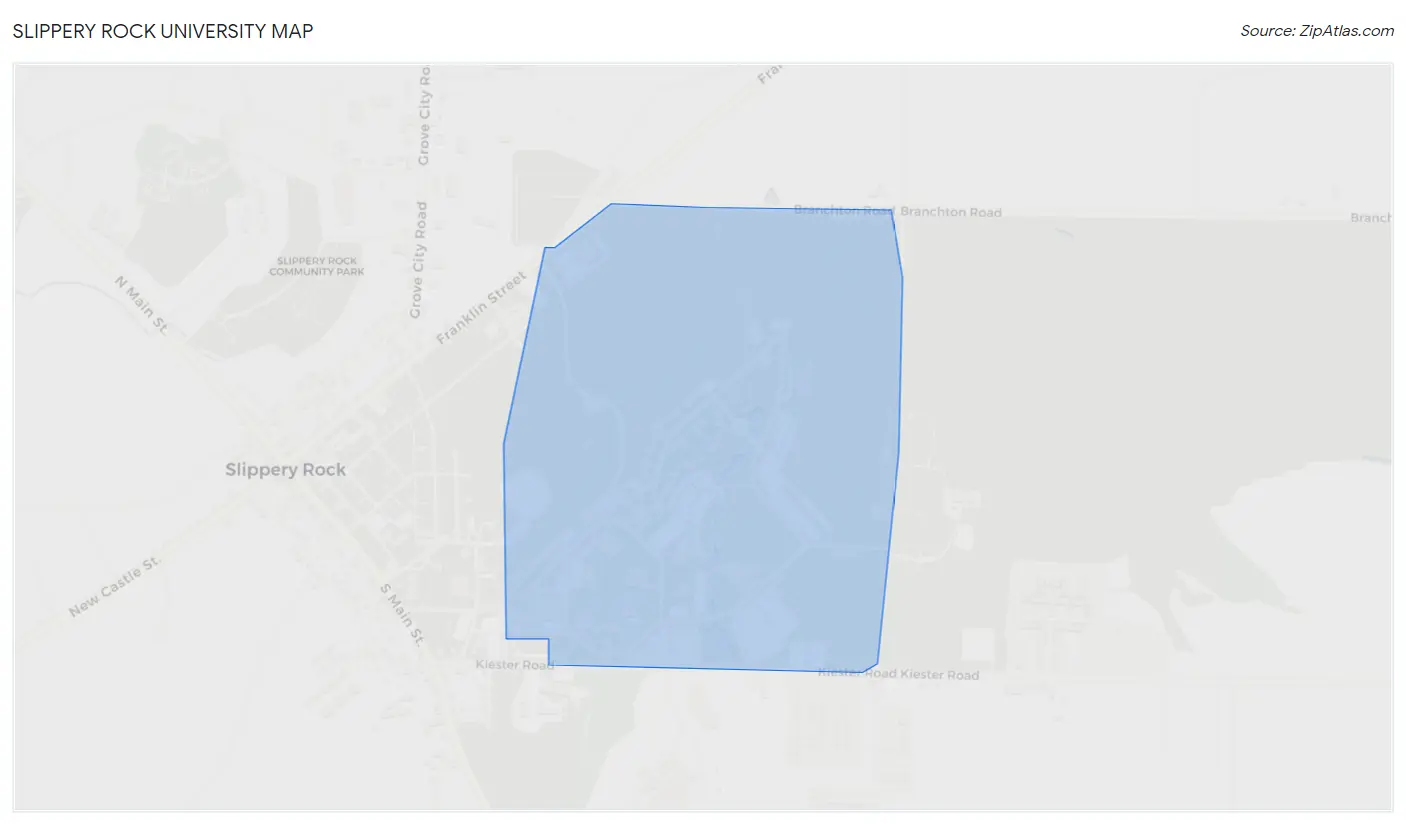
Slippery Rock University Overview
$4,688
PER CAPITA INCOME
41.4%
WAGE / INCOME GAP [ % ]
58.6¢/ $1
WAGE / INCOME GAP [ $ ]
0.34
INEQUALITY / GINI INDEX
2,682
TOTAL POPULATION
859
MALE POPULATION
1,823
FEMALE POPULATION
47.12
MALES / 100 FEMALES
212.22
FEMALES / 100 MALES
19.5
MEDIAN AGE
3.0
AVG FAMILY SIZE
2.4
AVG HOUSEHOLD SIZE
1,242
LABOR FORCE [ PEOPLE ]
46.3%
PERCENT IN LABOR FORCE
10.8%
UNEMPLOYMENT RATE
Income in Slippery Rock University
Income Overview in Slippery Rock University
| Characteristic | Number | Measure |
| Per Capita Income | 2,682 | $4,688 |
| Median Family Income | 20 | $0 |
| Mean Family Income | 20 | $0 |
| Median Household Income | 28 | $0 |
| Mean Household Income | 28 | $0 |
| Income Deficit | 20 | $0 |
| Wage / Income Gap (%) | 2,682 | 41.42% |
| Wage / Income Gap ($) | 2,682 | 58.58¢ per $1 |
| Gini / Inequality Index | 2,682 | 0.34 |
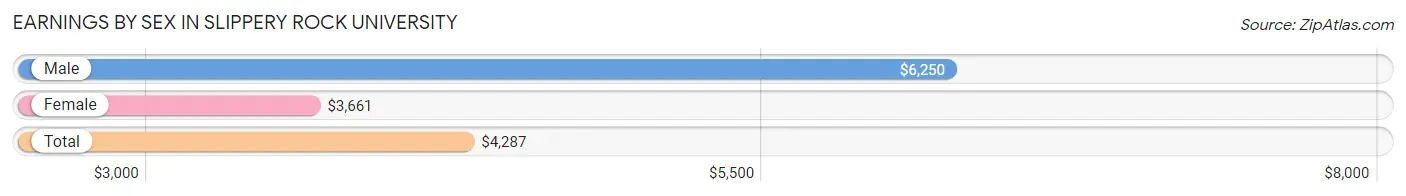
Earnings by Sex in Slippery Rock University
Average Earnings in Slippery Rock University are $4,287, $6,250 for men and $3,661 for women, a difference of 41.4%.
| Sex | Number | Average Earnings |
| Male | 718 (34.6%) | $6,250 |
| Female | 1,358 (65.4%) | $3,661 |
| Total | 2,076 (100.0%) | $4,287 |
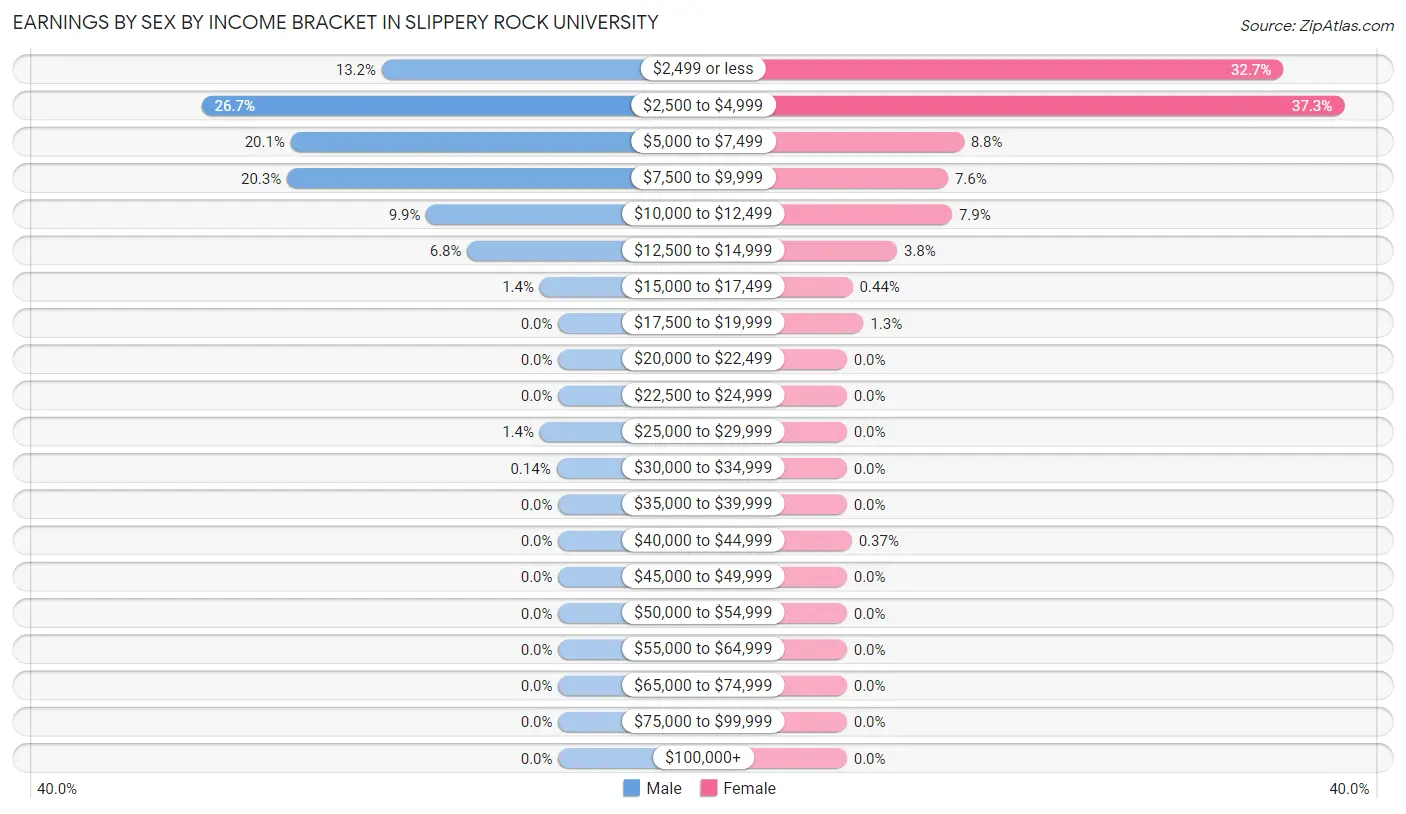
Earnings by Sex by Income Bracket in Slippery Rock University
The most common earnings brackets in Slippery Rock University are $2,500 to $4,999 for men (192 | 26.7%) and $2,500 to $4,999 for women (506 | 37.3%).
| Income | Male | Female |
| $2,499 or less | 95 (13.2%) | 444 (32.7%) |
| $2,500 to $4,999 | 192 (26.7%) | 506 (37.3%) |
| $5,000 to $7,499 | 144 (20.1%) | 119 (8.8%) |
| $7,500 to $9,999 | 146 (20.3%) | 103 (7.6%) |
| $10,000 to $12,499 | 71 (9.9%) | 107 (7.9%) |
| $12,500 to $14,999 | 49 (6.8%) | 51 (3.8%) |
| $15,000 to $17,499 | 10 (1.4%) | 6 (0.4%) |
| $17,500 to $19,999 | 0 (0.0%) | 17 (1.3%) |
| $20,000 to $22,499 | 0 (0.0%) | 0 (0.0%) |
| $22,500 to $24,999 | 0 (0.0%) | 0 (0.0%) |
| $25,000 to $29,999 | 10 (1.4%) | 0 (0.0%) |
| $30,000 to $34,999 | 1 (0.1%) | 0 (0.0%) |
| $35,000 to $39,999 | 0 (0.0%) | 0 (0.0%) |
| $40,000 to $44,999 | 0 (0.0%) | 5 (0.4%) |
| $45,000 to $49,999 | 0 (0.0%) | 0 (0.0%) |
| $50,000 to $54,999 | 0 (0.0%) | 0 (0.0%) |
| $55,000 to $64,999 | 0 (0.0%) | 0 (0.0%) |
| $65,000 to $74,999 | 0 (0.0%) | 0 (0.0%) |
| $75,000 to $99,999 | 0 (0.0%) | 0 (0.0%) |
| $100,000+ | 0 (0.0%) | 0 (0.0%) |
| Total | 718 (100.0%) | 1,358 (100.0%) |
Earnings by Sex by Educational Attainment in Slippery Rock University
| Educational Attainment | Male Income | Female Income |
| Less than High School | - | - |
| High School Diploma | - | - |
| College or Associate's Degree | - | - |
| Bachelor's Degree | - | - |
| Graduate Degree | - | - |
| Total | - | - |
Family Income in Slippery Rock University
Family Income Brackets in Slippery Rock University
According to the Slippery Rock University family income data, there are 20 families falling into the less than $10,000 income range, which is the most common income bracket and makes up 100.0% of all families.
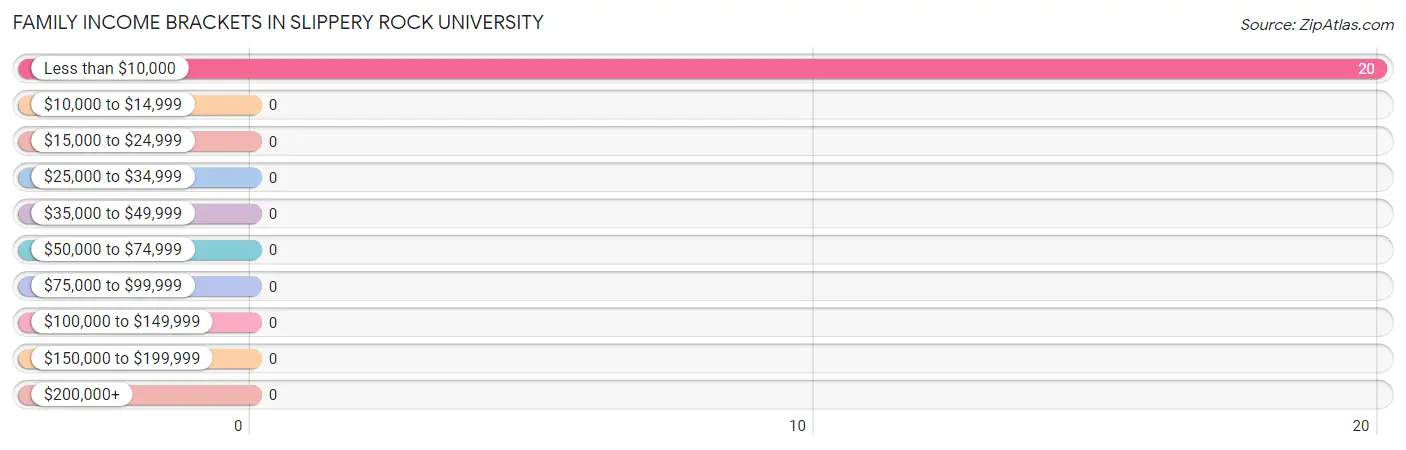
| Income Bracket | # Families | % Families |
| Less than $10,000 | 20 | 100.0% |
| $10,000 to $14,999 | 0 | 0.0% |
| $15,000 to $24,999 | 0 | 0.0% |
| $25,000 to $34,999 | 0 | 0.0% |
| $35,000 to $49,999 | 0 | 0.0% |
| $50,000 to $74,999 | 0 | 0.0% |
| $75,000 to $99,999 | 0 | 0.0% |
| $100,000 to $149,999 | 0 | 0.0% |
| $150,000 to $199,999 | 0 | 0.0% |
| $200,000+ | 0 | 0.0% |
Family Income by Famaliy Size in Slippery Rock University
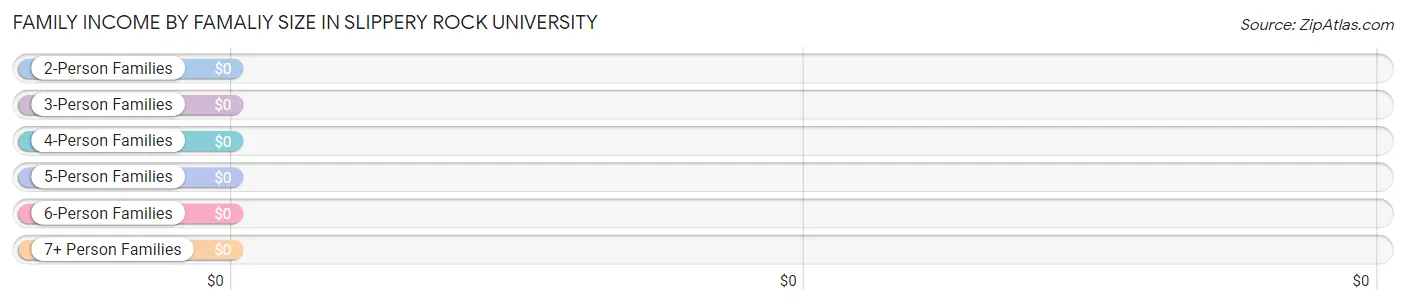
| Income Bracket | # Families | Median Income |
| 2-Person Families | 0 (0.0%) | $0 |
| 3-Person Families | 20 (100.0%) | $0 |
| 4-Person Families | 0 (0.0%) | $0 |
| 5-Person Families | 0 (0.0%) | $0 |
| 6-Person Families | 0 (0.0%) | $0 |
| 7+ Person Families | 0 (0.0%) | $0 |
| Total | 20 (100.0%) | $0 |
Family Income by Number of Earners in Slippery Rock University
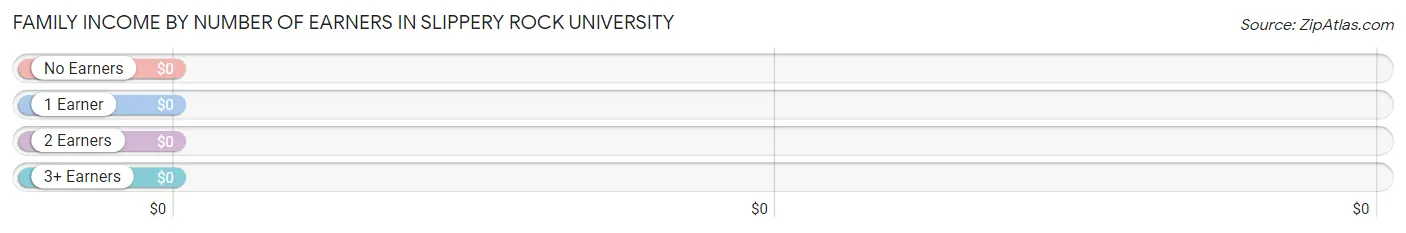
| Number of Earners | # Families | Median Income |
| No Earners | 0 (0.0%) | $0 |
| 1 Earner | 20 (100.0%) | $0 |
| 2 Earners | 0 (0.0%) | $0 |
| 3+ Earners | 0 (0.0%) | $0 |
| Total | 20 (100.0%) | $0 |
Household Income in Slippery Rock University
Household Income Brackets in Slippery Rock University
With 20 households falling in the category, the less than $10,000 income range is the most frequent in Slippery Rock University, accounting for 71.4% of all households.
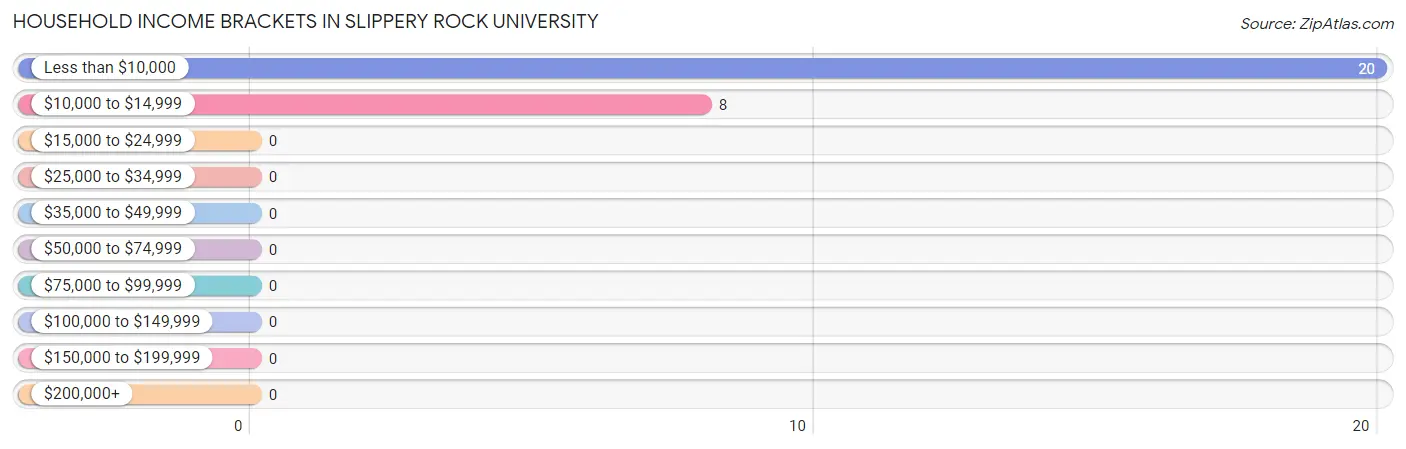
| Income Bracket | # Households | % Households |
| Less than $10,000 | 20 | 71.4% |
| $10,000 to $14,999 | 8 | 28.6% |
| $15,000 to $24,999 | 0 | 0.0% |
| $25,000 to $34,999 | 0 | 0.0% |
| $35,000 to $49,999 | 0 | 0.0% |
| $50,000 to $74,999 | 0 | 0.0% |
| $75,000 to $99,999 | 0 | 0.0% |
| $100,000 to $149,999 | 0 | 0.0% |
| $150,000 to $199,999 | 0 | 0.0% |
| $200,000+ | 0 | 0.0% |
Household Income by Householder Age in Slippery Rock University
| Income Bracket | # Households | Median Income |
| 15 to 24 Years | 0 (0.0%) | $0 |
| 25 to 44 Years | 0 (0.0%) | $0 |
| 45 to 64 Years | 28 (100.0%) | $0 |
| 65+ Years | 0 (0.0%) | $0 |
| Total | 28 (100.0%) | $0 |
Poverty in Slippery Rock University
Income Below Poverty by Sex and Age in Slippery Rock University
With 100.0% poverty level for males and 100.0% for females among the residents of Slippery Rock University, 18 to 24 year old males and 16 and 17 year old females are the most vulnerable to poverty, with 22 males (100.0%) and 17 females (100.0%) in their respective age groups living below the poverty level.
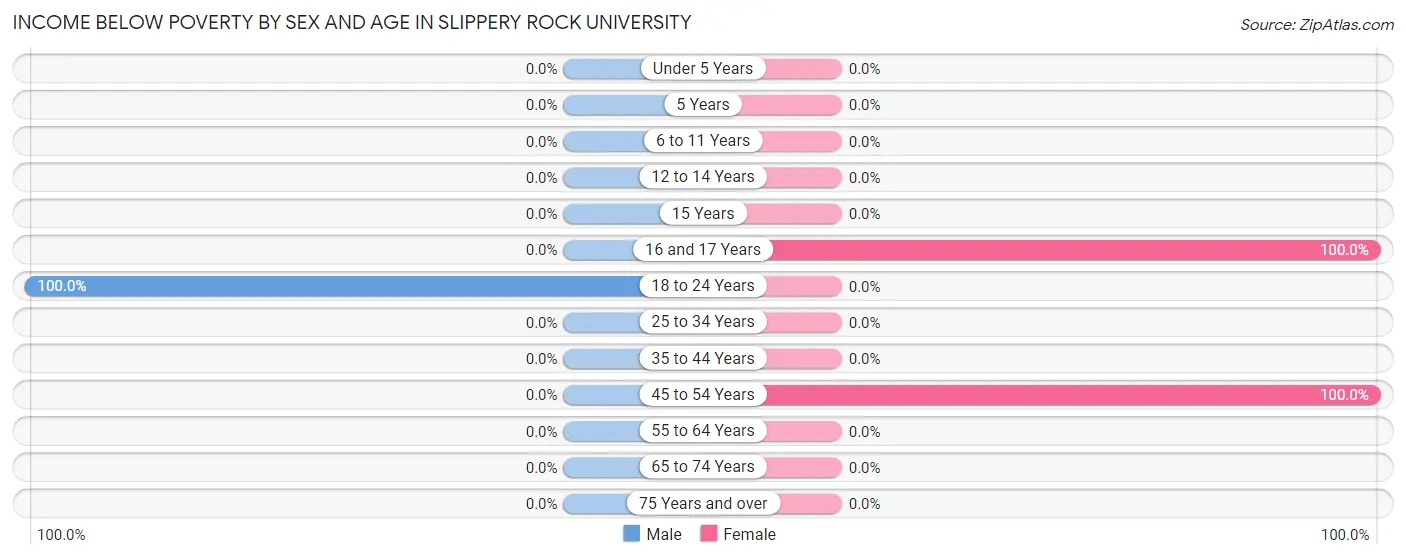
| Age Bracket | Male | Female |
| Under 5 Years | 0 (0.0%) | 0 (0.0%) |
| 5 Years | 0 (0.0%) | 0 (0.0%) |
| 6 to 11 Years | 0 (0.0%) | 0 (0.0%) |
| 12 to 14 Years | 0 (0.0%) | 0 (0.0%) |
| 15 Years | 0 (0.0%) | 0 (0.0%) |
| 16 and 17 Years | 0 (0.0%) | 17 (100.0%) |
| 18 to 24 Years | 22 (100.0%) | 0 (0.0%) |
| 25 to 34 Years | 0 (0.0%) | 0 (0.0%) |
| 35 to 44 Years | 0 (0.0%) | 0 (0.0%) |
| 45 to 54 Years | 0 (0.0%) | 28 (100.0%) |
| 55 to 64 Years | 0 (0.0%) | 0 (0.0%) |
| 65 to 74 Years | 0 (0.0%) | 0 (0.0%) |
| 75 Years and over | 0 (0.0%) | 0 (0.0%) |
| Total | 22 (100.0%) | 45 (100.0%) |
Income Above Poverty by Sex and Age in Slippery Rock University
| Age Bracket | Male | Female |
| Under 5 Years | 0 (0.0%) | 0 (0.0%) |
| 5 Years | 0 (0.0%) | 0 (0.0%) |
| 6 to 11 Years | 0 (0.0%) | 0 (0.0%) |
| 12 to 14 Years | 0 (0.0%) | 0 (0.0%) |
| 15 Years | 0 (0.0%) | 0 (0.0%) |
| 16 and 17 Years | 0 (0.0%) | 0 (0.0%) |
| 18 to 24 Years | 0 (0.0%) | 0 (0.0%) |
| 25 to 34 Years | 0 (0.0%) | 0 (0.0%) |
| 35 to 44 Years | 0 (0.0%) | 0 (0.0%) |
| 45 to 54 Years | 0 (0.0%) | 0 (0.0%) |
| 55 to 64 Years | 0 (0.0%) | 0 (0.0%) |
| 65 to 74 Years | 0 (0.0%) | 0 (0.0%) |
| 75 Years and over | 0 (0.0%) | 0 (0.0%) |
| Total | 0 (0.0%) | 0 (0.0%) |
Income Below Poverty Among Married-Couple Families in Slippery Rock University
| Children | Above Poverty | Below Poverty |
| No Children | 0 (0.0%) | 0 (0.0%) |
| 1 or 2 Children | 0 (0.0%) | 0 (0.0%) |
| 3 or 4 Children | 0 (0.0%) | 0 (0.0%) |
| 5 or more Children | 0 (0.0%) | 0 (0.0%) |
| Total | 0 (0.0%) | 0 (0.0%) |
Income Below Poverty Among Single-Parent Households in Slippery Rock University
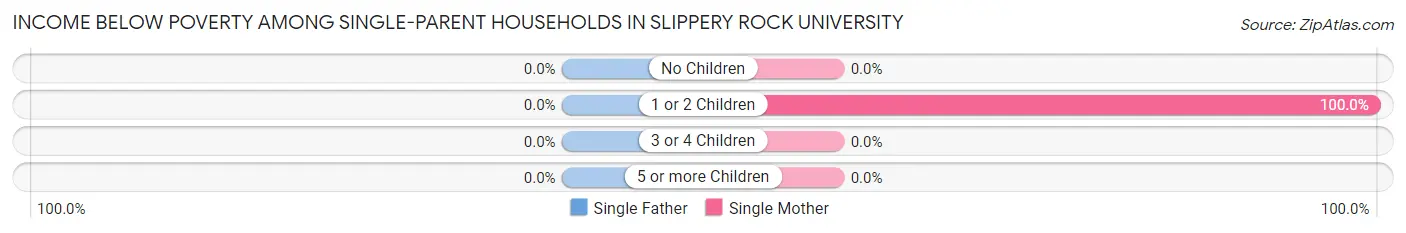
| Children | Single Father | Single Mother |
| No Children | 0 (0.0%) | 0 (0.0%) |
| 1 or 2 Children | 0 (0.0%) | 20 (100.0%) |
| 3 or 4 Children | 0 (0.0%) | 0 (0.0%) |
| 5 or more Children | 0 (0.0%) | 0 (0.0%) |
| Total | 0 (0.0%) | 20 (100.0%) |
Income Below Poverty Among Married-Couple vs Single-Parent Households in Slippery Rock University
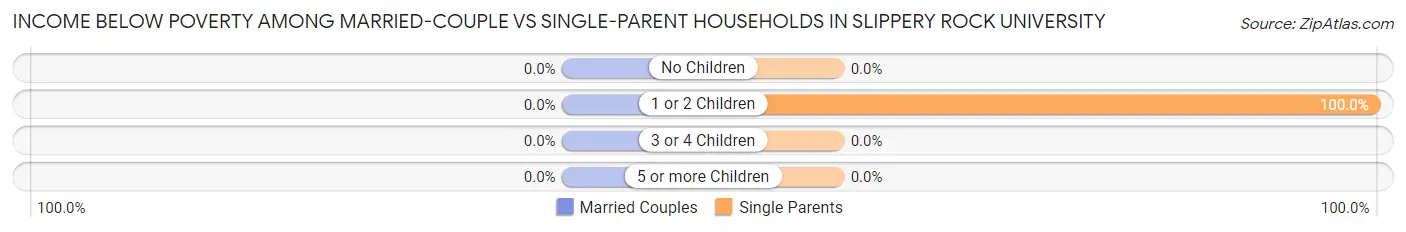
| Children | Married-Couple Families | Single-Parent Households |
| No Children | 0 (0.0%) | 0 (0.0%) |
| 1 or 2 Children | 0 (0.0%) | 20 (100.0%) |
| 3 or 4 Children | 0 (0.0%) | 0 (0.0%) |
| 5 or more Children | 0 (0.0%) | 0 (0.0%) |
| Total | 0 (0.0%) | 20 (100.0%) |
Race in Slippery Rock University
The most populous races in Slippery Rock University are White / Caucasian (2,481 | 92.5%), Two or more Races (154 | 5.7%), and Hispanic or Latino (62 | 2.3%).
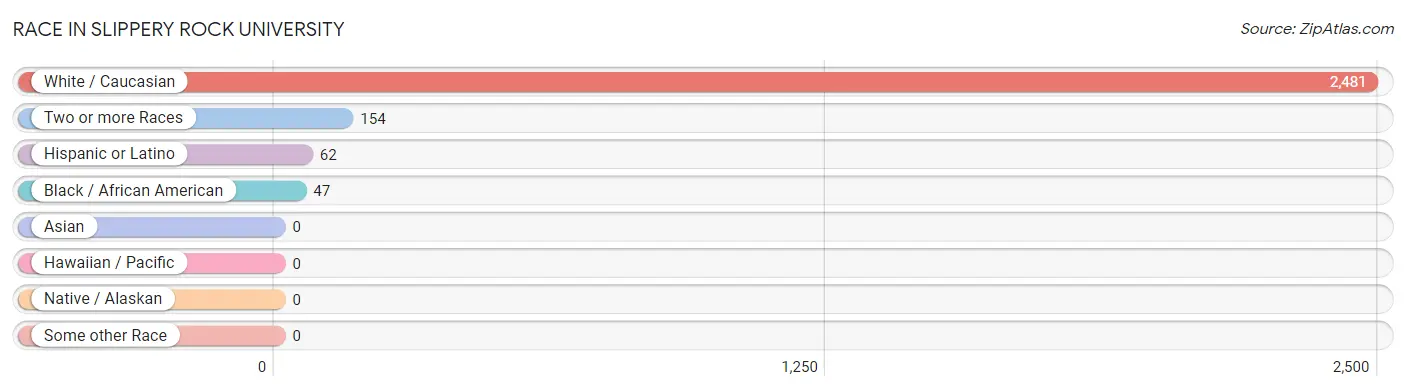
| Race | # Population | % Population |
| Asian | 0 | 0.0% |
| Black / African American | 47 | 1.8% |
| Hawaiian / Pacific | 0 | 0.0% |
| Hispanic or Latino | 62 | 2.3% |
| Native / Alaskan | 0 | 0.0% |
| White / Caucasian | 2,481 | 92.5% |
| Two or more Races | 154 | 5.7% |
| Some other Race | 0 | 0.0% |
| Total | 2,682 | 100.0% |
Ancestry in Slippery Rock University
The most populous ancestries reported in Slippery Rock University are German (605 | 22.6%), Italian (466 | 17.4%), Irish (461 | 17.2%), Polish (183 | 6.8%), and English (126 | 4.7%), together accounting for 68.6% of all Slippery Rock University residents.
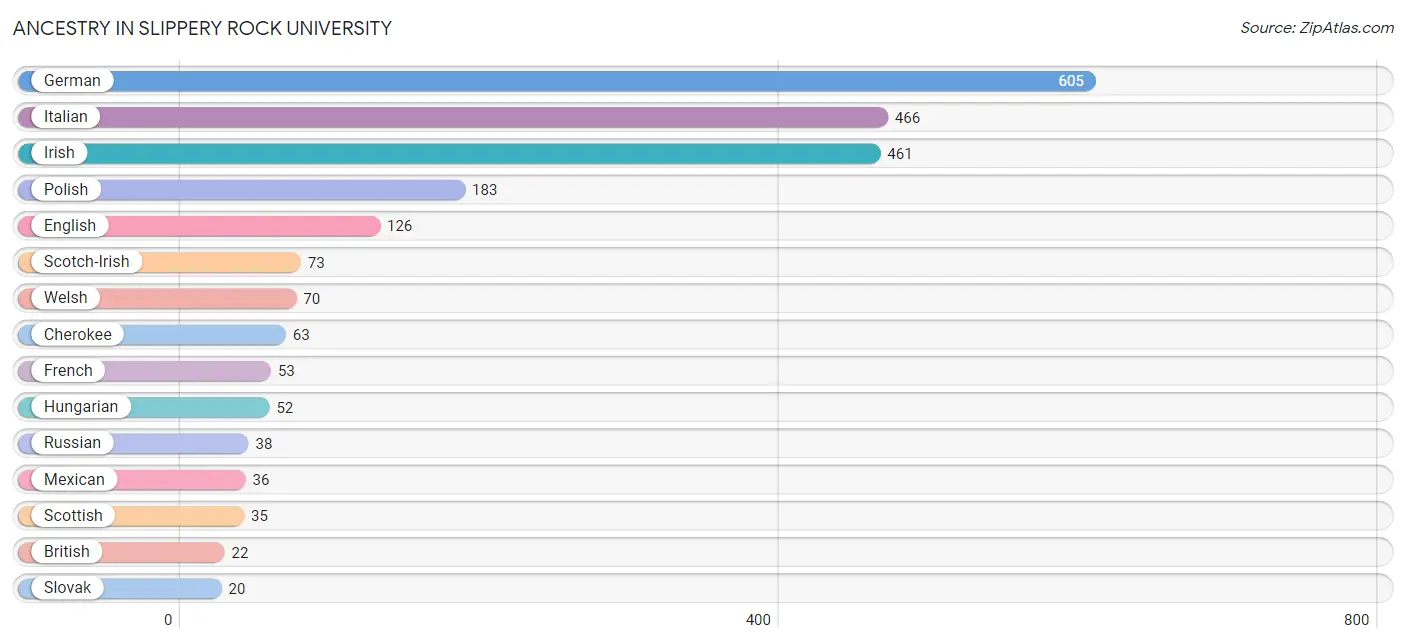
| Ancestry | # Population | % Population |
| Arab | 9 | 0.3% |
| British | 22 | 0.8% |
| Central American | 6 | 0.2% |
| Cherokee | 63 | 2.4% |
| Colombian | 4 | 0.2% |
| Czech | 10 | 0.4% |
| Dutch | 15 | 0.6% |
| English | 126 | 4.7% |
| European | 10 | 0.4% |
| French | 53 | 2.0% |
| German | 605 | 22.6% |
| Greek | 10 | 0.4% |
| Guamanian / Chamorro | 10 | 0.4% |
| Guatemalan | 6 | 0.2% |
| Haitian | 13 | 0.5% |
| Hungarian | 52 | 1.9% |
| Irish | 461 | 17.2% |
| Italian | 466 | 17.4% |
| Jamaican | 7 | 0.3% |
| Korean | 18 | 0.7% |
| Lebanese | 9 | 0.3% |
| Lithuanian | 11 | 0.4% |
| Maltese | 4 | 0.2% |
| Mexican | 36 | 1.3% |
| Polish | 183 | 6.8% |
| Puerto Rican | 10 | 0.4% |
| Russian | 38 | 1.4% |
| Scotch-Irish | 73 | 2.7% |
| Scottish | 35 | 1.3% |
| Slovak | 20 | 0.7% |
| Slovene | 16 | 0.6% |
| South American | 4 | 0.2% |
| Swedish | 12 | 0.4% |
| Ukrainian | 18 | 0.7% |
| Welsh | 70 | 2.6% | View All 35 Rows |
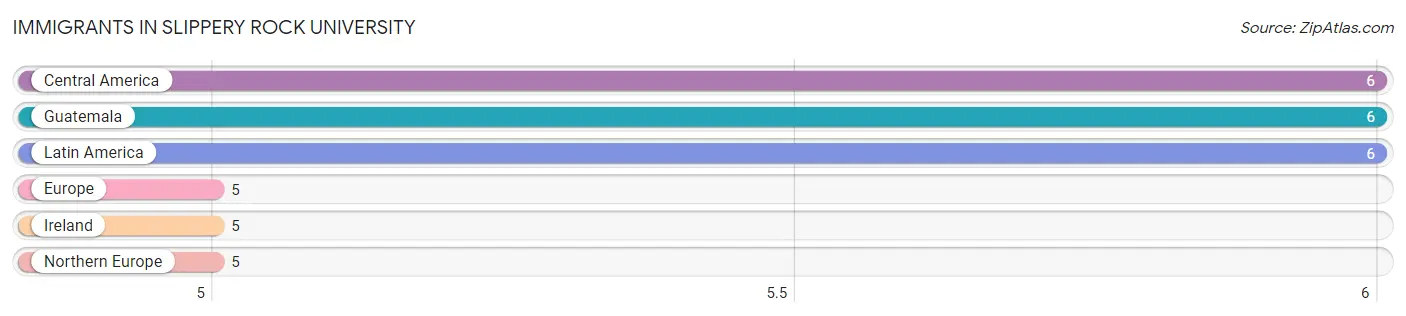
Immigrants in Slippery Rock University
The most numerous immigrant groups reported in Slippery Rock University came from Central America (6 | 0.2%), Guatemala (6 | 0.2%), Latin America (6 | 0.2%), Europe (5 | 0.2%), and Ireland (5 | 0.2%), together accounting for 1.0% of all Slippery Rock University residents.
| Immigration Origin | # Population | % Population |
| Central America | 6 | 0.2% |
| Europe | 5 | 0.2% |
| Guatemala | 6 | 0.2% |
| Ireland | 5 | 0.2% |
| Latin America | 6 | 0.2% |
| Northern Europe | 5 | 0.2% | View All 6 Rows |
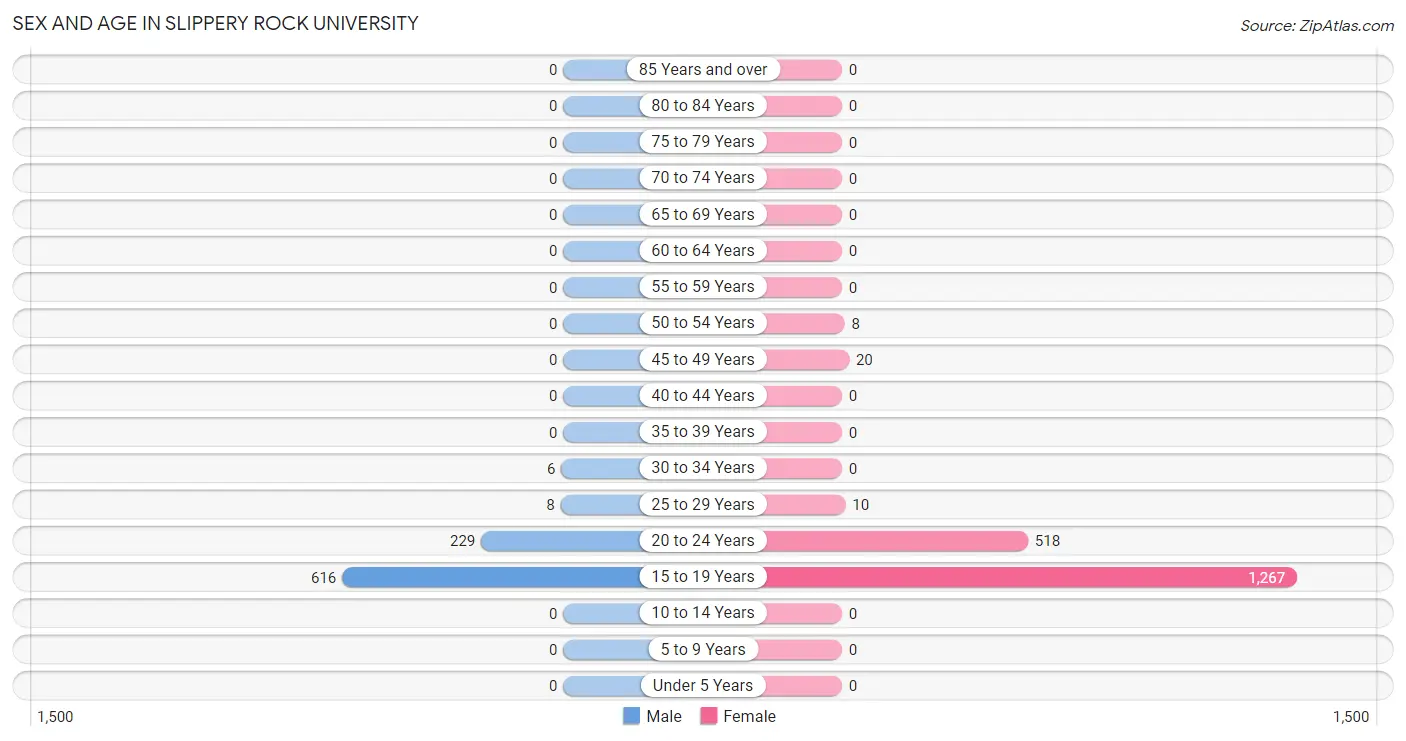
Sex and Age in Slippery Rock University
Sex and Age in Slippery Rock University
The most populous age groups in Slippery Rock University are 15 to 19 Years (616 | 71.7%) for men and 15 to 19 Years (1,267 | 69.5%) for women.
| Age Bracket | Male | Female |
| Under 5 Years | 0 (0.0%) | 0 (0.0%) |
| 5 to 9 Years | 0 (0.0%) | 0 (0.0%) |
| 10 to 14 Years | 0 (0.0%) | 0 (0.0%) |
| 15 to 19 Years | 616 (71.7%) | 1,267 (69.5%) |
| 20 to 24 Years | 229 (26.7%) | 518 (28.4%) |
| 25 to 29 Years | 8 (0.9%) | 10 (0.5%) |
| 30 to 34 Years | 6 (0.7%) | 0 (0.0%) |
| 35 to 39 Years | 0 (0.0%) | 0 (0.0%) |
| 40 to 44 Years | 0 (0.0%) | 0 (0.0%) |
| 45 to 49 Years | 0 (0.0%) | 20 (1.1%) |
| 50 to 54 Years | 0 (0.0%) | 8 (0.4%) |
| 55 to 59 Years | 0 (0.0%) | 0 (0.0%) |
| 60 to 64 Years | 0 (0.0%) | 0 (0.0%) |
| 65 to 69 Years | 0 (0.0%) | 0 (0.0%) |
| 70 to 74 Years | 0 (0.0%) | 0 (0.0%) |
| 75 to 79 Years | 0 (0.0%) | 0 (0.0%) |
| 80 to 84 Years | 0 (0.0%) | 0 (0.0%) |
| 85 Years and over | 0 (0.0%) | 0 (0.0%) |
| Total | 859 (100.0%) | 1,823 (100.0%) |
Families and Households in Slippery Rock University
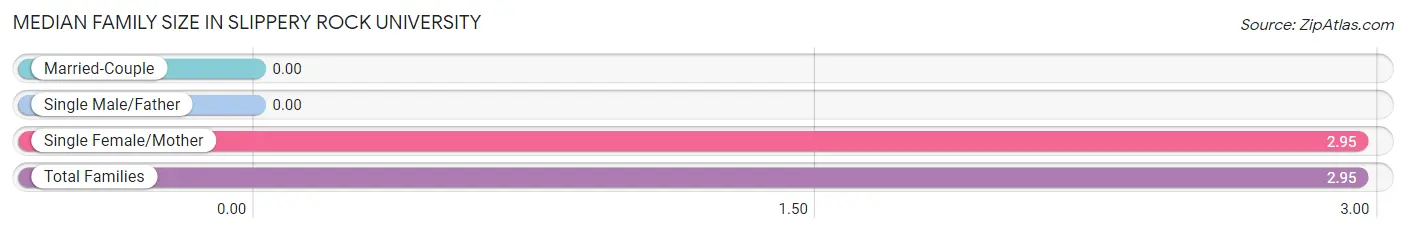
Median Family Size in Slippery Rock University
| Family Type | # Families | Family Size |
| Married-Couple | 0 (0.0%) | - |
| Single Male/Father | 0 (0.0%) | - |
| Single Female/Mother | 20 (100.0%) | 2.95 |
| Total Families | 20 (100.0%) | 2.95 |
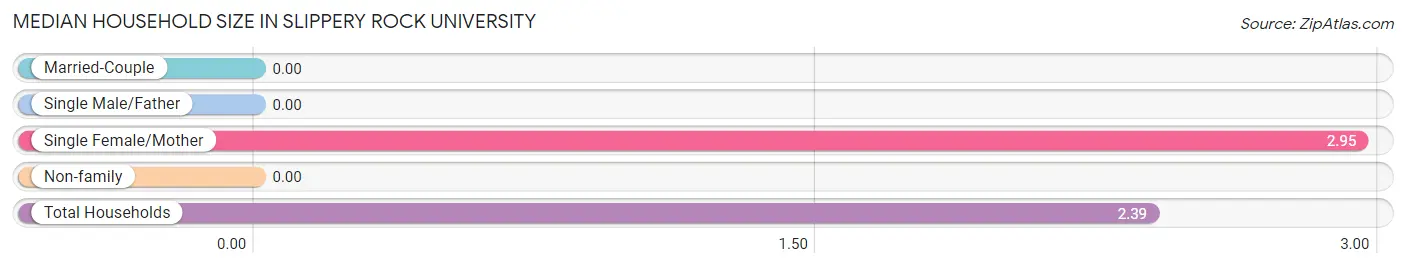
Median Household Size in Slippery Rock University
| Household Type | # Households | Household Size |
| Married-Couple | 0 (0.0%) | - |
| Single Male/Father | 0 (0.0%) | - |
| Single Female/Mother | 20 (71.4%) | 2.95 |
| Non-family | 8 (28.6%) | - |
| Total Households | 28 (100.0%) | 2.39 |
Household Size by Marriage Status in Slippery Rock University
Out of a total of 28 households in Slippery Rock University, 20 (71.4%) are family households, while 8 (28.6%) are nonfamily households. The most numerous type of family households are 3-person households, comprising 20, and the most common type of nonfamily households are 1-person households, comprising 8.
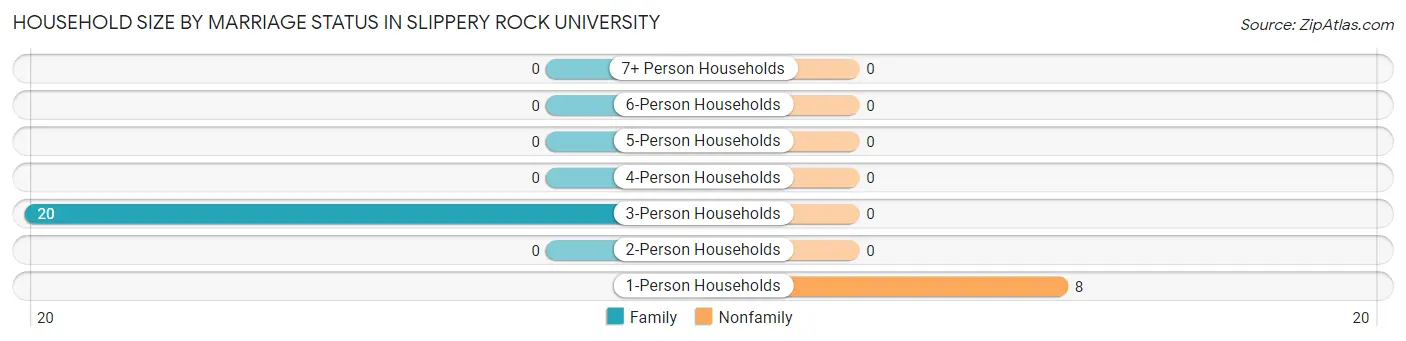
| Household Size | Family Households | Nonfamily Households |
| 1-Person Households | - | 8 (28.6%) |
| 2-Person Households | 0 (0.0%) | 0 (0.0%) |
| 3-Person Households | 20 (71.4%) | 0 (0.0%) |
| 4-Person Households | 0 (0.0%) | 0 (0.0%) |
| 5-Person Households | 0 (0.0%) | 0 (0.0%) |
| 6-Person Households | 0 (0.0%) | 0 (0.0%) |
| 7+ Person Households | 0 (0.0%) | 0 (0.0%) |
| Total | 20 (71.4%) | 8 (28.6%) |
Female Fertility in Slippery Rock University
Fertility by Age in Slippery Rock University
| Age Bracket | Women with Births | Births / 1,000 Women |
| 15 to 19 years | 0 (0.0%) | 0.0 |
| 20 to 34 years | 0 (0.0%) | 0.0 |
| 35 to 50 years | 0 (0.0%) | 0.0 |
| Total | 0 (0.0%) | 0.0 |
Fertility by Age by Marriage Status in Slippery Rock University
| Age Bracket | Married | Unmarried |
| 15 to 19 years | 0 (0.0%) | 0 (0.0%) |
| 20 to 34 years | 0 (0.0%) | 0 (0.0%) |
| 35 to 50 years | 0 (0.0%) | 0 (0.0%) |
| Total | 0 (0.0%) | 0 (0.0%) |
Fertility by Education in Slippery Rock University
| Educational Attainment | Women with Births | Births / 1,000 Women |
| Less than High School | 0 (0.0%) | 0.0 |
| High School Diploma | 0 (0.0%) | 0.0 |
| College or Associate's Degree | 0 (0.0%) | 0.0 |
| Bachelor's Degree | 0 (0.0%) | 0.0 |
| Graduate Degree | 0 (0.0%) | 0.0 |
| Total | 0 (0.0%) | 0.0 |
Fertility by Education by Marriage Status in Slippery Rock University
| Educational Attainment | Married | Unmarried |
| Less than High School | 0 (0.0%) | 0 (0.0%) |
| High School Diploma | 0 (0.0%) | 0 (0.0%) |
| College or Associate's Degree | 0 (0.0%) | 0 (0.0%) |
| Bachelor's Degree | 0 (0.0%) | 0 (0.0%) |
| Graduate Degree | 0 (0.0%) | 0 (0.0%) |
| Total | 0 (0.0%) | 0 (0.0%) |
Employment Characteristics in Slippery Rock University
Employment by Class of Employer in Slippery Rock University
Among the 954 employed individuals in Slippery Rock University, private company employees (499 | 52.3%), state government employees (266 | 27.9%), and local government employees (91 | 9.5%) make up the most common classes of employment.
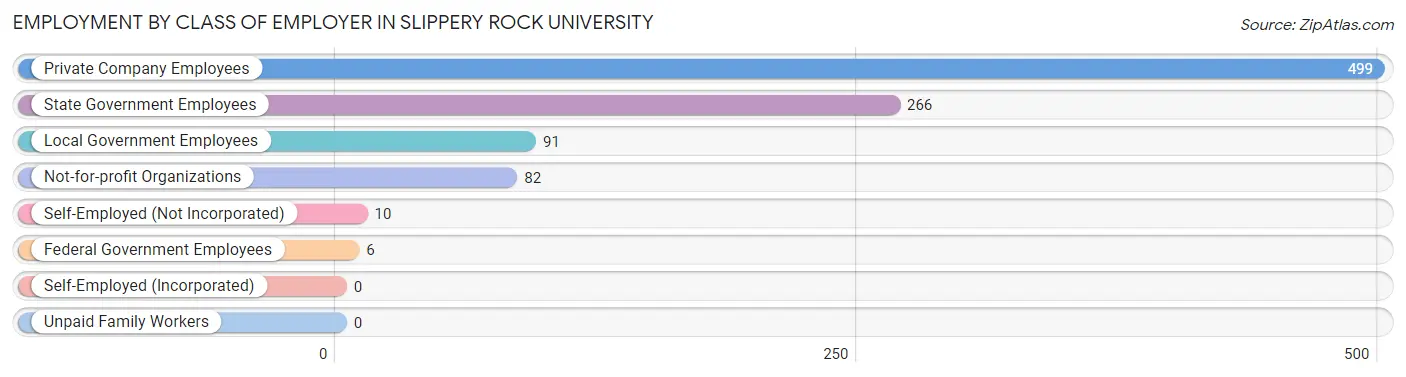
| Employer Class | # Employees | % Employees |
| Private Company Employees | 499 | 52.3% |
| Self-Employed (Incorporated) | 0 | 0.0% |
| Self-Employed (Not Incorporated) | 10 | 1.1% |
| Not-for-profit Organizations | 82 | 8.6% |
| Local Government Employees | 91 | 9.5% |
| State Government Employees | 266 | 27.9% |
| Federal Government Employees | 6 | 0.6% |
| Unpaid Family Workers | 0 | 0.0% |
| Total | 954 | 100.0% |
Employment Status by Age in Slippery Rock University
According to the labor force statistics for Slippery Rock University, out of the total population over 16 years of age (2,682), 46.3% or 1,242 individuals are in the labor force, with 10.8% or 134 of them unemployed. The age group with the highest labor force participation rate is 25 to 29 years, with 77.8% or 14 individuals in the labor force. Within the labor force, the 16 to 19 years age range has the highest percentage of unemployed individuals, with 11.6% or 93 of them being unemployed.
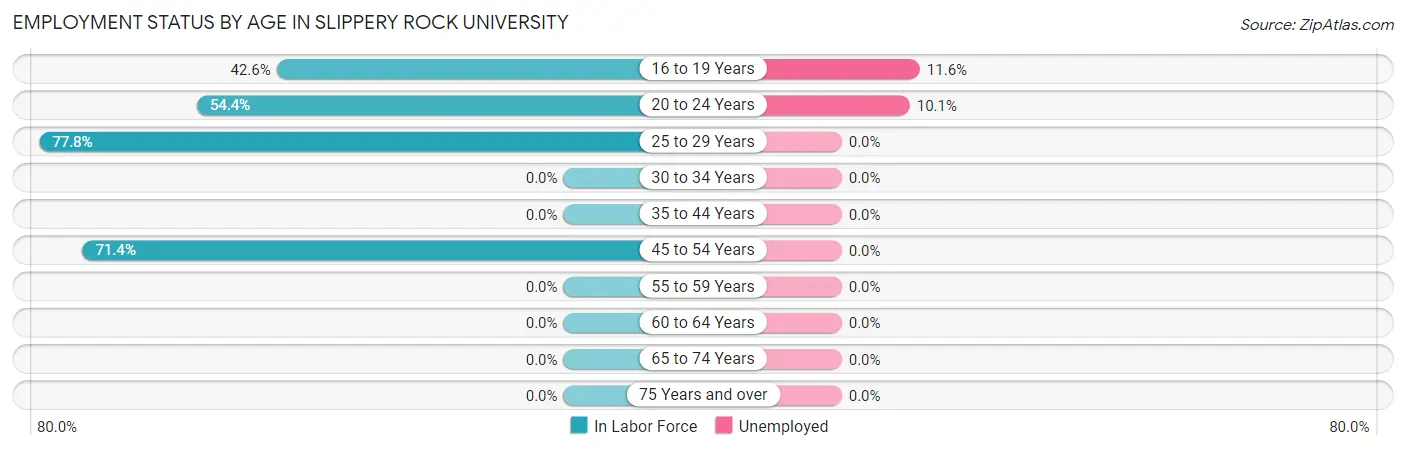
| Age Bracket | In Labor Force | Unemployed |
| 16 to 19 Years | 802 (42.6%) | 93 (11.6%) |
| 20 to 24 Years | 406 (54.4%) | 41 (10.1%) |
| 25 to 29 Years | 14 (77.8%) | 0 (0.0%) |
| 30 to 34 Years | 0 (0.0%) | 0 (0.0%) |
| 35 to 44 Years | 0 (0.0%) | 0 (0.0%) |
| 45 to 54 Years | 20 (71.4%) | 0 (0.0%) |
| 55 to 59 Years | 0 (0.0%) | 0 (0.0%) |
| 60 to 64 Years | 0 (0.0%) | 0 (0.0%) |
| 65 to 74 Years | 0 (0.0%) | 0 (0.0%) |
| 75 Years and over | 0 (0.0%) | 0 (0.0%) |
| Total | 1,242 (46.3%) | 134 (10.8%) |
Employment Status by Educational Attainment in Slippery Rock University
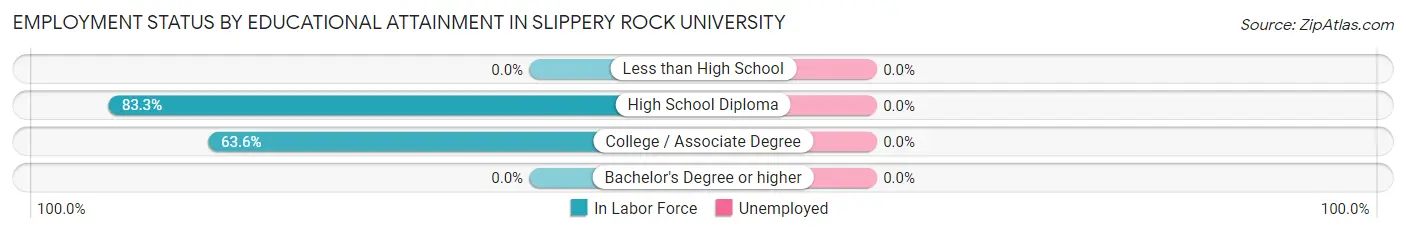
| Educational Attainment | In Labor Force | Unemployed |
| Less than High School | 0 (0.0%) | 0 (0.0%) |
| High School Diploma | 20 (83.3%) | 0 (0.0%) |
| College / Associate Degree | 14 (63.6%) | 0 (0.0%) |
| Bachelor's Degree or higher | 0 (0.0%) | 0 (0.0%) |
| Total | 34 (65.4%) | 0 (0.0%) |
Employment Occupations by Sex in Slippery Rock University
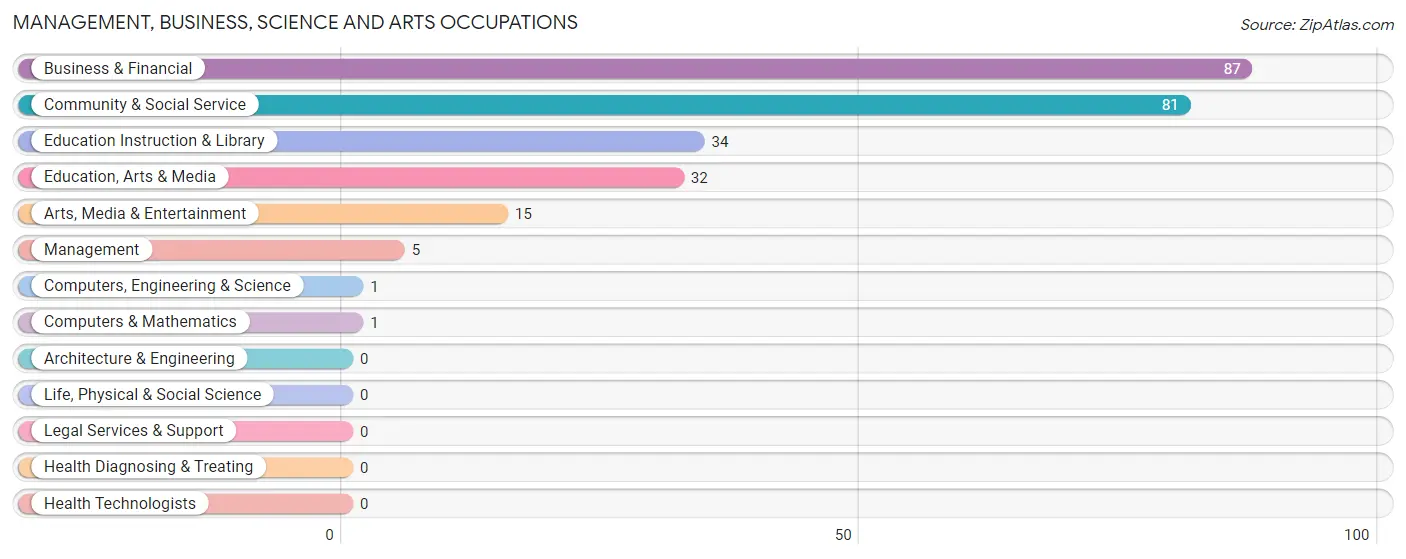
Management, Business, Science and Arts Occupations
The most common Management, Business, Science and Arts occupations in Slippery Rock University are Business & Financial (87 | 7.9%), Community & Social Service (81 | 7.3%), Education Instruction & Library (34 | 3.1%), Education, Arts & Media (32 | 2.9%), and Arts, Media & Entertainment (15 | 1.3%).
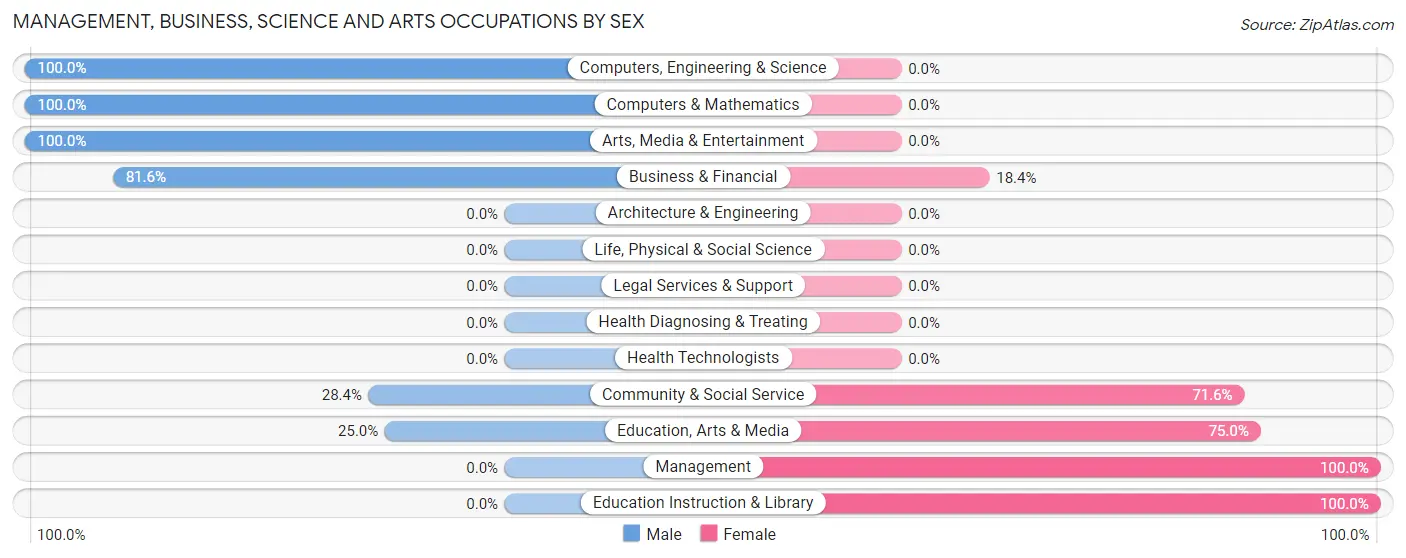
Management, Business, Science and Arts Occupations by Sex
Within the Management, Business, Science and Arts occupations in Slippery Rock University, the most male-oriented occupations are Computers, Engineering & Science (100.0%), Computers & Mathematics (100.0%), and Arts, Media & Entertainment (100.0%), while the most female-oriented occupations are Management (100.0%), Education Instruction & Library (100.0%), and Education, Arts & Media (75.0%).
| Occupation | Male | Female |
| Management | 0 (0.0%) | 5 (100.0%) |
| Business & Financial | 71 (81.6%) | 16 (18.4%) |
| Computers, Engineering & Science | 1 (100.0%) | 0 (0.0%) |
| Computers & Mathematics | 1 (100.0%) | 0 (0.0%) |
| Architecture & Engineering | 0 (0.0%) | 0 (0.0%) |
| Life, Physical & Social Science | 0 (0.0%) | 0 (0.0%) |
| Community & Social Service | 23 (28.4%) | 58 (71.6%) |
| Education, Arts & Media | 8 (25.0%) | 24 (75.0%) |
| Legal Services & Support | 0 (0.0%) | 0 (0.0%) |
| Education Instruction & Library | 0 (0.0%) | 34 (100.0%) |
| Arts, Media & Entertainment | 15 (100.0%) | 0 (0.0%) |
| Health Diagnosing & Treating | 0 (0.0%) | 0 (0.0%) |
| Health Technologists | 0 (0.0%) | 0 (0.0%) |
| Total (Category) | 95 (54.6%) | 79 (45.4%) |
| Total (Overall) | 325 (29.3%) | 783 (70.7%) |
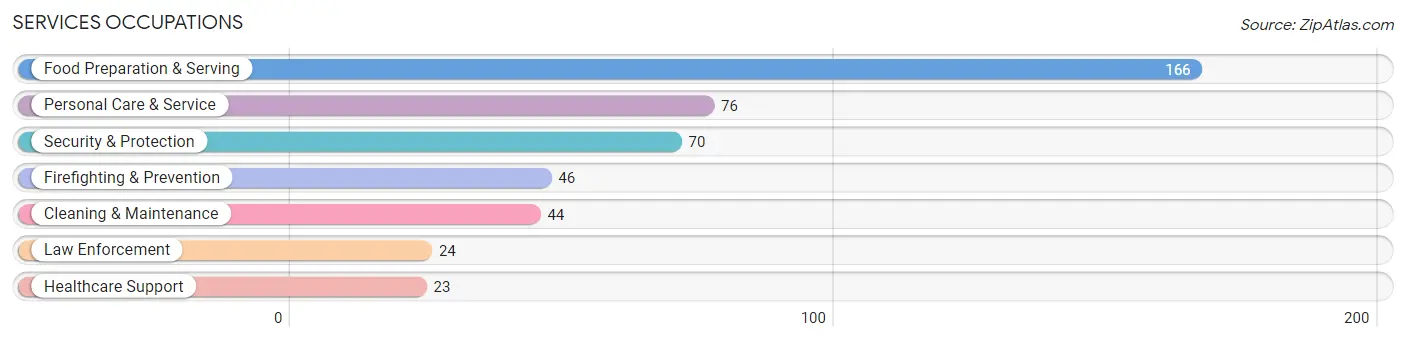
Services Occupations
The most common Services occupations in Slippery Rock University are Food Preparation & Serving (166 | 15.0%), Personal Care & Service (76 | 6.9%), Security & Protection (70 | 6.3%), Firefighting & Prevention (46 | 4.2%), and Cleaning & Maintenance (44 | 4.0%).
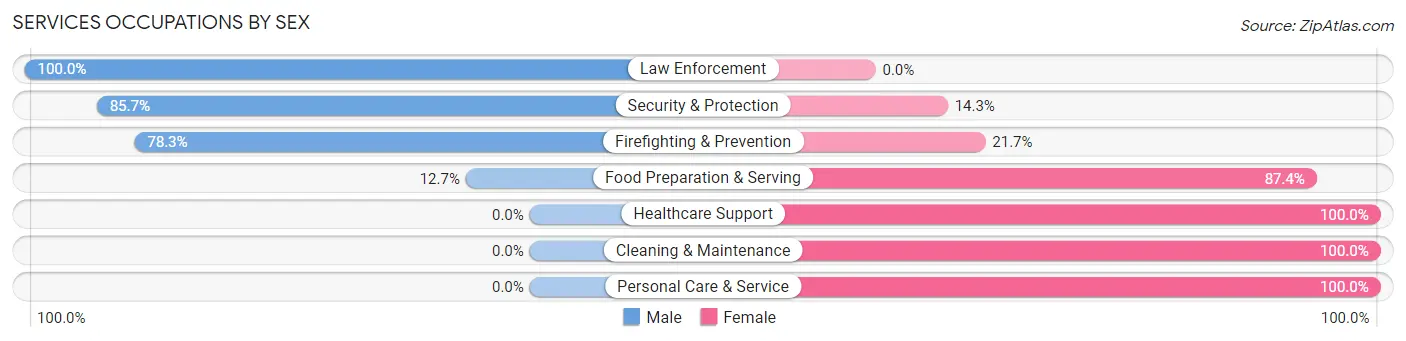
Services Occupations by Sex
Within the Services occupations in Slippery Rock University, the most male-oriented occupations are Law Enforcement (100.0%), Security & Protection (85.7%), and Firefighting & Prevention (78.3%), while the most female-oriented occupations are Healthcare Support (100.0%), Cleaning & Maintenance (100.0%), and Personal Care & Service (100.0%).
| Occupation | Male | Female |
| Healthcare Support | 0 (0.0%) | 23 (100.0%) |
| Security & Protection | 60 (85.7%) | 10 (14.3%) |
| Firefighting & Prevention | 36 (78.3%) | 10 (21.7%) |
| Law Enforcement | 24 (100.0%) | 0 (0.0%) |
| Food Preparation & Serving | 21 (12.7%) | 145 (87.4%) |
| Cleaning & Maintenance | 0 (0.0%) | 44 (100.0%) |
| Personal Care & Service | 0 (0.0%) | 76 (100.0%) |
| Total (Category) | 81 (21.4%) | 298 (78.6%) |
| Total (Overall) | 325 (29.3%) | 783 (70.7%) |
Sales and Office Occupations
The most common Sales and Office occupations in Slippery Rock University are Sales & Related (350 | 31.6%), and Office & Administration (115 | 10.4%).

Sales and Office Occupations by Sex

| Occupation | Male | Female |
| Sales & Related | 65 (18.6%) | 285 (81.4%) |
| Office & Administration | 13 (11.3%) | 102 (88.7%) |
| Total (Category) | 78 (16.8%) | 387 (83.2%) |
| Total (Overall) | 325 (29.3%) | 783 (70.7%) |
Natural Resources, Construction and Maintenance Occupations
The most common Natural Resources, Construction and Maintenance occupations in Slippery Rock University are Construction & Extraction (43 | 3.9%), and Installation, Maintenance & Repair (16 | 1.4%).

Natural Resources, Construction and Maintenance Occupations by Sex

| Occupation | Male | Female |
| Farming, Fishing & Forestry | 0 (0.0%) | 0 (0.0%) |
| Construction & Extraction | 37 (86.1%) | 6 (14.0%) |
| Installation, Maintenance & Repair | 8 (50.0%) | 8 (50.0%) |
| Total (Category) | 45 (76.3%) | 14 (23.7%) |
| Total (Overall) | 325 (29.3%) | 783 (70.7%) |
Production, Transportation and Moving Occupations
The most common Production, Transportation and Moving occupations in Slippery Rock University are Transportation (16 | 1.4%), and Material Moving (15 | 1.3%).
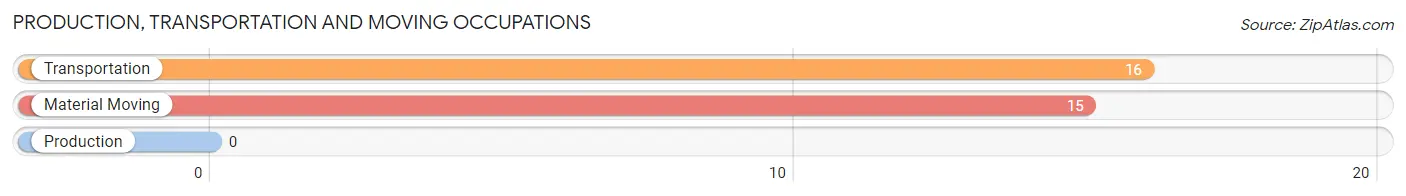
Production, Transportation and Moving Occupations by Sex
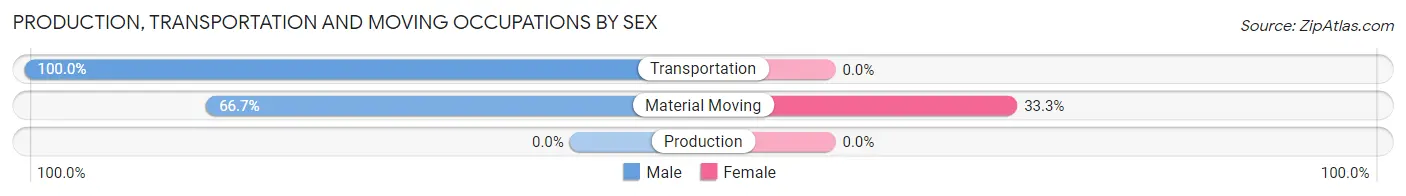
| Occupation | Male | Female |
| Production | 0 (0.0%) | 0 (0.0%) |
| Transportation | 16 (100.0%) | 0 (0.0%) |
| Material Moving | 10 (66.7%) | 5 (33.3%) |
| Total (Category) | 26 (83.9%) | 5 (16.1%) |
| Total (Overall) | 325 (29.3%) | 783 (70.7%) |
Employment Industries by Sex in Slippery Rock University
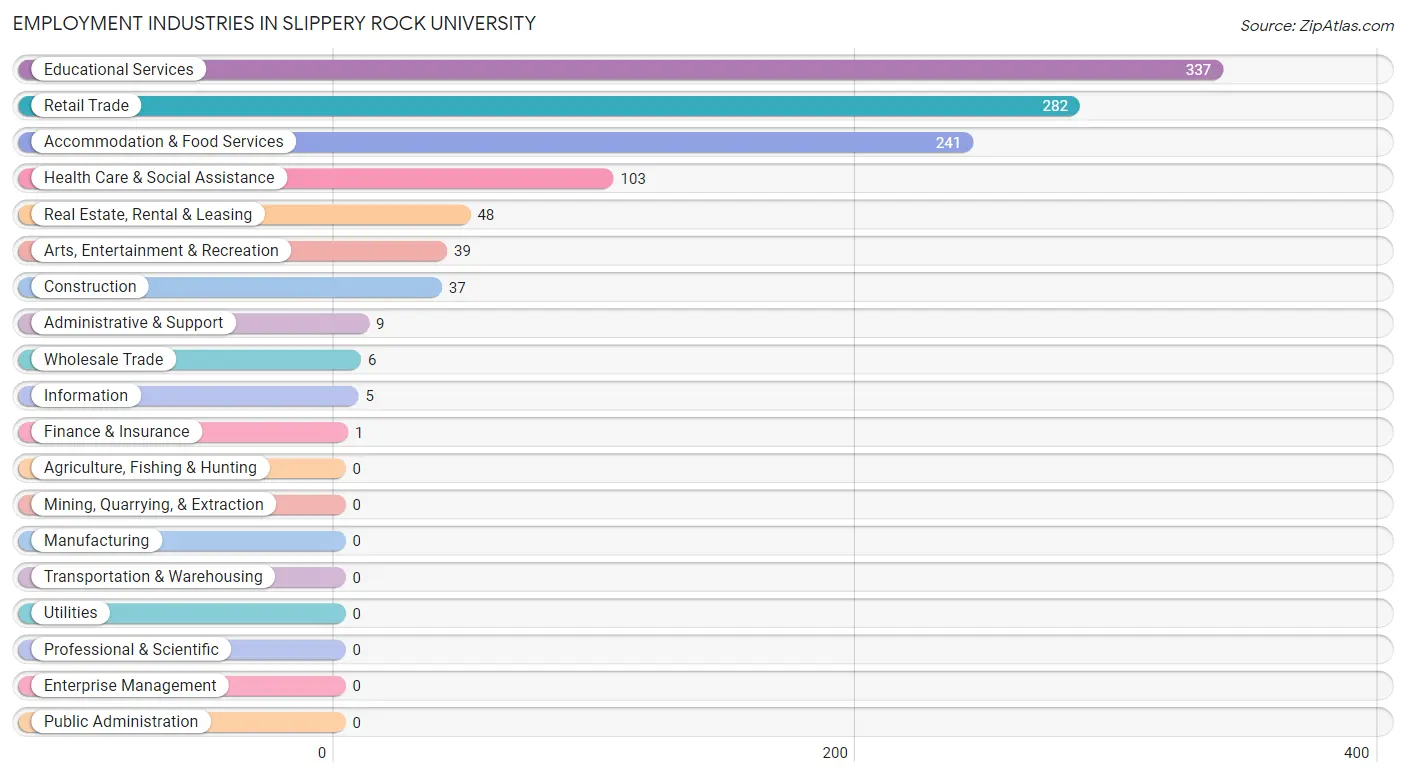
Employment Industries in Slippery Rock University
The major employment industries in Slippery Rock University include Educational Services (337 | 30.4%), Retail Trade (282 | 25.5%), Accommodation & Food Services (241 | 21.7%), Health Care & Social Assistance (103 | 9.3%), and Real Estate, Rental & Leasing (48 | 4.3%).
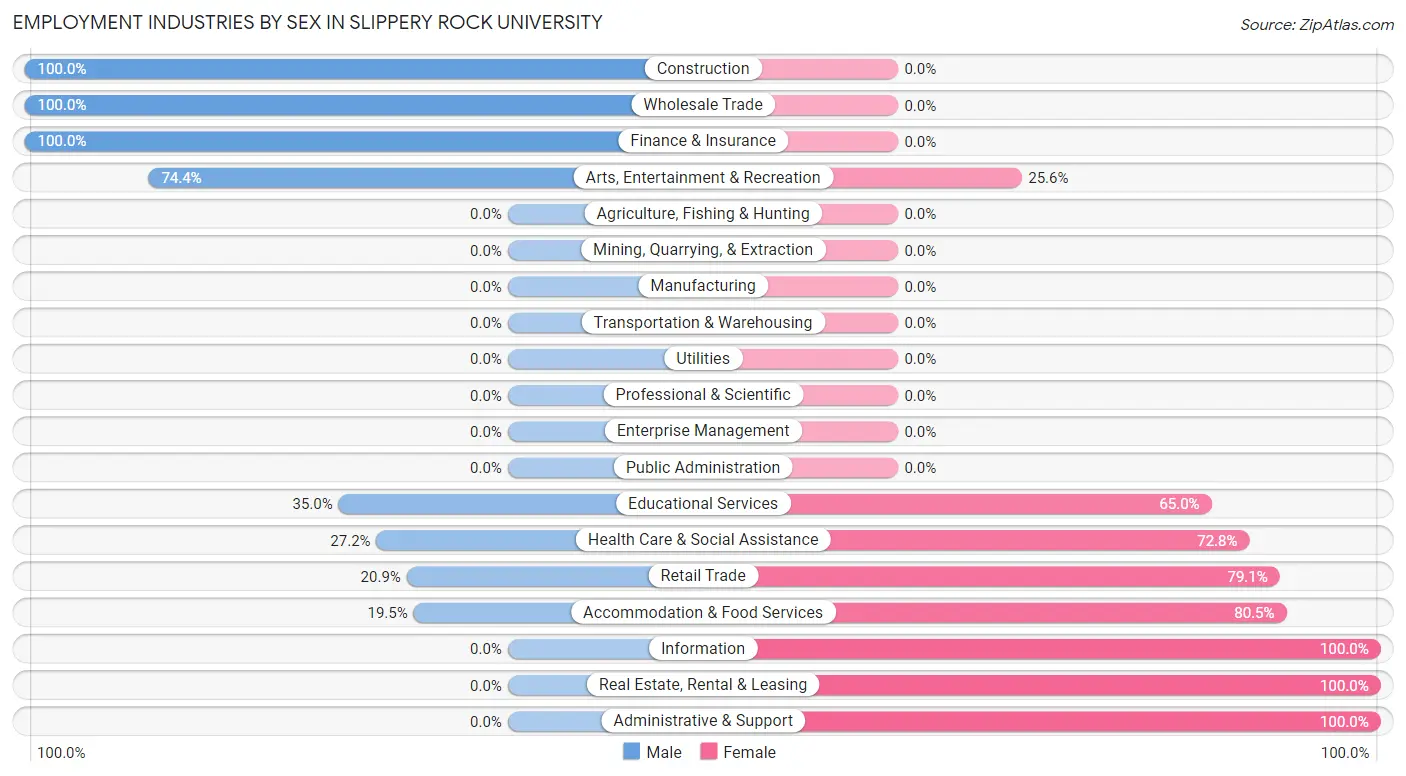
Employment Industries by Sex in Slippery Rock University
The Slippery Rock University industries that see more men than women are Construction (100.0%), Wholesale Trade (100.0%), and Finance & Insurance (100.0%), whereas the industries that tend to have a higher number of women are Information (100.0%), Real Estate, Rental & Leasing (100.0%), and Administrative & Support (100.0%).
| Industry | Male | Female |
| Agriculture, Fishing & Hunting | 0 (0.0%) | 0 (0.0%) |
| Mining, Quarrying, & Extraction | 0 (0.0%) | 0 (0.0%) |
| Construction | 37 (100.0%) | 0 (0.0%) |
| Manufacturing | 0 (0.0%) | 0 (0.0%) |
| Wholesale Trade | 6 (100.0%) | 0 (0.0%) |
| Retail Trade | 59 (20.9%) | 223 (79.1%) |
| Transportation & Warehousing | 0 (0.0%) | 0 (0.0%) |
| Utilities | 0 (0.0%) | 0 (0.0%) |
| Information | 0 (0.0%) | 5 (100.0%) |
| Finance & Insurance | 1 (100.0%) | 0 (0.0%) |
| Real Estate, Rental & Leasing | 0 (0.0%) | 48 (100.0%) |
| Professional & Scientific | 0 (0.0%) | 0 (0.0%) |
| Enterprise Management | 0 (0.0%) | 0 (0.0%) |
| Administrative & Support | 0 (0.0%) | 9 (100.0%) |
| Educational Services | 118 (35.0%) | 219 (65.0%) |
| Health Care & Social Assistance | 28 (27.2%) | 75 (72.8%) |
| Arts, Entertainment & Recreation | 29 (74.4%) | 10 (25.6%) |
| Accommodation & Food Services | 47 (19.5%) | 194 (80.5%) |
| Public Administration | 0 (0.0%) | 0 (0.0%) |
| Total | 325 (29.3%) | 783 (70.7%) |
Education in Slippery Rock University
School Enrollment in Slippery Rock University
The most common levels of schooling among the 2,654 students in Slippery Rock University are college / undergraduate (2,614 | 98.5%), graduate / professional (23 | 0.9%), and high school (17 | 0.6%).
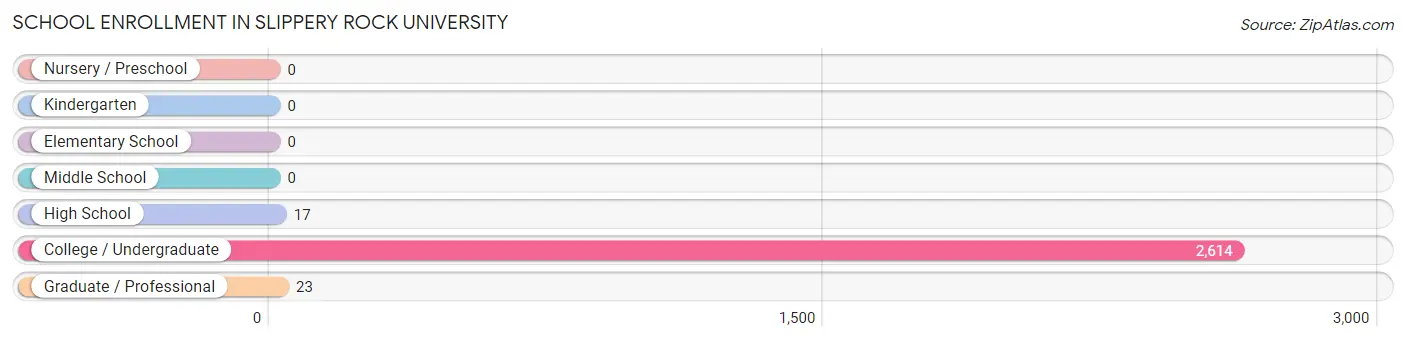
| School Level | # Students | % Students |
| Nursery / Preschool | 0 | 0.0% |
| Kindergarten | 0 | 0.0% |
| Elementary School | 0 | 0.0% |
| Middle School | 0 | 0.0% |
| High School | 17 | 0.6% |
| College / Undergraduate | 2,614 | 98.5% |
| Graduate / Professional | 23 | 0.9% |
| Total | 2,654 | 100.0% |
School Enrollment by Age by Funding Source in Slippery Rock University
Out of a total of 2,654 students who are enrolled in schools in Slippery Rock University, 8 (0.3%) attend a private institution, while the remaining 2,646 (99.7%) are enrolled in public schools. The age group of 18 to 19 year olds has the highest likelihood of being enrolled in private schools, with 7 (0.4% in the age bracket) enrolled. Conversely, the age group of 15 to 17 year olds has the lowest likelihood of being enrolled in a private school, with 31 (100.0% in the age bracket) attending a public institution.
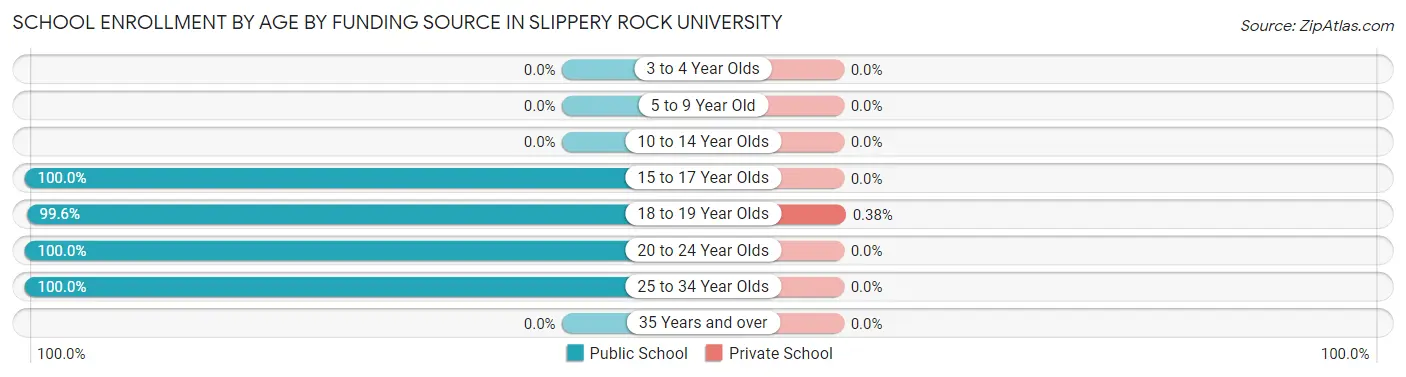
| Age Bracket | Public School | Private School |
| 3 to 4 Year Olds | 0 (0.0%) | 0 (0.0%) |
| 5 to 9 Year Old | 0 (0.0%) | 0 (0.0%) |
| 10 to 14 Year Olds | 0 (0.0%) | 0 (0.0%) |
| 15 to 17 Year Olds | 31 (100.0%) | 0 (0.0%) |
| 18 to 19 Year Olds | 1,845 (99.6%) | 7 (0.4%) |
| 20 to 24 Year Olds | 747 (100.0%) | 0 (0.0%) |
| 25 to 34 Year Olds | 24 (100.0%) | 0 (0.0%) |
| 35 Years and over | 0 (0.0%) | 0 (0.0%) |
| Total | 2,646 (99.7%) | 8 (0.3%) |
Educational Attainment by Field of Study in Slippery Rock University
, and arts & humanities (6 | 100.0%) are the most common fields of study among 6 individuals in Slippery Rock University who have obtained a bachelor's degree or higher.
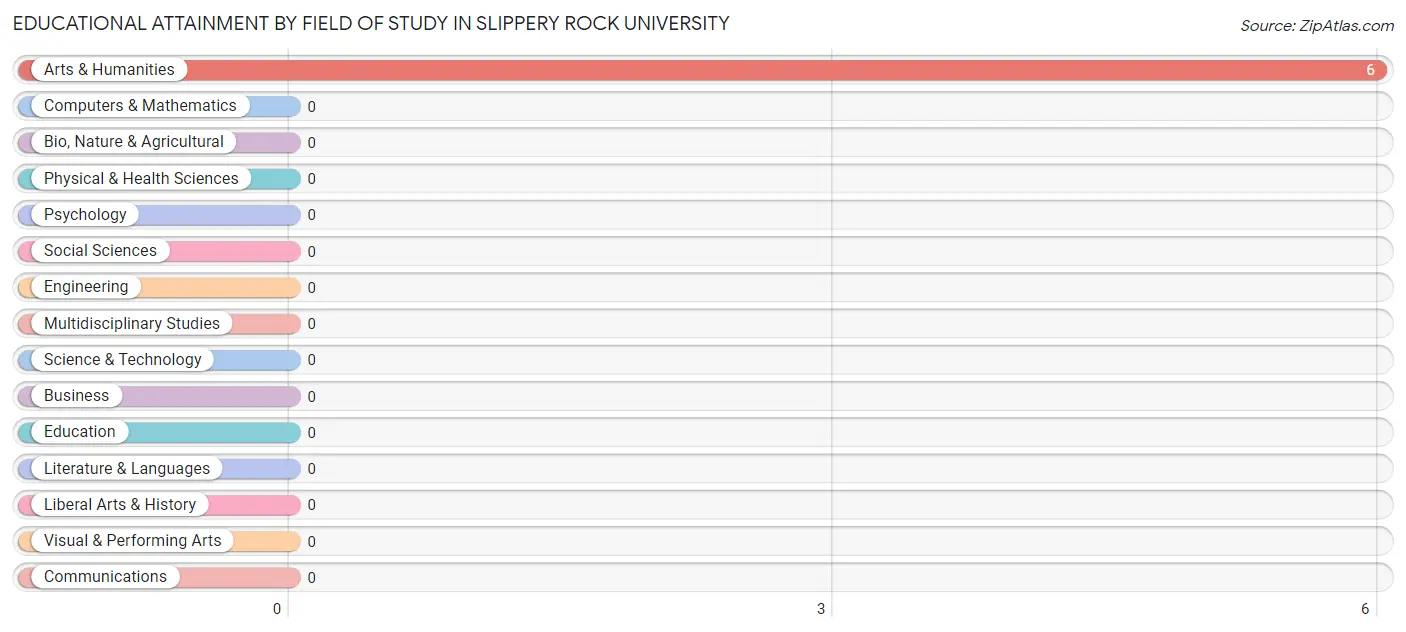
| Field of Study | # Graduates | % Graduates |
| Computers & Mathematics | 0 | 0.0% |
| Bio, Nature & Agricultural | 0 | 0.0% |
| Physical & Health Sciences | 0 | 0.0% |
| Psychology | 0 | 0.0% |
| Social Sciences | 0 | 0.0% |
| Engineering | 0 | 0.0% |
| Multidisciplinary Studies | 0 | 0.0% |
| Science & Technology | 0 | 0.0% |
| Business | 0 | 0.0% |
| Education | 0 | 0.0% |
| Literature & Languages | 0 | 0.0% |
| Liberal Arts & History | 0 | 0.0% |
| Visual & Performing Arts | 0 | 0.0% |
| Communications | 0 | 0.0% |
| Arts & Humanities | 6 | 100.0% |
| Total | 6 | 100.0% |
Transportation & Commute in Slippery Rock University
Vehicle Availability by Sex in Slippery Rock University
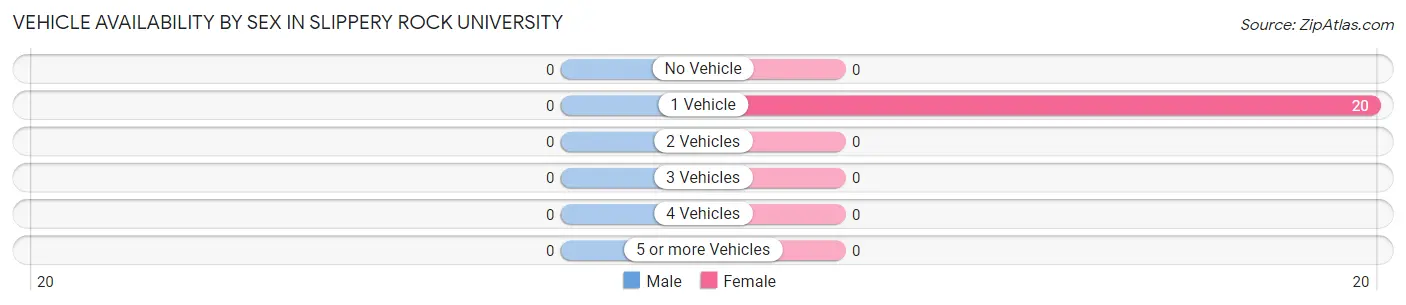
| Vehicles Available | Male | Female |
| No Vehicle | 0 (0.0%) | 0 (0.0%) |
| 1 Vehicle | 0 (0.0%) | 20 (100.0%) |
| 2 Vehicles | 0 (0.0%) | 0 (0.0%) |
| 3 Vehicles | 0 (0.0%) | 0 (0.0%) |
| 4 Vehicles | 0 (0.0%) | 0 (0.0%) |
| 5 or more Vehicles | 0 (0.0%) | 0 (0.0%) |
| Total | 0 (0.0%) | 20 (100.0%) |
Commute Time in Slippery Rock University
The most frequently occuring commute durations in Slippery Rock University are 15 to 19 minutes (248 commuters, 27.7%), 5 to 9 minutes (197 commuters, 22.0%), and less than 5 minutes (139 commuters, 15.5%).
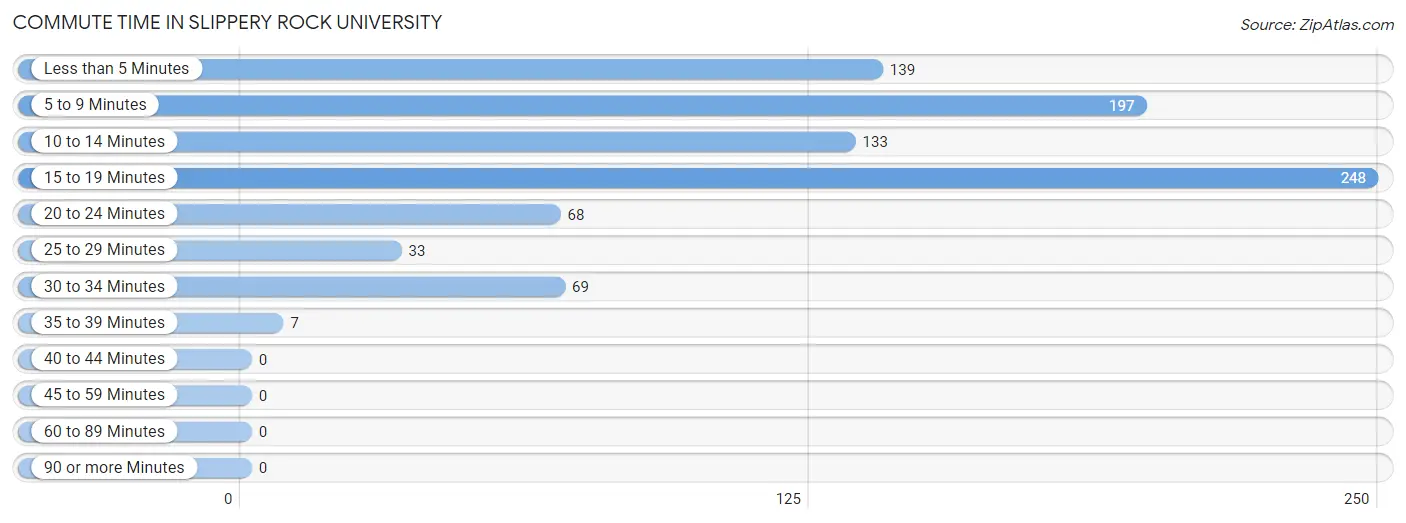
| Commute Time | # Commuters | % Commuters |
| Less than 5 Minutes | 139 | 15.5% |
| 5 to 9 Minutes | 197 | 22.0% |
| 10 to 14 Minutes | 133 | 14.9% |
| 15 to 19 Minutes | 248 | 27.7% |
| 20 to 24 Minutes | 68 | 7.6% |
| 25 to 29 Minutes | 33 | 3.7% |
| 30 to 34 Minutes | 69 | 7.7% |
| 35 to 39 Minutes | 7 | 0.8% |
| 40 to 44 Minutes | 0 | 0.0% |
| 45 to 59 Minutes | 0 | 0.0% |
| 60 to 89 Minutes | 0 | 0.0% |
| 90 or more Minutes | 0 | 0.0% |
Commute Time by Sex in Slippery Rock University
The most common commute times in Slippery Rock University are 10 to 14 minutes (80 commuters, 27.8%) for males and 15 to 19 minutes (211 commuters, 34.8%) for females.
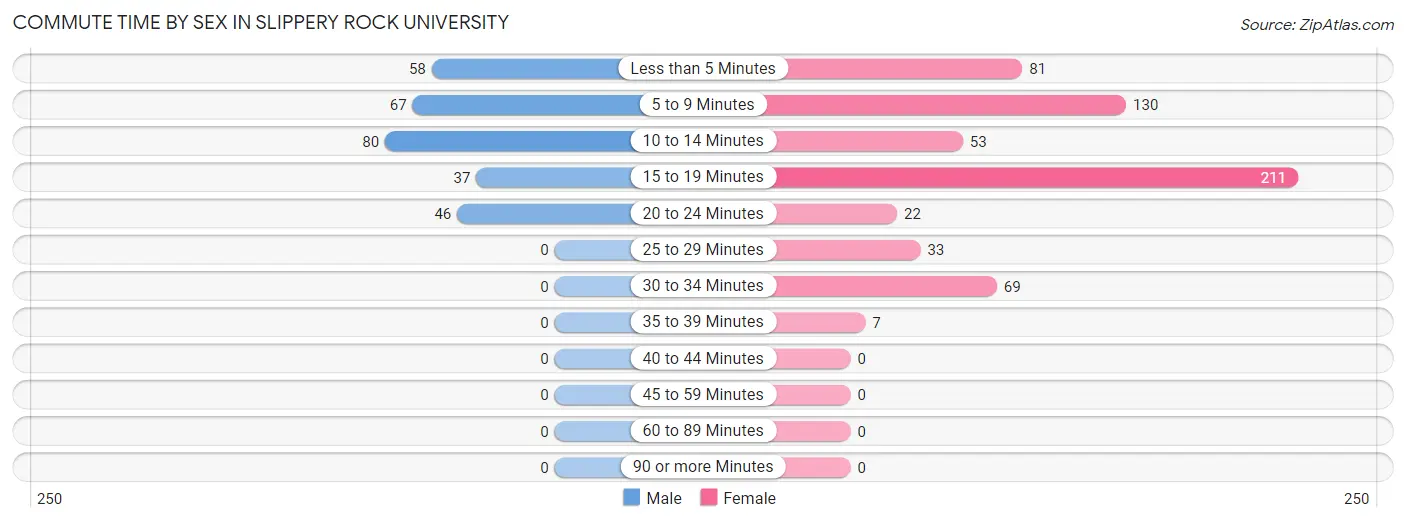
| Commute Time | Male | Female |
| Less than 5 Minutes | 58 (20.1%) | 81 (13.4%) |
| 5 to 9 Minutes | 67 (23.3%) | 130 (21.4%) |
| 10 to 14 Minutes | 80 (27.8%) | 53 (8.7%) |
| 15 to 19 Minutes | 37 (12.9%) | 211 (34.8%) |
| 20 to 24 Minutes | 46 (16.0%) | 22 (3.6%) |
| 25 to 29 Minutes | 0 (0.0%) | 33 (5.4%) |
| 30 to 34 Minutes | 0 (0.0%) | 69 (11.4%) |
| 35 to 39 Minutes | 0 (0.0%) | 7 (1.2%) |
| 40 to 44 Minutes | 0 (0.0%) | 0 (0.0%) |
| 45 to 59 Minutes | 0 (0.0%) | 0 (0.0%) |
| 60 to 89 Minutes | 0 (0.0%) | 0 (0.0%) |
| 90 or more Minutes | 0 (0.0%) | 0 (0.0%) |
Time of Departure to Work by Sex in Slippery Rock University
The most frequent times of departure to work in Slippery Rock University are 12:00 PM to 3:59 PM (94, 32.6%) for males and 12:00 PM to 3:59 PM (250, 41.2%) for females.
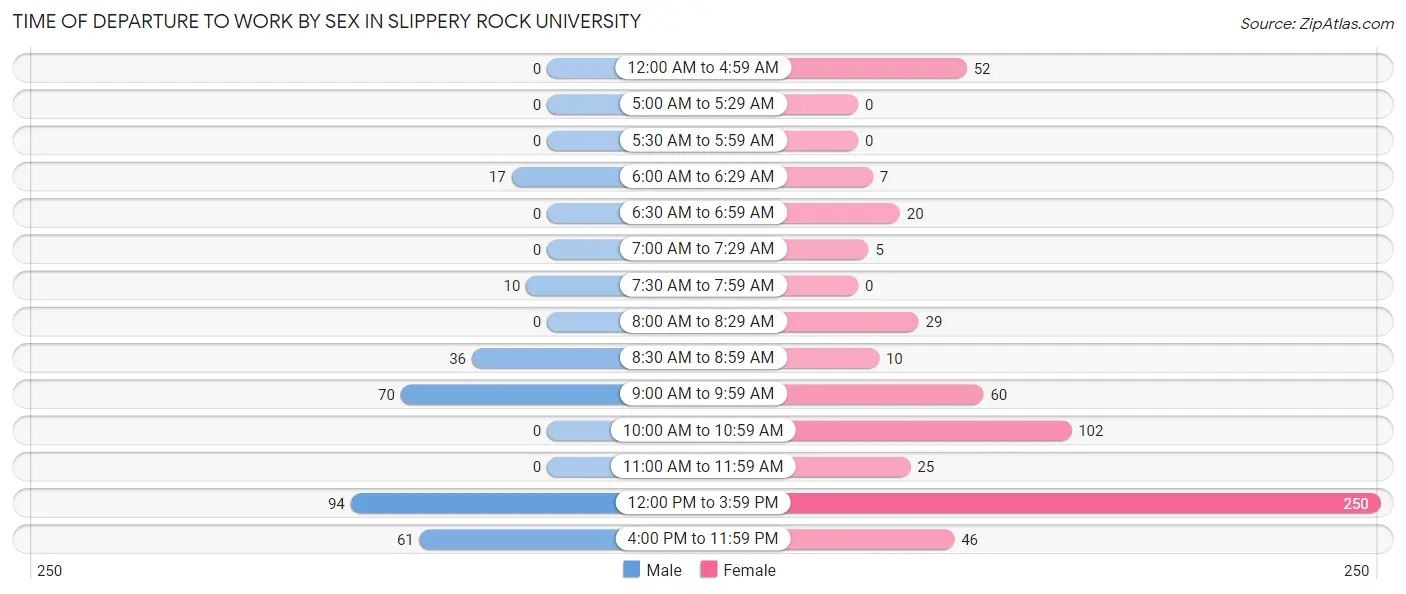
| Time of Departure | Male | Female |
| 12:00 AM to 4:59 AM | 0 (0.0%) | 52 (8.6%) |
| 5:00 AM to 5:29 AM | 0 (0.0%) | 0 (0.0%) |
| 5:30 AM to 5:59 AM | 0 (0.0%) | 0 (0.0%) |
| 6:00 AM to 6:29 AM | 17 (5.9%) | 7 (1.2%) |
| 6:30 AM to 6:59 AM | 0 (0.0%) | 20 (3.3%) |
| 7:00 AM to 7:29 AM | 0 (0.0%) | 5 (0.8%) |
| 7:30 AM to 7:59 AM | 10 (3.5%) | 0 (0.0%) |
| 8:00 AM to 8:29 AM | 0 (0.0%) | 29 (4.8%) |
| 8:30 AM to 8:59 AM | 36 (12.5%) | 10 (1.7%) |
| 9:00 AM to 9:59 AM | 70 (24.3%) | 60 (9.9%) |
| 10:00 AM to 10:59 AM | 0 (0.0%) | 102 (16.8%) |
| 11:00 AM to 11:59 AM | 0 (0.0%) | 25 (4.1%) |
| 12:00 PM to 3:59 PM | 94 (32.6%) | 250 (41.2%) |
| 4:00 PM to 11:59 PM | 61 (21.2%) | 46 (7.6%) |
| Total | 288 (100.0%) | 606 (100.0%) |
Housing Occupancy in Slippery Rock University
Occupancy by Ownership in Slippery Rock University
Of the total 28 dwellings in Slippery Rock University, owner-occupied units account for 0 (0.0%), while renter-occupied units make up 28 (100.0%).
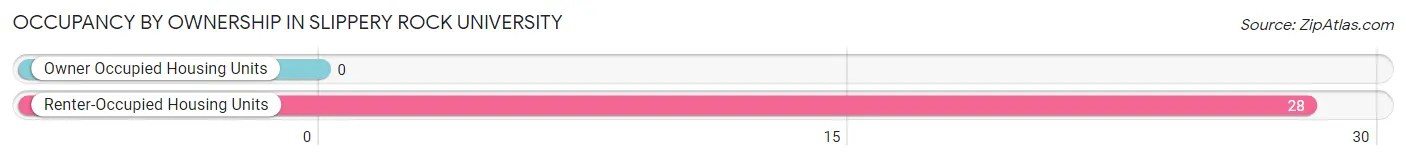
| Occupancy | # Housing Units | % Housing Units |
| Owner Occupied Housing Units | 0 | 0.0% |
| Renter-Occupied Housing Units | 28 | 100.0% |
| Total Occupied Housing Units | 28 | 100.0% |
Occupancy by Household Size in Slippery Rock University
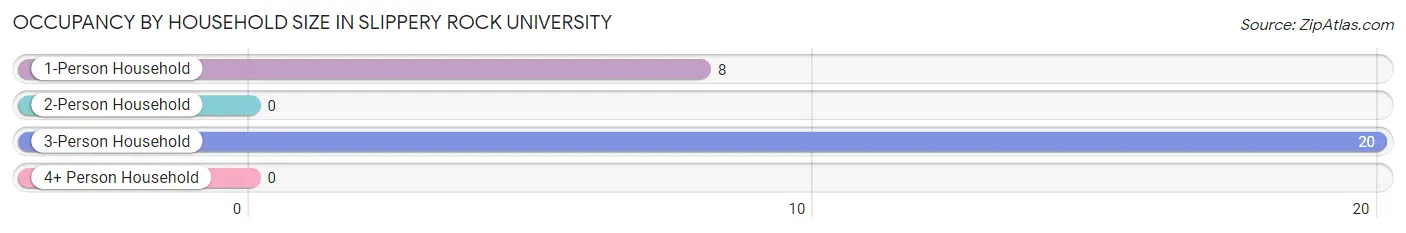
| Household Size | # Housing Units | % Housing Units |
| 1-Person Household | 8 | 28.6% |
| 2-Person Household | 0 | 0.0% |
| 3-Person Household | 20 | 71.4% |
| 4+ Person Household | 0 | 0.0% |
| Total Housing Units | 28 | 100.0% |
Occupancy by Ownership by Household Size in Slippery Rock University
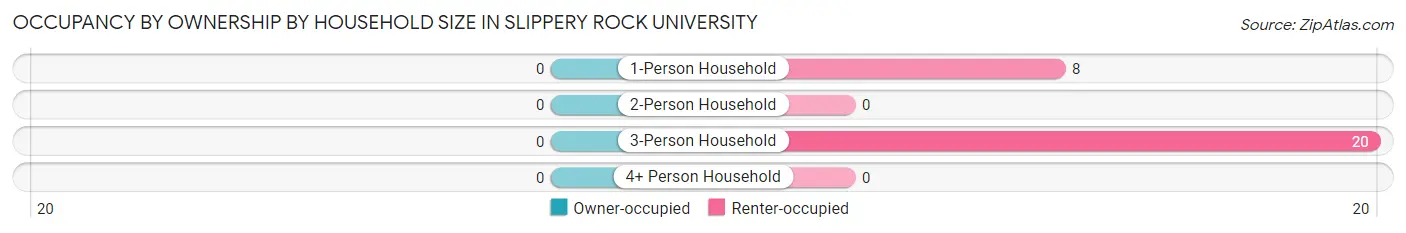
| Household Size | Owner-occupied | Renter-occupied |
| 1-Person Household | 0 (0.0%) | 8 (100.0%) |
| 2-Person Household | 0 (0.0%) | 0 (0.0%) |
| 3-Person Household | 0 (0.0%) | 20 (100.0%) |
| 4+ Person Household | 0 (0.0%) | 0 (0.0%) |
| Total Housing Units | 0 (0.0%) | 28 (100.0%) |
Occupancy by Educational Attainment in Slippery Rock University
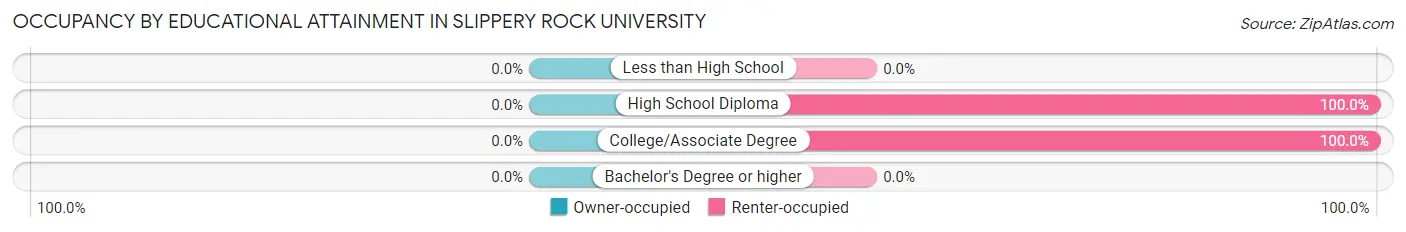
| Household Size | Owner-occupied | Renter-occupied |
| Less than High School | 0 (0.0%) | 0 (0.0%) |
| High School Diploma | 0 (0.0%) | 20 (100.0%) |
| College/Associate Degree | 0 (0.0%) | 8 (100.0%) |
| Bachelor's Degree or higher | 0 (0.0%) | 0 (0.0%) |
Occupancy by Age of Householder in Slippery Rock University
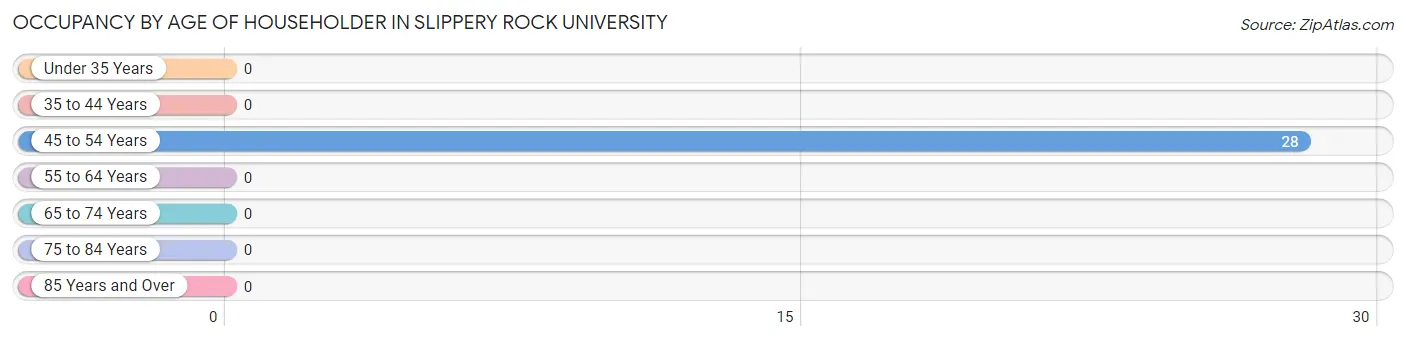
| Age Bracket | # Households | % Households |
| Under 35 Years | 0 | 0.0% |
| 35 to 44 Years | 0 | 0.0% |
| 45 to 54 Years | 28 | 100.0% |
| 55 to 64 Years | 0 | 0.0% |
| 65 to 74 Years | 0 | 0.0% |
| 75 to 84 Years | 0 | 0.0% |
| 85 Years and Over | 0 | 0.0% |
| Total | 28 | 100.0% |
Housing Finances in Slippery Rock University
Median Income by Occupancy in Slippery Rock University
| Occupancy Type | # Households | Median Income |
| Owner-Occupied | 0 (0.0%) | $0 |
| Renter-Occupied | 28 (100.0%) | $0 |
| Average | 28 (100.0%) | $0 |
Occupancy by Householder Income Bracket in Slippery Rock University
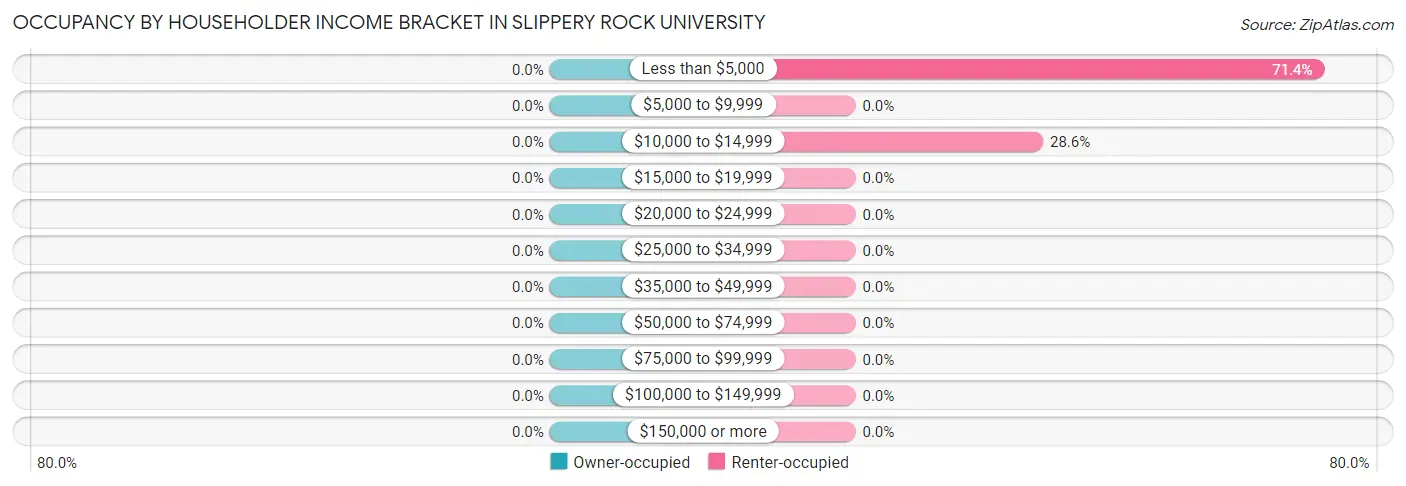
| Income Bracket | Owner-occupied | Renter-occupied |
| Less than $5,000 | 0 (0.0%) | 20 (71.4%) |
| $5,000 to $9,999 | 0 (0.0%) | 0 (0.0%) |
| $10,000 to $14,999 | 0 (0.0%) | 8 (28.6%) |
| $15,000 to $19,999 | 0 (0.0%) | 0 (0.0%) |
| $20,000 to $24,999 | 0 (0.0%) | 0 (0.0%) |
| $25,000 to $34,999 | 0 (0.0%) | 0 (0.0%) |
| $35,000 to $49,999 | 0 (0.0%) | 0 (0.0%) |
| $50,000 to $74,999 | 0 (0.0%) | 0 (0.0%) |
| $75,000 to $99,999 | 0 (0.0%) | 0 (0.0%) |
| $100,000 to $149,999 | 0 (0.0%) | 0 (0.0%) |
| $150,000 or more | 0 (0.0%) | 0 (0.0%) |
| Total | 0 (0.0%) | 28 (100.0%) |
Monthly Housing Cost Tiers in Slippery Rock University
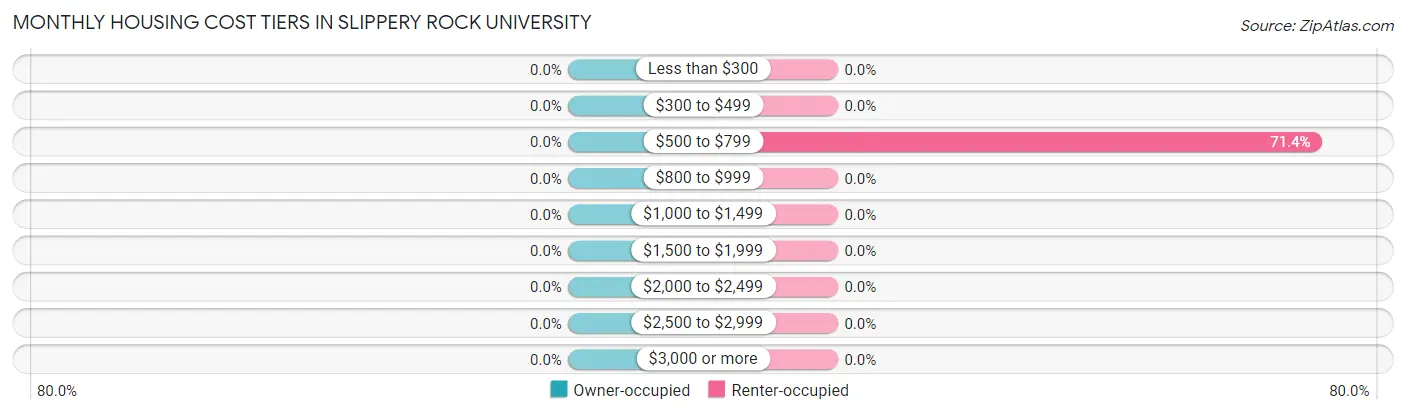
| Monthly Cost | Owner-occupied | Renter-occupied |
| Less than $300 | 0 (0.0%) | 0 (0.0%) |
| $300 to $499 | 0 (0.0%) | 0 (0.0%) |
| $500 to $799 | 0 (0.0%) | 20 (71.4%) |
| $800 to $999 | 0 (0.0%) | 0 (0.0%) |
| $1,000 to $1,499 | 0 (0.0%) | 0 (0.0%) |
| $1,500 to $1,999 | 0 (0.0%) | 0 (0.0%) |
| $2,000 to $2,499 | 0 (0.0%) | 0 (0.0%) |
| $2,500 to $2,999 | 0 (0.0%) | 0 (0.0%) |
| $3,000 or more | 0 (0.0%) | 0 (0.0%) |
| Total | 0 (0.0%) | 28 (100.0%) |
Physical Housing Characteristics in Slippery Rock University
Housing Structures in Slippery Rock University
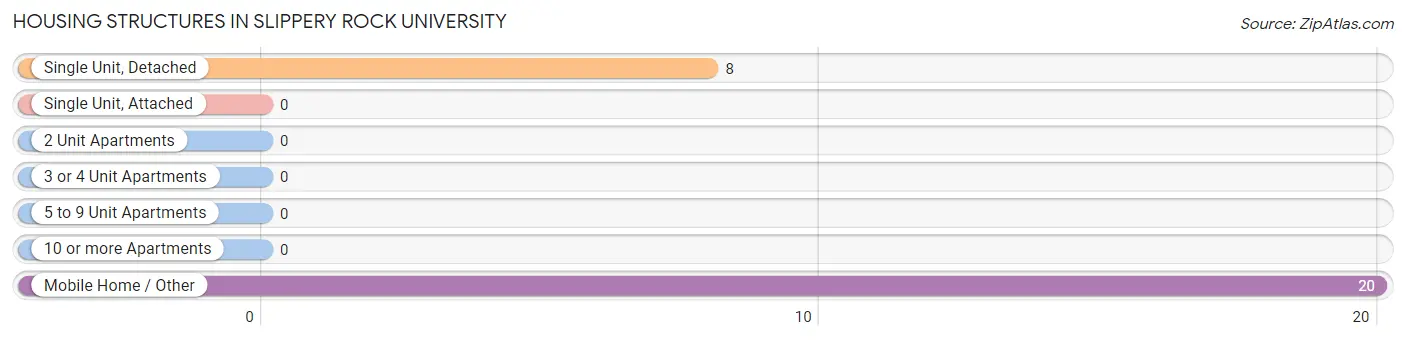
| Structure Type | # Housing Units | % Housing Units |
| Single Unit, Detached | 8 | 28.6% |
| Single Unit, Attached | 0 | 0.0% |
| 2 Unit Apartments | 0 | 0.0% |
| 3 or 4 Unit Apartments | 0 | 0.0% |
| 5 to 9 Unit Apartments | 0 | 0.0% |
| 10 or more Apartments | 0 | 0.0% |
| Mobile Home / Other | 20 | 71.4% |
| Total | 28 | 100.0% |
Housing Structures by Occupancy in Slippery Rock University
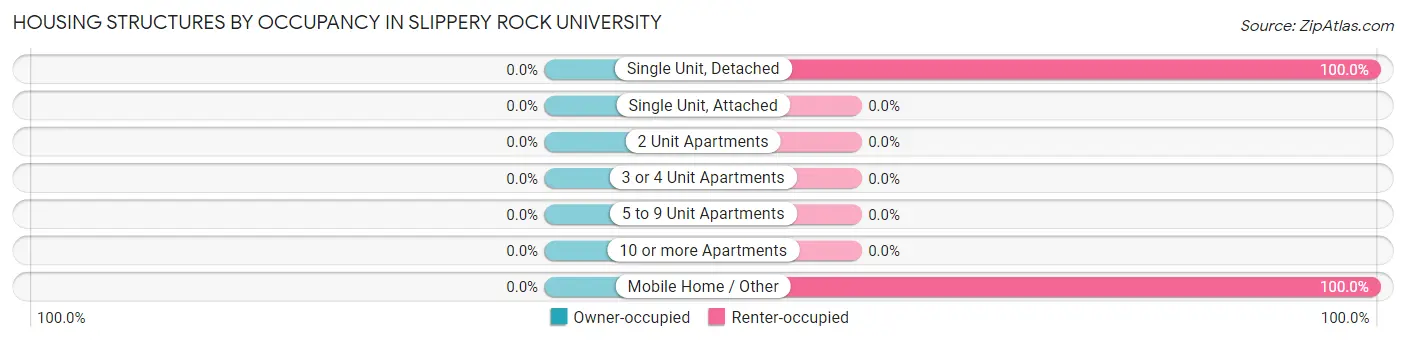
| Structure Type | Owner-occupied | Renter-occupied |
| Single Unit, Detached | 0 (0.0%) | 8 (100.0%) |
| Single Unit, Attached | 0 (0.0%) | 0 (0.0%) |
| 2 Unit Apartments | 0 (0.0%) | 0 (0.0%) |
| 3 or 4 Unit Apartments | 0 (0.0%) | 0 (0.0%) |
| 5 to 9 Unit Apartments | 0 (0.0%) | 0 (0.0%) |
| 10 or more Apartments | 0 (0.0%) | 0 (0.0%) |
| Mobile Home / Other | 0 (0.0%) | 20 (100.0%) |
| Total | 0 (0.0%) | 28 (100.0%) |
Housing Structures by Number of Rooms in Slippery Rock University
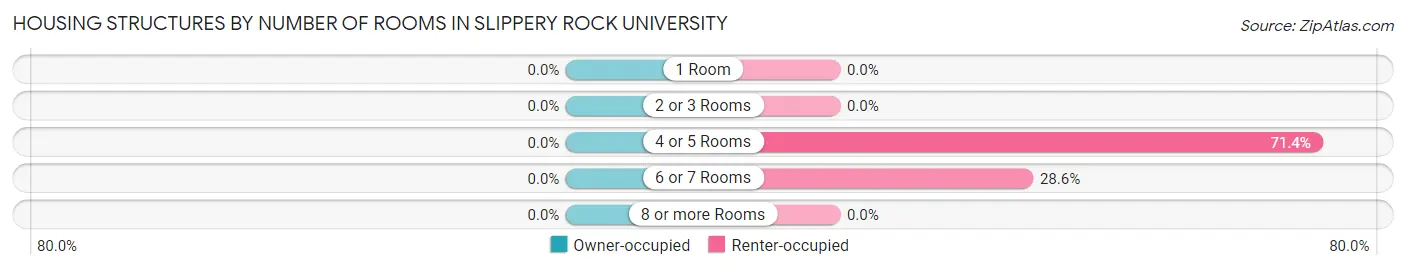
| Number of Rooms | Owner-occupied | Renter-occupied |
| 1 Room | 0 (0.0%) | 0 (0.0%) |
| 2 or 3 Rooms | 0 (0.0%) | 0 (0.0%) |
| 4 or 5 Rooms | 0 (0.0%) | 20 (71.4%) |
| 6 or 7 Rooms | 0 (0.0%) | 8 (28.6%) |
| 8 or more Rooms | 0 (0.0%) | 0 (0.0%) |
| Total | 0 (0.0%) | 28 (100.0%) |
Housing Structure by Heating Type in Slippery Rock University
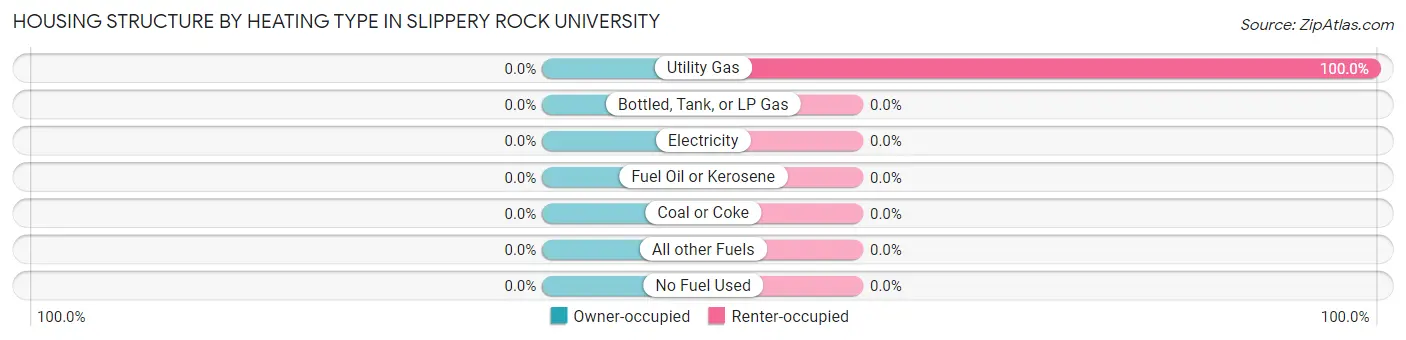
| Heating Type | Owner-occupied | Renter-occupied |
| Utility Gas | 0 (0.0%) | 28 (100.0%) |
| Bottled, Tank, or LP Gas | 0 (0.0%) | 0 (0.0%) |
| Electricity | 0 (0.0%) | 0 (0.0%) |
| Fuel Oil or Kerosene | 0 (0.0%) | 0 (0.0%) |
| Coal or Coke | 0 (0.0%) | 0 (0.0%) |
| All other Fuels | 0 (0.0%) | 0 (0.0%) |
| No Fuel Used | 0 (0.0%) | 0 (0.0%) |
| Total | 0 (0.0%) | 28 (100.0%) |
Household Vehicle Usage in Slippery Rock University
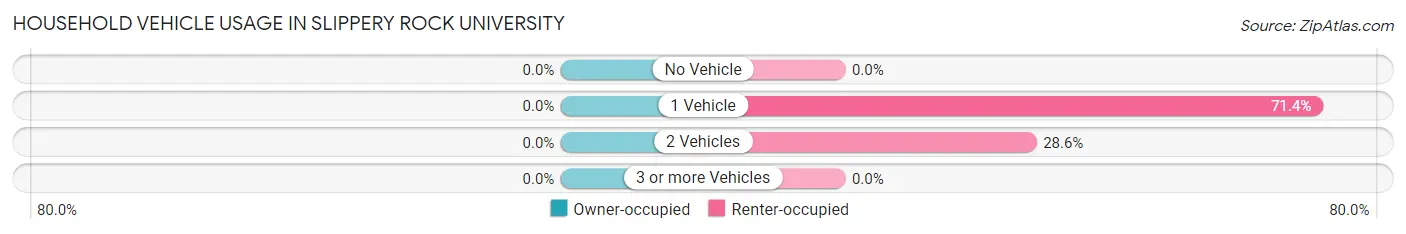
| Vehicles per Household | Owner-occupied | Renter-occupied |
| No Vehicle | 0 (0.0%) | 0 (0.0%) |
| 1 Vehicle | 0 (0.0%) | 20 (71.4%) |
| 2 Vehicles | 0 (0.0%) | 8 (28.6%) |
| 3 or more Vehicles | 0 (0.0%) | 0 (0.0%) |
| Total | 0 (0.0%) | 28 (100.0%) |
Real Estate & Mortgages in Slippery Rock University
Real Estate and Mortgage Overview in Slippery Rock University
| Characteristic | Without Mortgage | With Mortgage |
| Housing Units | 0 | 0 |
| Median Property Value | - | - |
| Median Household Income | - | - |
| Monthly Housing Costs | - | - |
| Real Estate Taxes | - | - |
Property Value by Mortgage Status in Slippery Rock University
| Property Value | Without Mortgage | With Mortgage |
| Less than $50,000 | 0 (0.0%) | 0 (0.0%) |
| $50,000 to $99,999 | 0 (0.0%) | 0 (0.0%) |
| $100,000 to $299,999 | 0 (0.0%) | 0 (0.0%) |
| $300,000 to $499,999 | 0 (0.0%) | 0 (0.0%) |
| $500,000 to $749,999 | 0 (0.0%) | 0 (0.0%) |
| $750,000 to $999,999 | 0 (0.0%) | 0 (0.0%) |
| $1,000,000 or more | 0 (0.0%) | 0 (0.0%) |
| Total | 0 (0.0%) | 0 (0.0%) |
Household Income by Mortgage Status in Slippery Rock University
| Household Income | Without Mortgage | With Mortgage |
| Less than $10,000 | 0 (0.0%) | 0 (0.0%) |
| $10,000 to $24,999 | 0 (0.0%) | 0 (0.0%) |
| $25,000 to $34,999 | 0 (0.0%) | 0 (0.0%) |
| $35,000 to $49,999 | 0 (0.0%) | 0 (0.0%) |
| $50,000 to $74,999 | 0 (0.0%) | 0 (0.0%) |
| $75,000 to $99,999 | 0 (0.0%) | 0 (0.0%) |
| $100,000 to $149,999 | 0 (0.0%) | 0 (0.0%) |
| $150,000 or more | 0 (0.0%) | 0 (0.0%) |
| Total | 0 (0.0%) | 0 (0.0%) |
Property Value to Household Income Ratio in Slippery Rock University
| Value-to-Income Ratio | Without Mortgage | With Mortgage |
| Less than 2.0x | 0 (0.0%) | 0 (0.0%) |
| 2.0x to 2.9x | 0 (0.0%) | 0 (0.0%) |
| 3.0x to 3.9x | 0 (0.0%) | 0 (0.0%) |
| 4.0x or more | 0 (0.0%) | 0 (0.0%) |
| Total | 0 (0.0%) | 0 (0.0%) |
Real Estate Taxes by Mortgage Status in Slippery Rock University

| Property Taxes | Without Mortgage | With Mortgage |
| Less than $800 | 0 (0.0%) | 0 (0.0%) |
| $800 to $1,499 | 0 (0.0%) | 0 (0.0%) |
| $800 to $1,499 | 0 (0.0%) | 0 (0.0%) |
| Total | 0 (0.0%) | 0 (0.0%) |
Health & Disability in Slippery Rock University
Health Insurance Coverage by Age in Slippery Rock University
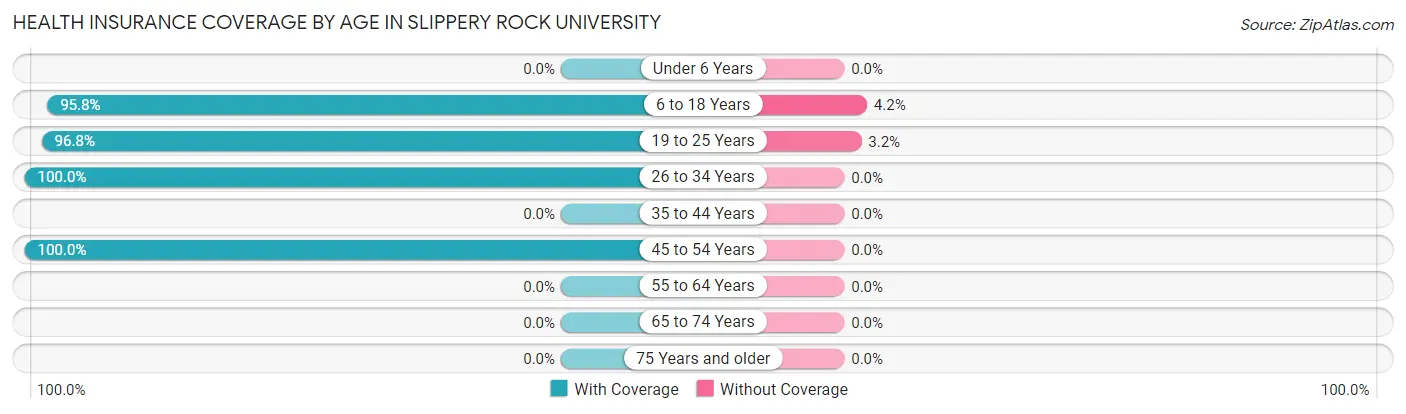
| Age Bracket | With Coverage | Without Coverage |
| Under 6 Years | 0 (0.0%) | 0 (0.0%) |
| 6 to 18 Years | 840 (95.8%) | 37 (4.2%) |
| 19 to 25 Years | 1,703 (96.8%) | 56 (3.2%) |
| 26 to 34 Years | 18 (100.0%) | 0 (0.0%) |
| 35 to 44 Years | 0 (0.0%) | 0 (0.0%) |
| 45 to 54 Years | 28 (100.0%) | 0 (0.0%) |
| 55 to 64 Years | 0 (0.0%) | 0 (0.0%) |
| 65 to 74 Years | 0 (0.0%) | 0 (0.0%) |
| 75 Years and older | 0 (0.0%) | 0 (0.0%) |
| Total | 2,589 (96.5%) | 93 (3.5%) |
Health Insurance Coverage by Citizenship Status in Slippery Rock University
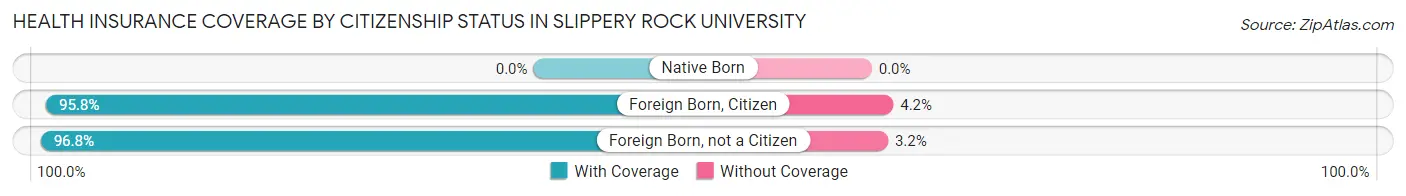
| Citizenship Status | With Coverage | Without Coverage |
| Native Born | 0 (0.0%) | 0 (0.0%) |
| Foreign Born, Citizen | 840 (95.8%) | 37 (4.2%) |
| Foreign Born, not a Citizen | 1,703 (96.8%) | 56 (3.2%) |
Health Insurance Coverage by Household Income in Slippery Rock University
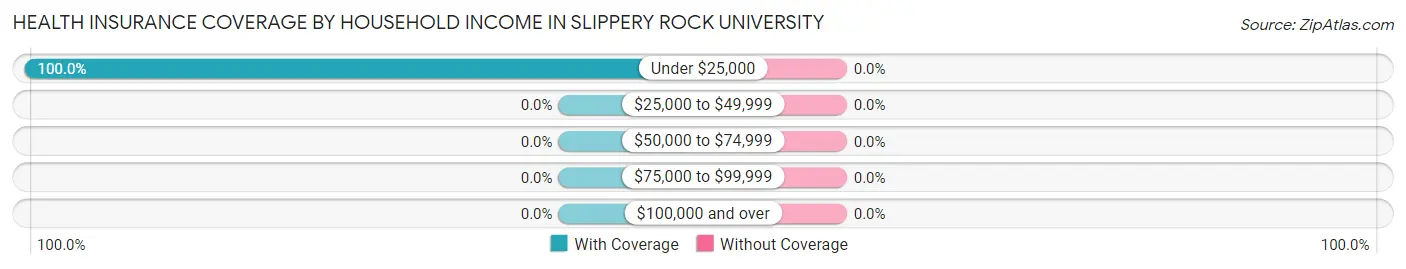
| Household Income | With Coverage | Without Coverage |
| Under $25,000 | 67 (100.0%) | 0 (0.0%) |
| $25,000 to $49,999 | 0 (0.0%) | 0 (0.0%) |
| $50,000 to $74,999 | 0 (0.0%) | 0 (0.0%) |
| $75,000 to $99,999 | 0 (0.0%) | 0 (0.0%) |
| $100,000 and over | 0 (0.0%) | 0 (0.0%) |
Public vs Private Health Insurance Coverage by Age in Slippery Rock University
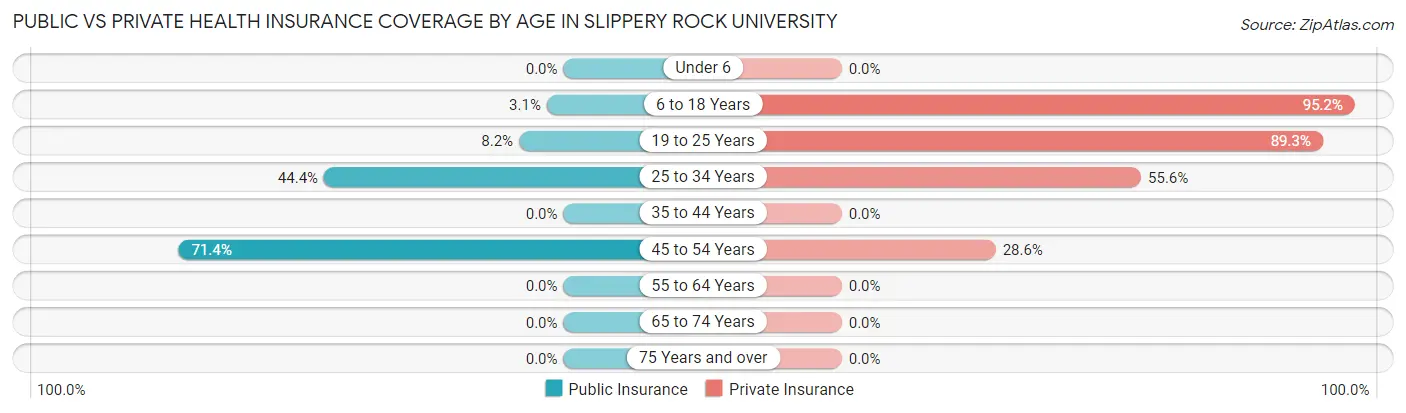
| Age Bracket | Public Insurance | Private Insurance |
| Under 6 | 0 (0.0%) | 0 (0.0%) |
| 6 to 18 Years | 27 (3.1%) | 835 (95.2%) |
| 19 to 25 Years | 145 (8.2%) | 1,570 (89.3%) |
| 25 to 34 Years | 8 (44.4%) | 10 (55.6%) |
| 35 to 44 Years | 0 (0.0%) | 0 (0.0%) |
| 45 to 54 Years | 20 (71.4%) | 8 (28.6%) |
| 55 to 64 Years | 0 (0.0%) | 0 (0.0%) |
| 65 to 74 Years | 0 (0.0%) | 0 (0.0%) |
| 75 Years and over | 0 (0.0%) | 0 (0.0%) |
| Total | 200 (7.5%) | 2,423 (90.3%) |
Disability Status by Sex by Age in Slippery Rock University
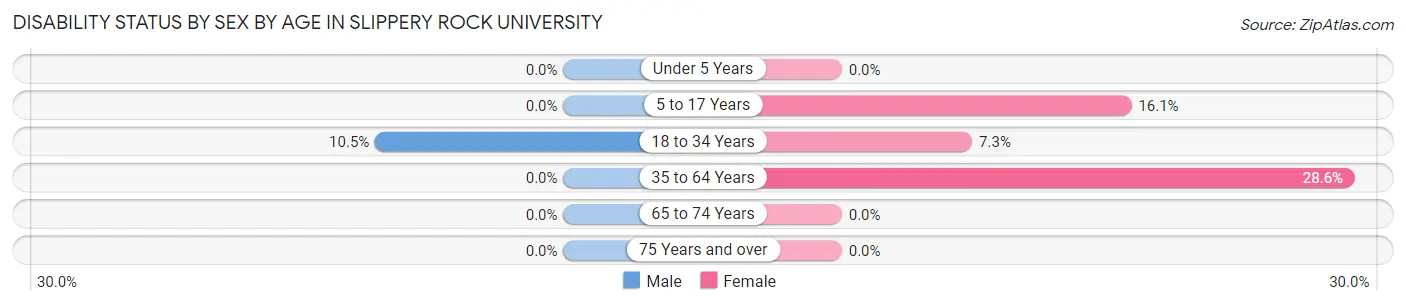
| Age Bracket | Male | Female |
| Under 5 Years | 0 (0.0%) | 0 (0.0%) |
| 5 to 17 Years | 0 (0.0%) | 5 (16.1%) |
| 18 to 34 Years | 90 (10.5%) | 128 (7.3%) |
| 35 to 64 Years | 0 (0.0%) | 8 (28.6%) |
| 65 to 74 Years | 0 (0.0%) | 0 (0.0%) |
| 75 Years and over | 0 (0.0%) | 0 (0.0%) |
Disability Class by Sex by Age in Slippery Rock University
Disability Class: Hearing Difficulty
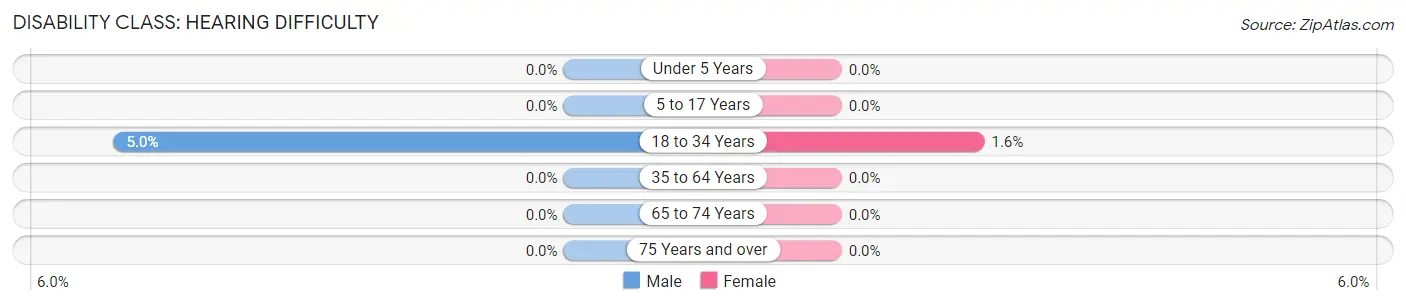
| Age Bracket | Male | Female |
| Under 5 Years | 0 (0.0%) | 0 (0.0%) |
| 5 to 17 Years | 0 (0.0%) | 0 (0.0%) |
| 18 to 34 Years | 43 (5.0%) | 28 (1.6%) |
| 35 to 64 Years | 0 (0.0%) | 0 (0.0%) |
| 65 to 74 Years | 0 (0.0%) | 0 (0.0%) |
| 75 Years and over | 0 (0.0%) | 0 (0.0%) |
Disability Class: Vision Difficulty
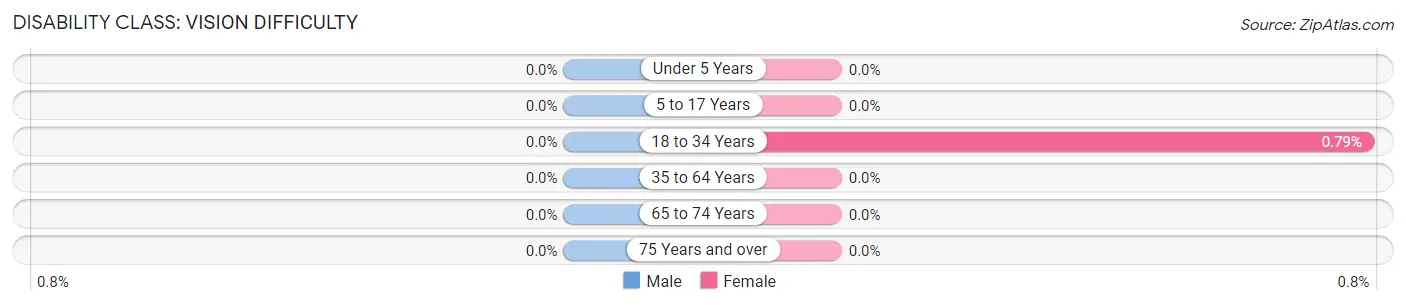
| Age Bracket | Male | Female |
| Under 5 Years | 0 (0.0%) | 0 (0.0%) |
| 5 to 17 Years | 0 (0.0%) | 0 (0.0%) |
| 18 to 34 Years | 0 (0.0%) | 14 (0.8%) |
| 35 to 64 Years | 0 (0.0%) | 0 (0.0%) |
| 65 to 74 Years | 0 (0.0%) | 0 (0.0%) |
| 75 Years and over | 0 (0.0%) | 0 (0.0%) |
Disability Class: Cognitive Difficulty
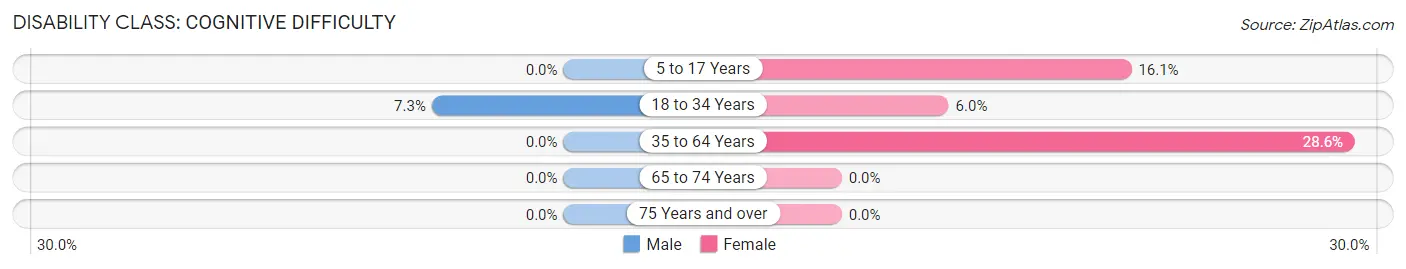
| Age Bracket | Male | Female |
| 5 to 17 Years | 0 (0.0%) | 5 (16.1%) |
| 18 to 34 Years | 63 (7.3%) | 105 (5.9%) |
| 35 to 64 Years | 0 (0.0%) | 8 (28.6%) |
| 65 to 74 Years | 0 (0.0%) | 0 (0.0%) |
| 75 Years and over | 0 (0.0%) | 0 (0.0%) |
Disability Class: Ambulatory Difficulty
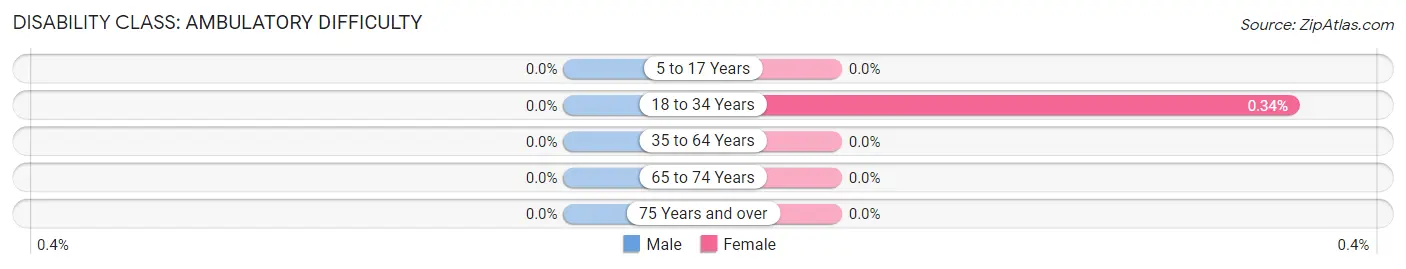
| Age Bracket | Male | Female |
| 5 to 17 Years | 0 (0.0%) | 0 (0.0%) |
| 18 to 34 Years | 0 (0.0%) | 6 (0.3%) |
| 35 to 64 Years | 0 (0.0%) | 0 (0.0%) |
| 65 to 74 Years | 0 (0.0%) | 0 (0.0%) |
| 75 Years and over | 0 (0.0%) | 0 (0.0%) |
Disability Class: Self-Care Difficulty
| Age Bracket | Male | Female |
| 5 to 17 Years | 0 (0.0%) | 0 (0.0%) |
| 18 to 34 Years | 0 (0.0%) | 0 (0.0%) |
| 35 to 64 Years | 0 (0.0%) | 0 (0.0%) |
| 65 to 74 Years | 0 (0.0%) | 0 (0.0%) |
| 75 Years and over | 0 (0.0%) | 0 (0.0%) |
Technology Access in Slippery Rock University
Computing Device Access in Slippery Rock University
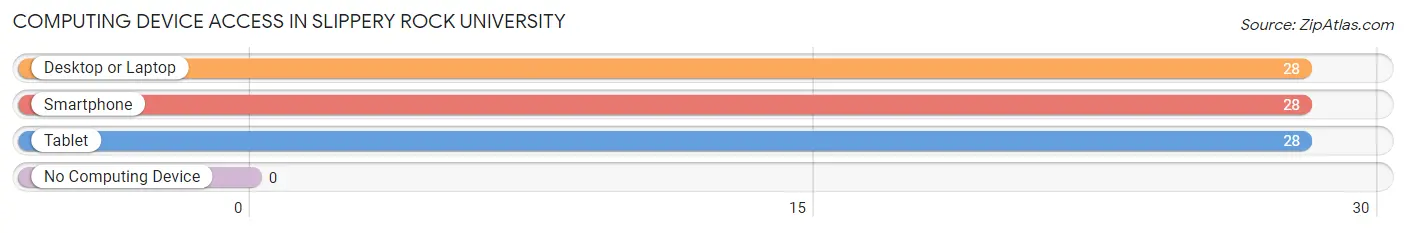
| Device Type | # Households | % Households |
| Desktop or Laptop | 28 | 100.0% |
| Smartphone | 28 | 100.0% |
| Tablet | 28 | 100.0% |
| No Computing Device | 0 | 0.0% |
| Total | 28 | 100.0% |
Internet Access in Slippery Rock University
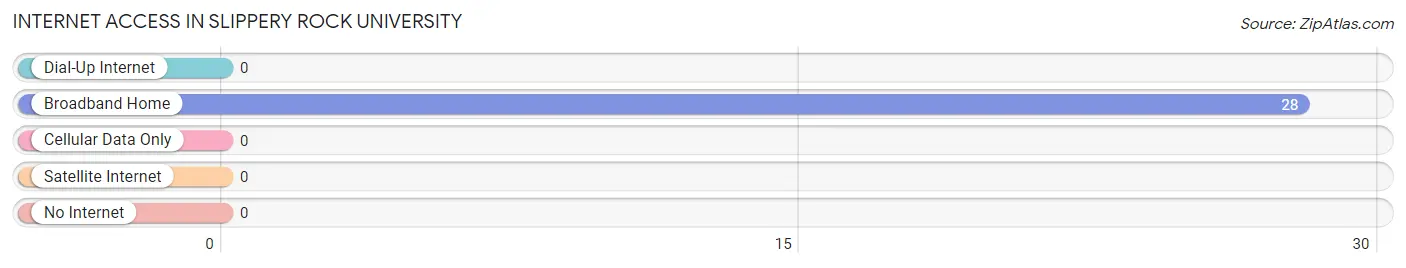
| Internet Type | # Households | % Households |
| Dial-Up Internet | 0 | 0.0% |
| Broadband Home | 28 | 100.0% |
| Cellular Data Only | 0 | 0.0% |
| Satellite Internet | 0 | 0.0% |
| No Internet | 0 | 0.0% |
| Total | 28 | 100.0% |
Slippery Rock University Summary
Slippery Rock University (SRU) is a public university located in Slippery Rock, Pennsylvania. It is a member of the Pennsylvania State System of Higher Education (PASSHE). SRU was founded in 1889 as Slippery Rock State Normal School, a teacher-training school. It was renamed Slippery Rock State Teachers College in 1927 and Slippery Rock State College in 1960. In 1983, it was granted university status and became Slippery Rock University of Pennsylvania.
History
Slippery Rock University was founded in 1889 as Slippery Rock State Normal School, a teacher-training school. It was established by an act of the Pennsylvania General Assembly, which authorized the school to offer a two-year program of study leading to a teaching certificate. The school was located in a building that had previously served as a hotel and was located on the site of the present-day Slippery Rock University.
In 1927, the school was renamed Slippery Rock State Teachers College and began offering a four-year program of study leading to a bachelor's degree in education. In 1960, the school was renamed Slippery Rock State College and began offering a variety of degree programs in the liberal arts and sciences.
In 1983, the school was granted university status and became Slippery Rock University of Pennsylvania. Since then, the university has continued to expand its academic offerings and now offers more than 140 undergraduate and graduate degree programs.
Geography
Slippery Rock University is located in Slippery Rock, Pennsylvania, a small town in the northwest corner of the state. The university is situated on a hill overlooking the town and is surrounded by rolling hills and forests. The campus is located approximately 50 miles north of Pittsburgh and is easily accessible by car or bus.
The university is located in Butler County, which is part of the Pittsburgh metropolitan area. The county is home to a variety of industries, including manufacturing, healthcare, and education.
Economy
Slippery Rock University is an important economic engine for the region. The university has an annual economic impact of more than $400 million and is one of the largest employers in the county. The university also provides a variety of services to the community, including health care, education, and recreation.
The university also serves as a major source of talent for the region's businesses. Many of the university's graduates remain in the area and become employed in the local economy.
Demographics
As of 2020, Slippery Rock University had an enrollment of 8,845 students. The student body is diverse, with students from all 50 states and more than 50 countries. The university also has a large international student population, with more than 1,000 international students enrolled.
The university's faculty and staff are also diverse, with more than 1,000 faculty and staff members representing a variety of backgrounds and experiences.
Conclusion
Slippery Rock University is a public university located in Slippery Rock, Pennsylvania. It was founded in 1889 as a teacher-training school and has since grown to become a major economic engine for the region. The university has an annual economic impact of more than $400 million and is one of the largest employers in the county. The university also serves as a major source of talent for the region's businesses and has an enrollment of 8,845 students from all 50 states and more than 50 countries.
Common Questions
What is Per Capita Income in Slippery Rock University?
Per Capita income in Slippery Rock University is $4,688.
What is Income or Wage Gap in Slippery Rock University?
Income or Wage Gap in Slippery Rock University is 41.4%.
Women in Slippery Rock University earn 58.6 cents for every dollar earned by a man.
What is Inequality or Gini Index in Slippery Rock University?
Inequality or Gini Index in Slippery Rock University is 0.34.
What is the Total Population of Slippery Rock University?
Total Population of Slippery Rock University is 2,682.
What is the Total Male Population of Slippery Rock University?
Total Male Population of Slippery Rock University is 859.
What is the Total Female Population of Slippery Rock University?
Total Female Population of Slippery Rock University is 1,823.
What is the Ratio of Males per 100 Females in Slippery Rock University?
There are 47.12 Males per 100 Females in Slippery Rock University.
What is the Ratio of Females per 100 Males in Slippery Rock University?
There are 212.22 Females per 100 Males in Slippery Rock University.
What is the Median Population Age in Slippery Rock University?
Median Population Age in Slippery Rock University is 19.5 Years.
What is the Average Family Size in Slippery Rock University
Average Family Size in Slippery Rock University is 3.0 People.
What is the Average Household Size in Slippery Rock University
Average Household Size in Slippery Rock University is 2.4 People.
How Large is the Labor Force in Slippery Rock University?
There are 1,242 People in the Labor Forcein in Slippery Rock University.
What is the Percentage of People in the Labor Force in Slippery Rock University?
46.3% of People are in the Labor Force in Slippery Rock University.
What is the Unemployment Rate in Slippery Rock University?
Unemployment Rate in Slippery Rock University is 10.8%.