Cities with the Highest Percentage of Croatian Population in Pennsylvania
RELATED REPORTS & OPTIONS
Croatian
Pennsylvania
Compare Cities
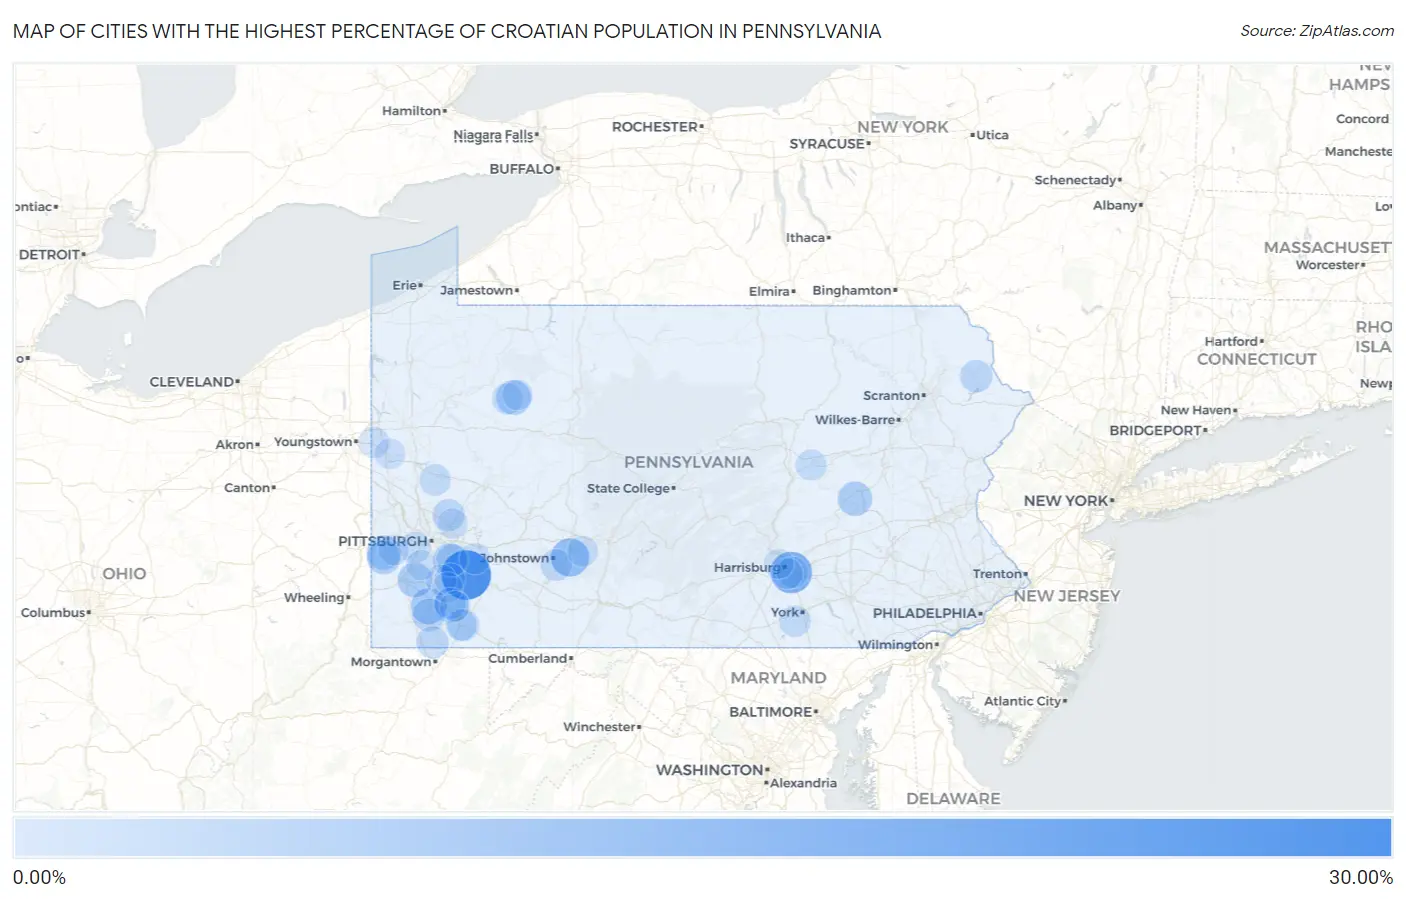
Map of Cities with the Highest Percentage of Croatian Population in Pennsylvania
0.00%
30.00%
Cities with the Highest Percentage of Croatian Population in Pennsylvania
| City | Croatian | vs State | vs National | |
| 1. | Yukon | 28.69% | 0.33%(+28.4)#1 | 0.12%(+28.6)#2 |
| 2. | S N P J Borough | 22.22% | 0.33%(+21.9)#2 | 0.12%(+22.1)#5 |
| 3. | Enhaut | 17.41% | 0.33%(+17.1)#3 | 0.12%(+17.3)#7 |
| 4. | St Michael | 12.85% | 0.33%(+12.5)#4 | 0.12%(+12.7)#9 |
| 5. | Skelp | 12.16% | 0.33%(+11.8)#5 | 0.12%(+12.0)#11 |
| 6. | Bessemer Borough | 11.62% | 0.33%(+11.3)#6 | 0.12%(+11.5)#14 |
| 7. | Fredericktown | 9.46% | 0.33%(+9.13)#7 | 0.12%(+9.34)#20 |
| 8. | Foxburg Borough | 8.30% | 0.33%(+7.97)#8 | 0.12%(+8.18)#28 |
| 9. | Eighty Four | 8.12% | 0.33%(+7.78)#9 | 0.12%(+8.00)#30 |
| 10. | Rowes Run | 8.10% | 0.33%(+7.77)#10 | 0.12%(+7.98)#32 |
| 11. | Crown | 8.07% | 0.33%(+7.74)#11 | 0.12%(+7.95)#34 |
| 12. | Heckscherville | 7.55% | 0.33%(+7.21)#12 | 0.12%(+7.43)#35 |
| 13. | Langeloth | 7.20% | 0.33%(+6.86)#13 | 0.12%(+7.07)#39 |
| 14. | Etna Borough | 6.91% | 0.33%(+6.58)#14 | 0.12%(+6.79)#42 |
| 15. | Freedom Borough | 6.83% | 0.33%(+6.50)#15 | 0.12%(+6.71)#44 |
| 16. | Boston | 6.76% | 0.33%(+6.43)#16 | 0.12%(+6.64)#45 |
| 17. | Cross Creek | 6.63% | 0.33%(+6.30)#17 | 0.12%(+6.51)#46 |
| 18. | Centerville Borough Washington County | 6.01% | 0.33%(+5.68)#18 | 0.12%(+5.89)#54 |
| 19. | North Braddock Borough | 5.86% | 0.33%(+5.52)#19 | 0.12%(+5.74)#59 |
| 20. | Cove Forge | 5.43% | 0.33%(+5.10)#20 | 0.12%(+5.31)#67 |
| 21. | Dry Tavern | 5.26% | 0.33%(+4.93)#21 | 0.12%(+5.14)#68 |
| 22. | East Pittsburgh Borough | 5.25% | 0.33%(+4.92)#22 | 0.12%(+5.13)#69 |
| 23. | White Mills | 4.96% | 0.33%(+4.63)#23 | 0.12%(+4.84)#74 |
| 24. | Conway Borough | 4.75% | 0.33%(+4.42)#24 | 0.12%(+4.63)#81 |
| 25. | Greenock | 4.75% | 0.33%(+4.42)#25 | 0.12%(+4.63)#82 |
| 26. | Russellton | 4.66% | 0.33%(+4.32)#26 | 0.12%(+4.54)#84 |
| 27. | Bobtown | 4.62% | 0.33%(+4.28)#27 | 0.12%(+4.49)#85 |
| 28. | Eastvale Borough | 4.52% | 0.33%(+4.19)#28 | 0.12%(+4.40)#88 |
| 29. | Port Vue Borough | 4.49% | 0.33%(+4.16)#29 | 0.12%(+4.37)#90 |
| 30. | Swissvale Borough | 4.06% | 0.33%(+3.73)#30 | 0.12%(+3.94)#110 |
| 31. | Belmont | 4.01% | 0.33%(+3.68)#31 | 0.12%(+3.89)#111 |
| 32. | East Mckeesport Borough | 3.91% | 0.33%(+3.57)#32 | 0.12%(+3.78)#115 |
| 33. | Monaca Borough | 3.79% | 0.33%(+3.46)#33 | 0.12%(+3.67)#120 |
| 34. | Hopwood | 3.79% | 0.33%(+3.45)#34 | 0.12%(+3.67)#123 |
| 35. | Meridian | 3.73% | 0.33%(+3.40)#35 | 0.12%(+3.61)#125 |
| 36. | Loop | 3.72% | 0.33%(+3.39)#36 | 0.12%(+3.60)#126 |
| 37. | White Oak Borough | 3.70% | 0.33%(+3.37)#37 | 0.12%(+3.58)#127 |
| 38. | New Salem | 3.69% | 0.33%(+3.36)#38 | 0.12%(+3.57)#128 |
| 39. | Ellsworth Borough | 3.69% | 0.33%(+3.36)#39 | 0.12%(+3.57)#129 |
| 40. | Marianna Borough | 3.66% | 0.33%(+3.32)#40 | 0.12%(+3.54)#132 |
| 41. | Leith Hatfield | 3.59% | 0.33%(+3.25)#41 | 0.12%(+3.46)#134 |
| 42. | Bressler | 3.47% | 0.33%(+3.14)#42 | 0.12%(+3.35)#139 |
| 43. | Versailles Borough | 3.40% | 0.33%(+3.06)#43 | 0.12%(+3.27)#145 |
| 44. | Grindstone | 3.39% | 0.33%(+3.06)#44 | 0.12%(+3.27)#146 |
| 45. | Braddock Hills Borough | 3.32% | 0.33%(+2.99)#45 | 0.12%(+3.20)#156 |
| 46. | Cokeburg Borough | 3.32% | 0.33%(+2.98)#46 | 0.12%(+3.20)#158 |
| 47. | Finleyville Borough | 3.31% | 0.33%(+2.97)#47 | 0.12%(+3.19)#160 |
| 48. | South Heights Borough | 3.30% | 0.33%(+2.97)#48 | 0.12%(+3.18)#161 |
| 49. | Bridgewater Borough | 3.30% | 0.33%(+2.97)#49 | 0.12%(+3.18)#162 |
| 50. | Baden Borough | 3.29% | 0.33%(+2.96)#50 | 0.12%(+3.17)#165 |
| 51. | Red Hill | 3.21% | 0.33%(+2.88)#51 | 0.12%(+3.09)#169 |
| 52. | Grapeville | 3.21% | 0.33%(+2.87)#52 | 0.12%(+3.09)#170 |
| 53. | Rennerdale | 3.14% | 0.33%(+2.81)#53 | 0.12%(+3.02)#174 |
| 54. | Homewood Borough | 3.12% | 0.33%(+2.79)#54 | 0.12%(+3.00)#176 |
| 55. | Tylersburg | 3.09% | 0.33%(+2.76)#55 | 0.12%(+2.97)#180 |
| 56. | East Brady Borough | 3.08% | 0.33%(+2.75)#56 | 0.12%(+2.96)#181 |
| 57. | Sewickley Hills Borough | 3.01% | 0.33%(+2.68)#57 | 0.12%(+2.89)#189 |
| 58. | Continental Courts | 3.00% | 0.33%(+2.66)#58 | 0.12%(+2.88)#191 |
| 59. | Riverside | 3.00% | 0.33%(+2.66)#59 | 0.12%(+2.88)#192 |
| 60. | New Bedford | 2.97% | 0.33%(+2.64)#60 | 0.12%(+2.85)#194 |
| 61. | Big Beaver Borough | 2.95% | 0.33%(+2.62)#61 | 0.12%(+2.83)#198 |
| 62. | Verona Borough | 2.89% | 0.33%(+2.56)#62 | 0.12%(+2.77)#204 |
| 63. | New Market | 2.86% | 0.33%(+2.53)#63 | 0.12%(+2.74)#206 |
| 64. | Fallston Borough | 2.84% | 0.33%(+2.51)#64 | 0.12%(+2.72)#207 |
| 65. | Laurel Mountain Borough | 2.83% | 0.33%(+2.50)#65 | 0.12%(+2.71)#208 |
| 66. | Economy Borough | 2.82% | 0.33%(+2.49)#66 | 0.12%(+2.70)#209 |
| 67. | Brownsville Borough | 2.77% | 0.33%(+2.43)#67 | 0.12%(+2.65)#213 |
| 68. | Fellsburg | 2.72% | 0.33%(+2.39)#68 | 0.12%(+2.60)#219 |
| 69. | Midland Borough | 2.67% | 0.33%(+2.34)#69 | 0.12%(+2.55)#223 |
| 70. | Spring Hill | 2.58% | 0.33%(+2.24)#70 | 0.12%(+2.46)#230 |
| 71. | Bulger | 2.55% | 0.33%(+2.22)#71 | 0.12%(+2.43)#235 |
| 72. | Plum Borough | 2.52% | 0.33%(+2.19)#72 | 0.12%(+2.40)#237 |
| 73. | Wickerham Manor Fisher | 2.50% | 0.33%(+2.17)#73 | 0.12%(+2.38)#241 |
| 74. | Westmont Borough | 2.48% | 0.33%(+2.15)#74 | 0.12%(+2.36)#242 |
| 75. | Chalfant Borough | 2.47% | 0.33%(+2.13)#75 | 0.12%(+2.34)#244 |
| 76. | Enon Valley Borough | 2.45% | 0.33%(+2.12)#76 | 0.12%(+2.33)#247 |
| 77. | Harwick | 2.44% | 0.33%(+2.10)#77 | 0.12%(+2.32)#251 |
| 78. | New Castle Northwest | 2.43% | 0.33%(+2.10)#78 | 0.12%(+2.31)#252 |
| 79. | Ernest Borough | 2.36% | 0.33%(+2.03)#79 | 0.12%(+2.24)#263 |
| 80. | Lynnwood Pricedale | 2.35% | 0.33%(+2.01)#80 | 0.12%(+2.23)#266 |
| 81. | Ambridge Borough | 2.34% | 0.33%(+2.00)#81 | 0.12%(+2.21)#267 |
| 82. | New Wilmington Borough | 2.32% | 0.33%(+1.99)#82 | 0.12%(+2.20)#270 |
| 83. | Beaver Borough | 2.31% | 0.33%(+1.98)#83 | 0.12%(+2.19)#271 |
| 84. | Lewisberry Borough | 2.29% | 0.33%(+1.95)#84 | 0.12%(+2.17)#279 |
| 85. | Liberty Borough Allegheny County | 2.28% | 0.33%(+1.95)#85 | 0.12%(+2.16)#280 |
| 86. | Smock | 2.22% | 0.33%(+1.89)#86 | 0.12%(+2.10)#292 |
| 87. | Cheswick Borough | 2.14% | 0.33%(+1.80)#87 | 0.12%(+2.02)#304 |
| 88. | Vowinckel | 2.13% | 0.33%(+1.79)#88 | 0.12%(+2.01)#306 |
| 89. | Zelienople Borough | 2.09% | 0.33%(+1.76)#89 | 0.12%(+1.97)#310 |
| 90. | Mars Borough | 2.05% | 0.33%(+1.72)#90 | 0.12%(+1.93)#320 |
| 91. | Mcmurray | 2.04% | 0.33%(+1.71)#91 | 0.12%(+1.92)#322 |
| 92. | Ferndale Borough | 1.98% | 0.33%(+1.65)#92 | 0.12%(+1.86)#331 |
| 93. | Forest Hills Borough | 1.97% | 0.33%(+1.64)#93 | 0.12%(+1.85)#333 |
| 94. | Ben Avon Heights Borough | 1.92% | 0.33%(+1.59)#94 | 0.12%(+1.80)#351 |
| 95. | West View Borough | 1.91% | 0.33%(+1.57)#95 | 0.12%(+1.79)#359 |
| 96. | Emsworth Borough | 1.90% | 0.33%(+1.57)#96 | 0.12%(+1.78)#361 |
| 97. | Georgetown Borough | 1.90% | 0.33%(+1.56)#97 | 0.12%(+1.78)#363 |
| 98. | Enola | 1.89% | 0.33%(+1.56)#98 | 0.12%(+1.77)#366 |
| 99. | Koppel Borough | 1.88% | 0.33%(+1.55)#99 | 0.12%(+1.76)#368 |
| 100. | Blooming Valley Borough | 1.87% | 0.33%(+1.54)#100 | 0.12%(+1.75)#371 |
Common Questions
What are the Top 10 Cities with the Highest Percentage of Croatian Population in Pennsylvania?
Top 10 Cities with the Highest Percentage of Croatian Population in Pennsylvania are:
#1
28.69%
#2
17.41%
#3
12.85%
#4
9.46%
#5
8.12%
#6
8.10%
#7
8.07%
#8
7.55%
#9
7.20%
#10
6.76%
What city has the Highest Percentage of Croatian Population in Pennsylvania?
Yukon has the Highest Percentage of Croatian Population in Pennsylvania with 28.69%.
What is the Percentage of Croatian Population in the State of Pennsylvania?
Percentage of Croatian Population in Pennsylvania is 0.33%.
What is the Percentage of Croatian Population in the United States?
Percentage of Croatian Population in the United States is 0.12%.