Zip Codes with the Highest Percentage of Population Employed in Food Preparation & Serving in Pennsylvania
RELATED REPORTS & OPTIONS
Food Preparation & Serving
Pennsylvania
Compare Zip Codes
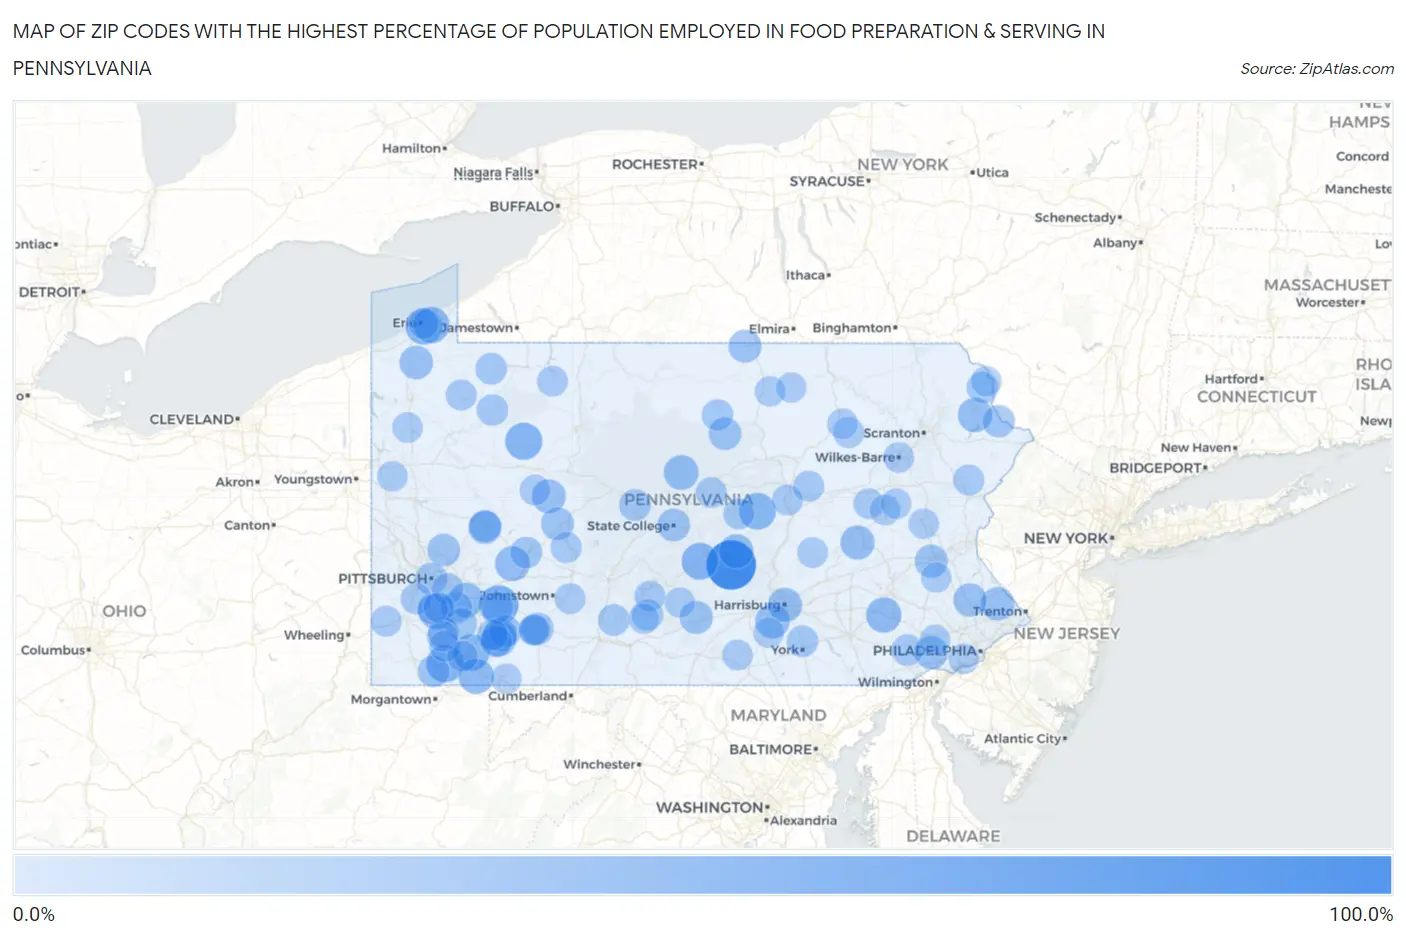
Map of Zip Codes with the Highest Percentage of Population Employed in Food Preparation & Serving in Pennsylvania
0.0%
100.0%
Zip Codes with the Highest Percentage of Population Employed in Food Preparation & Serving in Pennsylvania
| Zip Code | % Employed | vs State | vs National | |
| 1. | 17056 | 100.0% | 5.0%(+95.0)#1 | 5.3%(+94.7)#12 |
| 2. | 15638 | 53.2% | 5.0%(+48.2)#2 | 5.3%(+47.9)#46 |
| 3. | 15454 | 43.1% | 5.0%(+38.0)#3 | 5.3%(+37.8)#86 |
| 4. | 16217 | 42.9% | 5.0%(+37.8)#4 | 5.3%(+37.6)#87 |
| 5. | 17029 | 41.4% | 5.0%(+36.3)#5 | 5.3%(+36.1)#95 |
| 6. | 17880 | 40.9% | 5.0%(+35.9)#6 | 5.3%(+35.6)#97 |
| 7. | 15465 | 40.7% | 5.0%(+35.7)#7 | 5.3%(+35.5)#99 |
| 8. | 16546 | 40.5% | 5.0%(+35.5)#8 | 5.3%(+35.2)#100 |
| 9. | 16563 | 39.0% | 5.0%(+33.9)#9 | 5.3%(+33.7)#110 |
| 10. | 15020 | 35.9% | 5.0%(+30.9)#10 | 5.3%(+30.6)#140 |
| 11. | 15446 | 34.7% | 5.0%(+29.7)#11 | 5.3%(+29.4)#153 |
| 12. | 15437 | 34.5% | 5.0%(+29.5)#12 | 5.3%(+29.2)#156 |
| 13. | 17507 | 34.2% | 5.0%(+29.1)#13 | 5.3%(+28.9)#160 |
| 14. | 15752 | 32.1% | 5.0%(+27.1)#14 | 5.3%(+26.9)#182 |
| 15. | 16864 | 31.6% | 5.0%(+26.5)#15 | 5.3%(+26.3)#188 |
| 16. | 15691 | 31.6% | 5.0%(+26.5)#16 | 5.3%(+26.3)#190 |
| 17. | 17027 | 30.5% | 5.0%(+25.5)#17 | 5.3%(+25.3)#201 |
| 18. | 18473 | 30.1% | 5.0%(+25.1)#18 | 5.3%(+24.8)#207 |
| 19. | 17076 | 30.1% | 5.0%(+25.0)#19 | 5.3%(+24.8)#208 |
| 20. | 17101 | 29.7% | 5.0%(+24.7)#20 | 5.3%(+24.4)#217 |
| 21. | 17951 | 29.3% | 5.0%(+24.2)#21 | 5.3%(+24.0)#226 |
| 22. | 15733 | 28.0% | 5.0%(+23.0)#22 | 5.3%(+22.7)#248 |
| 23. | 16444 | 26.5% | 5.0%(+21.4)#23 | 5.3%(+21.2)#272 |
| 24. | 15462 | 26.3% | 5.0%(+21.2)#24 | 5.3%(+21.0)#278 |
| 25. | 18980 | 26.2% | 5.0%(+21.2)#25 | 5.3%(+20.9)#280 |
| 26. | 19383 | 26.2% | 5.0%(+21.2)#26 | 5.3%(+20.9)#281 |
| 27. | 18932 | 25.8% | 5.0%(+20.7)#27 | 5.3%(+20.5)#293 |
| 28. | 18087 | 24.7% | 5.0%(+19.7)#28 | 5.3%(+19.4)#321 |
| 29. | 17210 | 24.6% | 5.0%(+19.5)#29 | 5.3%(+19.3)#325 |
| 30. | 16236 | 24.1% | 5.0%(+19.1)#30 | 5.3%(+18.9)#336 |
| 31. | 16940 | 24.0% | 5.0%(+19.0)#31 | 5.3%(+18.7)#343 |
| 32. | 15741 | 23.5% | 5.0%(+18.5)#32 | 5.3%(+18.2)#366 |
| 33. | 16802 | 22.6% | 5.0%(+17.6)#33 | 5.3%(+17.3)#394 |
| 34. | 15006 | 22.6% | 5.0%(+17.6)#34 | 5.3%(+17.3)#396 |
| 35. | 17739 | 22.2% | 5.0%(+17.2)#35 | 5.3%(+16.9)#413 |
| 36. | 15520 | 21.7% | 5.0%(+16.6)#36 | 5.3%(+16.4)#432 |
| 37. | 15646 | 21.4% | 5.0%(+16.3)#37 | 5.3%(+16.1)#443 |
| 38. | 18435 | 20.6% | 5.0%(+15.5)#38 | 5.3%(+15.3)#475 |
| 39. | 16238 | 20.1% | 5.0%(+15.1)#39 | 5.3%(+14.8)#497 |
| 40. | 15282 | 19.9% | 5.0%(+14.8)#40 | 5.3%(+14.6)#513 |
| 41. | 15660 | 18.9% | 5.0%(+13.8)#41 | 5.3%(+13.6)#578 |
| 42. | 15448 | 18.6% | 5.0%(+13.6)#42 | 5.3%(+13.3)#602 |
| 43. | 15334 | 18.4% | 5.0%(+13.4)#43 | 5.3%(+13.2)#615 |
| 44. | 15705 | 18.3% | 5.0%(+13.3)#44 | 5.3%(+13.0)#625 |
| 45. | 16840 | 18.3% | 5.0%(+13.3)#45 | 5.3%(+13.0)#626 |
| 46. | 16416 | 18.2% | 5.0%(+13.1)#46 | 5.3%(+12.9)#641 |
| 47. | 15469 | 18.1% | 5.0%(+13.0)#47 | 5.3%(+12.8)#649 |
| 48. | 16659 | 17.9% | 5.0%(+12.9)#48 | 5.3%(+12.6)#670 |
| 49. | 19358 | 17.6% | 5.0%(+12.6)#49 | 5.3%(+12.4)#686 |
| 50. | 17318 | 17.6% | 5.0%(+12.6)#50 | 5.3%(+12.3)#692 |
| 51. | 16370 | 17.3% | 5.0%(+12.3)#51 | 5.3%(+12.0)#720 |
| 52. | 16674 | 17.2% | 5.0%(+12.2)#52 | 5.3%(+12.0)#725 |
| 53. | 15110 | 17.0% | 5.0%(+12.0)#53 | 5.3%(+11.7)#751 |
| 54. | 18469 | 16.9% | 5.0%(+11.8)#54 | 5.3%(+11.6)#760 |
| 55. | 17727 | 16.7% | 5.0%(+11.6)#55 | 5.3%(+11.4)#787 |
| 56. | 15693 | 16.5% | 5.0%(+11.5)#56 | 5.3%(+11.2)#799 |
| 57. | 15555 | 16.4% | 5.0%(+11.4)#57 | 5.3%(+11.1)#806 |
| 58. | 15434 | 16.2% | 5.0%(+11.1)#58 | 5.3%(+10.9)#837 |
| 59. | 15413 | 16.0% | 5.0%(+11.0)#59 | 5.3%(+10.7)#864 |
| 60. | 15760 | 15.8% | 5.0%(+10.7)#60 | 5.3%(+10.5)#884 |
| 61. | 15490 | 15.6% | 5.0%(+10.6)#61 | 5.3%(+10.3)#904 |
| 62. | 15055 | 15.6% | 5.0%(+10.5)#62 | 5.3%(+10.3)#909 |
| 63. | 18332 | 15.2% | 5.0%(+10.1)#63 | 5.3%(+9.87)#961 |
| 64. | 16328 | 15.1% | 5.0%(+10.1)#64 | 5.3%(+9.83)#966 |
| 65. | 17884 | 15.1% | 5.0%(+10.1)#65 | 5.3%(+9.81)#969 |
| 66. | 16848 | 15.0% | 5.0%(+10.0)#66 | 5.3%(+9.76)#978 |
| 67. | 17885 | 14.8% | 5.0%(+9.74)#67 | 5.3%(+9.50)#1,011 |
| 68. | 17850 | 14.7% | 5.0%(+9.68)#68 | 5.3%(+9.44)#1,026 |
| 69. | 18628 | 14.6% | 5.0%(+9.59)#69 | 5.3%(+9.35)#1,039 |
| 70. | 15365 | 14.4% | 5.0%(+9.40)#70 | 5.3%(+9.16)#1,072 |
| 71. | 15952 | 14.4% | 5.0%(+9.35)#71 | 5.3%(+9.11)#1,080 |
| 72. | 16622 | 14.3% | 5.0%(+9.24)#72 | 5.3%(+9.00)#1,105 |
| 73. | 17978 | 14.2% | 5.0%(+9.14)#73 | 5.3%(+8.89)#1,127 |
| 74. | 16333 | 14.1% | 5.0%(+9.04)#74 | 5.3%(+8.80)#1,145 |
| 75. | 18701 | 13.6% | 5.0%(+8.60)#75 | 5.3%(+8.35)#1,242 |
| 76. | 15472 | 13.6% | 5.0%(+8.59)#76 | 5.3%(+8.35)#1,246 |
| 77. | 15332 | 13.6% | 5.0%(+8.53)#77 | 5.3%(+8.29)#1,258 |
| 78. | 15038 | 13.6% | 5.0%(+8.53)#78 | 5.3%(+8.29)#1,259 |
| 79. | 18256 | 13.6% | 5.0%(+8.52)#79 | 5.3%(+8.27)#1,261 |
| 80. | 16151 | 13.5% | 5.0%(+8.47)#80 | 5.3%(+8.23)#1,275 |
| 81. | 15730 | 13.4% | 5.0%(+8.39)#81 | 5.3%(+8.15)#1,290 |
| 82. | 15419 | 13.4% | 5.0%(+8.31)#82 | 5.3%(+8.06)#1,300 |
| 83. | 17303 | 13.2% | 5.0%(+8.11)#83 | 5.3%(+7.87)#1,354 |
| 84. | 16172 | 13.1% | 5.0%(+8.08)#84 | 5.3%(+7.84)#1,364 |
| 85. | 18632 | 12.9% | 5.0%(+7.91)#85 | 5.3%(+7.66)#1,404 |
| 86. | 17323 | 12.9% | 5.0%(+7.86)#86 | 5.3%(+7.62)#1,419 |
| 87. | 18030 | 12.8% | 5.0%(+7.71)#87 | 5.3%(+7.47)#1,452 |
| 88. | 19043 | 12.7% | 5.0%(+7.62)#88 | 5.3%(+7.38)#1,479 |
| 89. | 18415 | 12.6% | 5.0%(+7.56)#89 | 5.3%(+7.32)#1,491 |
| 90. | 15411 | 12.6% | 5.0%(+7.53)#90 | 5.3%(+7.29)#1,501 |
| 91. | 19345 | 12.5% | 5.0%(+7.46)#91 | 5.3%(+7.21)#1,514 |
| 92. | 18231 | 12.5% | 5.0%(+7.46)#92 | 5.3%(+7.21)#1,516 |
| 93. | 15561 | 12.5% | 5.0%(+7.46)#93 | 5.3%(+7.21)#1,523 |
| 94. | 16694 | 12.4% | 5.0%(+7.36)#94 | 5.3%(+7.12)#1,540 |
| 95. | 16503 | 12.4% | 5.0%(+7.35)#95 | 5.3%(+7.11)#1,542 |
| 96. | 18056 | 12.4% | 5.0%(+7.35)#96 | 5.3%(+7.10)#1,543 |
| 97. | 18216 | 12.4% | 5.0%(+7.34)#97 | 5.3%(+7.10)#1,545 |
| 98. | 16939 | 12.3% | 5.0%(+7.24)#98 | 5.3%(+6.99)#1,572 |
| 99. | 17243 | 12.2% | 5.0%(+7.13)#99 | 5.3%(+6.88)#1,608 |
| 100. | 16910 | 12.1% | 5.0%(+7.08)#100 | 5.3%(+6.84)#1,625 |
Common Questions
What are the Top 10 Zip Codes with the Highest Percentage of Population Employed in Food Preparation & Serving in Pennsylvania?
Top 10 Zip Codes with the Highest Percentage of Population Employed in Food Preparation & Serving in Pennsylvania are:
What zip code has the Highest Percentage of Population Employed in Food Preparation & Serving in Pennsylvania?
17056 has the Highest Percentage of Population Employed in Food Preparation & Serving in Pennsylvania with 100.0%.
What is the Percentage of Population Employed in Food Preparation & Serving in the State of Pennsylvania?
Percentage of Population Employed in Food Preparation & Serving in Pennsylvania is 5.0%.
What is the Percentage of Population Employed in Food Preparation & Serving in the United States?
Percentage of Population Employed in Food Preparation & Serving in the United States is 5.3%.