Cities with the Highest Percentage of Scotch-Irish Population in Pennsylvania
RELATED REPORTS & OPTIONS
Scotch-Irish
Pennsylvania
Compare Cities
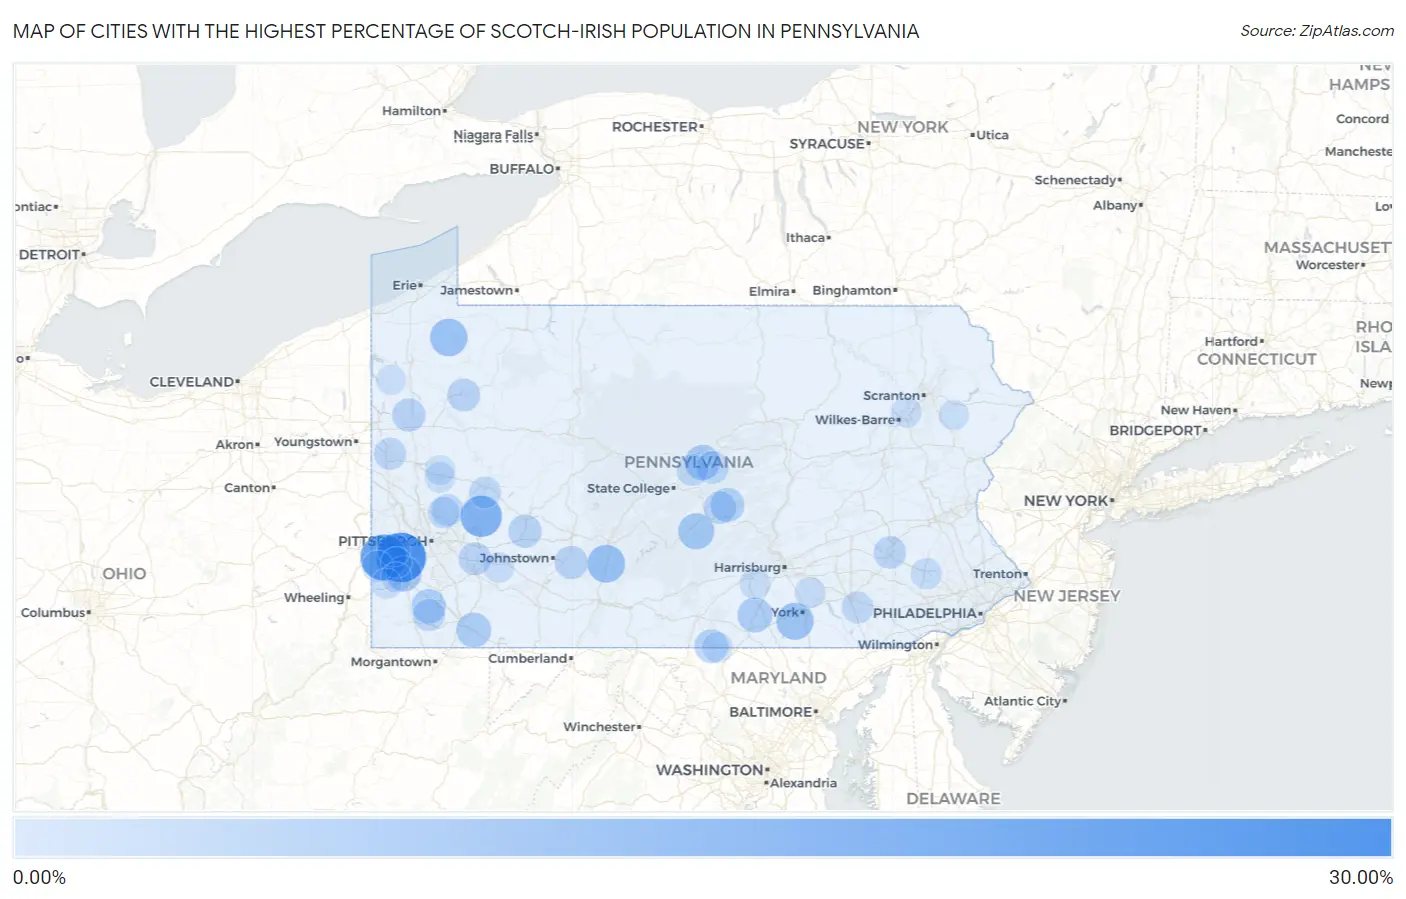
Map of Cities with the Highest Percentage of Scotch-Irish Population in Pennsylvania
0.00%
30.00%
Cities with the Highest Percentage of Scotch-Irish Population in Pennsylvania
| City | Scotch-Irish | vs State | vs National | |
| 1. | Southview | 26.92% | 0.97%(+26.0)#1 | 0.82%(+26.1)#43 |
| 2. | Oreminea | 23.00% | 0.97%(+22.0)#2 | 0.82%(+22.2)#56 |
| 3. | Cross Creek | 22.96% | 0.97%(+22.0)#3 | 0.82%(+22.1)#57 |
| 4. | North Vandergrift | 17.30% | 0.97%(+16.3)#4 | 0.82%(+16.5)#111 |
| 5. | Haysville Borough | 16.94% | 0.97%(+16.0)#5 | 0.82%(+16.1)#118 |
| 6. | Wilmore Borough | 13.59% | 0.97%(+12.6)#6 | 0.82%(+12.8)#172 |
| 7. | Claysburg | 13.24% | 0.97%(+12.3)#7 | 0.82%(+12.4)#181 |
| 8. | Lincolnville | 12.90% | 0.97%(+11.9)#8 | 0.82%(+12.1)#191 |
| 9. | Barkeyville Borough | 12.70% | 0.97%(+11.7)#9 | 0.82%(+11.9)#194 |
| 10. | New Salem | 12.41% | 0.97%(+11.4)#10 | 0.82%(+11.6)#201 |
| 11. | Beallsville Borough | 12.22% | 0.97%(+11.3)#11 | 0.82%(+11.4)#206 |
| 12. | Chicora Borough | 11.88% | 0.97%(+10.9)#12 | 0.82%(+11.1)#218 |
| 13. | Longfellow | 11.34% | 0.97%(+10.4)#13 | 0.82%(+10.5)#234 |
| 14. | Meadowlands | 10.58% | 0.97%(+9.62)#14 | 0.82%(+9.76)#256 |
| 15. | Hublersburg | 10.29% | 0.97%(+9.33)#15 | 0.82%(+9.48)#272 |
| 16. | Heidlersburg | 10.00% | 0.97%(+9.03)#16 | 0.82%(+9.18)#287 |
| 17. | Chalkhill | 9.86% | 0.97%(+8.89)#17 | 0.82%(+9.04)#293 |
| 18. | Claysville Borough | 9.75% | 0.97%(+8.78)#18 | 0.82%(+8.93)#299 |
| 19. | Orbisonia Borough | 9.56% | 0.97%(+8.60)#19 | 0.82%(+8.75)#306 |
| 20. | Fredericktown | 9.46% | 0.97%(+8.49)#20 | 0.82%(+8.64)#312 |
| 21. | Newry Borough | 9.23% | 0.97%(+8.27)#21 | 0.82%(+8.41)#329 |
| 22. | Manorville Borough | 9.15% | 0.97%(+8.19)#22 | 0.82%(+8.34)#333 |
| 23. | Wagner | 8.89% | 0.97%(+7.92)#23 | 0.82%(+8.07)#348 |
| 24. | Duncannon Borough | 8.82% | 0.97%(+7.85)#24 | 0.82%(+8.00)#353 |
| 25. | Shade Gap Borough | 8.60% | 0.97%(+7.64)#25 | 0.82%(+7.78)#362 |
| 26. | Harrisville Borough | 8.55% | 0.97%(+7.59)#26 | 0.82%(+7.74)#365 |
| 27. | Rouzerville | 8.52% | 0.97%(+7.55)#27 | 0.82%(+7.70)#367 |
| 28. | Cherry Valley Borough | 8.33% | 0.97%(+7.37)#28 | 0.82%(+7.52)#380 |
| 29. | Eau Claire Borough | 8.26% | 0.97%(+7.29)#29 | 0.82%(+7.44)#386 |
| 30. | Salix | 8.11% | 0.97%(+7.15)#30 | 0.82%(+7.30)#399 |
| 31. | Lake Latonka | 8.01% | 0.97%(+7.05)#31 | 0.82%(+7.19)#405 |
| 32. | Graceton | 8.00% | 0.97%(+7.03)#32 | 0.82%(+7.18)#406 |
| 33. | Woodland Heights | 7.69% | 0.97%(+6.73)#33 | 0.82%(+6.87)#434 |
| 34. | Cove Forge | 7.69% | 0.97%(+6.73)#34 | 0.82%(+6.87)#435 |
| 35. | Bulger | 7.64% | 0.97%(+6.68)#35 | 0.82%(+6.83)#443 |
| 36. | Grapeville | 7.58% | 0.97%(+6.61)#36 | 0.82%(+6.76)#448 |
| 37. | Alfarata | 7.53% | 0.97%(+6.57)#37 | 0.82%(+6.72)#454 |
| 38. | Leechburg Borough | 7.53% | 0.97%(+6.56)#38 | 0.82%(+6.71)#455 |
| 39. | Hookstown Borough | 7.53% | 0.97%(+6.56)#39 | 0.82%(+6.71)#457 |
| 40. | New Florence Borough | 7.40% | 0.97%(+6.43)#40 | 0.82%(+6.58)#474 |
| 41. | Madisonburg | 7.35% | 0.97%(+6.39)#41 | 0.82%(+6.54)#480 |
| 42. | Utica Borough | 7.32% | 0.97%(+6.35)#42 | 0.82%(+6.50)#489 |
| 43. | Greenfields | 7.21% | 0.97%(+6.24)#43 | 0.82%(+6.39)#505 |
| 44. | Benson Borough | 7.19% | 0.97%(+6.23)#44 | 0.82%(+6.38)#508 |
| 45. | Allenport Borough | 7.08% | 0.97%(+6.12)#45 | 0.82%(+6.26)#528 |
| 46. | Dry Tavern | 7.02% | 0.97%(+6.05)#46 | 0.82%(+6.20)#533 |
| 47. | New Castle Northwest | 7.01% | 0.97%(+6.05)#47 | 0.82%(+6.20)#536 |
| 48. | Connoquenessing Borough | 6.96% | 0.97%(+5.99)#48 | 0.82%(+6.14)#544 |
| 49. | East Rochester Borough | 6.93% | 0.97%(+5.96)#49 | 0.82%(+6.11)#549 |
| 50. | Wampum Borough | 6.76% | 0.97%(+5.80)#50 | 0.82%(+5.94)#567 |
| 51. | Lampeter | 6.67% | 0.97%(+5.70)#51 | 0.82%(+5.85)#577 |
| 52. | Glassport Borough | 6.56% | 0.97%(+5.59)#52 | 0.82%(+5.74)#589 |
| 53. | Mill Run | 6.54% | 0.97%(+5.58)#53 | 0.82%(+5.72)#592 |
| 54. | Monaca Borough | 6.52% | 0.97%(+5.55)#54 | 0.82%(+5.70)#600 |
| 55. | Curtisville | 6.50% | 0.97%(+5.53)#55 | 0.82%(+5.68)#602 |
| 56. | Lenape Heights | 6.43% | 0.97%(+5.47)#56 | 0.82%(+5.62)#611 |
| 57. | Zion | 6.42% | 0.97%(+5.46)#57 | 0.82%(+5.61)#617 |
| 58. | Midway Borough | 6.31% | 0.97%(+5.35)#58 | 0.82%(+5.49)#643 |
| 59. | Bairdford | 6.28% | 0.97%(+5.31)#59 | 0.82%(+5.46)#646 |
| 60. | Homewood Borough | 6.25% | 0.97%(+5.28)#60 | 0.82%(+5.43)#652 |
| 61. | Atwood Borough | 6.15% | 0.97%(+5.18)#61 | 0.82%(+5.33)#664 |
| 62. | Cochranton Borough | 6.14% | 0.97%(+5.17)#62 | 0.82%(+5.32)#666 |
| 63. | Centerville Borough Crawford County | 6.03% | 0.97%(+5.07)#63 | 0.82%(+5.22)#687 |
| 64. | Mill Village Borough | 5.92% | 0.97%(+4.96)#64 | 0.82%(+5.10)#708 |
| 65. | Enon Valley Borough | 5.83% | 0.97%(+4.86)#65 | 0.82%(+5.01)#722 |
| 66. | Kenilworth | 5.77% | 0.97%(+4.80)#66 | 0.82%(+4.95)#731 |
| 67. | Avella | 5.76% | 0.97%(+4.80)#67 | 0.82%(+4.95)#733 |
| 68. | Shelocta Borough | 5.71% | 0.97%(+4.75)#68 | 0.82%(+4.90)#741 |
| 69. | East Brady Borough | 5.69% | 0.97%(+4.72)#69 | 0.82%(+4.87)#748 |
| 70. | Fredericksburg Cdp Lebanon County | 5.66% | 0.97%(+4.70)#70 | 0.82%(+4.84)#752 |
| 71. | Houston Borough | 5.65% | 0.97%(+4.68)#71 | 0.82%(+4.83)#755 |
| 72. | New Wilmington Borough | 5.61% | 0.97%(+4.64)#72 | 0.82%(+4.79)#760 |
| 73. | Pinecroft | 5.51% | 0.97%(+4.54)#73 | 0.82%(+4.69)#782 |
| 74. | Blue Ridge Summit | 5.49% | 0.97%(+4.52)#74 | 0.82%(+4.67)#793 |
| 75. | Yoe Borough | 5.47% | 0.97%(+4.51)#75 | 0.82%(+4.66)#796 |
| 76. | Boiling Springs | 5.41% | 0.97%(+4.45)#76 | 0.82%(+4.60)#807 |
| 77. | Bainbridge | 5.37% | 0.97%(+4.40)#77 | 0.82%(+4.55)#818 |
| 78. | Moose Run | 5.35% | 0.97%(+4.38)#78 | 0.82%(+4.53)#823 |
| 79. | Hickory | 5.35% | 0.97%(+4.38)#79 | 0.82%(+4.53)#825 |
| 80. | Ford City Borough | 5.33% | 0.97%(+4.37)#80 | 0.82%(+4.52)#829 |
| 81. | Hostetter | 5.29% | 0.97%(+4.33)#81 | 0.82%(+4.47)#839 |
| 82. | Wallaceton Borough | 5.28% | 0.97%(+4.32)#82 | 0.82%(+4.47)#841 |
| 83. | Mcveytown Borough | 5.26% | 0.97%(+4.30)#83 | 0.82%(+4.45)#846 |
| 84. | Burgettstown Borough | 5.25% | 0.97%(+4.29)#84 | 0.82%(+4.43)#850 |
| 85. | Biglerville Borough | 5.19% | 0.97%(+4.23)#85 | 0.82%(+4.38)#869 |
| 86. | Bentleyville Borough | 5.15% | 0.97%(+4.18)#86 | 0.82%(+4.33)#883 |
| 87. | Avonmore Borough | 5.10% | 0.97%(+4.13)#87 | 0.82%(+4.28)#903 |
| 88. | Crafton Borough | 5.00% | 0.97%(+4.03)#88 | 0.82%(+4.18)#933 |
| 89. | Inkerman | 4.98% | 0.97%(+4.02)#89 | 0.82%(+4.17)#940 |
| 90. | Taylorstown | 4.96% | 0.97%(+4.00)#90 | 0.82%(+4.14)#945 |
| 91. | Wolfdale | 4.94% | 0.97%(+3.98)#91 | 0.82%(+4.13)#954 |
| 92. | Rome Borough | 4.94% | 0.97%(+3.98)#92 | 0.82%(+4.13)#955 |
| 93. | Pocono Springs | 4.93% | 0.97%(+3.96)#93 | 0.82%(+4.11)#957 |
| 94. | Homeacre Lyndora | 4.92% | 0.97%(+3.95)#94 | 0.82%(+4.10)#960 |
| 95. | New Salem Borough | 4.84% | 0.97%(+3.88)#95 | 0.82%(+4.03)#990 |
| 96. | Shanor Northvue | 4.84% | 0.97%(+3.87)#96 | 0.82%(+4.02)#992 |
| 97. | Factoryville Borough | 4.82% | 0.97%(+3.85)#97 | 0.82%(+4.00)#996 |
| 98. | Aspinwall Borough | 4.81% | 0.97%(+3.84)#98 | 0.82%(+3.99)#1,000 |
| 99. | Atlantic | 4.69% | 0.97%(+3.72)#99 | 0.82%(+3.87)#1,043 |
| 100. | Mercer Borough | 4.67% | 0.97%(+3.70)#100 | 0.82%(+3.85)#1,050 |
Common Questions
What are the Top 10 Cities with the Highest Percentage of Scotch-Irish Population in Pennsylvania?
Top 10 Cities with the Highest Percentage of Scotch-Irish Population in Pennsylvania are:
#1
26.92%
#2
22.96%
#3
17.30%
#4
13.24%
#5
12.90%
#6
12.41%
#7
11.34%
#8
10.58%
#9
10.29%
#10
10.00%
What city has the Highest Percentage of Scotch-Irish Population in Pennsylvania?
Southview has the Highest Percentage of Scotch-Irish Population in Pennsylvania with 26.92%.
What is the Percentage of Scotch-Irish Population in the State of Pennsylvania?
Percentage of Scotch-Irish Population in Pennsylvania is 0.97%.
What is the Percentage of Scotch-Irish Population in the United States?
Percentage of Scotch-Irish Population in the United States is 0.82%.