Cities with the Highest Percentage of Population Employed in Production in Pennsylvania
RELATED REPORTS & OPTIONS
Production
Pennsylvania
Compare Cities
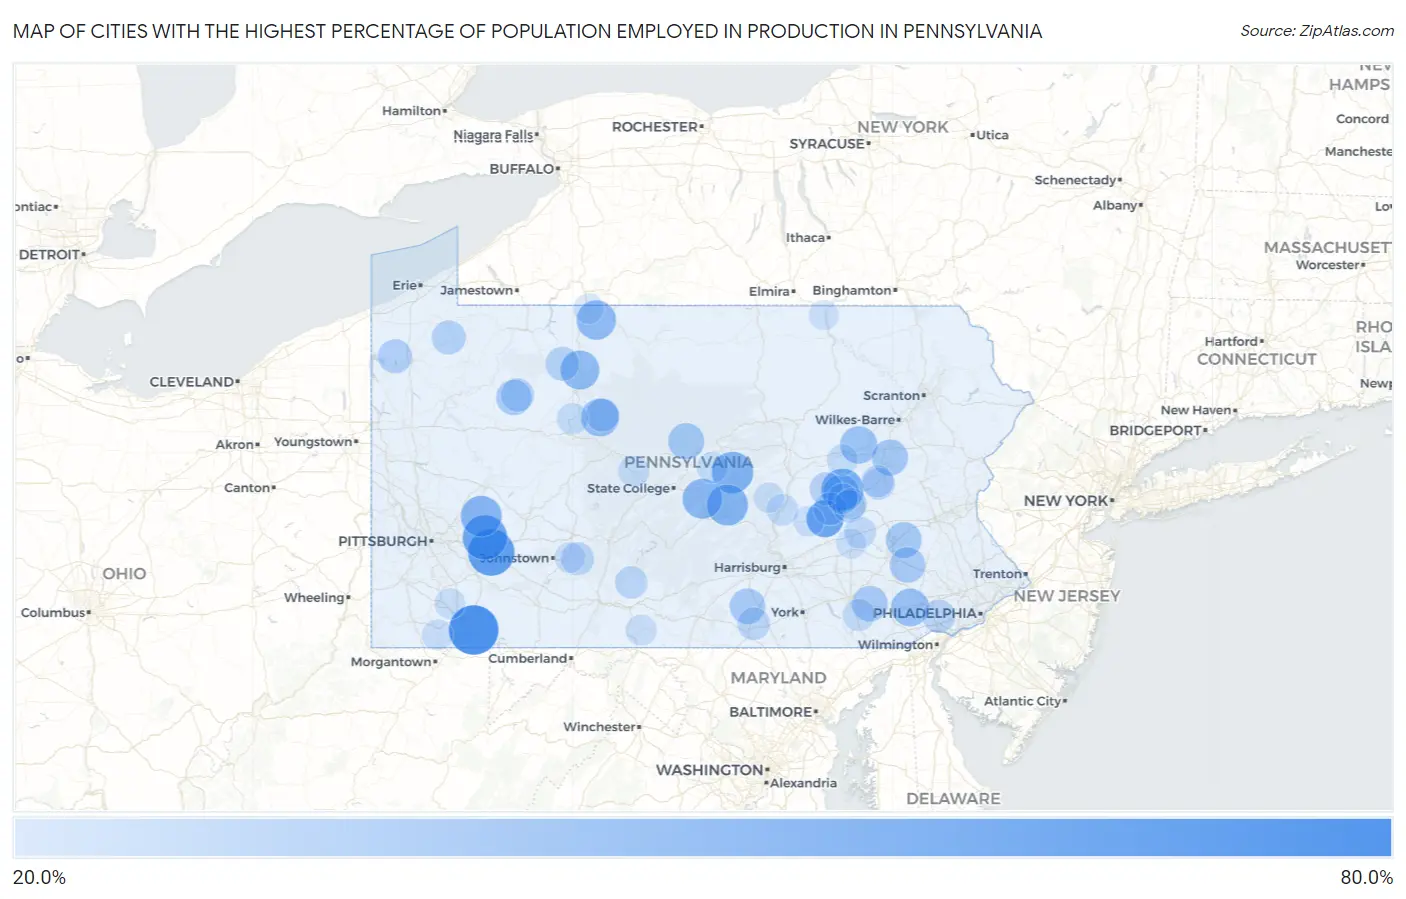
Map of Cities with the Highest Percentage of Population Employed in Production in Pennsylvania
0.0%
80.0%
Cities with the Highest Percentage of Population Employed in Production in Pennsylvania
| City | % Employed | vs State | vs National | |
| 1. | Chalkhill | 74.3% | 5.8%(+68.5)#1 | 5.5%(+68.8)#71 |
| 2. | Crabtree | 65.3% | 5.8%(+59.5)#2 | 5.5%(+59.9)#91 |
| 3. | Franklin Forge | 62.5% | 5.8%(+56.7)#3 | 5.5%(+57.0)#105 |
| 4. | Slickville | 60.0% | 5.8%(+54.2)#4 | 5.5%(+54.5)#117 |
| 5. | Casanova | 56.6% | 5.8%(+50.8)#5 | 5.5%(+51.1)#146 |
| 6. | Locustdale | 54.4% | 5.8%(+48.6)#6 | 5.5%(+48.9)#164 |
| 7. | Woodward | 51.4% | 5.8%(+45.5)#7 | 5.5%(+45.9)#187 |
| 8. | Wagner | 50.0% | 5.8%(+44.2)#8 | 5.5%(+44.5)#195 |
| 9. | Martinsburg Junction | 50.0% | 5.8%(+44.2)#9 | 5.5%(+44.5)#207 |
| 10. | North Vandergrift | 49.5% | 5.8%(+43.7)#10 | 5.5%(+44.1)#213 |
| 11. | Potlicker Flats | 46.7% | 5.8%(+40.9)#11 | 5.5%(+41.3)#245 |
| 12. | Charlottsville | 45.5% | 5.8%(+39.6)#12 | 5.5%(+40.0)#259 |
| 13. | Rew | 45.2% | 5.8%(+39.4)#13 | 5.5%(+39.8)#263 |
| 14. | Wilcox | 44.3% | 5.8%(+38.5)#14 | 5.5%(+38.8)#277 |
| 15. | East Altoona | 41.9% | 5.8%(+36.1)#15 | 5.5%(+36.4)#318 |
| 16. | Force | 41.6% | 5.8%(+35.8)#16 | 5.5%(+36.1)#327 |
| 17. | Caln | 41.4% | 5.8%(+35.6)#17 | 5.5%(+35.9)#328 |
| 18. | Culp | 40.7% | 5.8%(+34.9)#18 | 5.5%(+35.3)#342 |
| 19. | Foundryville | 40.0% | 5.8%(+34.2)#19 | 5.5%(+34.5)#351 |
| 20. | Reinerton | 39.2% | 5.8%(+33.3)#20 | 5.5%(+33.7)#381 |
| 21. | Orwin | 38.8% | 5.8%(+33.0)#21 | 5.5%(+33.4)#387 |
| 22. | Lavelle | 36.9% | 5.8%(+31.1)#22 | 5.5%(+31.4)#443 |
| 23. | Orviston | 36.8% | 5.8%(+31.0)#23 | 5.5%(+31.4)#445 |
| 24. | Jennerstown Borough | 36.8% | 5.8%(+31.0)#24 | 5.5%(+31.3)#446 |
| 25. | Lattimer | 36.4% | 5.8%(+30.6)#25 | 5.5%(+31.0)#453 |
| 26. | Walnuttown | 36.0% | 5.8%(+30.2)#26 | 5.5%(+30.5)#465 |
| 27. | Gardners | 35.2% | 5.8%(+29.4)#27 | 5.5%(+29.7)#493 |
| 28. | Gordonville | 35.0% | 5.8%(+29.2)#28 | 5.5%(+29.5)#506 |
| 29. | Baumstown | 34.7% | 5.8%(+28.9)#29 | 5.5%(+29.3)#513 |
| 30. | Crown | 34.2% | 5.8%(+28.4)#30 | 5.5%(+28.7)#527 |
| 31. | Claysville Borough | 33.9% | 5.8%(+28.1)#31 | 5.5%(+28.4)#542 |
| 32. | Cherry Tree Borough | 33.3% | 5.8%(+27.5)#32 | 5.5%(+27.9)#564 |
| 33. | Beavertown | 33.3% | 5.8%(+27.5)#33 | 5.5%(+27.9)#583 |
| 34. | Troutville Borough | 32.9% | 5.8%(+27.1)#34 | 5.5%(+27.4)#600 |
| 35. | Shirleysburg Borough | 31.6% | 5.8%(+25.8)#35 | 5.5%(+26.1)#670 |
| 36. | Dumb Hundred | 31.3% | 5.8%(+25.5)#36 | 5.5%(+25.9)#687 |
| 37. | Harmonsburg | 31.0% | 5.8%(+25.2)#37 | 5.5%(+25.5)#706 |
| 38. | Lincolnville | 30.8% | 5.8%(+25.0)#38 | 5.5%(+25.3)#727 |
| 39. | James City | 30.4% | 5.8%(+24.6)#39 | 5.5%(+24.9)#744 |
| 40. | Timblin Borough | 30.2% | 5.8%(+24.3)#40 | 5.5%(+24.7)#759 |
| 41. | Madison Borough | 29.4% | 5.8%(+23.6)#41 | 5.5%(+24.0)#806 |
| 42. | Westfield Borough | 29.2% | 5.8%(+23.4)#42 | 5.5%(+23.7)#825 |
| 43. | Weedville | 28.6% | 5.8%(+22.8)#43 | 5.5%(+23.2)#868 |
| 44. | Vowinckel | 28.6% | 5.8%(+22.8)#44 | 5.5%(+23.1)#874 |
| 45. | Ranshaw | 28.5% | 5.8%(+22.7)#45 | 5.5%(+23.0)#888 |
| 46. | Yellow Springs | 28.3% | 5.8%(+22.5)#46 | 5.5%(+22.8)#912 |
| 47. | Cheyney University | 27.9% | 5.8%(+22.1)#47 | 5.5%(+22.4)#937 |
| 48. | Aaronsburg Cdp Centre County | 27.9% | 5.8%(+22.1)#48 | 5.5%(+22.4)#941 |
| 49. | Beaverdale | 27.7% | 5.8%(+21.9)#49 | 5.5%(+22.2)#958 |
| 50. | Addison Borough | 27.7% | 5.8%(+21.9)#50 | 5.5%(+22.2)#960 |
| 51. | Hegins | 27.6% | 5.8%(+21.8)#51 | 5.5%(+22.1)#965 |
| 52. | Cassandra Borough | 27.6% | 5.8%(+21.8)#52 | 5.5%(+22.1)#970 |
| 53. | Hunterstown | 27.0% | 5.8%(+21.2)#53 | 5.5%(+21.6)#1,029 |
| 54. | Avonmore Borough | 26.7% | 5.8%(+20.9)#54 | 5.5%(+21.2)#1,058 |
| 55. | Defiance | 26.4% | 5.8%(+20.6)#55 | 5.5%(+20.9)#1,087 |
| 56. | Branchdale | 26.3% | 5.8%(+20.5)#56 | 5.5%(+20.8)#1,104 |
| 57. | Sheakleyville Borough | 26.0% | 5.8%(+20.2)#57 | 5.5%(+20.6)#1,130 |
| 58. | Ashland Borough | 25.9% | 5.8%(+20.1)#58 | 5.5%(+20.4)#1,148 |
| 59. | New Boston | 25.8% | 5.8%(+20.0)#59 | 5.5%(+20.3)#1,159 |
| 60. | Grier City | 25.5% | 5.8%(+19.7)#60 | 5.5%(+20.0)#1,198 |
| 61. | Delano | 25.5% | 5.8%(+19.6)#61 | 5.5%(+20.0)#1,200 |
| 62. | Refton | 25.3% | 5.8%(+19.5)#62 | 5.5%(+19.9)#1,216 |
| 63. | Schubert | 24.7% | 5.8%(+18.9)#63 | 5.5%(+19.2)#1,324 |
| 64. | Dalmatia | 24.2% | 5.8%(+18.4)#64 | 5.5%(+18.7)#1,390 |
| 65. | Laceyville Borough | 24.0% | 5.8%(+18.2)#65 | 5.5%(+18.6)#1,415 |
| 66. | Crenshaw | 24.0% | 5.8%(+18.2)#66 | 5.5%(+18.5)#1,418 |
| 67. | Forestville | 23.9% | 5.8%(+18.0)#67 | 5.5%(+18.4)#1,440 |
| 68. | Springboro Borough | 23.8% | 5.8%(+18.0)#68 | 5.5%(+18.3)#1,454 |
| 69. | Shade Gap Borough | 23.7% | 5.8%(+17.9)#69 | 5.5%(+18.2)#1,476 |
| 70. | Mcsherrystown Borough | 23.7% | 5.8%(+17.8)#70 | 5.5%(+18.2)#1,482 |
| 71. | Madisonburg | 23.5% | 5.8%(+17.7)#71 | 5.5%(+18.1)#1,499 |
| 72. | St. Clair | 23.5% | 5.8%(+17.7)#72 | 5.5%(+18.1)#1,502 |
| 73. | Burnside Borough | 23.4% | 5.8%(+17.6)#73 | 5.5%(+18.0)#1,514 |
| 74. | Newry Borough | 23.2% | 5.8%(+17.4)#74 | 5.5%(+17.8)#1,554 |
| 75. | Johnsonburg Borough | 23.2% | 5.8%(+17.3)#75 | 5.5%(+17.7)#1,567 |
| 76. | Mainville | 23.0% | 5.8%(+17.1)#76 | 5.5%(+17.5)#1,598 |
| 77. | North Philipsburg | 22.9% | 5.8%(+17.1)#77 | 5.5%(+17.5)#1,600 |
| 78. | Mapletown | 22.7% | 5.8%(+16.9)#78 | 5.5%(+17.3)#1,636 |
| 79. | Coalmont Borough | 22.7% | 5.8%(+16.9)#79 | 5.5%(+17.3)#1,639 |
| 80. | York Haven Borough | 22.4% | 5.8%(+16.6)#80 | 5.5%(+16.9)#1,687 |
| 81. | Robeson Extension | 22.1% | 5.8%(+16.2)#81 | 5.5%(+16.6)#1,761 |
| 82. | Needmore | 22.1% | 5.8%(+16.2)#82 | 5.5%(+16.6)#1,763 |
| 83. | St Michael | 22.0% | 5.8%(+16.2)#83 | 5.5%(+16.6)#1,766 |
| 84. | Grindstone | 22.0% | 5.8%(+16.1)#84 | 5.5%(+16.5)#1,783 |
| 85. | Karns City Borough | 22.0% | 5.8%(+16.1)#85 | 5.5%(+16.5)#1,785 |
| 86. | Wiconsico | 21.6% | 5.8%(+15.8)#86 | 5.5%(+16.1)#1,863 |
| 87. | Fleetwood Borough | 21.6% | 5.8%(+15.8)#87 | 5.5%(+16.1)#1,871 |
| 88. | Beurys Lake | 21.4% | 5.8%(+15.6)#88 | 5.5%(+16.0)#1,897 |
| 89. | Knoxville Borough | 21.3% | 5.8%(+15.5)#89 | 5.5%(+15.8)#1,928 |
| 90. | Kimberton | 21.2% | 5.8%(+15.4)#90 | 5.5%(+15.7)#1,953 |
| 91. | Fredonia Borough | 21.1% | 5.8%(+15.3)#91 | 5.5%(+15.7)#1,970 |
| 92. | Foster Brook | 21.1% | 5.8%(+15.3)#92 | 5.5%(+15.6)#1,975 |
| 93. | Mount Pleasant Mills | 21.0% | 5.8%(+15.2)#93 | 5.5%(+15.6)#2,002 |
| 94. | Thompsontown Borough | 20.9% | 5.8%(+15.1)#94 | 5.5%(+15.5)#2,022 |
| 95. | Big Run Borough | 20.9% | 5.8%(+15.1)#95 | 5.5%(+15.5)#2,023 |
| 96. | Wattsburg Borough | 20.9% | 5.8%(+15.1)#96 | 5.5%(+15.4)#2,027 |
| 97. | Greens Landing | 20.8% | 5.8%(+15.0)#97 | 5.5%(+15.3)#2,059 |
| 98. | Mifflintown Borough | 20.8% | 5.8%(+15.0)#98 | 5.5%(+15.3)#2,063 |
| 99. | Saegertown Borough | 20.5% | 5.8%(+14.7)#99 | 5.5%(+15.0)#2,128 |
| 100. | Mount Aetna | 20.5% | 5.8%(+14.7)#100 | 5.5%(+15.0)#2,133 |
Common Questions
What are the Top 10 Cities with the Highest Percentage of Population Employed in Production in Pennsylvania?
Top 10 Cities with the Highest Percentage of Population Employed in Production in Pennsylvania are:
#1
74.3%
#2
65.3%
#3
60.0%
#4
54.4%
#5
51.4%
#6
50.0%
#7
49.5%
#8
46.7%
#9
45.2%
#10
44.3%
What city has the Highest Percentage of Population Employed in Production in Pennsylvania?
Chalkhill has the Highest Percentage of Population Employed in Production in Pennsylvania with 74.3%.
What is the Percentage of Population Employed in Production in the State of Pennsylvania?
Percentage of Population Employed in Production in Pennsylvania is 5.8%.
What is the Percentage of Population Employed in Production in the United States?
Percentage of Population Employed in Production in the United States is 5.5%.