Stonerstown, PA Map & Demographics
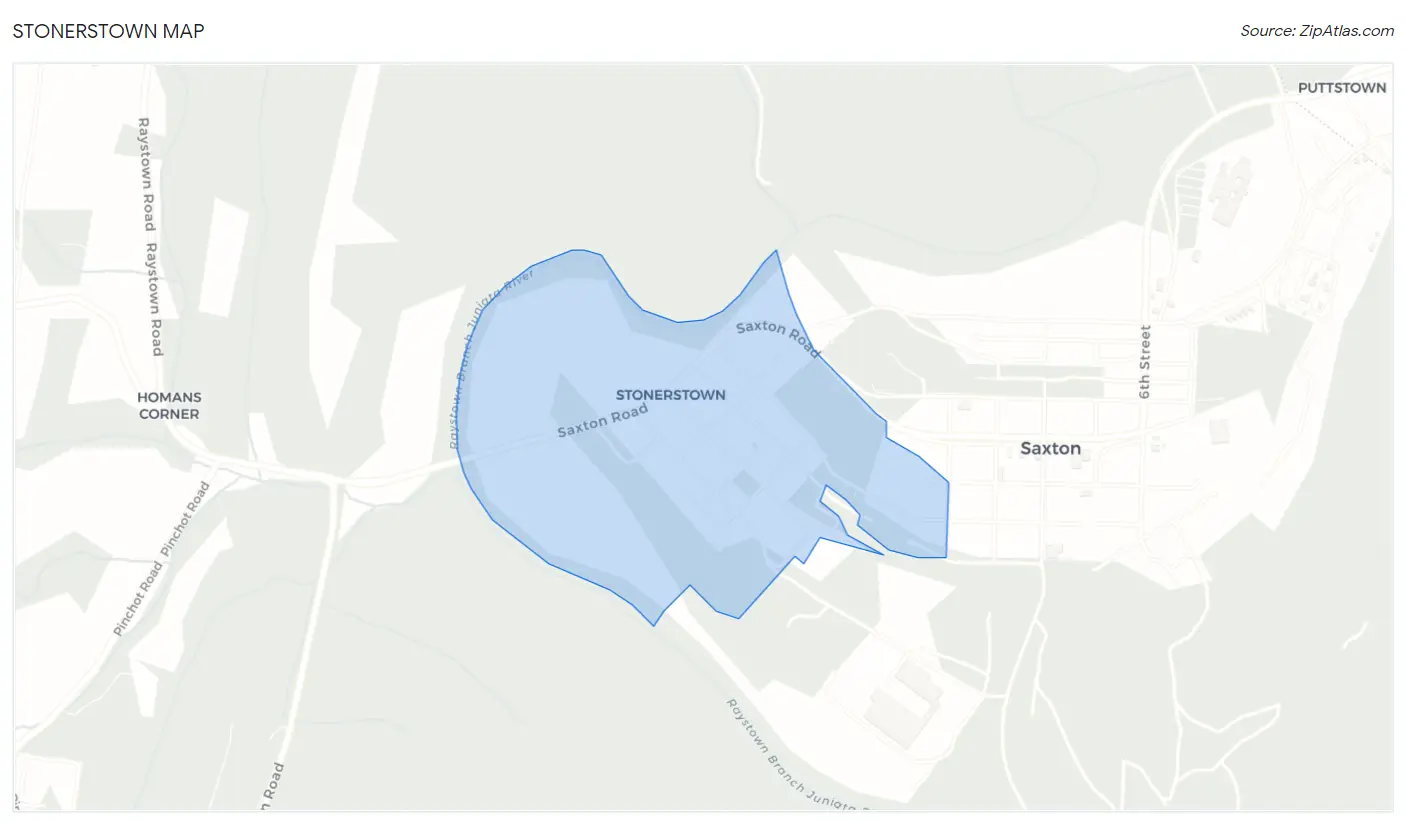
Stonerstown Map
Stonerstown Overview
$34,700
PER CAPITA INCOME
$63,750
AVG FAMILY INCOME
$58,333
AVG HOUSEHOLD INCOME
73.3%
WAGE / INCOME GAP [ % ]
26.7¢/ $1
WAGE / INCOME GAP [ $ ]
0.48
INEQUALITY / GINI INDEX
390
TOTAL POPULATION
183
MALE POPULATION
207
FEMALE POPULATION
88.41
MALES / 100 FEMALES
113.11
FEMALES / 100 MALES
44.1
MEDIAN AGE
2.9
AVG FAMILY SIZE
2.3
AVG HOUSEHOLD SIZE
194
LABOR FORCE [ PEOPLE ]
61.4%
PERCENT IN LABOR FORCE
8.8%
UNEMPLOYMENT RATE
Income in Stonerstown
Income Overview in Stonerstown
Per Capita Income in Stonerstown is $34,700, while median incomes of families and households are $63,750 and $58,333 respectively.
| Characteristic | Number | Measure |
| Per Capita Income | 390 | $34,700 |
| Median Family Income | 110 | $63,750 |
| Mean Family Income | 110 | $100,425 |
| Median Household Income | 170 | $58,333 |
| Mean Household Income | 170 | $81,209 |
| Income Deficit | 110 | $0 |
| Wage / Income Gap (%) | 390 | 73.30% |
| Wage / Income Gap ($) | 390 | 26.70¢ per $1 |
| Gini / Inequality Index | 390 | 0.48 |
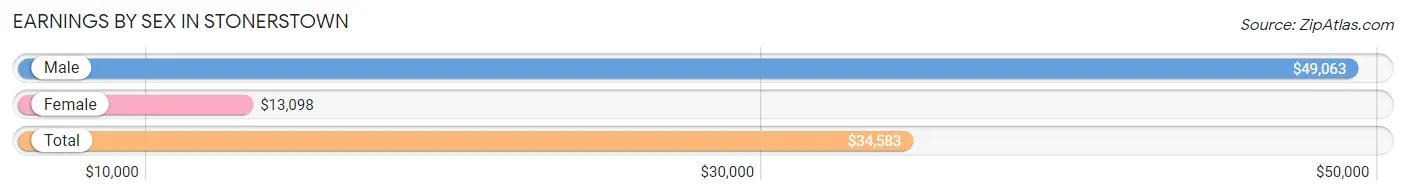
Earnings by Sex in Stonerstown
Average Earnings in Stonerstown are $34,583, $49,063 for men and $13,098 for women, a difference of 73.3%.
| Sex | Number | Average Earnings |
| Male | 96 (51.9%) | $49,063 |
| Female | 89 (48.1%) | $13,098 |
| Total | 185 (100.0%) | $34,583 |
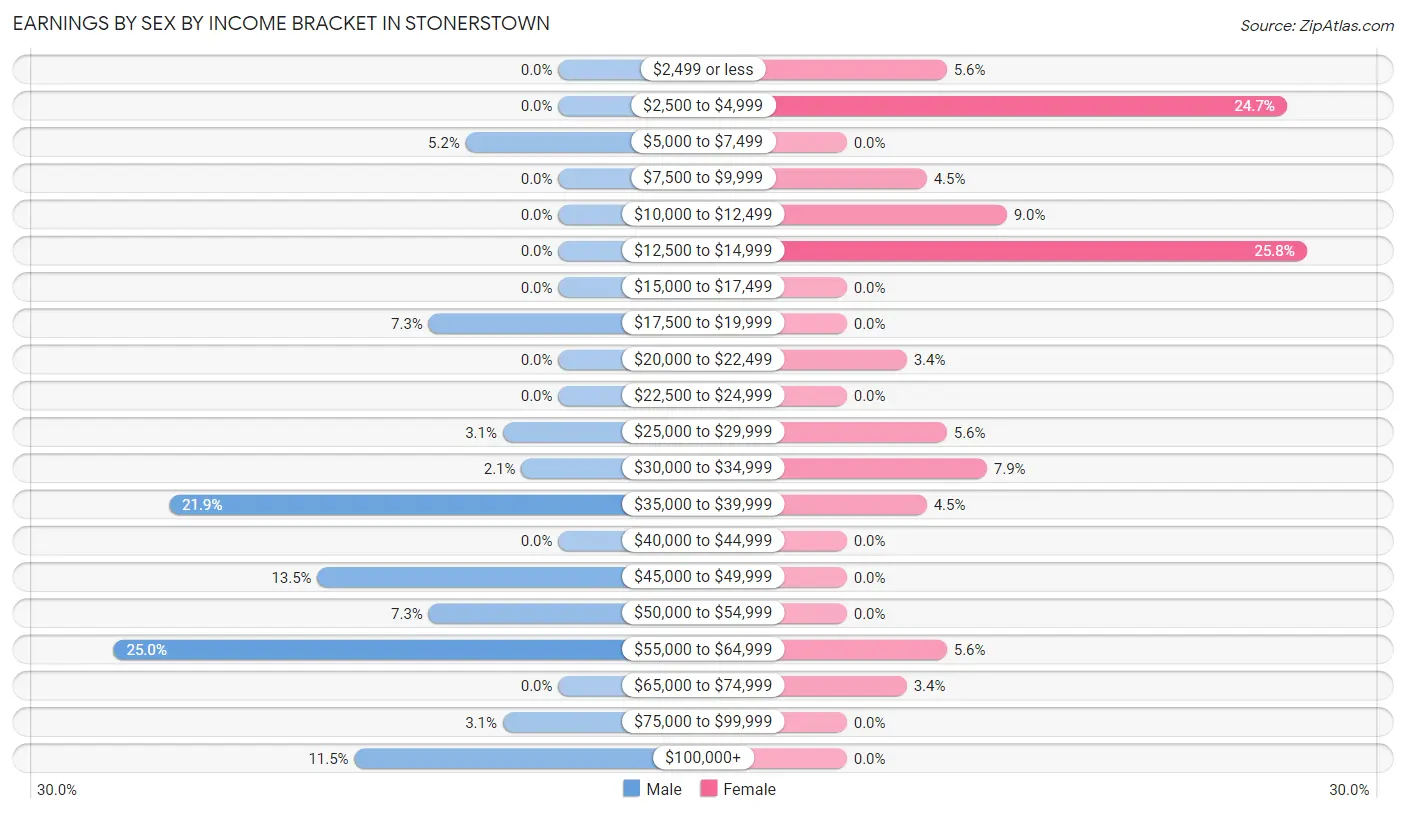
Earnings by Sex by Income Bracket in Stonerstown
The most common earnings brackets in Stonerstown are $55,000 to $64,999 for men (24 | 25.0%) and $12,500 to $14,999 for women (23 | 25.8%).
| Income | Male | Female |
| $2,499 or less | 0 (0.0%) | 5 (5.6%) |
| $2,500 to $4,999 | 0 (0.0%) | 22 (24.7%) |
| $5,000 to $7,499 | 5 (5.2%) | 0 (0.0%) |
| $7,500 to $9,999 | 0 (0.0%) | 4 (4.5%) |
| $10,000 to $12,499 | 0 (0.0%) | 8 (9.0%) |
| $12,500 to $14,999 | 0 (0.0%) | 23 (25.8%) |
| $15,000 to $17,499 | 0 (0.0%) | 0 (0.0%) |
| $17,500 to $19,999 | 7 (7.3%) | 0 (0.0%) |
| $20,000 to $22,499 | 0 (0.0%) | 3 (3.4%) |
| $22,500 to $24,999 | 0 (0.0%) | 0 (0.0%) |
| $25,000 to $29,999 | 3 (3.1%) | 5 (5.6%) |
| $30,000 to $34,999 | 2 (2.1%) | 7 (7.9%) |
| $35,000 to $39,999 | 21 (21.9%) | 4 (4.5%) |
| $40,000 to $44,999 | 0 (0.0%) | 0 (0.0%) |
| $45,000 to $49,999 | 13 (13.5%) | 0 (0.0%) |
| $50,000 to $54,999 | 7 (7.3%) | 0 (0.0%) |
| $55,000 to $64,999 | 24 (25.0%) | 5 (5.6%) |
| $65,000 to $74,999 | 0 (0.0%) | 3 (3.4%) |
| $75,000 to $99,999 | 3 (3.1%) | 0 (0.0%) |
| $100,000+ | 11 (11.5%) | 0 (0.0%) |
| Total | 96 (100.0%) | 89 (100.0%) |
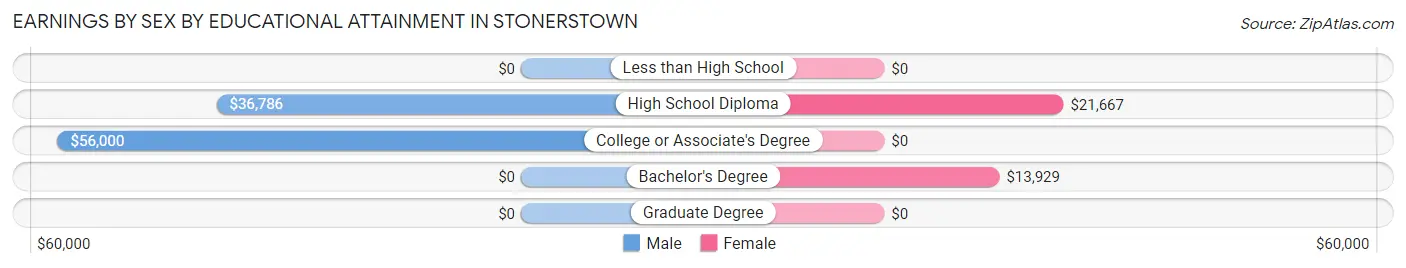
Earnings by Sex by Educational Attainment in Stonerstown
Average earnings in Stonerstown are $49,063 for men and $14,239 for women, a difference of 71.0%. Men with an educational attainment of college or associate's degree enjoy the highest average annual earnings of $56,000, while those with high school diploma education earn the least with $36,786. Women with an educational attainment of high school diploma earn the most with the average annual earnings of $21,667, while those with bachelor's degree education have the smallest earnings of $13,929.
| Educational Attainment | Male Income | Female Income |
| Less than High School | - | - |
| High School Diploma | $36,786 | $21,667 |
| College or Associate's Degree | $56,000 | $0 |
| Bachelor's Degree | - | - |
| Graduate Degree | - | - |
| Total | $49,063 | $14,239 |
Family Income in Stonerstown
Family Income Brackets in Stonerstown
According to the Stonerstown family income data, there are 26 families falling into the $75,000 to $99,999 income range, which is the most common income bracket and makes up 23.6% of all families.
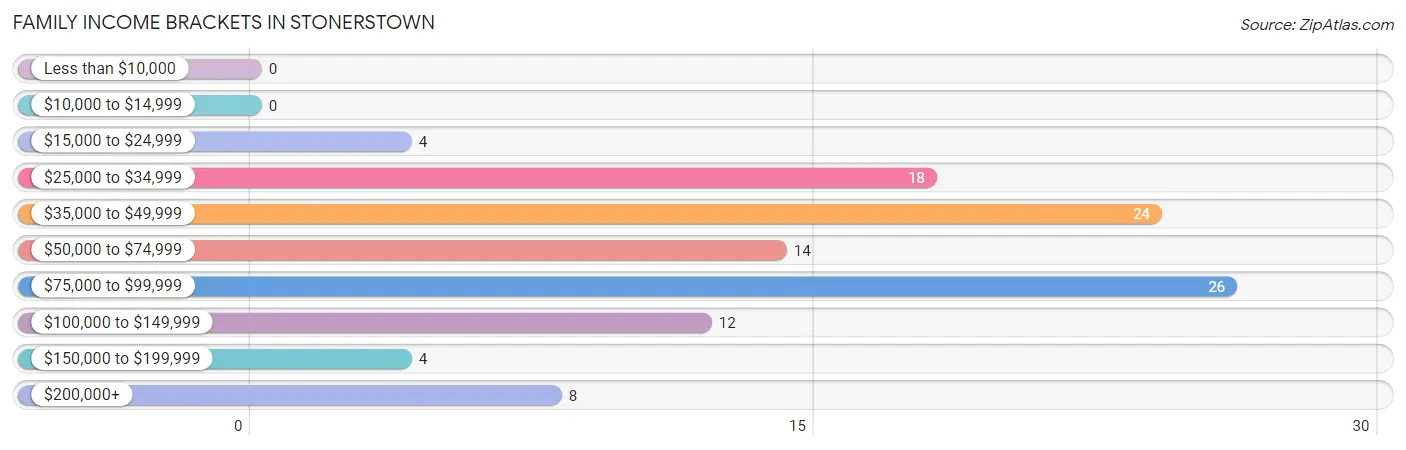
| Income Bracket | # Families | % Families |
| Less than $10,000 | 0 | 0.0% |
| $10,000 to $14,999 | 0 | 0.0% |
| $15,000 to $24,999 | 4 | 3.6% |
| $25,000 to $34,999 | 18 | 16.4% |
| $35,000 to $49,999 | 24 | 21.8% |
| $50,000 to $74,999 | 14 | 12.7% |
| $75,000 to $99,999 | 26 | 23.6% |
| $100,000 to $149,999 | 12 | 10.9% |
| $150,000 to $199,999 | 4 | 3.6% |
| $200,000+ | 8 | 7.3% |
Family Income by Famaliy Size in Stonerstown
2-person families (44 | 40.0%) account for the highest median family income in Stonerstown with $71,667 per family, while 2-person families (44 | 40.0%) have the highest median income of $35,834 per family member.
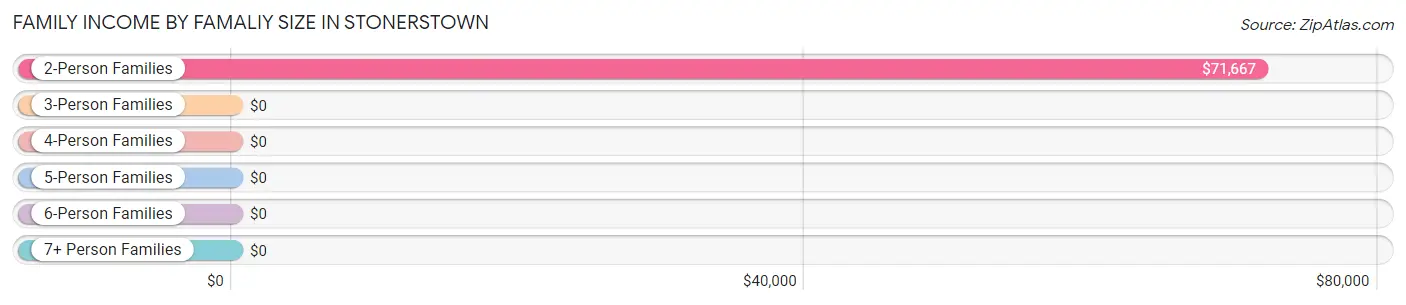
| Income Bracket | # Families | Median Income |
| 2-Person Families | 44 (40.0%) | $71,667 |
| 3-Person Families | 26 (23.6%) | $0 |
| 4-Person Families | 40 (36.4%) | $0 |
| 5-Person Families | 0 (0.0%) | $0 |
| 6-Person Families | 0 (0.0%) | $0 |
| 7+ Person Families | 0 (0.0%) | $0 |
| Total | 110 (100.0%) | $63,750 |
Family Income by Number of Earners in Stonerstown
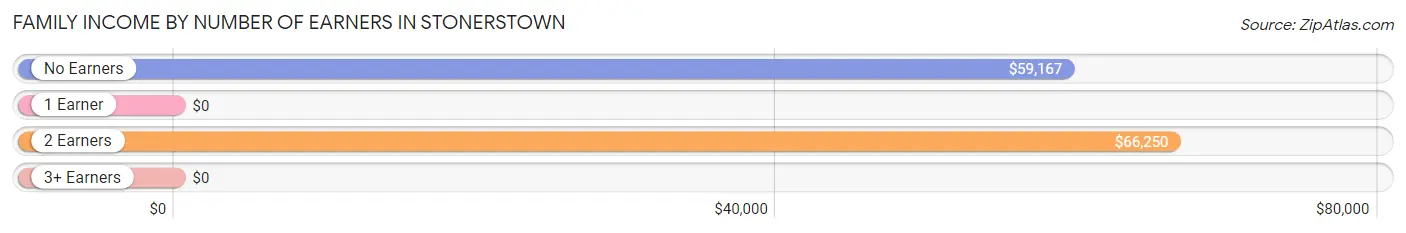
| Number of Earners | # Families | Median Income |
| No Earners | 16 (14.5%) | $59,167 |
| 1 Earner | 33 (30.0%) | $0 |
| 2 Earners | 56 (50.9%) | $66,250 |
| 3+ Earners | 5 (4.5%) | $0 |
| Total | 110 (100.0%) | $63,750 |
Household Income in Stonerstown
Household Income Brackets in Stonerstown
With 31 households falling in the category, the $15,000 to $24,999 income range is the most frequent in Stonerstown, accounting for 18.2% of all households.
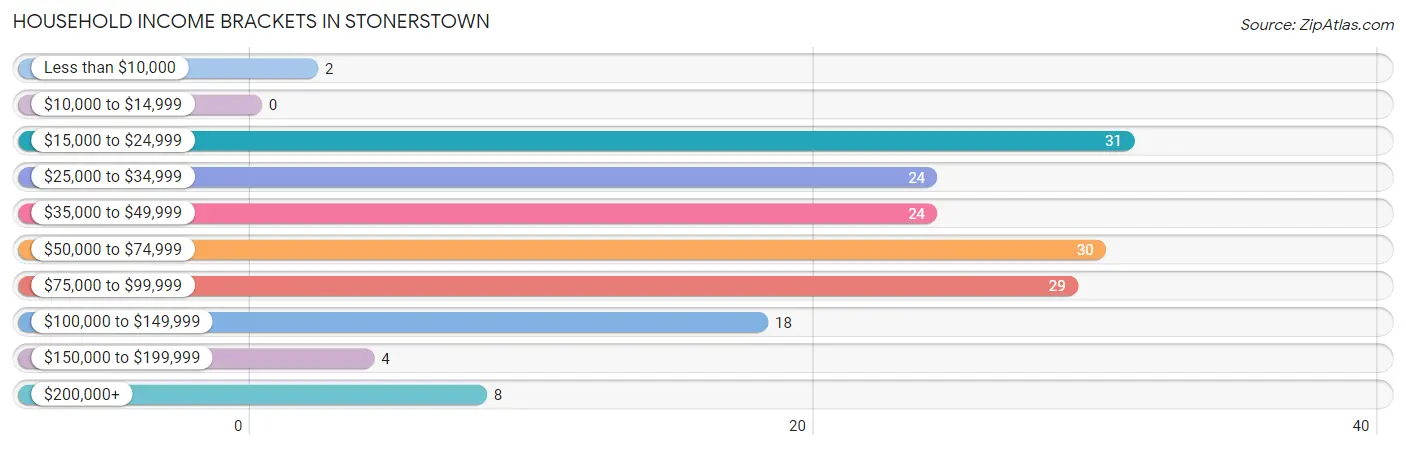
| Income Bracket | # Households | % Households |
| Less than $10,000 | 2 | 1.2% |
| $10,000 to $14,999 | 0 | 0.0% |
| $15,000 to $24,999 | 31 | 18.2% |
| $25,000 to $34,999 | 24 | 14.1% |
| $35,000 to $49,999 | 24 | 14.1% |
| $50,000 to $74,999 | 30 | 17.6% |
| $75,000 to $99,999 | 29 | 17.1% |
| $100,000 to $149,999 | 18 | 10.6% |
| $150,000 to $199,999 | 4 | 2.4% |
| $200,000+ | 8 | 4.7% |
Household Income by Householder Age in Stonerstown
The median household income in Stonerstown is $58,333, with the highest median household income of $86,719 found in the 45 to 64 years age bracket for the primary householder. A total of 41 households (24.1%) fall into this category. Meanwhile, the 15 to 24 years age bracket for the primary householder has the lowest median household income of $0, with 25 households (14.7%) in this group.
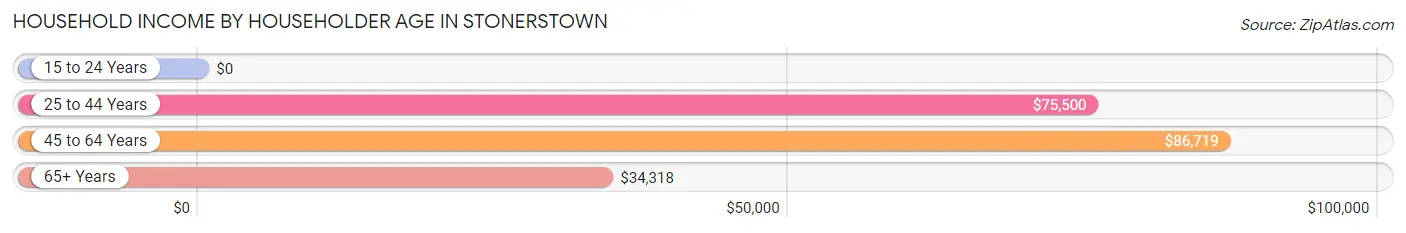
| Income Bracket | # Households | Median Income |
| 15 to 24 Years | 25 (14.7%) | $0 |
| 25 to 44 Years | 34 (20.0%) | $75,500 |
| 45 to 64 Years | 41 (24.1%) | $86,719 |
| 65+ Years | 70 (41.2%) | $34,318 |
| Total | 170 (100.0%) | $58,333 |
Poverty in Stonerstown
Income Below Poverty by Sex and Age in Stonerstown
With 1.1% poverty level for males and 4.8% for females among the residents of Stonerstown, 55 to 64 year old males and 55 to 64 year old females are the most vulnerable to poverty, with 2 males (6.9%) and 10 females (26.3%) in their respective age groups living below the poverty level.
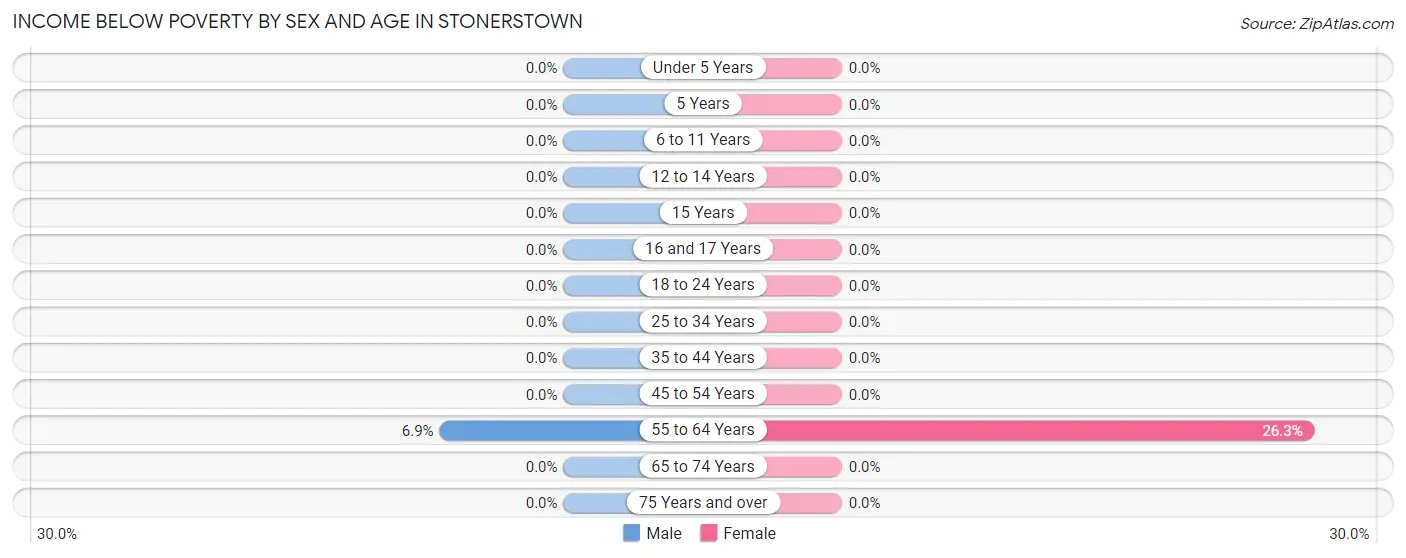
| Age Bracket | Male | Female |
| Under 5 Years | 0 (0.0%) | 0 (0.0%) |
| 5 Years | 0 (0.0%) | 0 (0.0%) |
| 6 to 11 Years | 0 (0.0%) | 0 (0.0%) |
| 12 to 14 Years | 0 (0.0%) | 0 (0.0%) |
| 15 Years | 0 (0.0%) | 0 (0.0%) |
| 16 and 17 Years | 0 (0.0%) | 0 (0.0%) |
| 18 to 24 Years | 0 (0.0%) | 0 (0.0%) |
| 25 to 34 Years | 0 (0.0%) | 0 (0.0%) |
| 35 to 44 Years | 0 (0.0%) | 0 (0.0%) |
| 45 to 54 Years | 0 (0.0%) | 0 (0.0%) |
| 55 to 64 Years | 2 (6.9%) | 10 (26.3%) |
| 65 to 74 Years | 0 (0.0%) | 0 (0.0%) |
| 75 Years and over | 0 (0.0%) | 0 (0.0%) |
| Total | 2 (1.1%) | 10 (4.8%) |
Income Above Poverty by Sex and Age in Stonerstown
According to the poverty statistics in Stonerstown, males aged under 5 years and females aged under 5 years are the age groups that are most secure financially, with 100.0% of males and 100.0% of females in these age groups living above the poverty line.
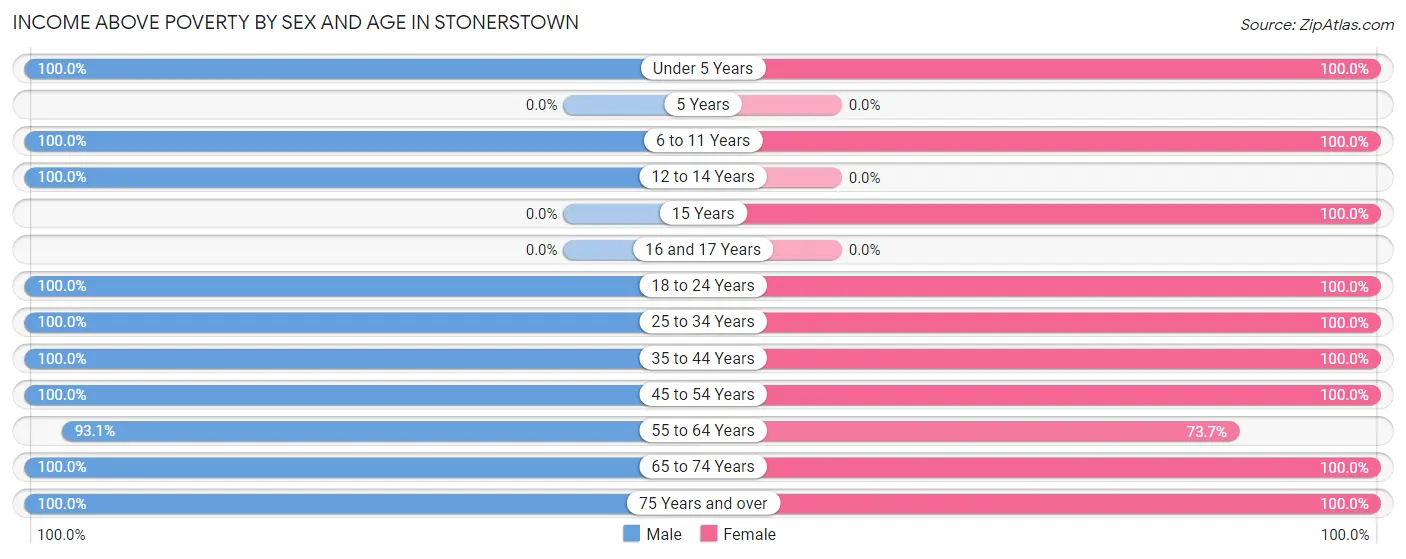
| Age Bracket | Male | Female |
| Under 5 Years | 4 (100.0%) | 30 (100.0%) |
| 5 Years | 0 (0.0%) | 0 (0.0%) |
| 6 to 11 Years | 15 (100.0%) | 3 (100.0%) |
| 12 to 14 Years | 8 (100.0%) | 0 (0.0%) |
| 15 Years | 0 (0.0%) | 14 (100.0%) |
| 16 and 17 Years | 0 (0.0%) | 0 (0.0%) |
| 18 to 24 Years | 6 (100.0%) | 43 (100.0%) |
| 25 to 34 Years | 46 (100.0%) | 3 (100.0%) |
| 35 to 44 Years | 15 (100.0%) | 22 (100.0%) |
| 45 to 54 Years | 3 (100.0%) | 16 (100.0%) |
| 55 to 64 Years | 27 (93.1%) | 28 (73.7%) |
| 65 to 74 Years | 32 (100.0%) | 13 (100.0%) |
| 75 Years and over | 25 (100.0%) | 25 (100.0%) |
| Total | 181 (98.9%) | 197 (95.2%) |
Income Below Poverty Among Married-Couple Families in Stonerstown
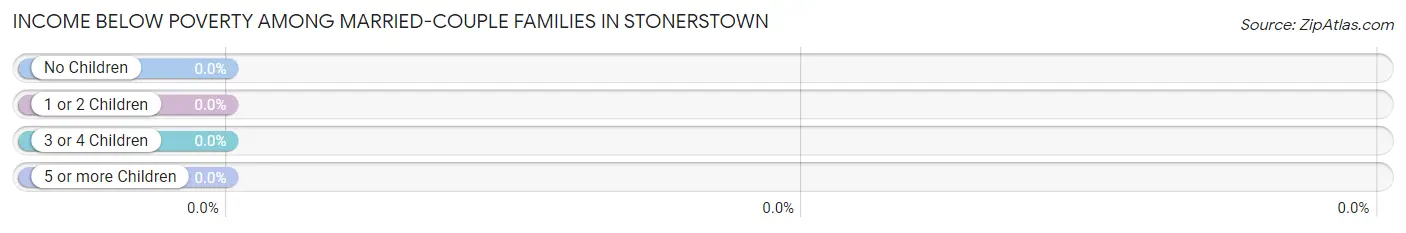
| Children | Above Poverty | Below Poverty |
| No Children | 47 (100.0%) | 0 (0.0%) |
| 1 or 2 Children | 46 (100.0%) | 0 (0.0%) |
| 3 or 4 Children | 0 (0.0%) | 0 (0.0%) |
| 5 or more Children | 0 (0.0%) | 0 (0.0%) |
| Total | 93 (100.0%) | 0 (0.0%) |
Income Below Poverty Among Single-Parent Households in Stonerstown
| Children | Single Father | Single Mother |
| No Children | 0 (0.0%) | 0 (0.0%) |
| 1 or 2 Children | 0 (0.0%) | 0 (0.0%) |
| 3 or 4 Children | 0 (0.0%) | 0 (0.0%) |
| 5 or more Children | 0 (0.0%) | 0 (0.0%) |
| Total | 0 (0.0%) | 0 (0.0%) |
Income Below Poverty Among Married-Couple vs Single-Parent Households in Stonerstown
| Children | Married-Couple Families | Single-Parent Households |
| No Children | 0 (0.0%) | 0 (0.0%) |
| 1 or 2 Children | 0 (0.0%) | 0 (0.0%) |
| 3 or 4 Children | 0 (0.0%) | 0 (0.0%) |
| 5 or more Children | 0 (0.0%) | 0 (0.0%) |
| Total | 0 (0.0%) | 0 (0.0%) |
Race in Stonerstown
The most populous races in Stonerstown are White / Caucasian (381 | 97.7%), Two or more Races (6 | 1.5%), and Some other Race (3 | 0.8%).
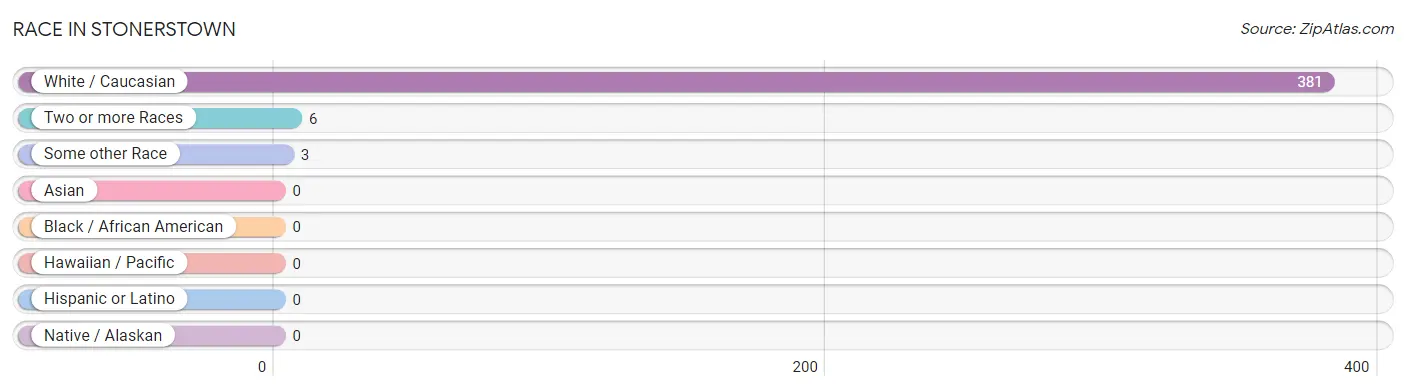
| Race | # Population | % Population |
| Asian | 0 | 0.0% |
| Black / African American | 0 | 0.0% |
| Hawaiian / Pacific | 0 | 0.0% |
| Hispanic or Latino | 0 | 0.0% |
| Native / Alaskan | 0 | 0.0% |
| White / Caucasian | 381 | 97.7% |
| Two or more Races | 6 | 1.5% |
| Some other Race | 3 | 0.8% |
| Total | 390 | 100.0% |
Ancestry in Stonerstown
The most populous ancestries reported in Stonerstown are English (99 | 25.4%), German (57 | 14.6%), Russian (36 | 9.2%), Irish (34 | 8.7%), and Welsh (19 | 4.9%), together accounting for 62.8% of all Stonerstown residents.
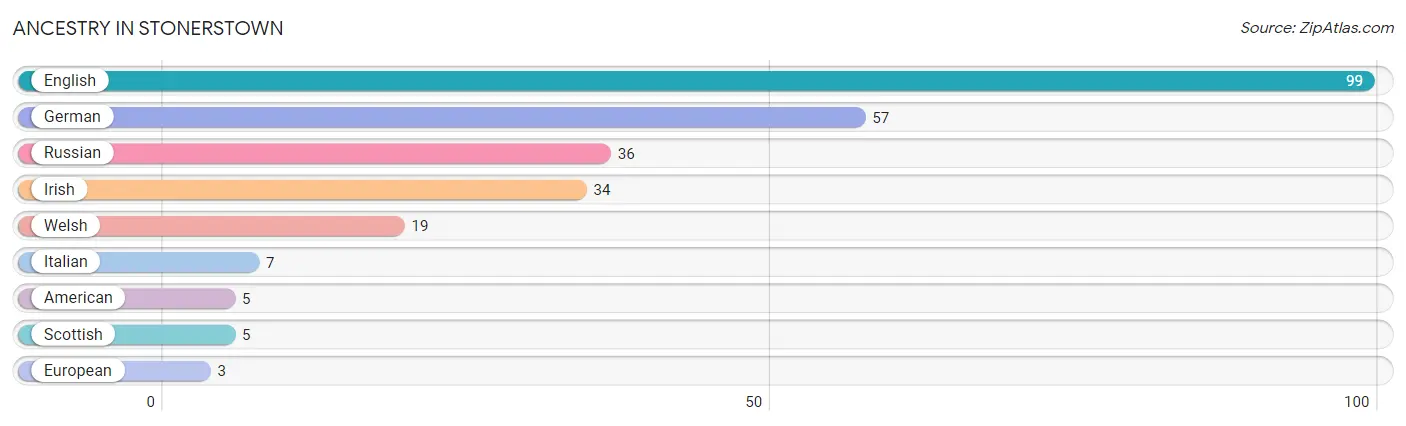
| Ancestry | # Population | % Population |
| American | 5 | 1.3% |
| English | 99 | 25.4% |
| European | 3 | 0.8% |
| German | 57 | 14.6% |
| Irish | 34 | 8.7% |
| Italian | 7 | 1.8% |
| Russian | 36 | 9.2% |
| Scottish | 5 | 1.3% |
| Welsh | 19 | 4.9% | View All 9 Rows |
Immigrants in Stonerstown

| Immigration Origin | # Population | % Population | View All 0 Rows |
Sex and Age in Stonerstown
Sex and Age in Stonerstown
The most populous age groups in Stonerstown are 25 to 29 Years (29 | 15.9%) for men and 20 to 24 Years (38 | 18.4%) for women.
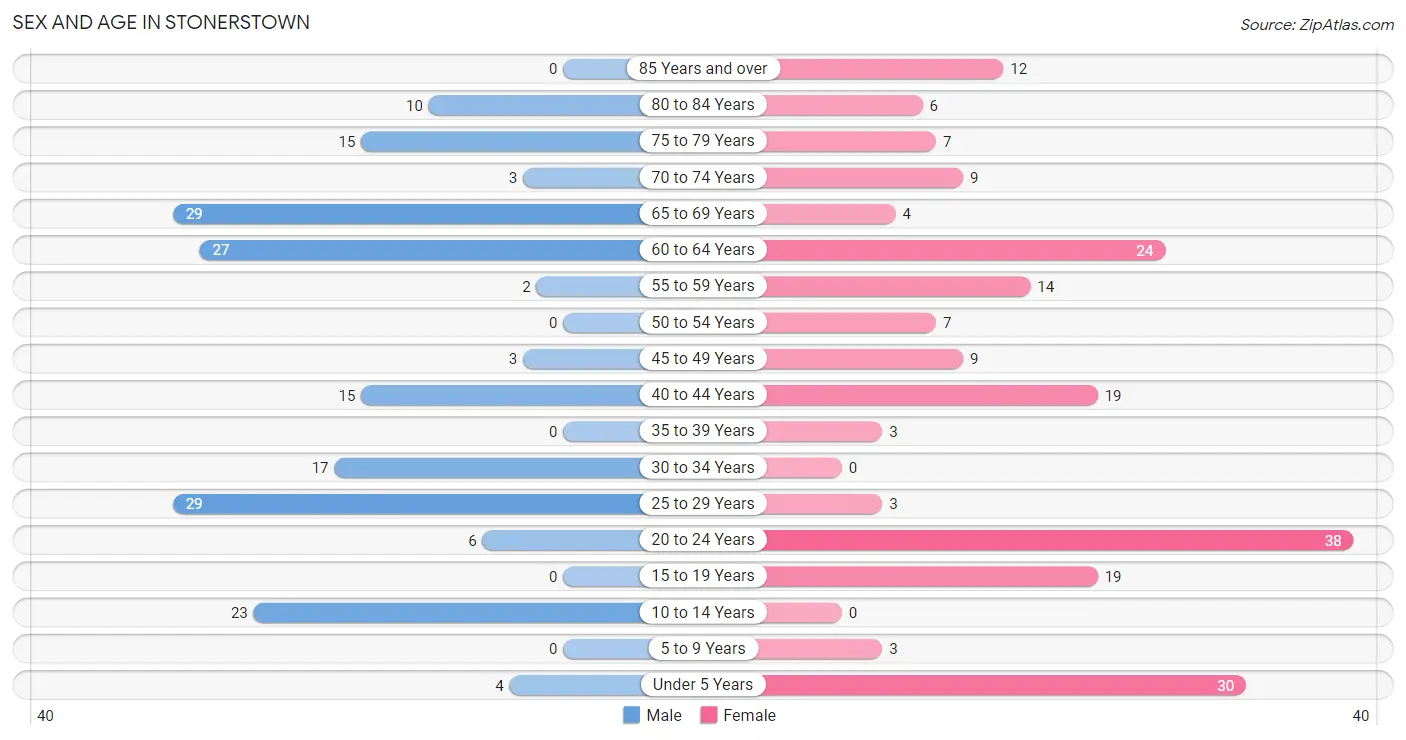
| Age Bracket | Male | Female |
| Under 5 Years | 4 (2.2%) | 30 (14.5%) |
| 5 to 9 Years | 0 (0.0%) | 3 (1.5%) |
| 10 to 14 Years | 23 (12.6%) | 0 (0.0%) |
| 15 to 19 Years | 0 (0.0%) | 19 (9.2%) |
| 20 to 24 Years | 6 (3.3%) | 38 (18.4%) |
| 25 to 29 Years | 29 (15.9%) | 3 (1.5%) |
| 30 to 34 Years | 17 (9.3%) | 0 (0.0%) |
| 35 to 39 Years | 0 (0.0%) | 3 (1.5%) |
| 40 to 44 Years | 15 (8.2%) | 19 (9.2%) |
| 45 to 49 Years | 3 (1.6%) | 9 (4.3%) |
| 50 to 54 Years | 0 (0.0%) | 7 (3.4%) |
| 55 to 59 Years | 2 (1.1%) | 14 (6.8%) |
| 60 to 64 Years | 27 (14.7%) | 24 (11.6%) |
| 65 to 69 Years | 29 (15.9%) | 4 (1.9%) |
| 70 to 74 Years | 3 (1.6%) | 9 (4.3%) |
| 75 to 79 Years | 15 (8.2%) | 7 (3.4%) |
| 80 to 84 Years | 10 (5.5%) | 6 (2.9%) |
| 85 Years and over | 0 (0.0%) | 12 (5.8%) |
| Total | 183 (100.0%) | 207 (100.0%) |
Families and Households in Stonerstown
Median Family Size in Stonerstown
The median family size in Stonerstown is 2.89 persons per family, with married-couple families (93 | 84.6%) accounting for the largest median family size of 3.01 persons per family. On the other hand, single female/mother families (6 | 5.4%) represent the smallest median family size with 2.00 persons per family.
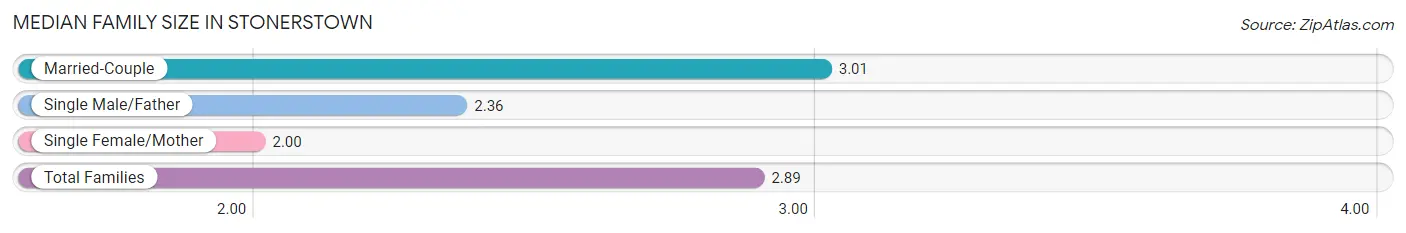
| Family Type | # Families | Family Size |
| Married-Couple | 93 (84.6%) | 3.01 |
| Single Male/Father | 11 (10.0%) | 2.36 |
| Single Female/Mother | 6 (5.4%) | 2.00 |
| Total Families | 110 (100.0%) | 2.89 |
Median Household Size in Stonerstown
The median household size in Stonerstown is 2.29 persons per household, with married-couple households (93 | 54.7%) accounting for the largest median household size of 3.01 persons per household. non-family households (60 | 35.3%) represent the smallest median household size with 1.17 persons per household.
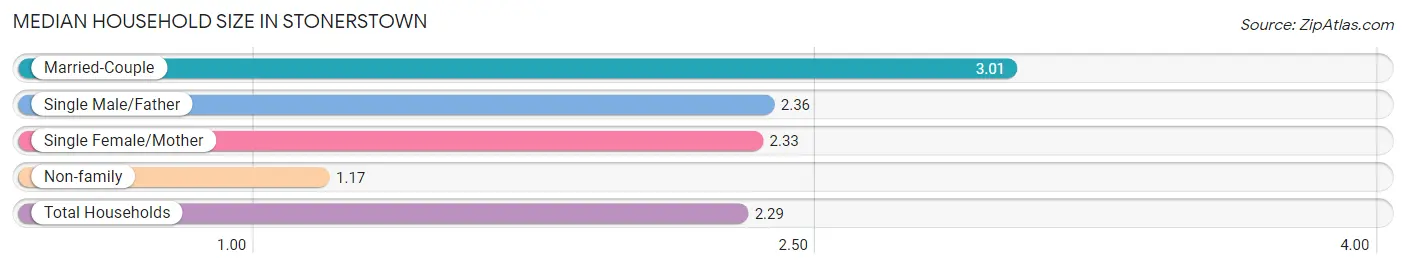
| Household Type | # Households | Household Size |
| Married-Couple | 93 (54.7%) | 3.01 |
| Single Male/Father | 11 (6.5%) | 2.36 |
| Single Female/Mother | 6 (3.5%) | 2.33 |
| Non-family | 60 (35.3%) | 1.17 |
| Total Households | 170 (100.0%) | 2.29 |
Household Size by Marriage Status in Stonerstown
Out of a total of 170 households in Stonerstown, 110 (64.7%) are family households, while 60 (35.3%) are nonfamily households. The most numerous type of family households are 2-person households, comprising 41, and the most common type of nonfamily households are 1-person households, comprising 51.
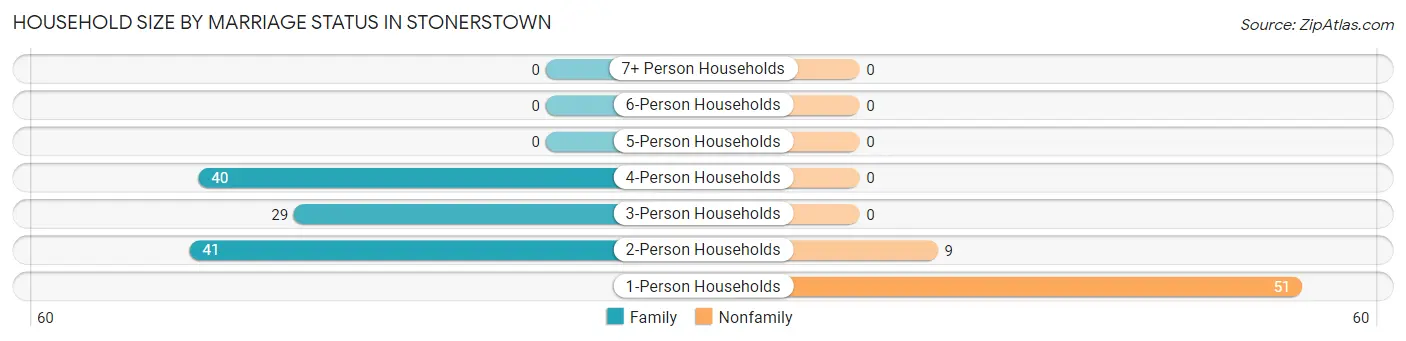
| Household Size | Family Households | Nonfamily Households |
| 1-Person Households | - | 51 (30.0%) |
| 2-Person Households | 41 (24.1%) | 9 (5.3%) |
| 3-Person Households | 29 (17.1%) | 0 (0.0%) |
| 4-Person Households | 40 (23.5%) | 0 (0.0%) |
| 5-Person Households | 0 (0.0%) | 0 (0.0%) |
| 6-Person Households | 0 (0.0%) | 0 (0.0%) |
| 7+ Person Households | 0 (0.0%) | 0 (0.0%) |
| Total | 110 (64.7%) | 60 (35.3%) |
Female Fertility in Stonerstown
Fertility by Age in Stonerstown
Average fertility rate in Stonerstown is 275.0 births per 1,000 women. Women in the age bracket of 20 to 34 years have the highest fertility rate with 610.0 births per 1,000 women. Women in the age bracket of 20 to 34 years acount for 100.0% of all women with births.
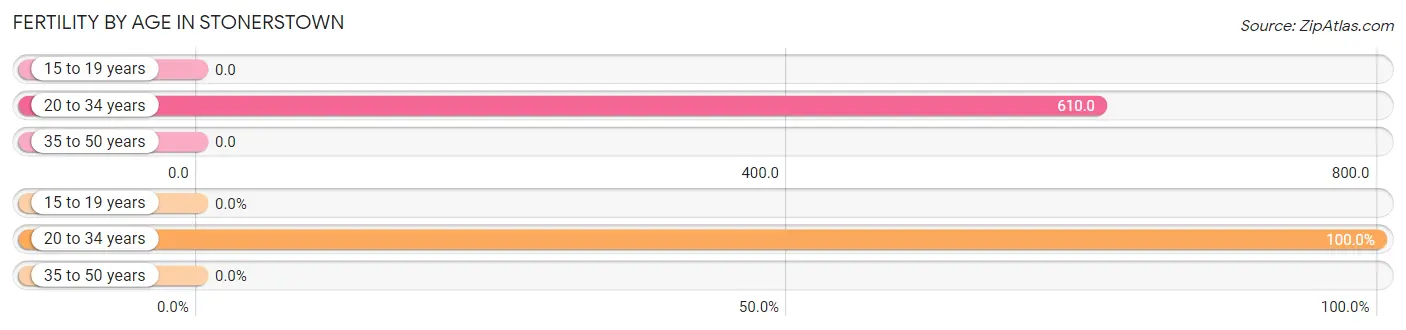
| Age Bracket | Women with Births | Births / 1,000 Women |
| 15 to 19 years | 0 (0.0%) | 0.0 |
| 20 to 34 years | 25 (100.0%) | 610.0 |
| 35 to 50 years | 0 (0.0%) | 0.0 |
| Total | 25 (100.0%) | 275.0 |
Fertility by Age by Marriage Status in Stonerstown
88.0% of women with births (25) in Stonerstown are married. The highest percentage of unmarried women with births falls into 20 to 34 years age bracket with 12.0% of them unmarried at the time of birth, while the lowest percentage of unmarried women with births belong to 20 to 34 years age bracket with 12.0% of them unmarried.
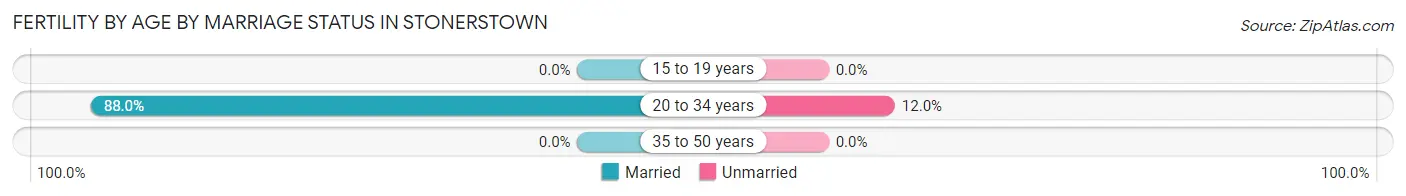
| Age Bracket | Married | Unmarried |
| 15 to 19 years | 0 (0.0%) | 0 (0.0%) |
| 20 to 34 years | 22 (88.0%) | 3 (12.0%) |
| 35 to 50 years | 0 (0.0%) | 0 (0.0%) |
| Total | 22 (88.0%) | 3 (12.0%) |
Fertility by Education in Stonerstown
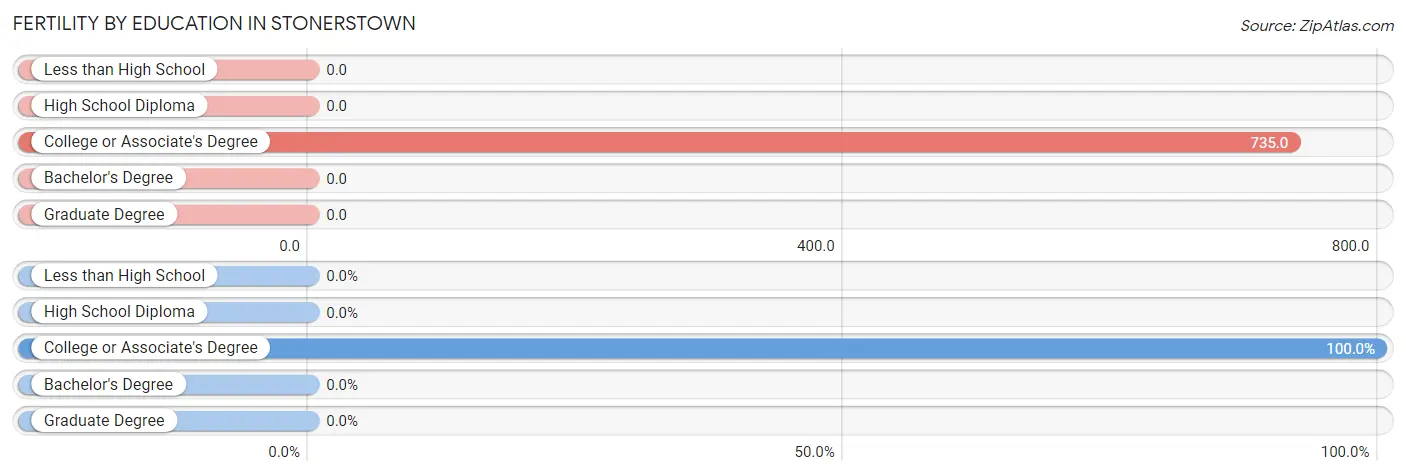
| Educational Attainment | Women with Births | Births / 1,000 Women |
| Less than High School | 0 (0.0%) | 0.0 |
| High School Diploma | 0 (0.0%) | 0.0 |
| College or Associate's Degree | 25 (100.0%) | 735.0 |
| Bachelor's Degree | 0 (0.0%) | 0.0 |
| Graduate Degree | 0 (0.0%) | 0.0 |
| Total | 25 (100.0%) | 275.0 |
Fertility by Education by Marriage Status in Stonerstown
12.0% of women with births in Stonerstown are unmarried. Women with the educational attainment of college or associate's degree are most likely to be married with 88.0% of them married at childbirth, while women with the educational attainment of college or associate's degree are least likely to be married with 12.0% of them unmarried at childbirth.
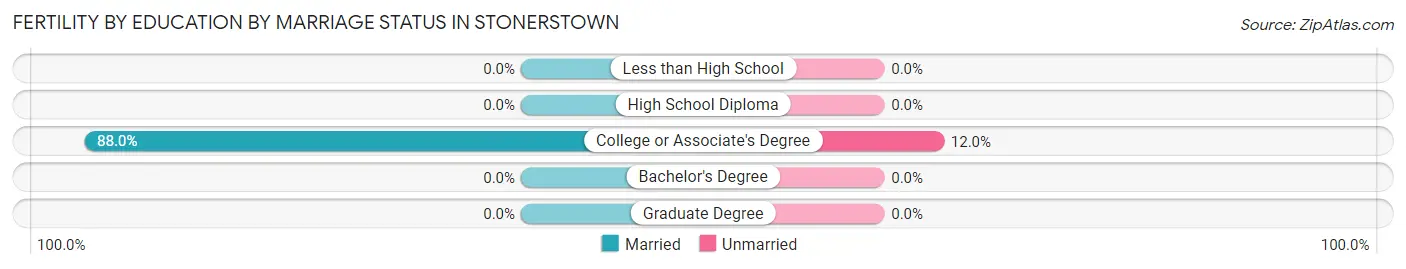
| Educational Attainment | Married | Unmarried |
| Less than High School | 0 (0.0%) | 0 (0.0%) |
| High School Diploma | 0 (0.0%) | 0 (0.0%) |
| College or Associate's Degree | 22 (88.0%) | 3 (12.0%) |
| Bachelor's Degree | 0 (0.0%) | 0 (0.0%) |
| Graduate Degree | 0 (0.0%) | 0 (0.0%) |
| Total | 22 (88.0%) | 3 (12.0%) |
Employment Characteristics in Stonerstown
Employment by Class of Employer in Stonerstown
Among the 177 employed individuals in Stonerstown, private company employees (129 | 72.9%), local government employees (19 | 10.7%), and not-for-profit organizations (11 | 6.2%) make up the most common classes of employment.
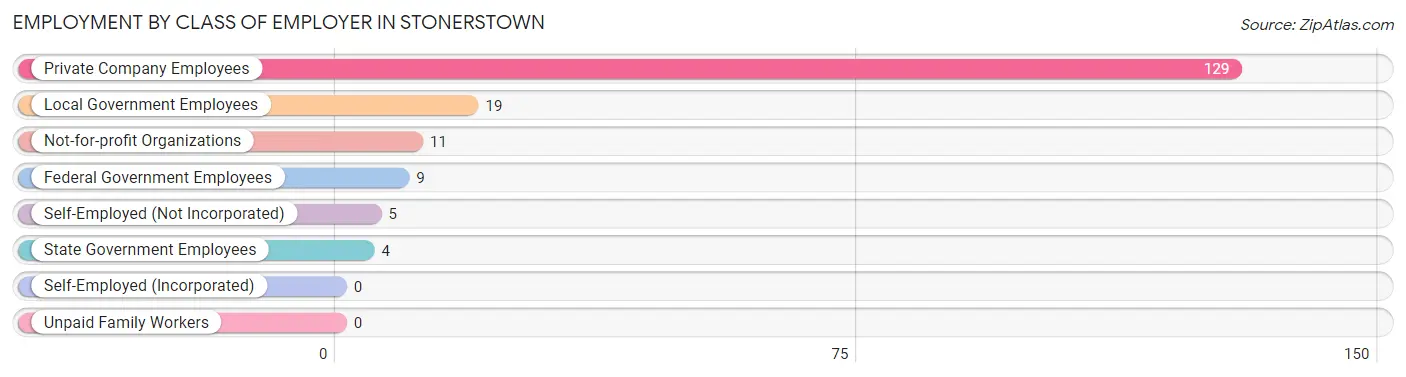
| Employer Class | # Employees | % Employees |
| Private Company Employees | 129 | 72.9% |
| Self-Employed (Incorporated) | 0 | 0.0% |
| Self-Employed (Not Incorporated) | 5 | 2.8% |
| Not-for-profit Organizations | 11 | 6.2% |
| Local Government Employees | 19 | 10.7% |
| State Government Employees | 4 | 2.3% |
| Federal Government Employees | 9 | 5.1% |
| Unpaid Family Workers | 0 | 0.0% |
| Total | 177 | 100.0% |
Employment Status by Age in Stonerstown
According to the labor force statistics for Stonerstown, out of the total population over 16 years of age (316), 61.4% or 194 individuals are in the labor force, with 8.8% or 17 of them unemployed. The age group with the highest labor force participation rate is 25 to 29 years, with 100.0% or 32 individuals in the labor force. Within the labor force, the 20 to 24 years age range has the highest percentage of unemployed individuals, with 34.2% or 13 of them being unemployed.
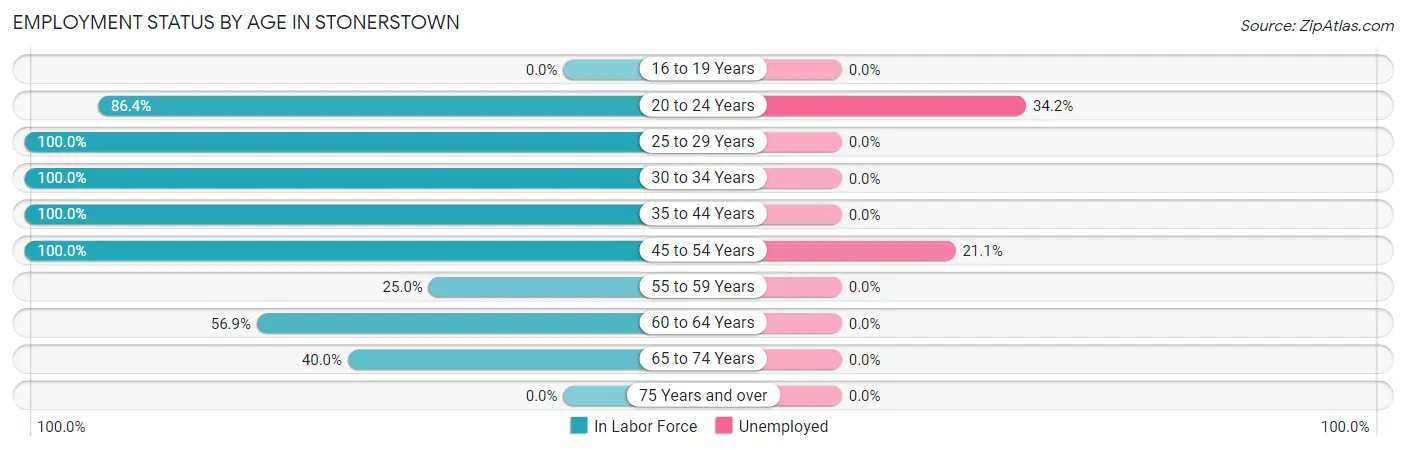
| Age Bracket | In Labor Force | Unemployed |
| 16 to 19 Years | 0 (0.0%) | 0 (0.0%) |
| 20 to 24 Years | 38 (86.4%) | 13 (34.2%) |
| 25 to 29 Years | 32 (100.0%) | 0 (0.0%) |
| 30 to 34 Years | 17 (100.0%) | 0 (0.0%) |
| 35 to 44 Years | 37 (100.0%) | 0 (0.0%) |
| 45 to 54 Years | 19 (100.0%) | 4 (21.1%) |
| 55 to 59 Years | 4 (25.0%) | 0 (0.0%) |
| 60 to 64 Years | 29 (56.9%) | 0 (0.0%) |
| 65 to 74 Years | 18 (40.0%) | 0 (0.0%) |
| 75 Years and over | 0 (0.0%) | 0 (0.0%) |
| Total | 194 (61.4%) | 17 (8.8%) |
Employment Status by Educational Attainment in Stonerstown
According to labor force statistics for Stonerstown, 80.2% of individuals (138) out of the total population between 25 and 64 years of age (172) are in the labor force, with 2.9% or 4 of them being unemployed. The group with the highest labor force participation rate are those with the educational attainment of high school diploma, with 94.1% or 48 individuals in the labor force. Within the labor force, individuals with high school diploma education have the highest percentage of unemployment, with 8.3% or 4 of them being unemployed.
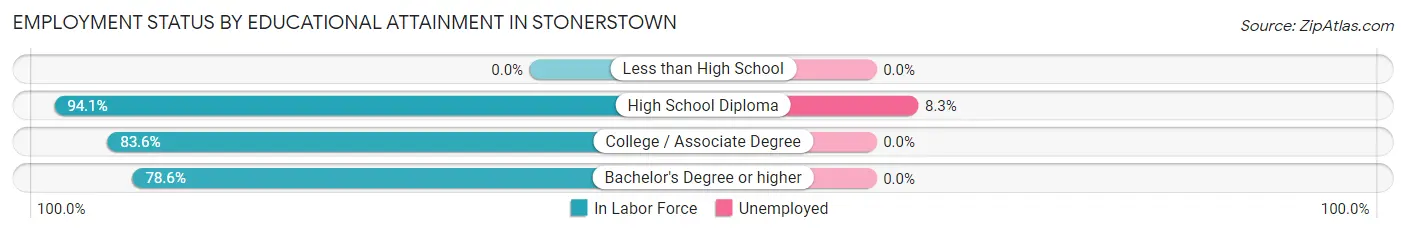
| Educational Attainment | In Labor Force | Unemployed |
| Less than High School | 0 (0.0%) | 0 (0.0%) |
| High School Diploma | 48 (94.1%) | 4 (8.3%) |
| College / Associate Degree | 46 (83.6%) | 0 (0.0%) |
| Bachelor's Degree or higher | 44 (78.6%) | 0 (0.0%) |
| Total | 138 (80.2%) | 5 (2.9%) |
Employment Occupations by Sex in Stonerstown
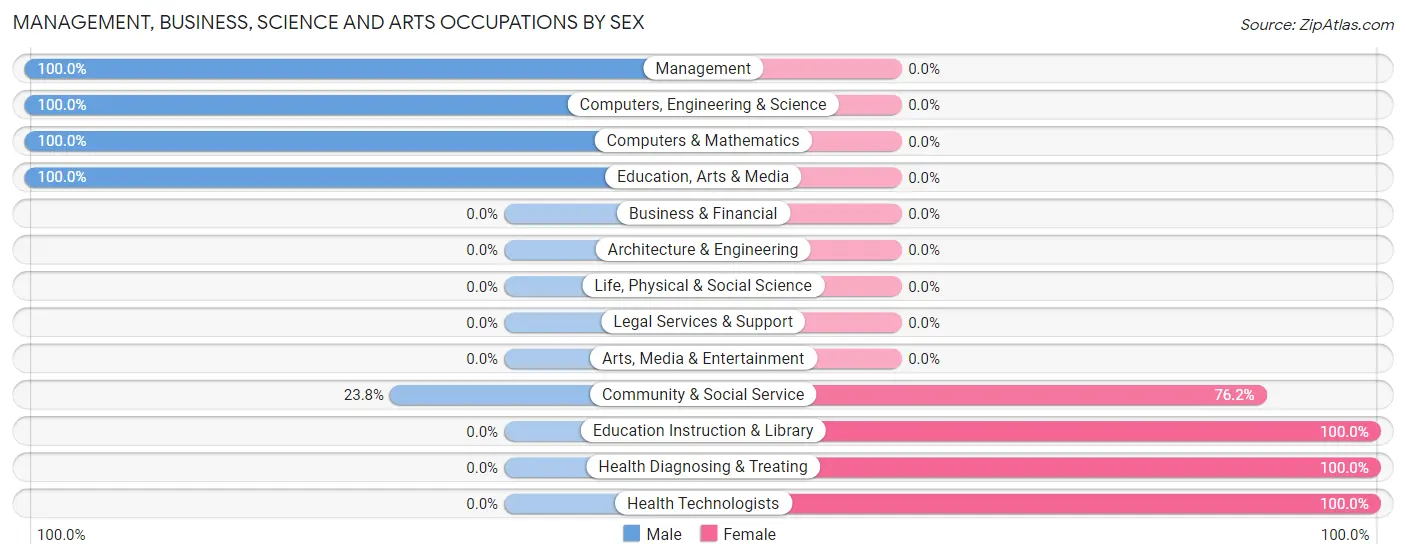
Management, Business, Science and Arts Occupations
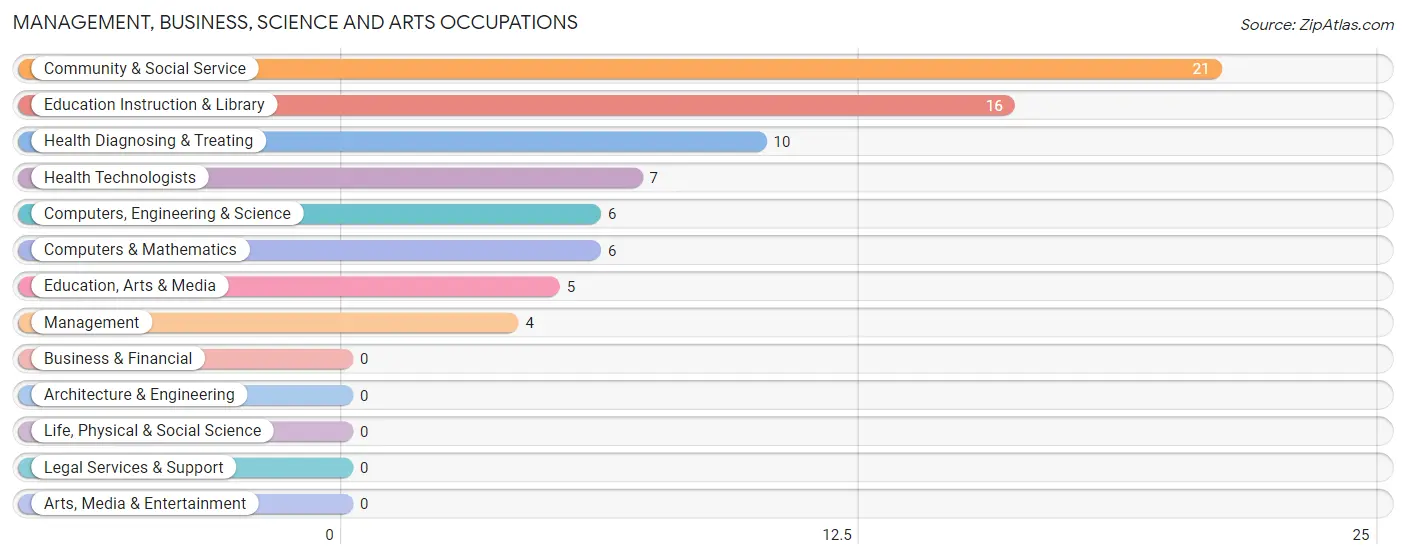
The most common Management, Business, Science and Arts occupations in Stonerstown are Community & Social Service (21 | 11.9%), Education Instruction & Library (16 | 9.0%), Health Diagnosing & Treating (10 | 5.7%), Health Technologists (7 | 4.0%), and Computers, Engineering & Science (6 | 3.4%).
Management, Business, Science and Arts Occupations by Sex
Within the Management, Business, Science and Arts occupations in Stonerstown, the most male-oriented occupations are Management (100.0%), Computers, Engineering & Science (100.0%), and Computers & Mathematics (100.0%), while the most female-oriented occupations are Education Instruction & Library (100.0%), Health Diagnosing & Treating (100.0%), and Health Technologists (100.0%).
| Occupation | Male | Female |
| Management | 4 (100.0%) | 0 (0.0%) |
| Business & Financial | 0 (0.0%) | 0 (0.0%) |
| Computers, Engineering & Science | 6 (100.0%) | 0 (0.0%) |
| Computers & Mathematics | 6 (100.0%) | 0 (0.0%) |
| Architecture & Engineering | 0 (0.0%) | 0 (0.0%) |
| Life, Physical & Social Science | 0 (0.0%) | 0 (0.0%) |
| Community & Social Service | 5 (23.8%) | 16 (76.2%) |
| Education, Arts & Media | 5 (100.0%) | 0 (0.0%) |
| Legal Services & Support | 0 (0.0%) | 0 (0.0%) |
| Education Instruction & Library | 0 (0.0%) | 16 (100.0%) |
| Arts, Media & Entertainment | 0 (0.0%) | 0 (0.0%) |
| Health Diagnosing & Treating | 0 (0.0%) | 10 (100.0%) |
| Health Technologists | 0 (0.0%) | 7 (100.0%) |
| Total (Category) | 15 (36.6%) | 26 (63.4%) |
| Total (Overall) | 94 (53.1%) | 83 (46.9%) |
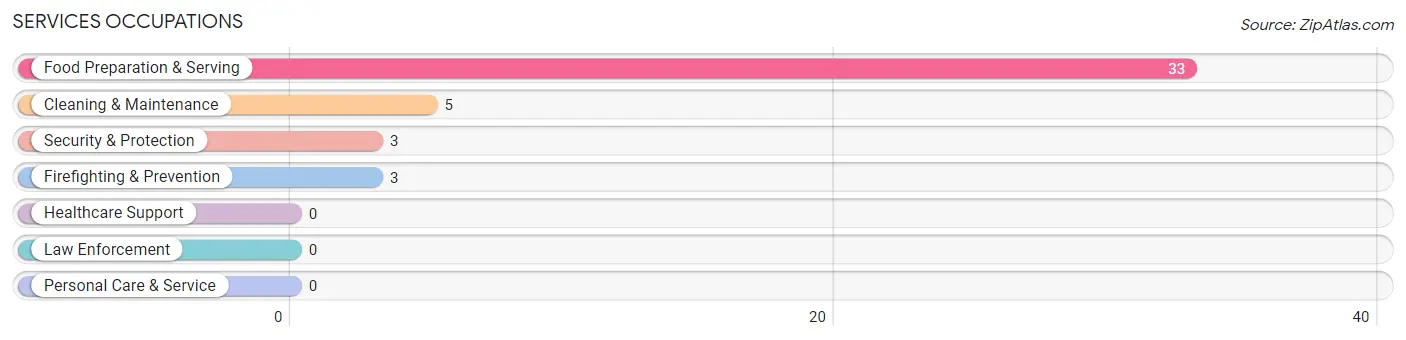
Services Occupations
The most common Services occupations in Stonerstown are Food Preparation & Serving (33 | 18.6%), Cleaning & Maintenance (5 | 2.8%), Security & Protection (3 | 1.7%), and Firefighting & Prevention (3 | 1.7%).
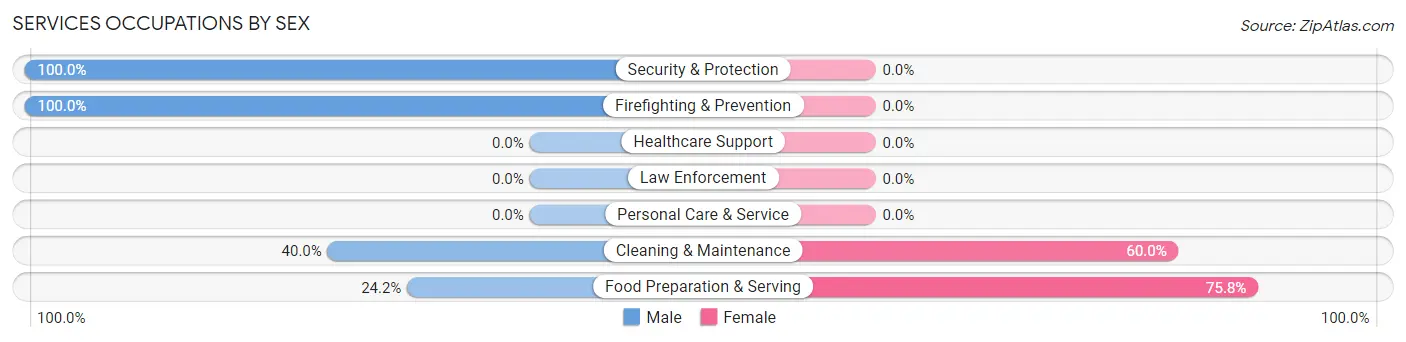
Services Occupations by Sex
Within the Services occupations in Stonerstown, the most male-oriented occupations are Security & Protection (100.0%), Firefighting & Prevention (100.0%), and Cleaning & Maintenance (40.0%), while the most female-oriented occupations are Food Preparation & Serving (75.8%), and Cleaning & Maintenance (60.0%).
| Occupation | Male | Female |
| Healthcare Support | 0 (0.0%) | 0 (0.0%) |
| Security & Protection | 3 (100.0%) | 0 (0.0%) |
| Firefighting & Prevention | 3 (100.0%) | 0 (0.0%) |
| Law Enforcement | 0 (0.0%) | 0 (0.0%) |
| Food Preparation & Serving | 8 (24.2%) | 25 (75.8%) |
| Cleaning & Maintenance | 2 (40.0%) | 3 (60.0%) |
| Personal Care & Service | 0 (0.0%) | 0 (0.0%) |
| Total (Category) | 13 (31.7%) | 28 (68.3%) |
| Total (Overall) | 94 (53.1%) | 83 (46.9%) |
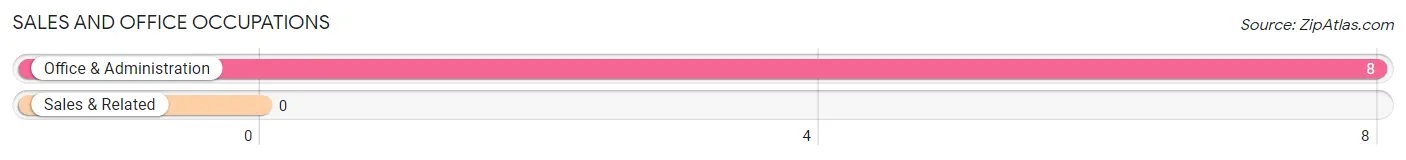
Sales and Office Occupations
The most common Sales and Office occupations in Stonerstown are , and Office & Administration (8 | 4.5%).
Sales and Office Occupations by Sex
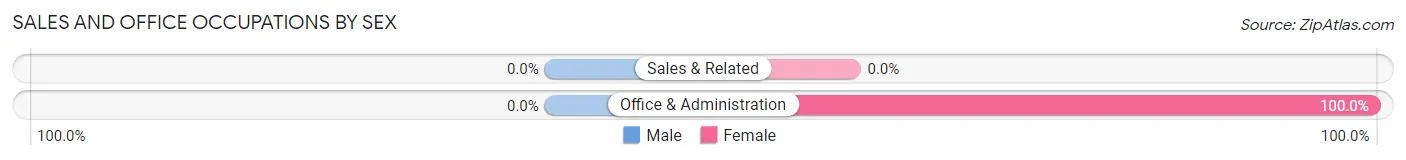
| Occupation | Male | Female |
| Sales & Related | 0 (0.0%) | 0 (0.0%) |
| Office & Administration | 0 (0.0%) | 8 (100.0%) |
| Total (Category) | 0 (0.0%) | 8 (100.0%) |
| Total (Overall) | 94 (53.1%) | 83 (46.9%) |
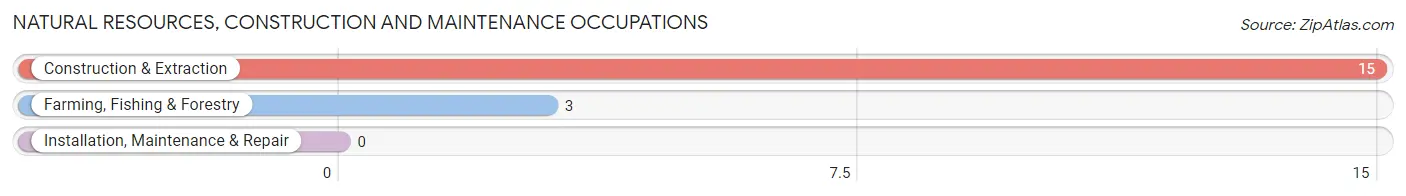
Natural Resources, Construction and Maintenance Occupations
The most common Natural Resources, Construction and Maintenance occupations in Stonerstown are Construction & Extraction (15 | 8.5%), and Farming, Fishing & Forestry (3 | 1.7%).
Natural Resources, Construction and Maintenance Occupations by Sex
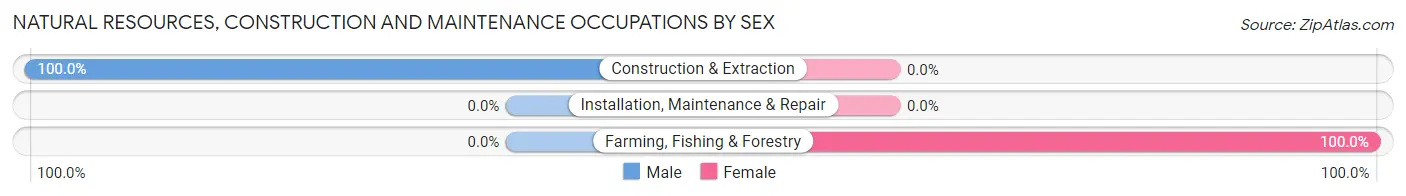
| Occupation | Male | Female |
| Farming, Fishing & Forestry | 0 (0.0%) | 3 (100.0%) |
| Construction & Extraction | 15 (100.0%) | 0 (0.0%) |
| Installation, Maintenance & Repair | 0 (0.0%) | 0 (0.0%) |
| Total (Category) | 15 (83.3%) | 3 (16.7%) |
| Total (Overall) | 94 (53.1%) | 83 (46.9%) |
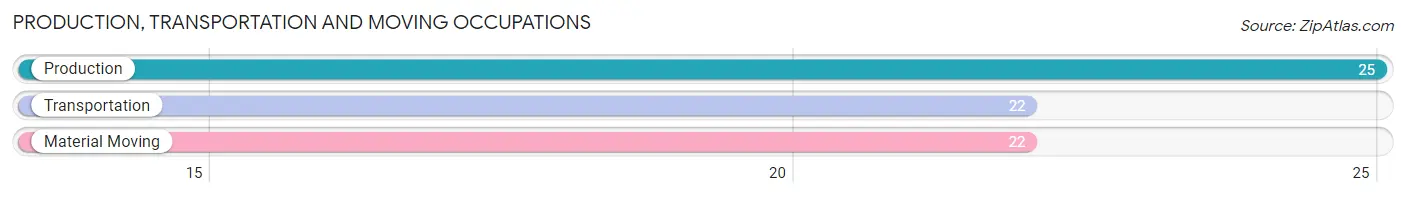
Production, Transportation and Moving Occupations
The most common Production, Transportation and Moving occupations in Stonerstown are Production (25 | 14.1%), Transportation (22 | 12.4%), and Material Moving (22 | 12.4%).
Production, Transportation and Moving Occupations by Sex
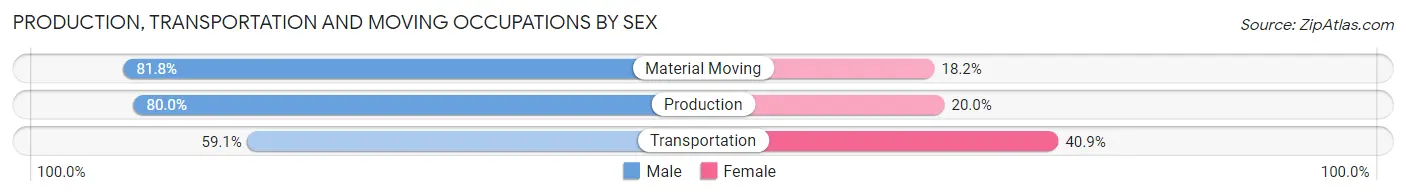
| Occupation | Male | Female |
| Production | 20 (80.0%) | 5 (20.0%) |
| Transportation | 13 (59.1%) | 9 (40.9%) |
| Material Moving | 18 (81.8%) | 4 (18.2%) |
| Total (Category) | 51 (73.9%) | 18 (26.1%) |
| Total (Overall) | 94 (53.1%) | 83 (46.9%) |
Employment Industries by Sex in Stonerstown
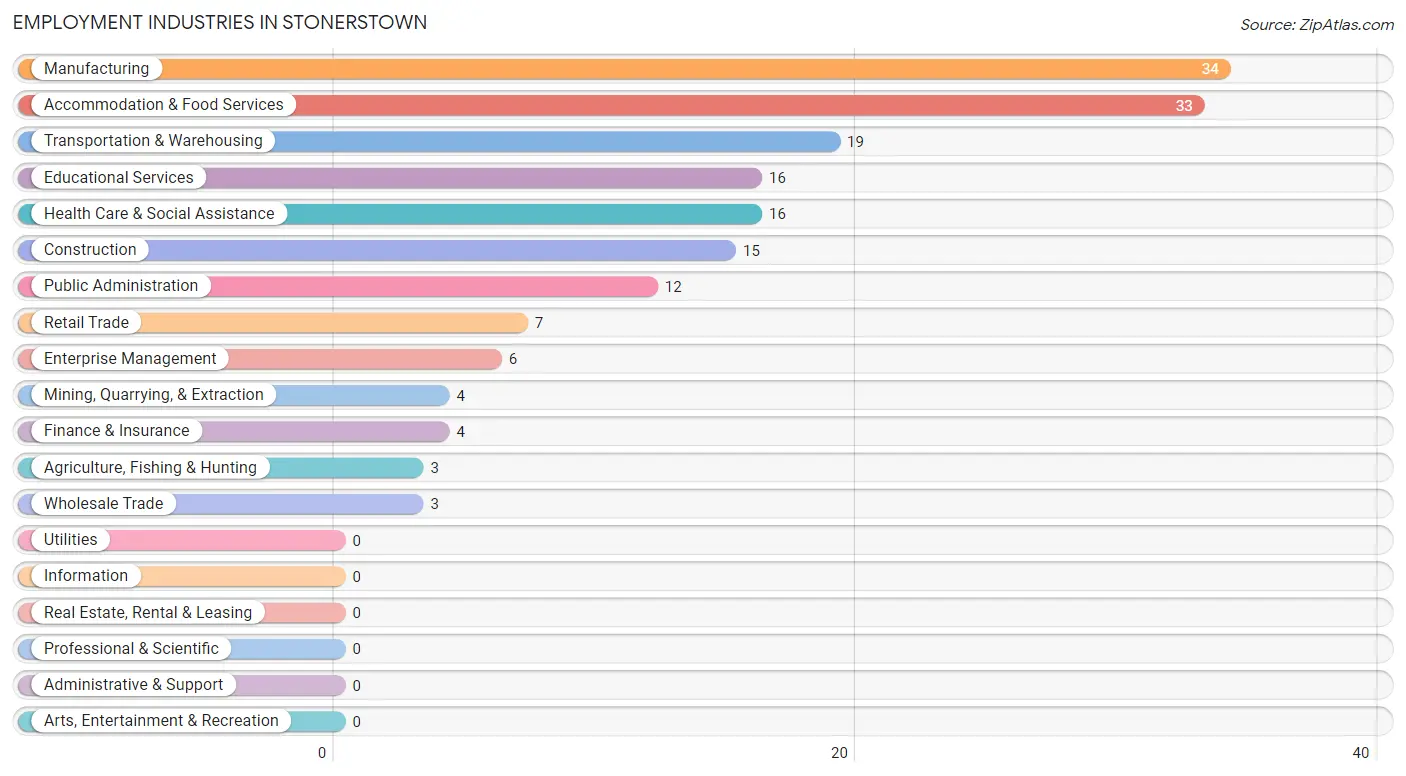
Employment Industries in Stonerstown
The major employment industries in Stonerstown include Manufacturing (34 | 19.2%), Accommodation & Food Services (33 | 18.6%), Transportation & Warehousing (19 | 10.7%), Educational Services (16 | 9.0%), and Health Care & Social Assistance (16 | 9.0%).
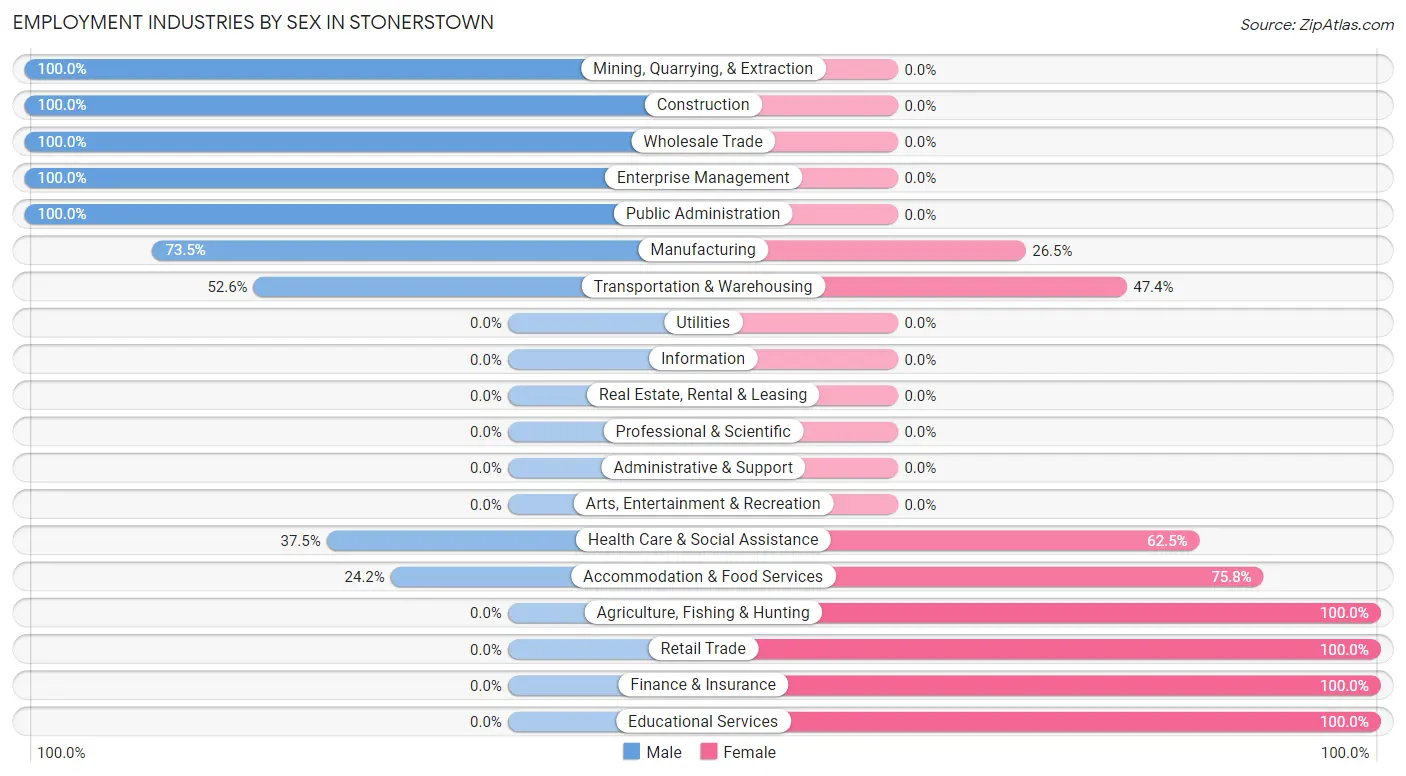
Employment Industries by Sex in Stonerstown
The Stonerstown industries that see more men than women are Mining, Quarrying, & Extraction (100.0%), Construction (100.0%), and Wholesale Trade (100.0%), whereas the industries that tend to have a higher number of women are Agriculture, Fishing & Hunting (100.0%), Retail Trade (100.0%), and Finance & Insurance (100.0%).
| Industry | Male | Female |
| Agriculture, Fishing & Hunting | 0 (0.0%) | 3 (100.0%) |
| Mining, Quarrying, & Extraction | 4 (100.0%) | 0 (0.0%) |
| Construction | 15 (100.0%) | 0 (0.0%) |
| Manufacturing | 25 (73.5%) | 9 (26.5%) |
| Wholesale Trade | 3 (100.0%) | 0 (0.0%) |
| Retail Trade | 0 (0.0%) | 7 (100.0%) |
| Transportation & Warehousing | 10 (52.6%) | 9 (47.4%) |
| Utilities | 0 (0.0%) | 0 (0.0%) |
| Information | 0 (0.0%) | 0 (0.0%) |
| Finance & Insurance | 0 (0.0%) | 4 (100.0%) |
| Real Estate, Rental & Leasing | 0 (0.0%) | 0 (0.0%) |
| Professional & Scientific | 0 (0.0%) | 0 (0.0%) |
| Enterprise Management | 6 (100.0%) | 0 (0.0%) |
| Administrative & Support | 0 (0.0%) | 0 (0.0%) |
| Educational Services | 0 (0.0%) | 16 (100.0%) |
| Health Care & Social Assistance | 6 (37.5%) | 10 (62.5%) |
| Arts, Entertainment & Recreation | 0 (0.0%) | 0 (0.0%) |
| Accommodation & Food Services | 8 (24.2%) | 25 (75.8%) |
| Public Administration | 12 (100.0%) | 0 (0.0%) |
| Total | 94 (53.1%) | 83 (46.9%) |
Education in Stonerstown
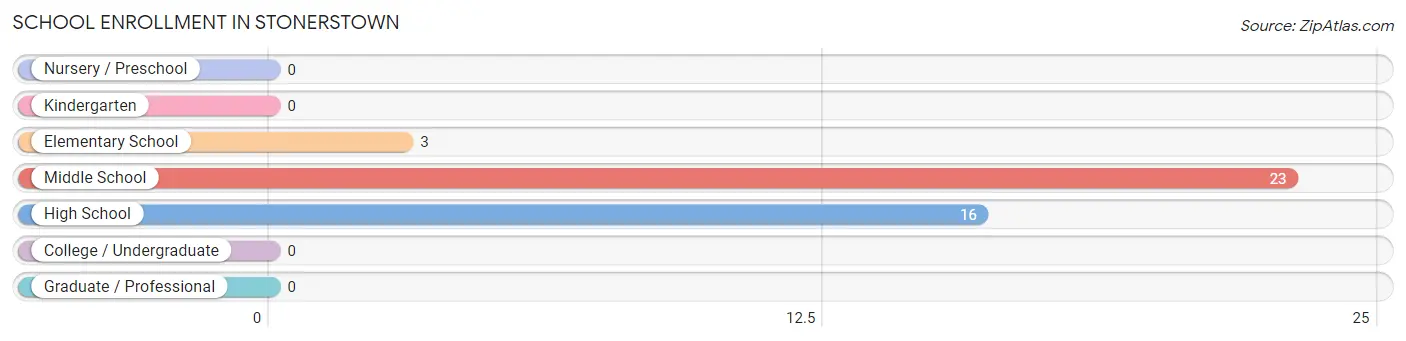
School Enrollment in Stonerstown
The most common levels of schooling among the 42 students in Stonerstown are middle school (23 | 54.8%), high school (16 | 38.1%), and elementary school (3 | 7.1%).
| School Level | # Students | % Students |
| Nursery / Preschool | 0 | 0.0% |
| Kindergarten | 0 | 0.0% |
| Elementary School | 3 | 7.1% |
| Middle School | 23 | 54.8% |
| High School | 16 | 38.1% |
| College / Undergraduate | 0 | 0.0% |
| Graduate / Professional | 0 | 0.0% |
| Total | 42 | 100.0% |
School Enrollment by Age by Funding Source in Stonerstown
Out of a total of 42 students who are enrolled in schools in Stonerstown, 15 (35.7%) attend a private institution, while the remaining 27 (64.3%) are enrolled in public schools. The age group of 10 to 14 year olds has the highest likelihood of being enrolled in private schools, with 15 (65.2% in the age bracket) enrolled. Conversely, the age group of 5 to 9 year old has the lowest likelihood of being enrolled in a private school, with 3 (100.0% in the age bracket) attending a public institution.
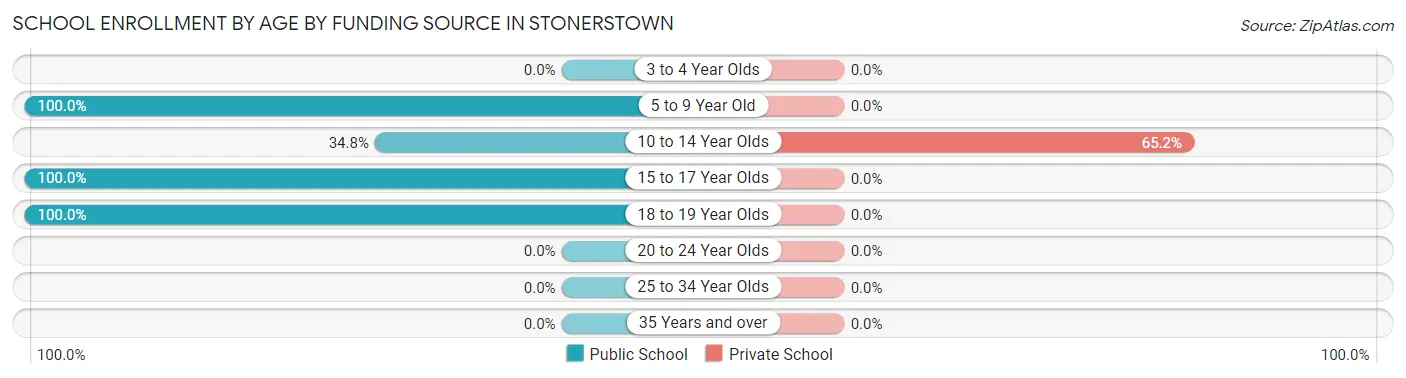
| Age Bracket | Public School | Private School |
| 3 to 4 Year Olds | 0 (0.0%) | 0 (0.0%) |
| 5 to 9 Year Old | 3 (100.0%) | 0 (0.0%) |
| 10 to 14 Year Olds | 8 (34.8%) | 15 (65.2%) |
| 15 to 17 Year Olds | 14 (100.0%) | 0 (0.0%) |
| 18 to 19 Year Olds | 2 (100.0%) | 0 (0.0%) |
| 20 to 24 Year Olds | 0 (0.0%) | 0 (0.0%) |
| 25 to 34 Year Olds | 0 (0.0%) | 0 (0.0%) |
| 35 Years and over | 0 (0.0%) | 0 (0.0%) |
| Total | 27 (64.3%) | 15 (35.7%) |
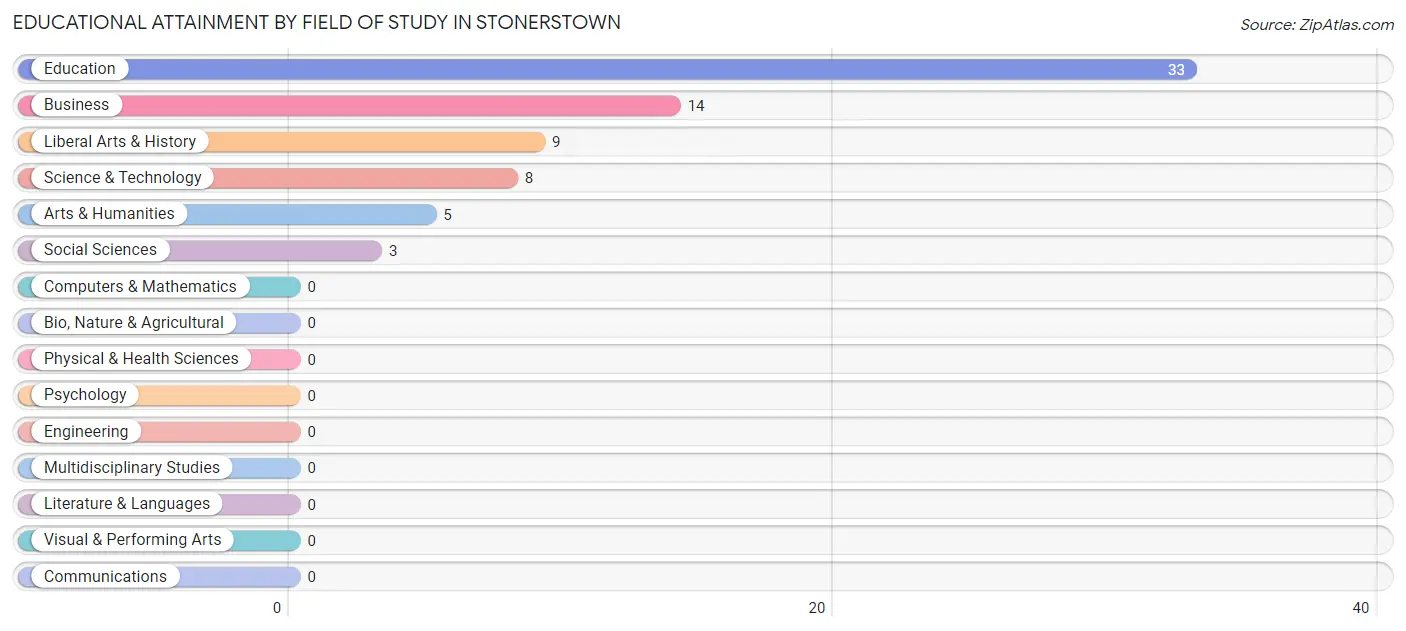
Educational Attainment by Field of Study in Stonerstown
Education (33 | 45.8%), business (14 | 19.4%), liberal arts & history (9 | 12.5%), science & technology (8 | 11.1%), and arts & humanities (5 | 6.9%) are the most common fields of study among 72 individuals in Stonerstown who have obtained a bachelor's degree or higher.
| Field of Study | # Graduates | % Graduates |
| Computers & Mathematics | 0 | 0.0% |
| Bio, Nature & Agricultural | 0 | 0.0% |
| Physical & Health Sciences | 0 | 0.0% |
| Psychology | 0 | 0.0% |
| Social Sciences | 3 | 4.2% |
| Engineering | 0 | 0.0% |
| Multidisciplinary Studies | 0 | 0.0% |
| Science & Technology | 8 | 11.1% |
| Business | 14 | 19.4% |
| Education | 33 | 45.8% |
| Literature & Languages | 0 | 0.0% |
| Liberal Arts & History | 9 | 12.5% |
| Visual & Performing Arts | 0 | 0.0% |
| Communications | 0 | 0.0% |
| Arts & Humanities | 5 | 6.9% |
| Total | 72 | 100.0% |
Transportation & Commute in Stonerstown
Vehicle Availability by Sex in Stonerstown
The most prevalent vehicle ownership categories in Stonerstown are males with 3 vehicles (43, accounting for 45.7%) and females with 3 vehicles (36, making up 51.8%).
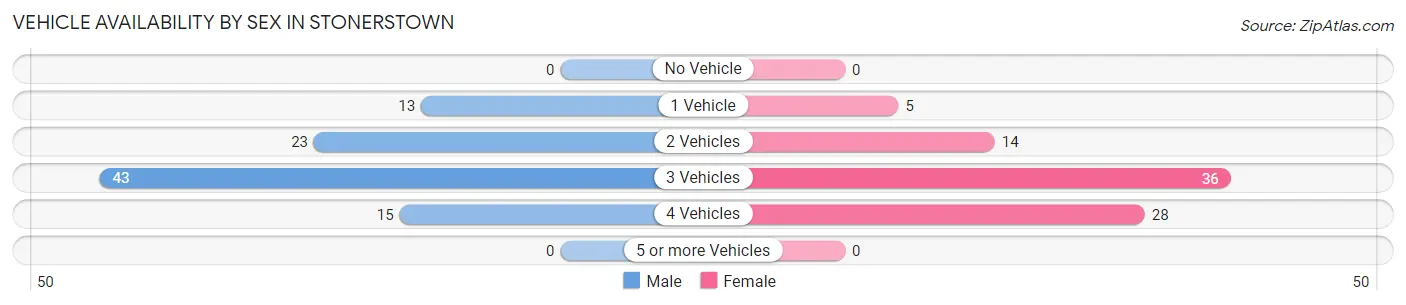
| Vehicles Available | Male | Female |
| No Vehicle | 0 (0.0%) | 0 (0.0%) |
| 1 Vehicle | 13 (13.8%) | 5 (6.0%) |
| 2 Vehicles | 23 (24.5%) | 14 (16.9%) |
| 3 Vehicles | 43 (45.7%) | 36 (43.4%) |
| 4 Vehicles | 15 (16.0%) | 28 (33.7%) |
| 5 or more Vehicles | 0 (0.0%) | 0 (0.0%) |
| Total | 94 (100.0%) | 83 (100.0%) |
Commute Time in Stonerstown
The most frequently occuring commute durations in Stonerstown are 20 to 24 minutes (32 commuters, 21.0%), 10 to 14 minutes (28 commuters, 18.4%), and 60 to 89 minutes (27 commuters, 17.8%).
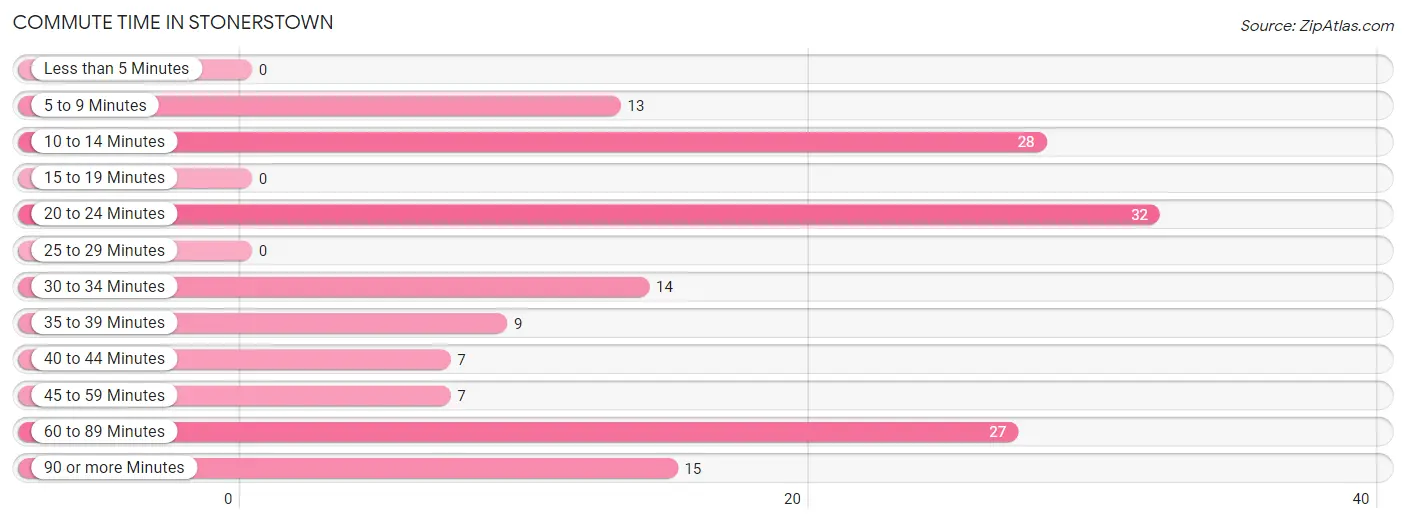
| Commute Time | # Commuters | % Commuters |
| Less than 5 Minutes | 0 | 0.0% |
| 5 to 9 Minutes | 13 | 8.6% |
| 10 to 14 Minutes | 28 | 18.4% |
| 15 to 19 Minutes | 0 | 0.0% |
| 20 to 24 Minutes | 32 | 21.0% |
| 25 to 29 Minutes | 0 | 0.0% |
| 30 to 34 Minutes | 14 | 9.2% |
| 35 to 39 Minutes | 9 | 5.9% |
| 40 to 44 Minutes | 7 | 4.6% |
| 45 to 59 Minutes | 7 | 4.6% |
| 60 to 89 Minutes | 27 | 17.8% |
| 90 or more Minutes | 15 | 9.9% |
Commute Time by Sex in Stonerstown
The most common commute times in Stonerstown are 60 to 89 minutes (23 commuters, 26.1%) for males and 20 to 24 minutes (25 commuters, 39.1%) for females.
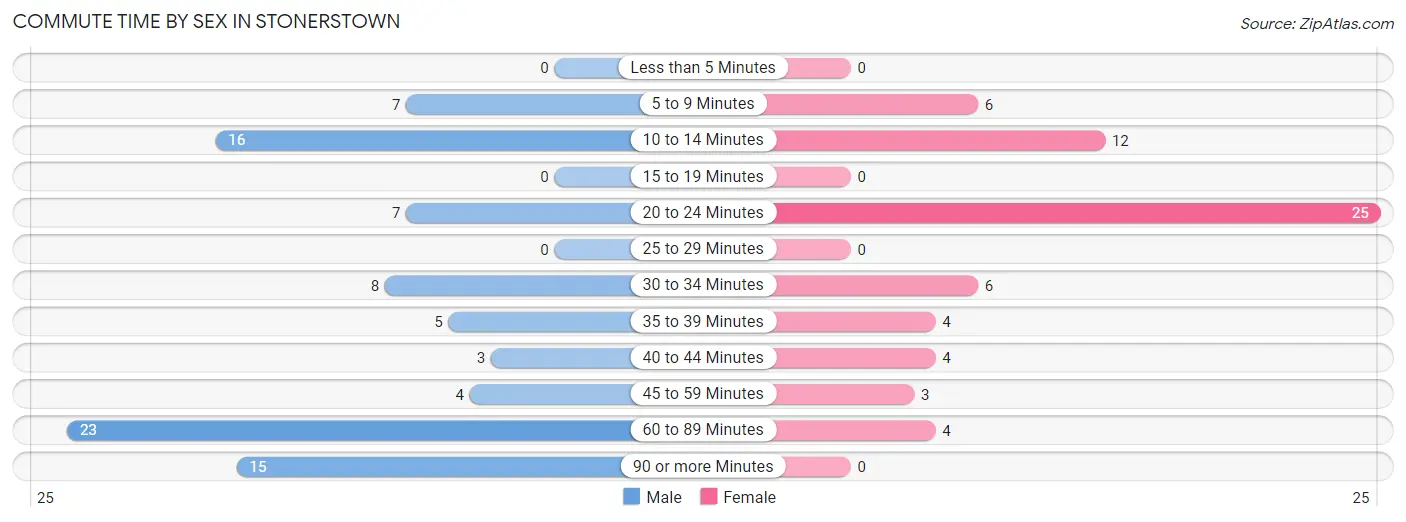
| Commute Time | Male | Female |
| Less than 5 Minutes | 0 (0.0%) | 0 (0.0%) |
| 5 to 9 Minutes | 7 (8.0%) | 6 (9.4%) |
| 10 to 14 Minutes | 16 (18.2%) | 12 (18.8%) |
| 15 to 19 Minutes | 0 (0.0%) | 0 (0.0%) |
| 20 to 24 Minutes | 7 (8.0%) | 25 (39.1%) |
| 25 to 29 Minutes | 0 (0.0%) | 0 (0.0%) |
| 30 to 34 Minutes | 8 (9.1%) | 6 (9.4%) |
| 35 to 39 Minutes | 5 (5.7%) | 4 (6.2%) |
| 40 to 44 Minutes | 3 (3.4%) | 4 (6.2%) |
| 45 to 59 Minutes | 4 (4.5%) | 3 (4.7%) |
| 60 to 89 Minutes | 23 (26.1%) | 4 (6.2%) |
| 90 or more Minutes | 15 (17.1%) | 0 (0.0%) |
Time of Departure to Work by Sex in Stonerstown
The most frequent times of departure to work in Stonerstown are 4:00 PM to 11:59 PM (19, 21.6%) for males and 7:00 AM to 7:29 AM (26, 40.6%) for females.
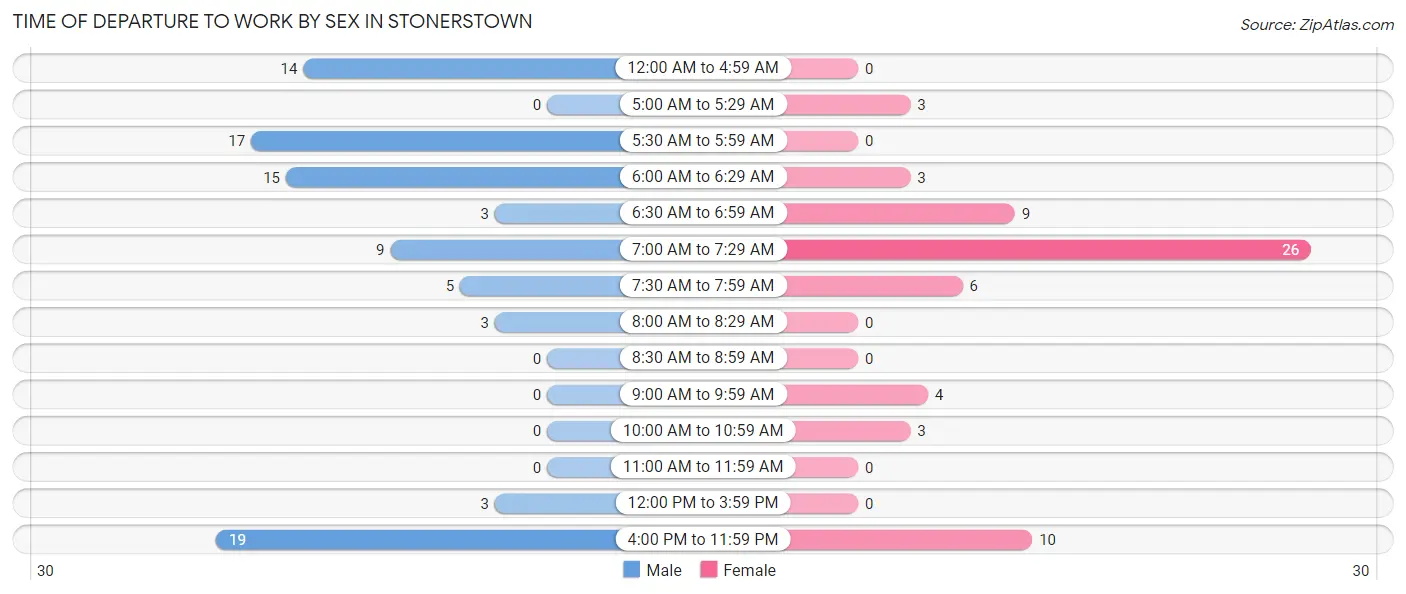
| Time of Departure | Male | Female |
| 12:00 AM to 4:59 AM | 14 (15.9%) | 0 (0.0%) |
| 5:00 AM to 5:29 AM | 0 (0.0%) | 3 (4.7%) |
| 5:30 AM to 5:59 AM | 17 (19.3%) | 0 (0.0%) |
| 6:00 AM to 6:29 AM | 15 (17.1%) | 3 (4.7%) |
| 6:30 AM to 6:59 AM | 3 (3.4%) | 9 (14.1%) |
| 7:00 AM to 7:29 AM | 9 (10.2%) | 26 (40.6%) |
| 7:30 AM to 7:59 AM | 5 (5.7%) | 6 (9.4%) |
| 8:00 AM to 8:29 AM | 3 (3.4%) | 0 (0.0%) |
| 8:30 AM to 8:59 AM | 0 (0.0%) | 0 (0.0%) |
| 9:00 AM to 9:59 AM | 0 (0.0%) | 4 (6.2%) |
| 10:00 AM to 10:59 AM | 0 (0.0%) | 3 (4.7%) |
| 11:00 AM to 11:59 AM | 0 (0.0%) | 0 (0.0%) |
| 12:00 PM to 3:59 PM | 3 (3.4%) | 0 (0.0%) |
| 4:00 PM to 11:59 PM | 19 (21.6%) | 10 (15.6%) |
| Total | 88 (100.0%) | 64 (100.0%) |
Housing Occupancy in Stonerstown
Occupancy by Ownership in Stonerstown
Of the total 170 dwellings in Stonerstown, owner-occupied units account for 158 (92.9%), while renter-occupied units make up 12 (7.1%).
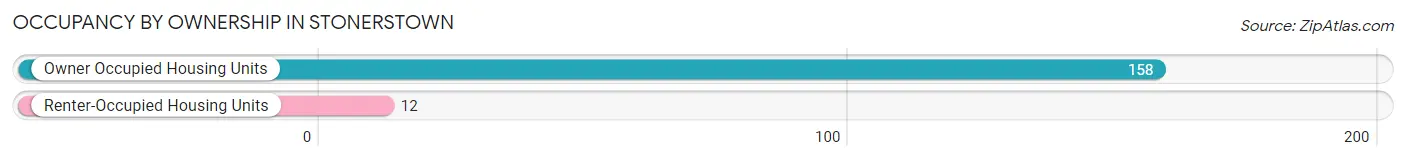
| Occupancy | # Housing Units | % Housing Units |
| Owner Occupied Housing Units | 158 | 92.9% |
| Renter-Occupied Housing Units | 12 | 7.1% |
| Total Occupied Housing Units | 170 | 100.0% |
Occupancy by Household Size in Stonerstown
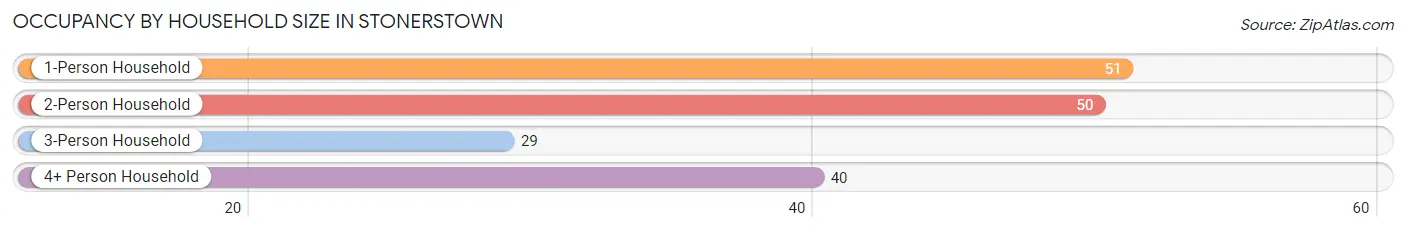
| Household Size | # Housing Units | % Housing Units |
| 1-Person Household | 51 | 30.0% |
| 2-Person Household | 50 | 29.4% |
| 3-Person Household | 29 | 17.1% |
| 4+ Person Household | 40 | 23.5% |
| Total Housing Units | 170 | 100.0% |
Occupancy by Ownership by Household Size in Stonerstown
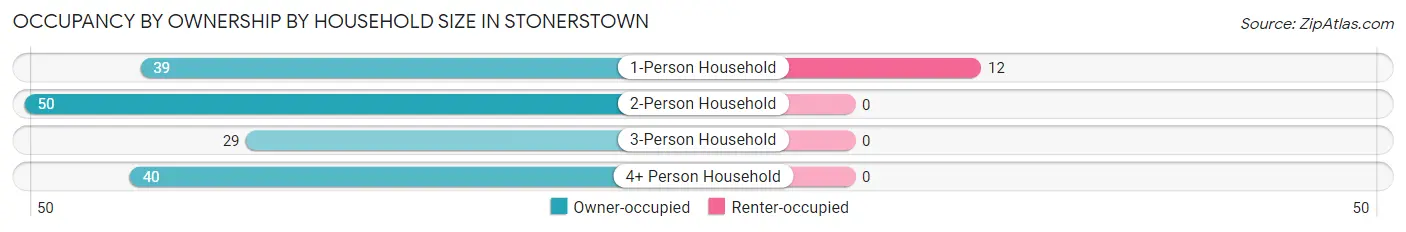
| Household Size | Owner-occupied | Renter-occupied |
| 1-Person Household | 39 (76.5%) | 12 (23.5%) |
| 2-Person Household | 50 (100.0%) | 0 (0.0%) |
| 3-Person Household | 29 (100.0%) | 0 (0.0%) |
| 4+ Person Household | 40 (100.0%) | 0 (0.0%) |
| Total Housing Units | 158 (92.9%) | 12 (7.1%) |
Occupancy by Educational Attainment in Stonerstown
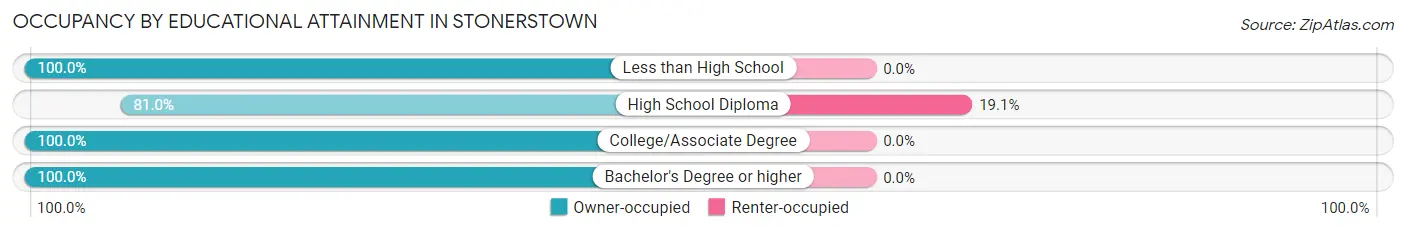
| Household Size | Owner-occupied | Renter-occupied |
| Less than High School | 9 (100.0%) | 0 (0.0%) |
| High School Diploma | 51 (80.9%) | 12 (19.1%) |
| College/Associate Degree | 65 (100.0%) | 0 (0.0%) |
| Bachelor's Degree or higher | 33 (100.0%) | 0 (0.0%) |
Occupancy by Age of Householder in Stonerstown
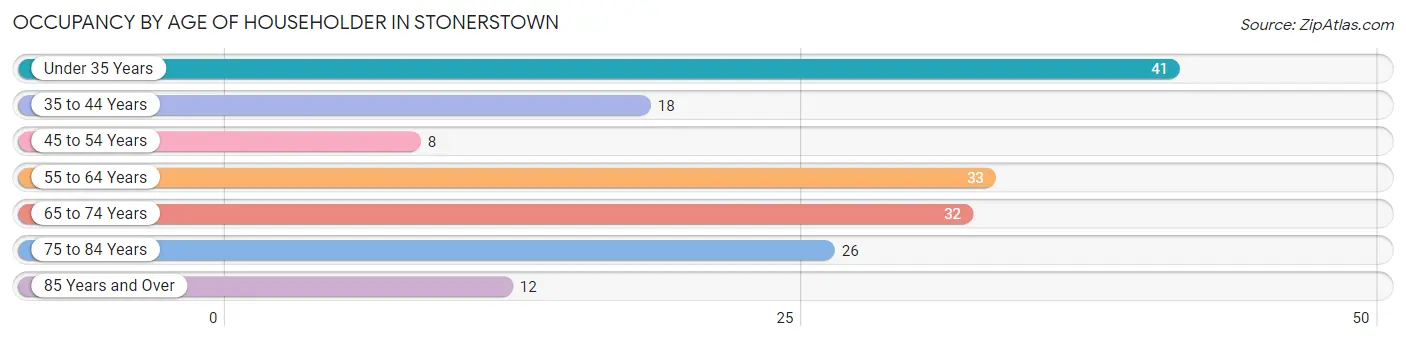
| Age Bracket | # Households | % Households |
| Under 35 Years | 41 | 24.1% |
| 35 to 44 Years | 18 | 10.6% |
| 45 to 54 Years | 8 | 4.7% |
| 55 to 64 Years | 33 | 19.4% |
| 65 to 74 Years | 32 | 18.8% |
| 75 to 84 Years | 26 | 15.3% |
| 85 Years and Over | 12 | 7.1% |
| Total | 170 | 100.0% |
Housing Finances in Stonerstown
Median Income by Occupancy in Stonerstown
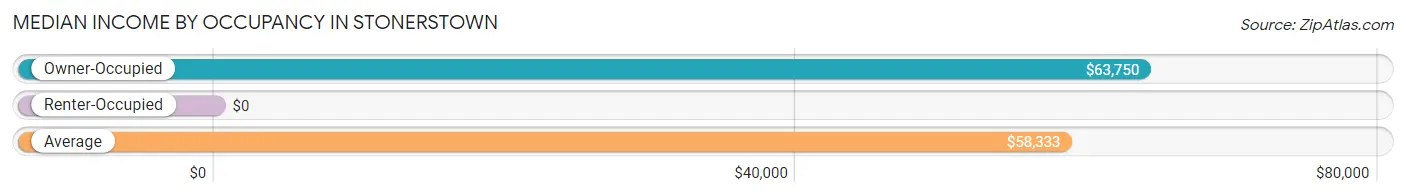
| Occupancy Type | # Households | Median Income |
| Owner-Occupied | 158 (92.9%) | $63,750 |
| Renter-Occupied | 12 (7.1%) | $0 |
| Average | 170 (100.0%) | $58,333 |
Occupancy by Householder Income Bracket in Stonerstown
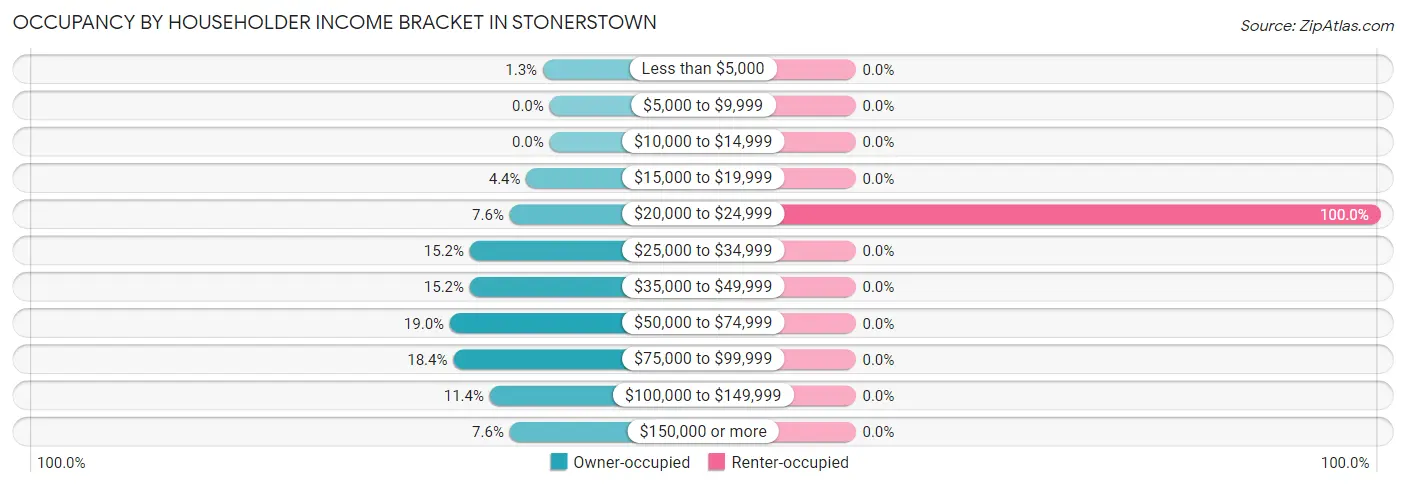
| Income Bracket | Owner-occupied | Renter-occupied |
| Less than $5,000 | 2 (1.3%) | 0 (0.0%) |
| $5,000 to $9,999 | 0 (0.0%) | 0 (0.0%) |
| $10,000 to $14,999 | 0 (0.0%) | 0 (0.0%) |
| $15,000 to $19,999 | 7 (4.4%) | 0 (0.0%) |
| $20,000 to $24,999 | 12 (7.6%) | 12 (100.0%) |
| $25,000 to $34,999 | 24 (15.2%) | 0 (0.0%) |
| $35,000 to $49,999 | 24 (15.2%) | 0 (0.0%) |
| $50,000 to $74,999 | 30 (19.0%) | 0 (0.0%) |
| $75,000 to $99,999 | 29 (18.3%) | 0 (0.0%) |
| $100,000 to $149,999 | 18 (11.4%) | 0 (0.0%) |
| $150,000 or more | 12 (7.6%) | 0 (0.0%) |
| Total | 158 (100.0%) | 12 (100.0%) |
Monthly Housing Cost Tiers in Stonerstown
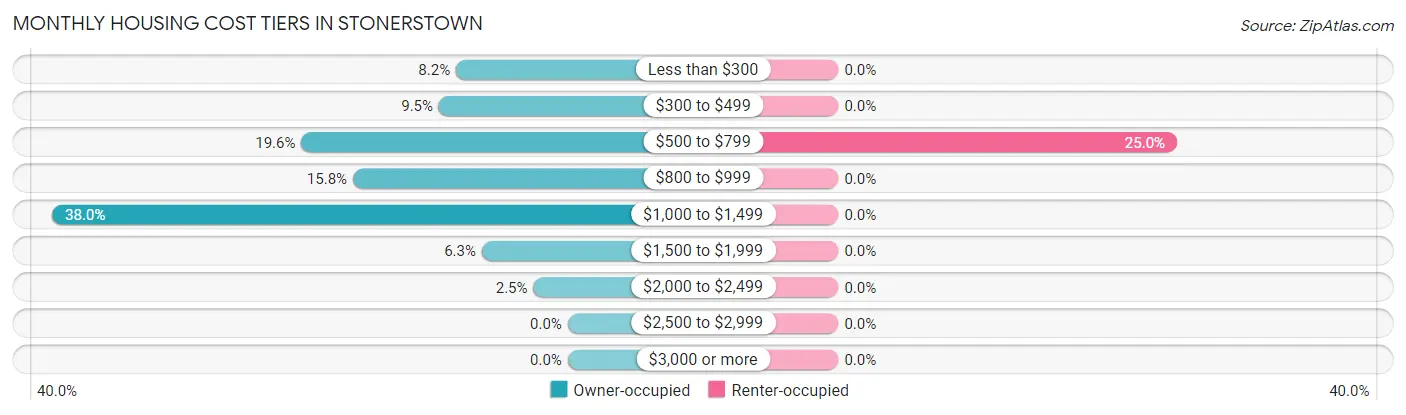
| Monthly Cost | Owner-occupied | Renter-occupied |
| Less than $300 | 13 (8.2%) | 0 (0.0%) |
| $300 to $499 | 15 (9.5%) | 0 (0.0%) |
| $500 to $799 | 31 (19.6%) | 3 (25.0%) |
| $800 to $999 | 25 (15.8%) | 0 (0.0%) |
| $1,000 to $1,499 | 60 (38.0%) | 0 (0.0%) |
| $1,500 to $1,999 | 10 (6.3%) | 0 (0.0%) |
| $2,000 to $2,499 | 4 (2.5%) | 0 (0.0%) |
| $2,500 to $2,999 | 0 (0.0%) | 0 (0.0%) |
| $3,000 or more | 0 (0.0%) | 0 (0.0%) |
| Total | 158 (100.0%) | 12 (100.0%) |
Physical Housing Characteristics in Stonerstown
Housing Structures in Stonerstown
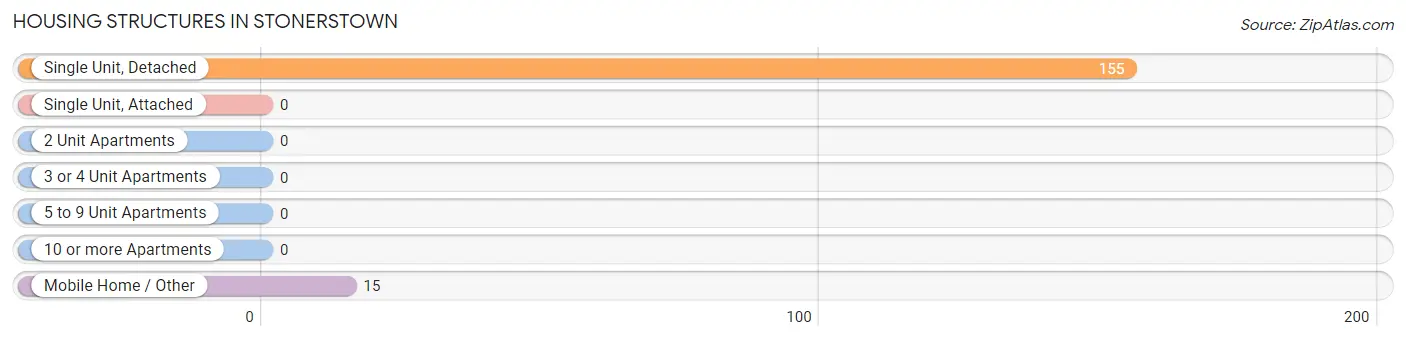
| Structure Type | # Housing Units | % Housing Units |
| Single Unit, Detached | 155 | 91.2% |
| Single Unit, Attached | 0 | 0.0% |
| 2 Unit Apartments | 0 | 0.0% |
| 3 or 4 Unit Apartments | 0 | 0.0% |
| 5 to 9 Unit Apartments | 0 | 0.0% |
| 10 or more Apartments | 0 | 0.0% |
| Mobile Home / Other | 15 | 8.8% |
| Total | 170 | 100.0% |
Housing Structures by Occupancy in Stonerstown
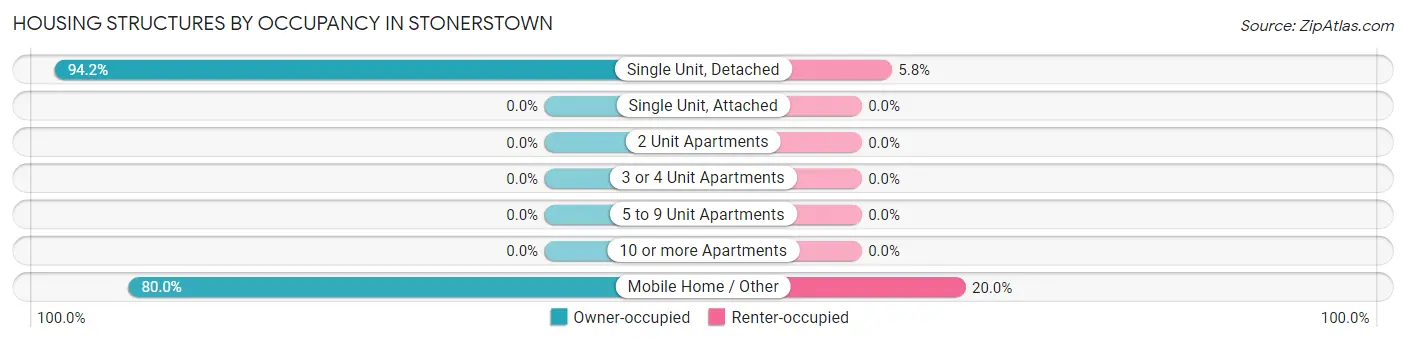
| Structure Type | Owner-occupied | Renter-occupied |
| Single Unit, Detached | 146 (94.2%) | 9 (5.8%) |
| Single Unit, Attached | 0 (0.0%) | 0 (0.0%) |
| 2 Unit Apartments | 0 (0.0%) | 0 (0.0%) |
| 3 or 4 Unit Apartments | 0 (0.0%) | 0 (0.0%) |
| 5 to 9 Unit Apartments | 0 (0.0%) | 0 (0.0%) |
| 10 or more Apartments | 0 (0.0%) | 0 (0.0%) |
| Mobile Home / Other | 12 (80.0%) | 3 (20.0%) |
| Total | 158 (92.9%) | 12 (7.1%) |
Housing Structures by Number of Rooms in Stonerstown
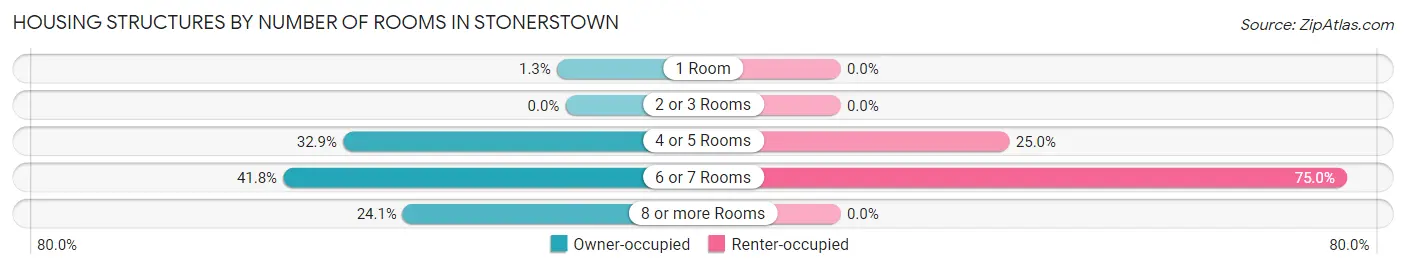
| Number of Rooms | Owner-occupied | Renter-occupied |
| 1 Room | 2 (1.3%) | 0 (0.0%) |
| 2 or 3 Rooms | 0 (0.0%) | 0 (0.0%) |
| 4 or 5 Rooms | 52 (32.9%) | 3 (25.0%) |
| 6 or 7 Rooms | 66 (41.8%) | 9 (75.0%) |
| 8 or more Rooms | 38 (24.0%) | 0 (0.0%) |
| Total | 158 (100.0%) | 12 (100.0%) |
Housing Structure by Heating Type in Stonerstown
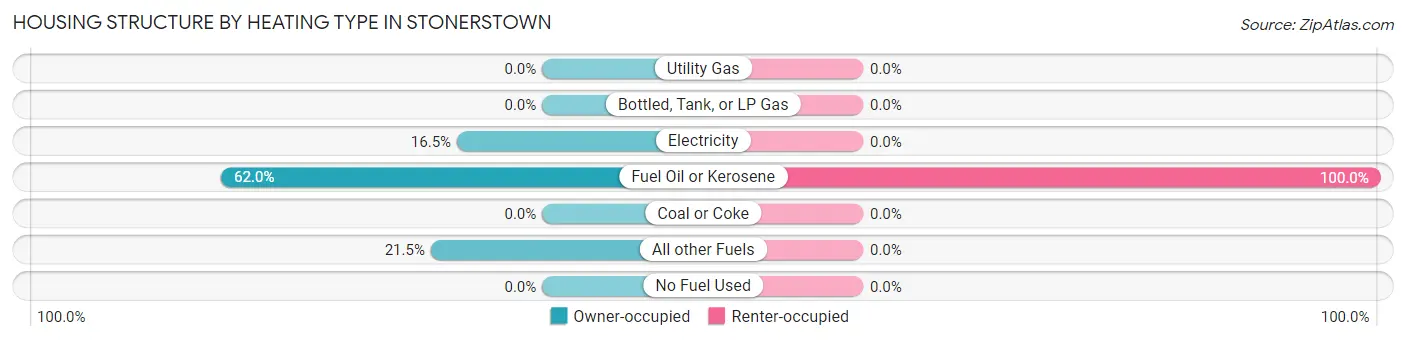
| Heating Type | Owner-occupied | Renter-occupied |
| Utility Gas | 0 (0.0%) | 0 (0.0%) |
| Bottled, Tank, or LP Gas | 0 (0.0%) | 0 (0.0%) |
| Electricity | 26 (16.5%) | 0 (0.0%) |
| Fuel Oil or Kerosene | 98 (62.0%) | 12 (100.0%) |
| Coal or Coke | 0 (0.0%) | 0 (0.0%) |
| All other Fuels | 34 (21.5%) | 0 (0.0%) |
| No Fuel Used | 0 (0.0%) | 0 (0.0%) |
| Total | 158 (100.0%) | 12 (100.0%) |
Household Vehicle Usage in Stonerstown
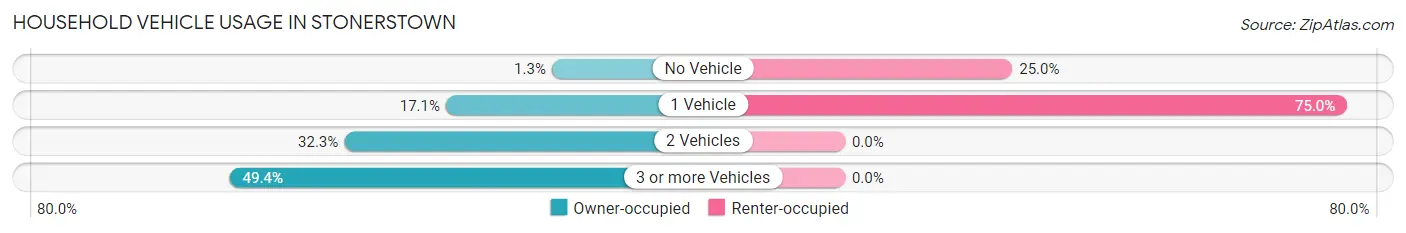
| Vehicles per Household | Owner-occupied | Renter-occupied |
| No Vehicle | 2 (1.3%) | 3 (25.0%) |
| 1 Vehicle | 27 (17.1%) | 9 (75.0%) |
| 2 Vehicles | 51 (32.3%) | 0 (0.0%) |
| 3 or more Vehicles | 78 (49.4%) | 0 (0.0%) |
| Total | 158 (100.0%) | 12 (100.0%) |
Real Estate & Mortgages in Stonerstown
Real Estate and Mortgage Overview in Stonerstown
| Characteristic | Without Mortgage | With Mortgage |
| Housing Units | 59 | 99 |
| Median Property Value | $123,400 | $126,900 |
| Median Household Income | $33,523 | $9 |
| Monthly Housing Costs | $525 | $0 |
| Real Estate Taxes | $1,625 | $0 |
Property Value by Mortgage Status in Stonerstown
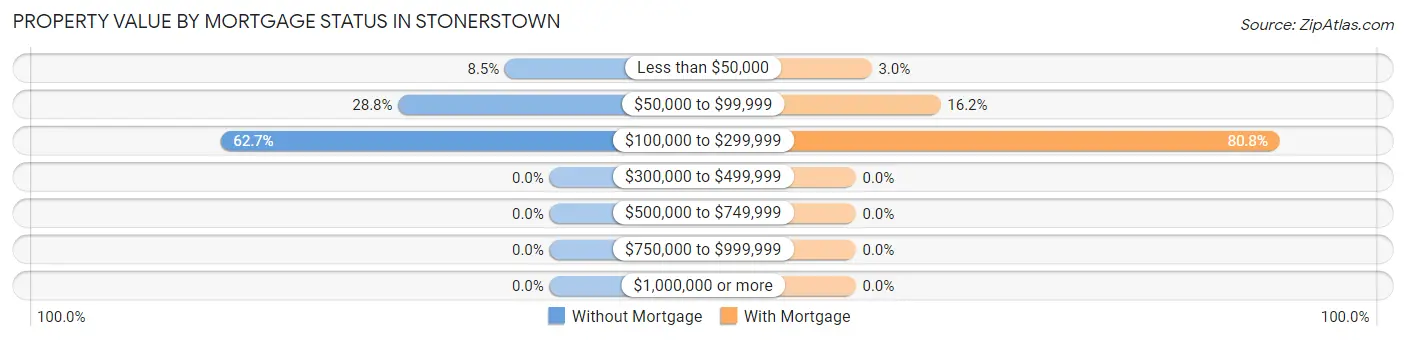
| Property Value | Without Mortgage | With Mortgage |
| Less than $50,000 | 5 (8.5%) | 3 (3.0%) |
| $50,000 to $99,999 | 17 (28.8%) | 16 (16.2%) |
| $100,000 to $299,999 | 37 (62.7%) | 80 (80.8%) |
| $300,000 to $499,999 | 0 (0.0%) | 0 (0.0%) |
| $500,000 to $749,999 | 0 (0.0%) | 0 (0.0%) |
| $750,000 to $999,999 | 0 (0.0%) | 0 (0.0%) |
| $1,000,000 or more | 0 (0.0%) | 0 (0.0%) |
| Total | 59 (100.0%) | 99 (100.0%) |
Household Income by Mortgage Status in Stonerstown
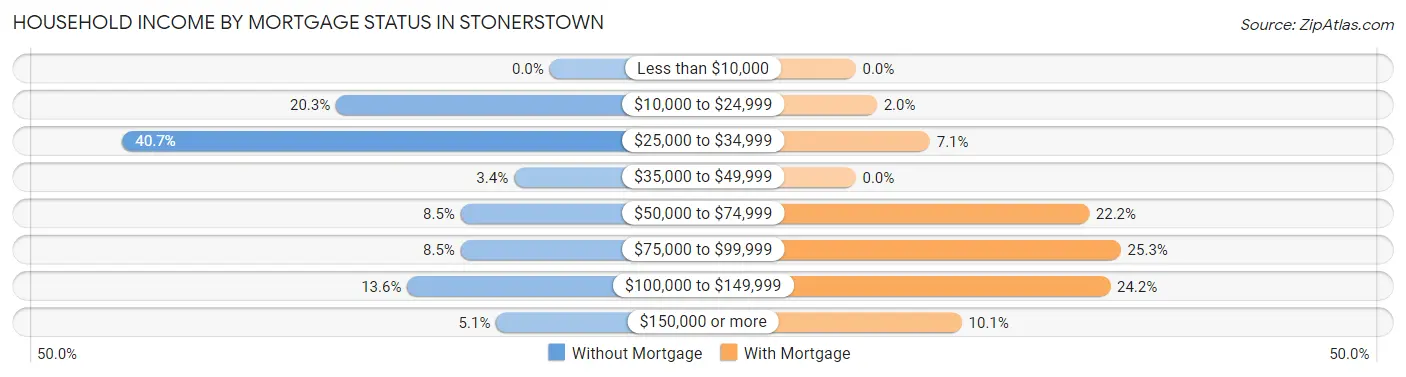
| Household Income | Without Mortgage | With Mortgage |
| Less than $10,000 | 0 (0.0%) | 0 (0.0%) |
| $10,000 to $24,999 | 12 (20.3%) | 2 (2.0%) |
| $25,000 to $34,999 | 24 (40.7%) | 7 (7.1%) |
| $35,000 to $49,999 | 2 (3.4%) | 0 (0.0%) |
| $50,000 to $74,999 | 5 (8.5%) | 22 (22.2%) |
| $75,000 to $99,999 | 5 (8.5%) | 25 (25.3%) |
| $100,000 to $149,999 | 8 (13.6%) | 24 (24.2%) |
| $150,000 or more | 3 (5.1%) | 10 (10.1%) |
| Total | 59 (100.0%) | 99 (100.0%) |
Property Value to Household Income Ratio in Stonerstown
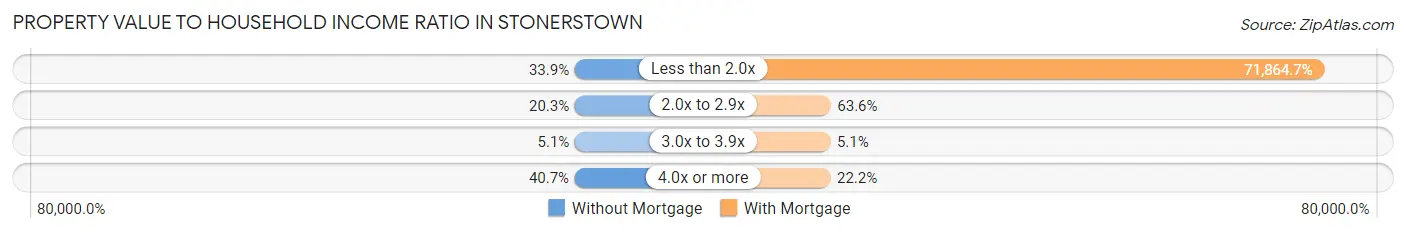
| Value-to-Income Ratio | Without Mortgage | With Mortgage |
| Less than 2.0x | 20 (33.9%) | 71,146 (71,864.6%) |
| 2.0x to 2.9x | 12 (20.3%) | 63 (63.6%) |
| 3.0x to 3.9x | 3 (5.1%) | 5 (5.1%) |
| 4.0x or more | 24 (40.7%) | 22 (22.2%) |
| Total | 59 (100.0%) | 99 (100.0%) |
Real Estate Taxes by Mortgage Status in Stonerstown
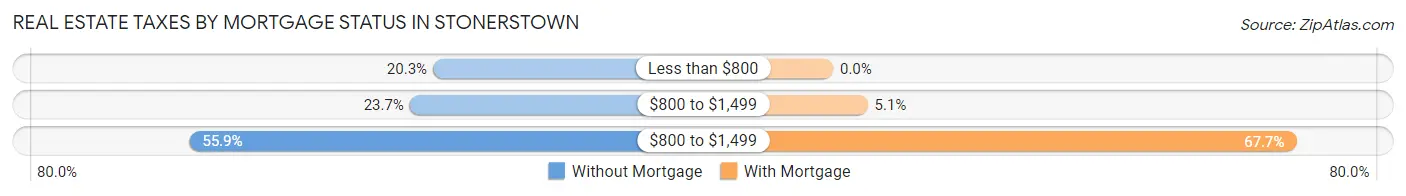
| Property Taxes | Without Mortgage | With Mortgage |
| Less than $800 | 12 (20.3%) | 0 (0.0%) |
| $800 to $1,499 | 14 (23.7%) | 5 (5.1%) |
| $800 to $1,499 | 33 (55.9%) | 67 (67.7%) |
| Total | 59 (100.0%) | 99 (100.0%) |
Health & Disability in Stonerstown
Health Insurance Coverage by Age in Stonerstown
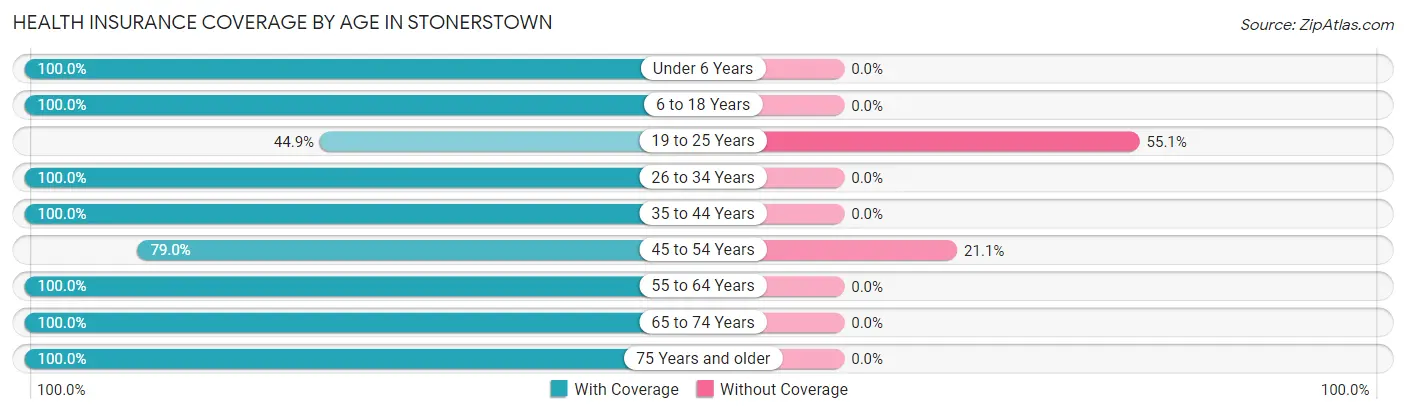
| Age Bracket | With Coverage | Without Coverage |
| Under 6 Years | 34 (100.0%) | 0 (0.0%) |
| 6 to 18 Years | 42 (100.0%) | 0 (0.0%) |
| 19 to 25 Years | 31 (44.9%) | 38 (55.1%) |
| 26 to 34 Years | 27 (100.0%) | 0 (0.0%) |
| 35 to 44 Years | 37 (100.0%) | 0 (0.0%) |
| 45 to 54 Years | 15 (78.9%) | 4 (21.0%) |
| 55 to 64 Years | 67 (100.0%) | 0 (0.0%) |
| 65 to 74 Years | 45 (100.0%) | 0 (0.0%) |
| 75 Years and older | 50 (100.0%) | 0 (0.0%) |
| Total | 348 (89.2%) | 42 (10.8%) |
Health Insurance Coverage by Citizenship Status in Stonerstown
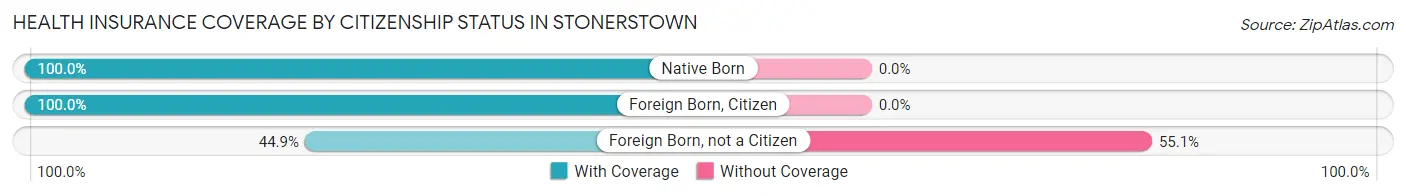
| Citizenship Status | With Coverage | Without Coverage |
| Native Born | 34 (100.0%) | 0 (0.0%) |
| Foreign Born, Citizen | 42 (100.0%) | 0 (0.0%) |
| Foreign Born, not a Citizen | 31 (44.9%) | 38 (55.1%) |
Health Insurance Coverage by Household Income in Stonerstown
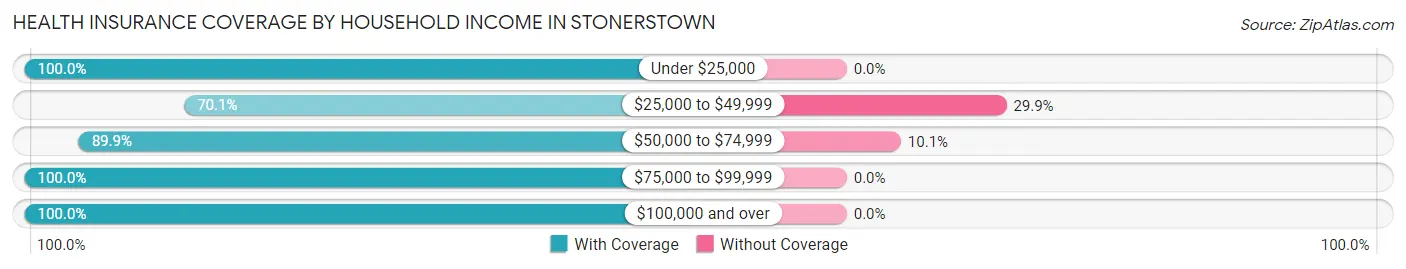
| Household Income | With Coverage | Without Coverage |
| Under $25,000 | 37 (100.0%) | 0 (0.0%) |
| $25,000 to $49,999 | 82 (70.1%) | 35 (29.9%) |
| $50,000 to $74,999 | 62 (89.9%) | 7 (10.1%) |
| $75,000 to $99,999 | 92 (100.0%) | 0 (0.0%) |
| $100,000 and over | 75 (100.0%) | 0 (0.0%) |
Public vs Private Health Insurance Coverage by Age in Stonerstown
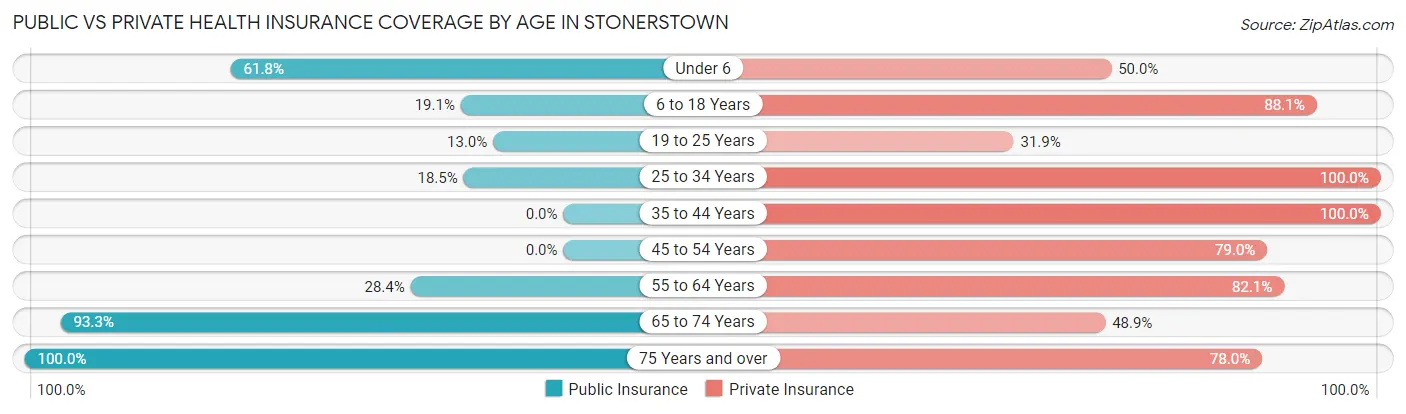
| Age Bracket | Public Insurance | Private Insurance |
| Under 6 | 21 (61.8%) | 17 (50.0%) |
| 6 to 18 Years | 8 (19.1%) | 37 (88.1%) |
| 19 to 25 Years | 9 (13.0%) | 22 (31.9%) |
| 25 to 34 Years | 5 (18.5%) | 27 (100.0%) |
| 35 to 44 Years | 0 (0.0%) | 37 (100.0%) |
| 45 to 54 Years | 0 (0.0%) | 15 (78.9%) |
| 55 to 64 Years | 19 (28.4%) | 55 (82.1%) |
| 65 to 74 Years | 42 (93.3%) | 22 (48.9%) |
| 75 Years and over | 50 (100.0%) | 39 (78.0%) |
| Total | 154 (39.5%) | 271 (69.5%) |
Disability Status by Sex by Age in Stonerstown
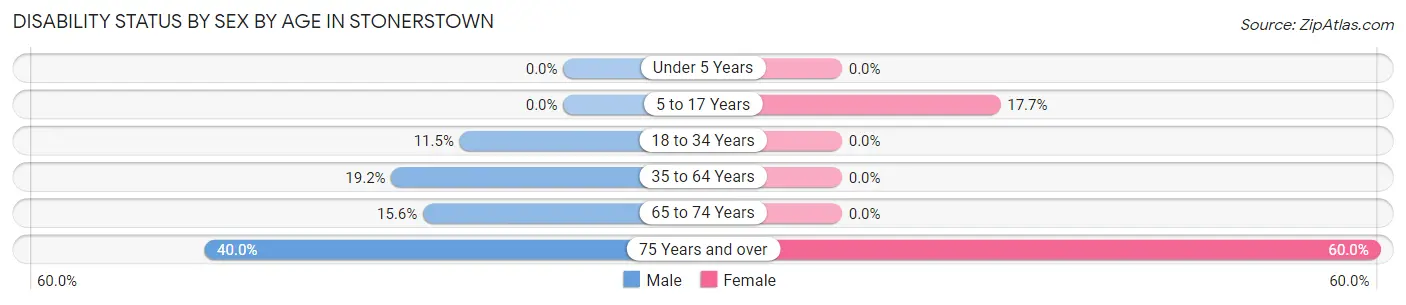
| Age Bracket | Male | Female |
| Under 5 Years | 0 (0.0%) | 0 (0.0%) |
| 5 to 17 Years | 0 (0.0%) | 3 (17.6%) |
| 18 to 34 Years | 6 (11.5%) | 0 (0.0%) |
| 35 to 64 Years | 9 (19.2%) | 0 (0.0%) |
| 65 to 74 Years | 5 (15.6%) | 0 (0.0%) |
| 75 Years and over | 10 (40.0%) | 15 (60.0%) |
Disability Class by Sex by Age in Stonerstown
Disability Class: Hearing Difficulty
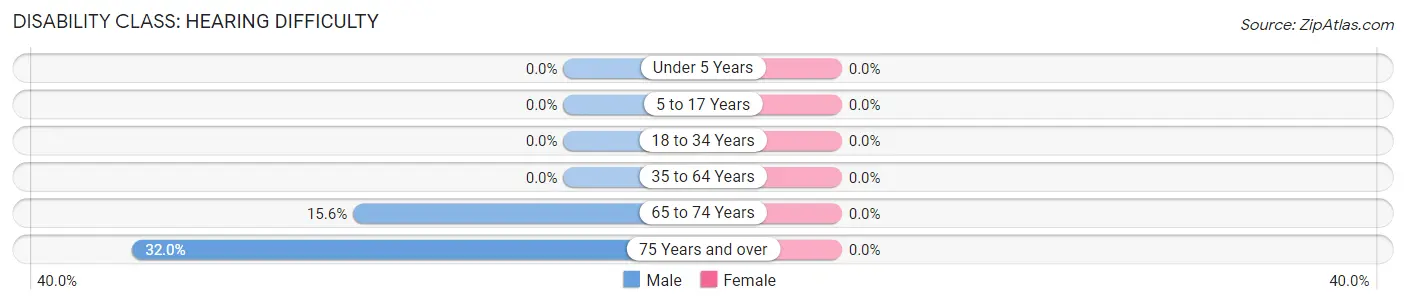
| Age Bracket | Male | Female |
| Under 5 Years | 0 (0.0%) | 0 (0.0%) |
| 5 to 17 Years | 0 (0.0%) | 0 (0.0%) |
| 18 to 34 Years | 0 (0.0%) | 0 (0.0%) |
| 35 to 64 Years | 0 (0.0%) | 0 (0.0%) |
| 65 to 74 Years | 5 (15.6%) | 0 (0.0%) |
| 75 Years and over | 8 (32.0%) | 0 (0.0%) |
Disability Class: Vision Difficulty
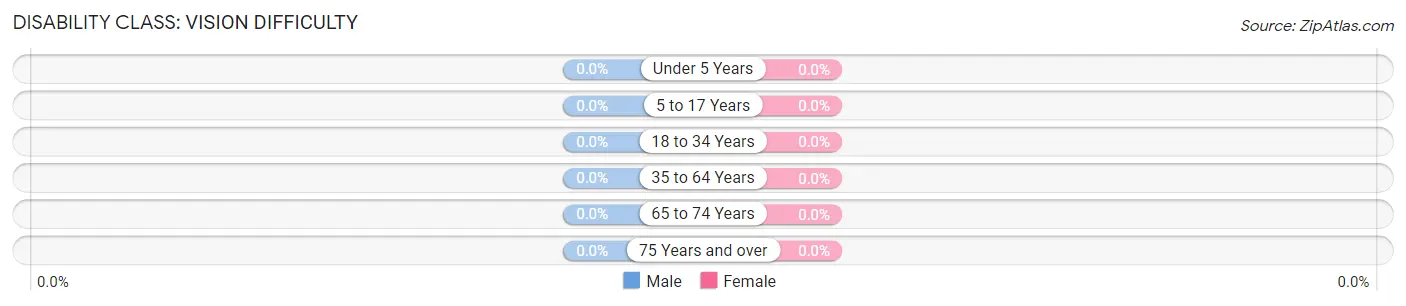
| Age Bracket | Male | Female |
| Under 5 Years | 0 (0.0%) | 0 (0.0%) |
| 5 to 17 Years | 0 (0.0%) | 0 (0.0%) |
| 18 to 34 Years | 0 (0.0%) | 0 (0.0%) |
| 35 to 64 Years | 0 (0.0%) | 0 (0.0%) |
| 65 to 74 Years | 0 (0.0%) | 0 (0.0%) |
| 75 Years and over | 0 (0.0%) | 0 (0.0%) |
Disability Class: Cognitive Difficulty
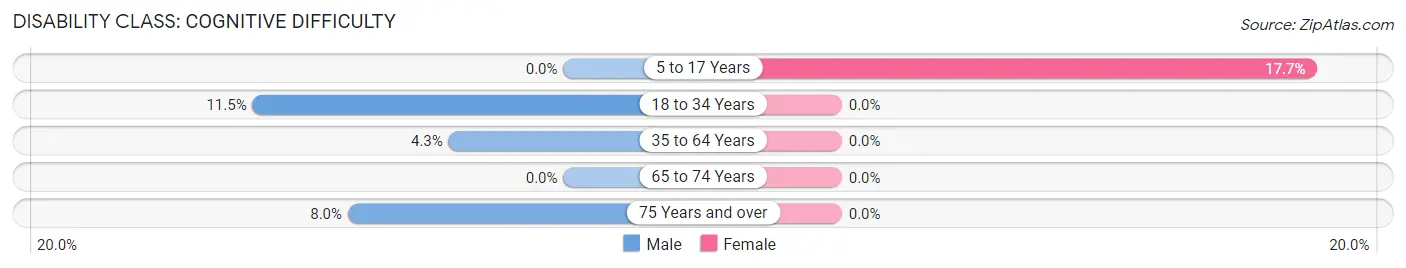
| Age Bracket | Male | Female |
| 5 to 17 Years | 0 (0.0%) | 3 (17.6%) |
| 18 to 34 Years | 6 (11.5%) | 0 (0.0%) |
| 35 to 64 Years | 2 (4.3%) | 0 (0.0%) |
| 65 to 74 Years | 0 (0.0%) | 0 (0.0%) |
| 75 Years and over | 2 (8.0%) | 0 (0.0%) |
Disability Class: Ambulatory Difficulty
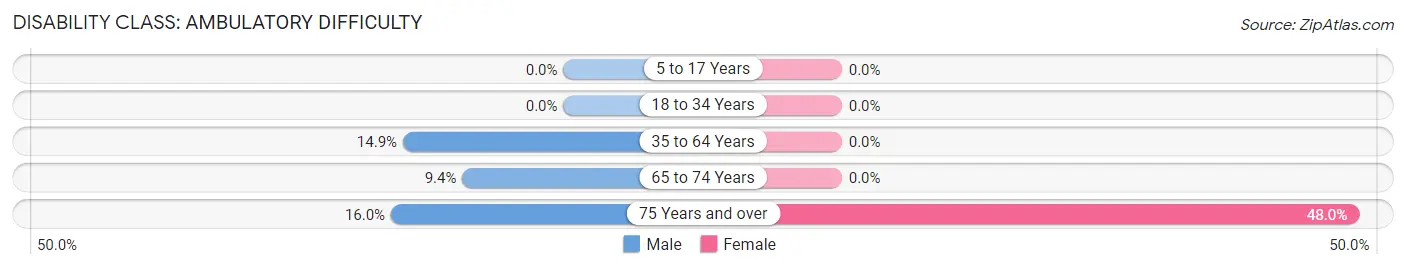
| Age Bracket | Male | Female |
| 5 to 17 Years | 0 (0.0%) | 0 (0.0%) |
| 18 to 34 Years | 0 (0.0%) | 0 (0.0%) |
| 35 to 64 Years | 7 (14.9%) | 0 (0.0%) |
| 65 to 74 Years | 3 (9.4%) | 0 (0.0%) |
| 75 Years and over | 4 (16.0%) | 12 (48.0%) |
Disability Class: Self-Care Difficulty
| Age Bracket | Male | Female |
| 5 to 17 Years | 0 (0.0%) | 0 (0.0%) |
| 18 to 34 Years | 0 (0.0%) | 0 (0.0%) |
| 35 to 64 Years | 0 (0.0%) | 0 (0.0%) |
| 65 to 74 Years | 0 (0.0%) | 0 (0.0%) |
| 75 Years and over | 0 (0.0%) | 0 (0.0%) |
Technology Access in Stonerstown
Computing Device Access in Stonerstown
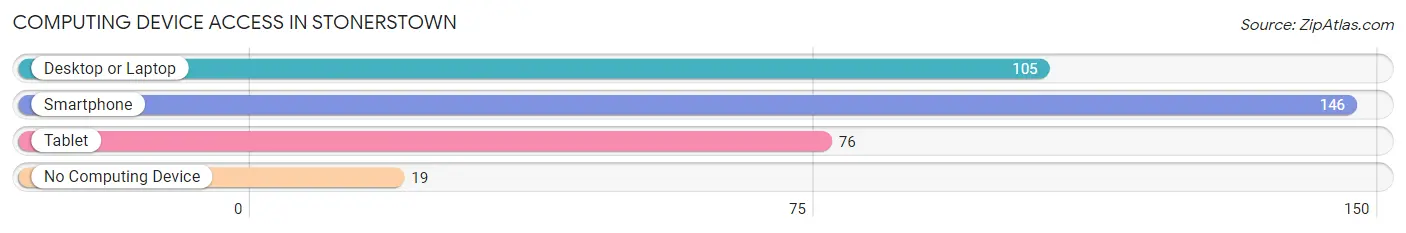
| Device Type | # Households | % Households |
| Desktop or Laptop | 105 | 61.8% |
| Smartphone | 146 | 85.9% |
| Tablet | 76 | 44.7% |
| No Computing Device | 19 | 11.2% |
| Total | 170 | 100.0% |
Internet Access in Stonerstown
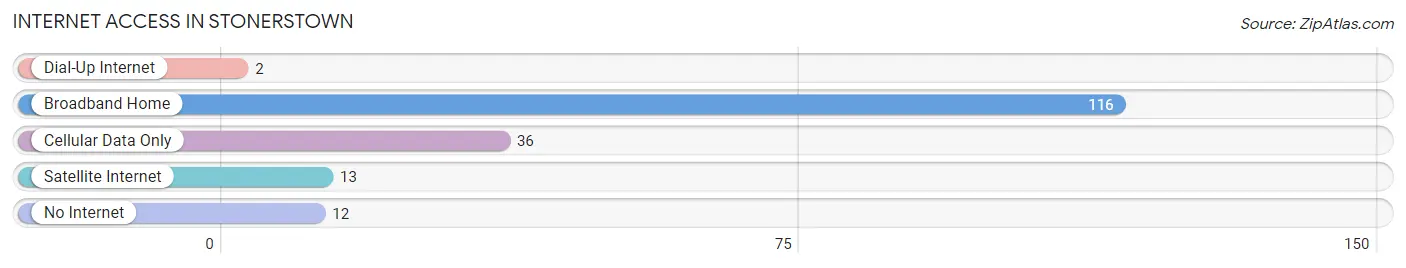
| Internet Type | # Households | % Households |
| Dial-Up Internet | 2 | 1.2% |
| Broadband Home | 116 | 68.2% |
| Cellular Data Only | 36 | 21.2% |
| Satellite Internet | 13 | 7.6% |
| No Internet | 12 | 7.1% |
| Total | 170 | 100.0% |
Stonerstown Summary
Stonerstown is a small unincorporated community located in the northern part of Bedford County, Pennsylvania. It is situated in the foothills of the Allegheny Mountains, approximately 10 miles south of the Pennsylvania-Maryland border. The community is located along the banks of the Raystown Branch of the Juniata River, and is surrounded by rolling hills and farmland.
History
Stonerstown was first settled in the late 1700s by German immigrants who were attracted to the area by its fertile soil and abundant natural resources. The community was named after the Stoner family, who were among the first settlers. The Stoners built a grist mill and a sawmill on the banks of the Juniata River, which provided the community with a source of income and employment.
In the early 1800s, the community began to grow and prosper. A post office was established in 1820, and a school was built in 1825. The community also had a blacksmith shop, a general store, and a church.
In the late 1800s, the railroad came to Stonerstown, connecting the community to the larger cities of Altoona and Harrisburg. This allowed the community to become more connected to the outside world and to expand its economic opportunities.
Geography
Stonerstown is located in the northern part of Bedford County, Pennsylvania. It is situated in the foothills of the Allegheny Mountains, approximately 10 miles south of the Pennsylvania-Maryland border. The community is located along the banks of the Raystown Branch of the Juniata River, and is surrounded by rolling hills and farmland.
The climate in Stonerstown is typical of the region, with cold winters and hot, humid summers. The average annual temperature is around 50 degrees Fahrenheit, and the average annual precipitation is around 40 inches.
Economy
The economy of Stonerstown is largely based on agriculture. The community is home to several farms, which produce a variety of crops, including corn, soybeans, hay, and wheat. The community also has a few small businesses, including a general store, a gas station, and a restaurant.
Demographics
As of the 2010 census, the population of Stonerstown was 545. The racial makeup of the community was 97.3% White, 0.7% African American, 0.2% Native American, 0.2% Asian, and 1.6% from other races. The median household income was $41,250, and the median family income was $45,625. The per capita income was $19,845.
Conclusion
Stonerstown is a small unincorporated community located in the northern part of Bedford County, Pennsylvania. It is situated in the foothills of the Allegheny Mountains, and is surrounded by rolling hills and farmland. The community was first settled in the late 1700s by German immigrants, and has since grown to become a thriving agricultural community. The economy of Stonerstown is largely based on agriculture, and the community is home to several farms, businesses, and a post office. As of the 2010 census, the population of Stonerstown was 545.
Common Questions
What is Per Capita Income in Stonerstown?
Per Capita income in Stonerstown is $34,700.
What is the Median Family Income in Stonerstown?
Median Family Income in Stonerstown is $63,750.
What is the Median Household income in Stonerstown?
Median Household Income in Stonerstown is $58,333.
What is Income or Wage Gap in Stonerstown?
Income or Wage Gap in Stonerstown is 73.3%.
Women in Stonerstown earn 26.7 cents for every dollar earned by a man.
What is Inequality or Gini Index in Stonerstown?
Inequality or Gini Index in Stonerstown is 0.48.
What is the Total Population of Stonerstown?
Total Population of Stonerstown is 390.
What is the Total Male Population of Stonerstown?
Total Male Population of Stonerstown is 183.
What is the Total Female Population of Stonerstown?
Total Female Population of Stonerstown is 207.
What is the Ratio of Males per 100 Females in Stonerstown?
There are 88.41 Males per 100 Females in Stonerstown.
What is the Ratio of Females per 100 Males in Stonerstown?
There are 113.11 Females per 100 Males in Stonerstown.
What is the Median Population Age in Stonerstown?
Median Population Age in Stonerstown is 44.1 Years.
What is the Average Family Size in Stonerstown
Average Family Size in Stonerstown is 2.9 People.
What is the Average Household Size in Stonerstown
Average Household Size in Stonerstown is 2.3 People.
How Large is the Labor Force in Stonerstown?
There are 194 People in the Labor Forcein in Stonerstown.
What is the Percentage of People in the Labor Force in Stonerstown?
61.4% of People are in the Labor Force in Stonerstown.
What is the Unemployment Rate in Stonerstown?
Unemployment Rate in Stonerstown is 8.8%.