Elizabeth borough, PA Map & Demographics
Elizabeth borough Overview
$27,832
PER CAPITA INCOME
$57,083
AVG FAMILY INCOME
$45,324
AVG HOUSEHOLD INCOME
63.7%
WAGE / INCOME GAP [ % ]
36.3¢/ $1
WAGE / INCOME GAP [ $ ]
$9,109
FAMILY INCOME DEFICIT
0.43
INEQUALITY / GINI INDEX
1,433
TOTAL POPULATION
676
MALE POPULATION
757
FEMALE POPULATION
89.30
MALES / 100 FEMALES
111.98
FEMALES / 100 MALES
38.3
MEDIAN AGE
3.6
AVG FAMILY SIZE
2.4
AVG HOUSEHOLD SIZE
721
LABOR FORCE [ PEOPLE ]
60.2%
PERCENT IN LABOR FORCE
4.6%
UNEMPLOYMENT RATE
Income in Elizabeth borough
Income Overview in Elizabeth borough
Per Capita Income in Elizabeth borough is $27,832, while median incomes of families and households are $57,083 and $45,324 respectively.
| Characteristic | Number | Measure |
| Per Capita Income | 1,433 | $27,832 |
| Median Family Income | 271 | $57,083 |
| Mean Family Income | 271 | $79,849 |
| Median Household Income | 605 | $45,324 |
| Mean Household Income | 605 | $61,407 |
| Income Deficit | 271 | $9,109 |
| Wage / Income Gap (%) | 1,433 | 63.72% |
| Wage / Income Gap ($) | 1,433 | 36.28¢ per $1 |
| Gini / Inequality Index | 1,433 | 0.43 |
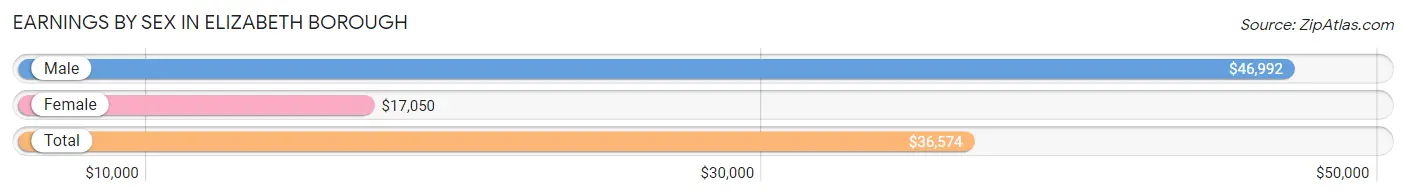
Earnings by Sex in Elizabeth borough
Average Earnings in Elizabeth borough are $36,574, $46,992 for men and $17,050 for women, a difference of 63.7%.
| Sex | Number | Average Earnings |
| Male | 389 (51.2%) | $46,992 |
| Female | 371 (48.8%) | $17,050 |
| Total | 760 (100.0%) | $36,574 |
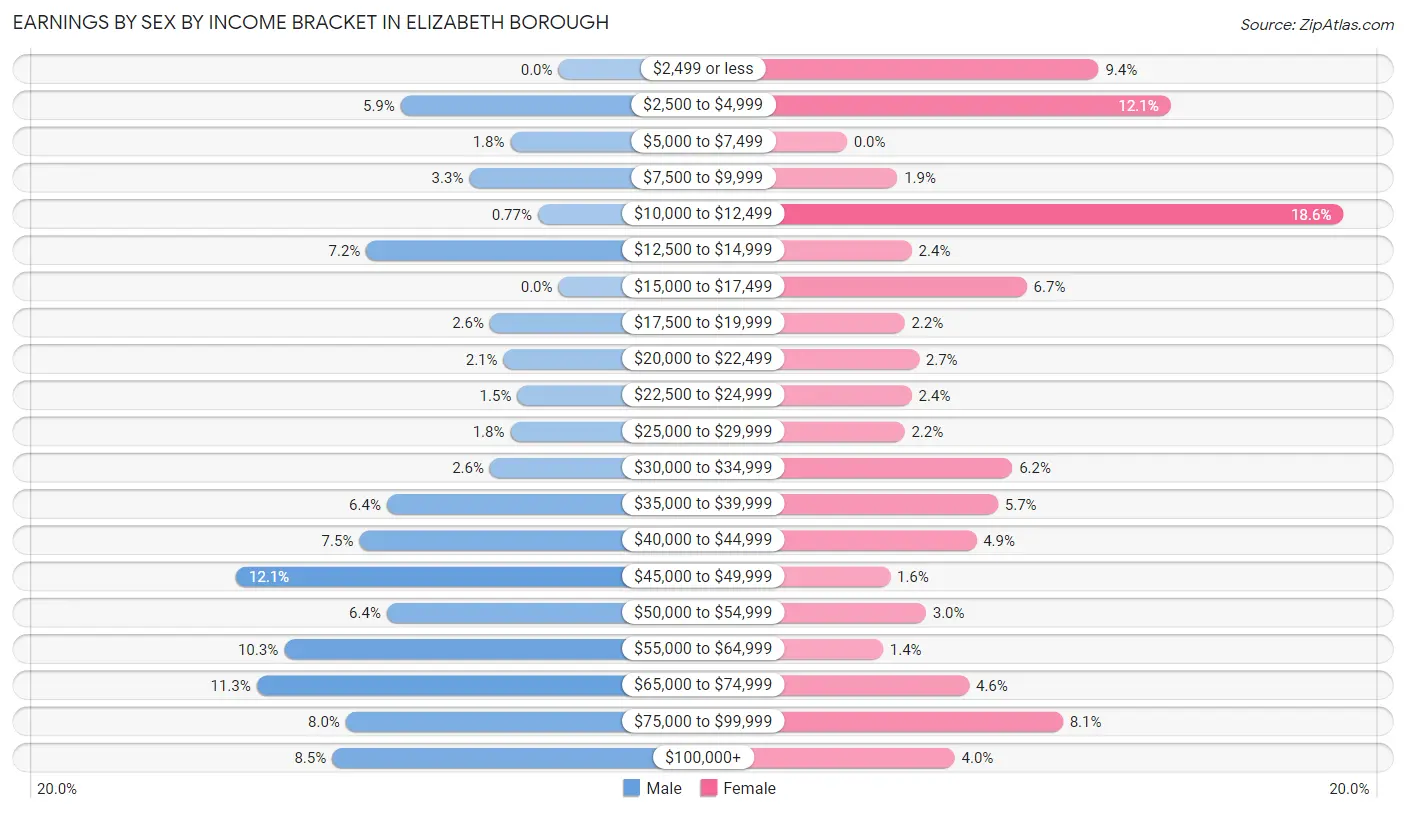
Earnings by Sex by Income Bracket in Elizabeth borough
The most common earnings brackets in Elizabeth borough are $45,000 to $49,999 for men (47 | 12.1%) and $10,000 to $12,499 for women (69 | 18.6%).
| Income | Male | Female |
| $2,499 or less | 0 (0.0%) | 35 (9.4%) |
| $2,500 to $4,999 | 23 (5.9%) | 45 (12.1%) |
| $5,000 to $7,499 | 7 (1.8%) | 0 (0.0%) |
| $7,500 to $9,999 | 13 (3.3%) | 7 (1.9%) |
| $10,000 to $12,499 | 3 (0.8%) | 69 (18.6%) |
| $12,500 to $14,999 | 28 (7.2%) | 9 (2.4%) |
| $15,000 to $17,499 | 0 (0.0%) | 25 (6.7%) |
| $17,500 to $19,999 | 10 (2.6%) | 8 (2.2%) |
| $20,000 to $22,499 | 8 (2.1%) | 10 (2.7%) |
| $22,500 to $24,999 | 6 (1.5%) | 9 (2.4%) |
| $25,000 to $29,999 | 7 (1.8%) | 8 (2.2%) |
| $30,000 to $34,999 | 10 (2.6%) | 23 (6.2%) |
| $35,000 to $39,999 | 25 (6.4%) | 21 (5.7%) |
| $40,000 to $44,999 | 29 (7.5%) | 18 (4.9%) |
| $45,000 to $49,999 | 47 (12.1%) | 6 (1.6%) |
| $50,000 to $54,999 | 25 (6.4%) | 11 (3.0%) |
| $55,000 to $64,999 | 40 (10.3%) | 5 (1.3%) |
| $65,000 to $74,999 | 44 (11.3%) | 17 (4.6%) |
| $75,000 to $99,999 | 31 (8.0%) | 30 (8.1%) |
| $100,000+ | 33 (8.5%) | 15 (4.0%) |
| Total | 389 (100.0%) | 371 (100.0%) |
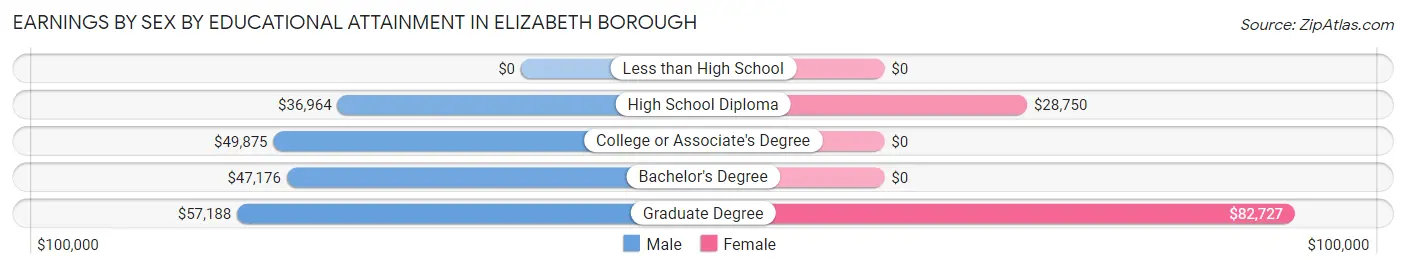
Earnings by Sex by Educational Attainment in Elizabeth borough
Average earnings in Elizabeth borough are $49,625 for men and $28,250 for women, a difference of 43.1%. Men with an educational attainment of graduate degree enjoy the highest average annual earnings of $57,188, while those with high school diploma education earn the least with $36,964. Women with an educational attainment of graduate degree earn the most with the average annual earnings of $82,727, while those with high school diploma education have the smallest earnings of $28,750.
| Educational Attainment | Male Income | Female Income |
| Less than High School | - | - |
| High School Diploma | $36,964 | $28,750 |
| College or Associate's Degree | $49,875 | $0 |
| Bachelor's Degree | $47,176 | $0 |
| Graduate Degree | $57,188 | $82,727 |
| Total | $49,625 | $28,250 |
Family Income in Elizabeth borough
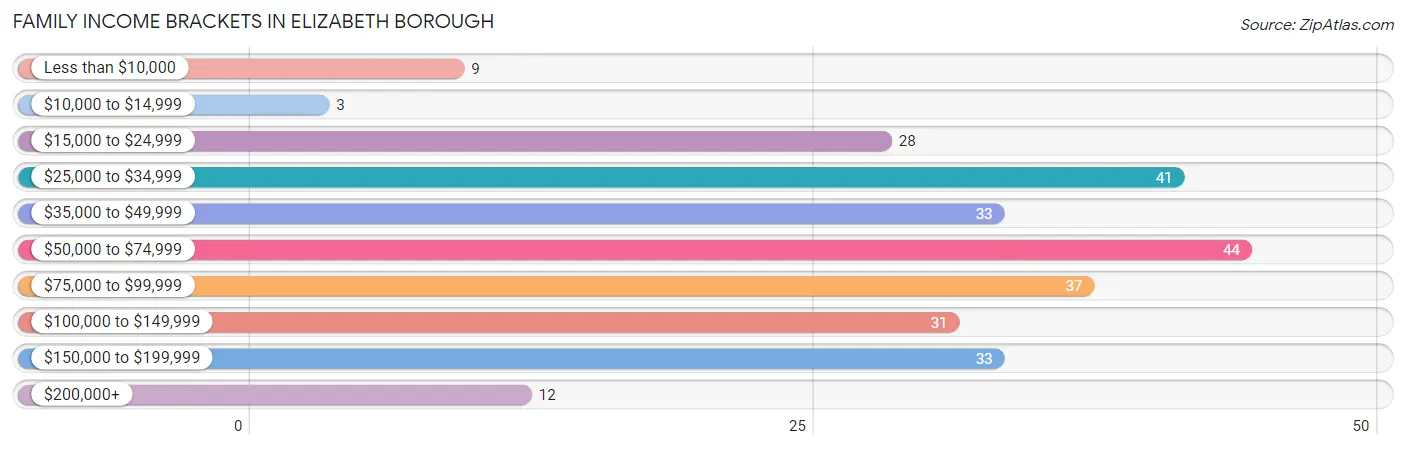
Family Income Brackets in Elizabeth borough
According to the Elizabeth borough family income data, there are 44 families falling into the $50,000 to $74,999 income range, which is the most common income bracket and makes up 16.2% of all families. Conversely, the $10,000 to $14,999 income bracket is the least frequent group with only 3 families (1.1%) belonging to this category.
| Income Bracket | # Families | % Families |
| Less than $10,000 | 9 | 3.3% |
| $10,000 to $14,999 | 3 | 1.1% |
| $15,000 to $24,999 | 28 | 10.3% |
| $25,000 to $34,999 | 41 | 15.1% |
| $35,000 to $49,999 | 33 | 12.2% |
| $50,000 to $74,999 | 44 | 16.2% |
| $75,000 to $99,999 | 37 | 13.7% |
| $100,000 to $149,999 | 31 | 11.4% |
| $150,000 to $199,999 | 33 | 12.2% |
| $200,000+ | 12 | 4.4% |
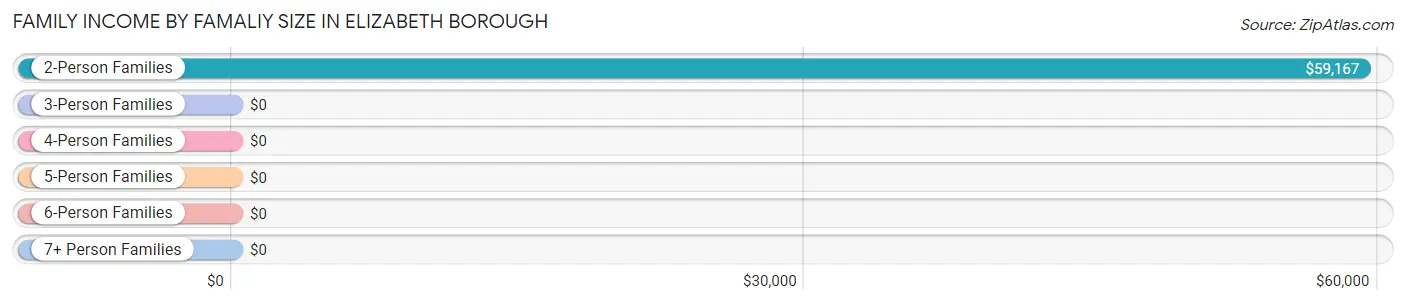
Family Income by Famaliy Size in Elizabeth borough
2-person families (110 | 40.6%) account for the highest median family income in Elizabeth borough with $59,167 per family, while 2-person families (110 | 40.6%) have the highest median income of $29,584 per family member.
| Income Bracket | # Families | Median Income |
| 2-Person Families | 110 (40.6%) | $59,167 |
| 3-Person Families | 74 (27.3%) | $0 |
| 4-Person Families | 39 (14.4%) | $0 |
| 5-Person Families | 41 (15.1%) | $0 |
| 6-Person Families | 3 (1.1%) | $0 |
| 7+ Person Families | 4 (1.5%) | $0 |
| Total | 271 (100.0%) | $57,083 |
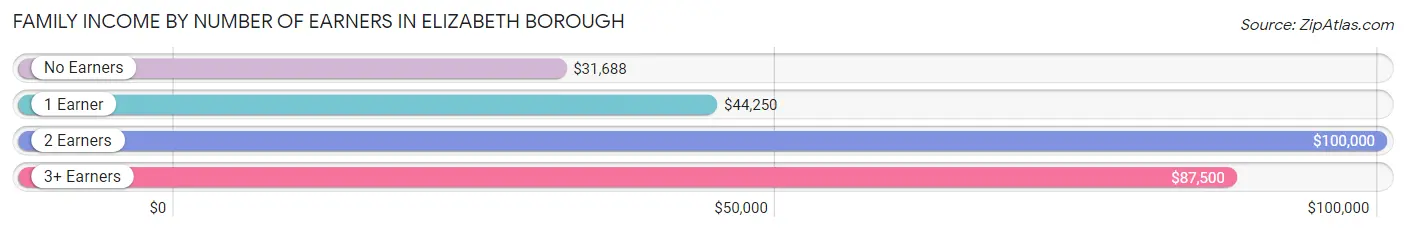
Family Income by Number of Earners in Elizabeth borough
The median family income in Elizabeth borough is $57,083, with families comprising 2 earners (90) having the highest median family income of $100,000, while families with no earners (57) have the lowest median family income of $31,688, accounting for 33.2% and 21.0% of families, respectively.
| Number of Earners | # Families | Median Income |
| No Earners | 57 (21.0%) | $31,688 |
| 1 Earner | 84 (31.0%) | $44,250 |
| 2 Earners | 90 (33.2%) | $100,000 |
| 3+ Earners | 40 (14.8%) | $87,500 |
| Total | 271 (100.0%) | $57,083 |
Household Income in Elizabeth borough
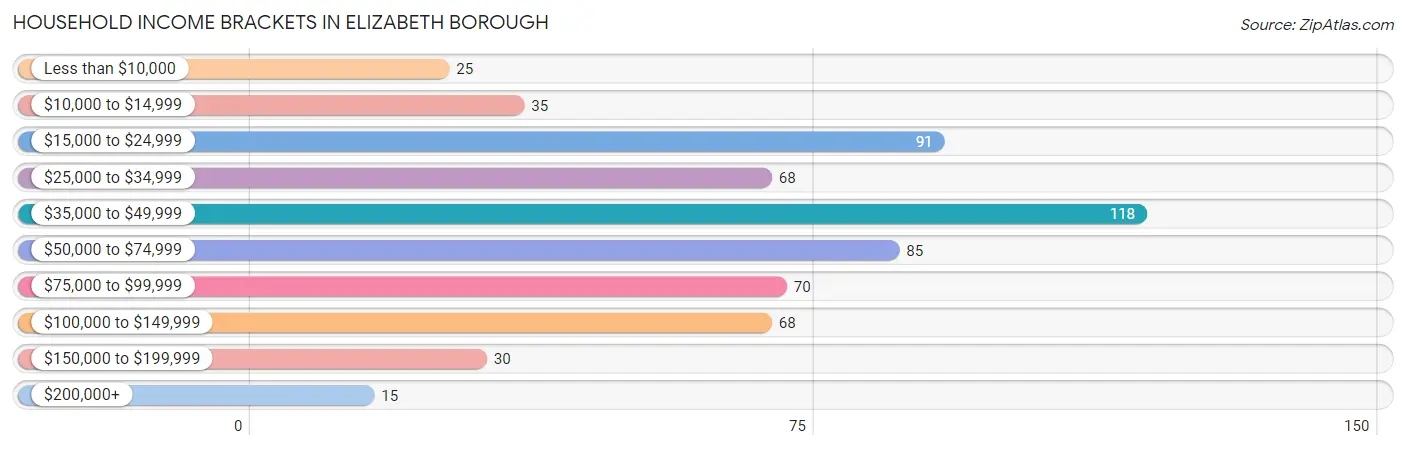
Household Income Brackets in Elizabeth borough
With 118 households falling in the category, the $35,000 to $49,999 income range is the most frequent in Elizabeth borough, accounting for 19.5% of all households. In contrast, only 15 households (2.5%) fall into the $200,000+ income bracket, making it the least populous group.
| Income Bracket | # Households | % Households |
| Less than $10,000 | 25 | 4.1% |
| $10,000 to $14,999 | 35 | 5.8% |
| $15,000 to $24,999 | 91 | 15.0% |
| $25,000 to $34,999 | 68 | 11.2% |
| $35,000 to $49,999 | 118 | 19.5% |
| $50,000 to $74,999 | 85 | 14.0% |
| $75,000 to $99,999 | 70 | 11.6% |
| $100,000 to $149,999 | 68 | 11.2% |
| $150,000 to $199,999 | 30 | 5.0% |
| $200,000+ | 15 | 2.5% |
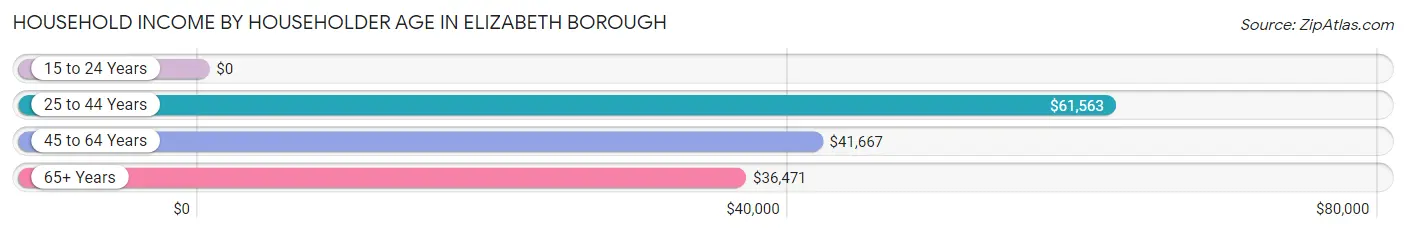
Household Income by Householder Age in Elizabeth borough
The median household income in Elizabeth borough is $45,324, with the highest median household income of $61,563 found in the 25 to 44 years age bracket for the primary householder. A total of 205 households (33.9%) fall into this category. Meanwhile, the 15 to 24 years age bracket for the primary householder has the lowest median household income of $0, with 8 households (1.3%) in this group.
| Income Bracket | # Households | Median Income |
| 15 to 24 Years | 8 (1.3%) | $0 |
| 25 to 44 Years | 205 (33.9%) | $61,563 |
| 45 to 64 Years | 214 (35.4%) | $41,667 |
| 65+ Years | 178 (29.4%) | $36,471 |
| Total | 605 (100.0%) | $45,324 |
Poverty in Elizabeth borough
Income Below Poverty by Sex and Age in Elizabeth borough
With 16.4% poverty level for males and 22.6% for females among the residents of Elizabeth borough, under 5 year old males and 16 and 17 year old females are the most vulnerable to poverty, with 16 males (41.0%) and 8 females (61.5%) in their respective age groups living below the poverty level.

| Age Bracket | Male | Female |
| Under 5 Years | 16 (41.0%) | 9 (34.6%) |
| 5 Years | 0 (0.0%) | 0 (0.0%) |
| 6 to 11 Years | 24 (36.9%) | 20 (58.8%) |
| 12 to 14 Years | 0 (0.0%) | 10 (29.4%) |
| 15 Years | 0 (0.0%) | 0 (0.0%) |
| 16 and 17 Years | 4 (28.6%) | 8 (61.5%) |
| 18 to 24 Years | 5 (5.0%) | 15 (16.0%) |
| 25 to 34 Years | 9 (8.0%) | 38 (39.2%) |
| 35 to 44 Years | 3 (4.0%) | 10 (9.4%) |
| 45 to 54 Years | 4 (8.0%) | 7 (14.0%) |
| 55 to 64 Years | 36 (37.9%) | 25 (17.9%) |
| 65 to 74 Years | 10 (13.9%) | 17 (20.0%) |
| 75 Years and over | 0 (0.0%) | 12 (20.7%) |
| Total | 111 (16.4%) | 171 (22.6%) |
Income Above Poverty by Sex and Age in Elizabeth borough
According to the poverty statistics in Elizabeth borough, males aged 5 years and females aged 5 years are the age groups that are most secure financially, with 100.0% of males and 100.0% of females in these age groups living above the poverty line.
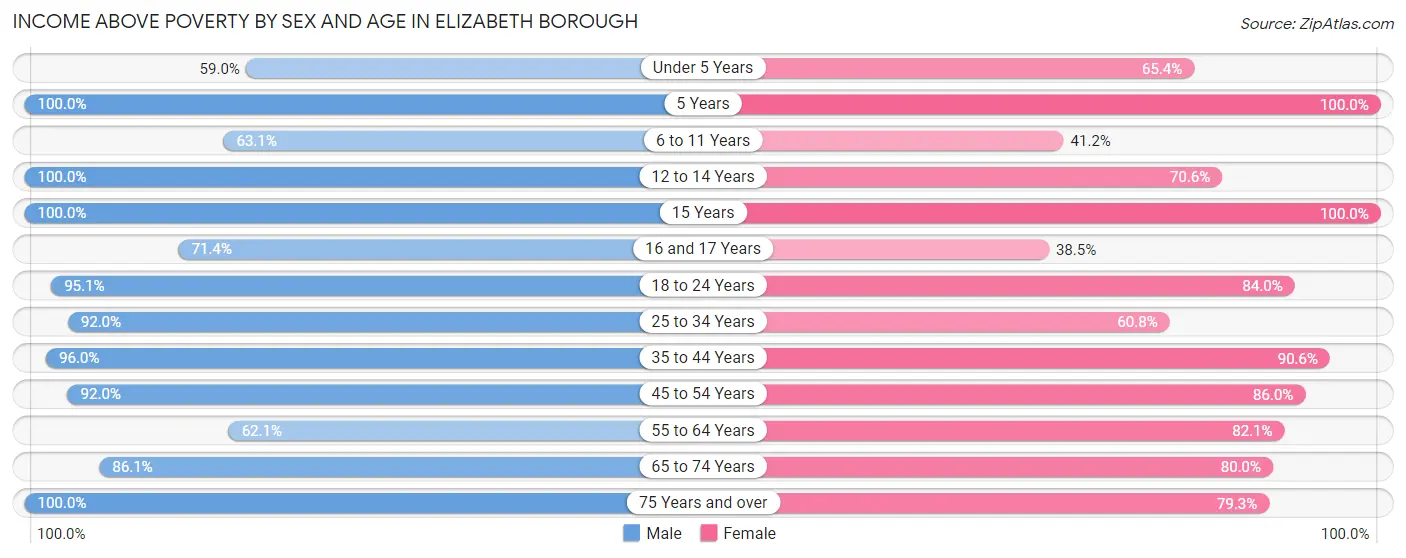
| Age Bracket | Male | Female |
| Under 5 Years | 23 (59.0%) | 17 (65.4%) |
| 5 Years | 4 (100.0%) | 11 (100.0%) |
| 6 to 11 Years | 41 (63.1%) | 14 (41.2%) |
| 12 to 14 Years | 9 (100.0%) | 24 (70.6%) |
| 15 Years | 5 (100.0%) | 9 (100.0%) |
| 16 and 17 Years | 10 (71.4%) | 5 (38.5%) |
| 18 to 24 Years | 96 (95.1%) | 79 (84.0%) |
| 25 to 34 Years | 103 (92.0%) | 59 (60.8%) |
| 35 to 44 Years | 72 (96.0%) | 96 (90.6%) |
| 45 to 54 Years | 46 (92.0%) | 43 (86.0%) |
| 55 to 64 Years | 59 (62.1%) | 115 (82.1%) |
| 65 to 74 Years | 62 (86.1%) | 68 (80.0%) |
| 75 Years and over | 35 (100.0%) | 46 (79.3%) |
| Total | 565 (83.6%) | 586 (77.4%) |
Income Below Poverty Among Married-Couple Families in Elizabeth borough
The poverty statistics for married-couple families in Elizabeth borough show that 11.0% or 20 of the total 182 families live below the poverty line. Families with 3 or 4 children have the highest poverty rate of 33.3%, comprising of 4 families. On the other hand, families with 5 or more children have the lowest poverty rate of 0.0%, which includes 0 families.
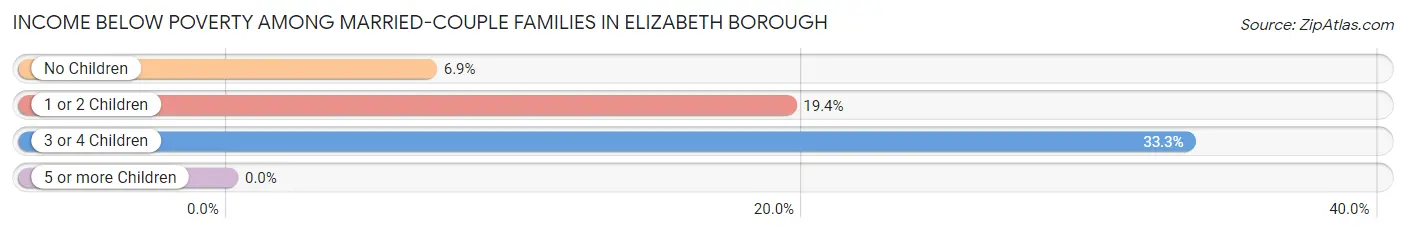
| Children | Above Poverty | Below Poverty |
| No Children | 121 (93.1%) | 9 (6.9%) |
| 1 or 2 Children | 29 (80.6%) | 7 (19.4%) |
| 3 or 4 Children | 8 (66.7%) | 4 (33.3%) |
| 5 or more Children | 4 (100.0%) | 0 (0.0%) |
| Total | 162 (89.0%) | 20 (11.0%) |
Income Below Poverty Among Single-Parent Households in Elizabeth borough
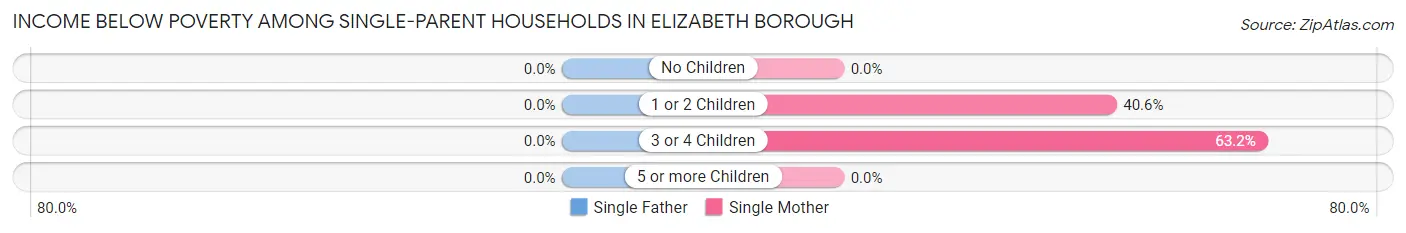
| Children | Single Father | Single Mother |
| No Children | 0 (0.0%) | 0 (0.0%) |
| 1 or 2 Children | 0 (0.0%) | 13 (40.6%) |
| 3 or 4 Children | 0 (0.0%) | 12 (63.2%) |
| 5 or more Children | 0 (0.0%) | 0 (0.0%) |
| Total | 0 (0.0%) | 25 (34.3%) |
Income Below Poverty Among Married-Couple vs Single-Parent Households in Elizabeth borough
The poverty data for Elizabeth borough shows that 20 of the married-couple family households (11.0%) and 25 of the single-parent households (28.1%) are living below the poverty level. Within the married-couple family households, those with 3 or 4 children have the highest poverty rate, with 4 households (33.3%) falling below the poverty line. Among the single-parent households, those with 3 or 4 children have the highest poverty rate, with 12 household (63.2%) living below poverty.
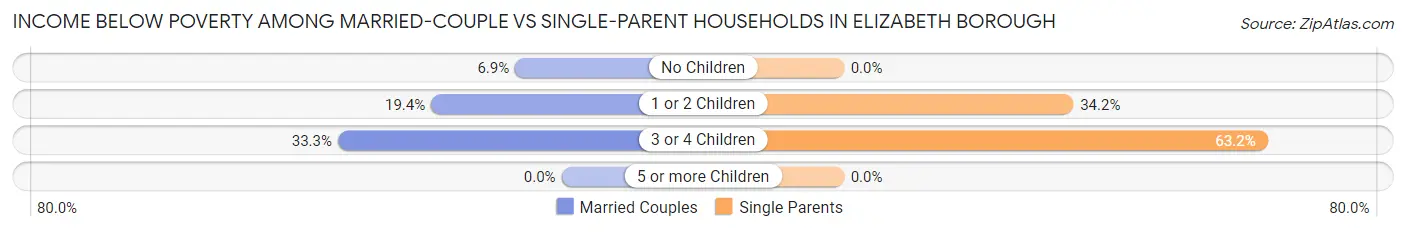
| Children | Married-Couple Families | Single-Parent Households |
| No Children | 9 (6.9%) | 0 (0.0%) |
| 1 or 2 Children | 7 (19.4%) | 13 (34.2%) |
| 3 or 4 Children | 4 (33.3%) | 12 (63.2%) |
| 5 or more Children | 0 (0.0%) | 0 (0.0%) |
| Total | 20 (11.0%) | 25 (28.1%) |
Race in Elizabeth borough
The most populous races in Elizabeth borough are White / Caucasian (1,285 | 89.7%), Two or more Races (101 | 7.0%), and Hispanic or Latino (86 | 6.0%).
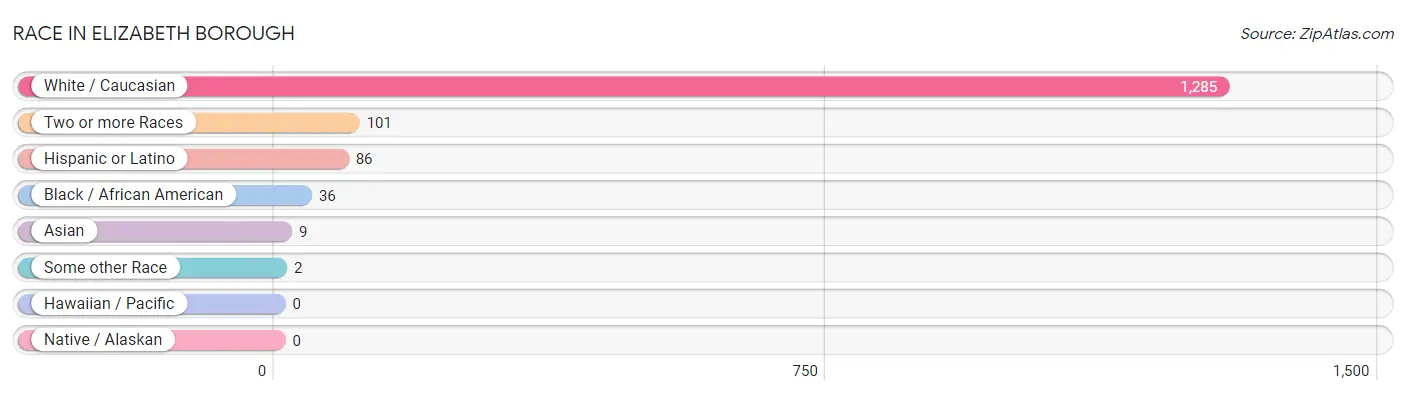
| Race | # Population | % Population |
| Asian | 9 | 0.6% |
| Black / African American | 36 | 2.5% |
| Hawaiian / Pacific | 0 | 0.0% |
| Hispanic or Latino | 86 | 6.0% |
| Native / Alaskan | 0 | 0.0% |
| White / Caucasian | 1,285 | 89.7% |
| Two or more Races | 101 | 7.0% |
| Some other Race | 2 | 0.1% |
| Total | 1,433 | 100.0% |
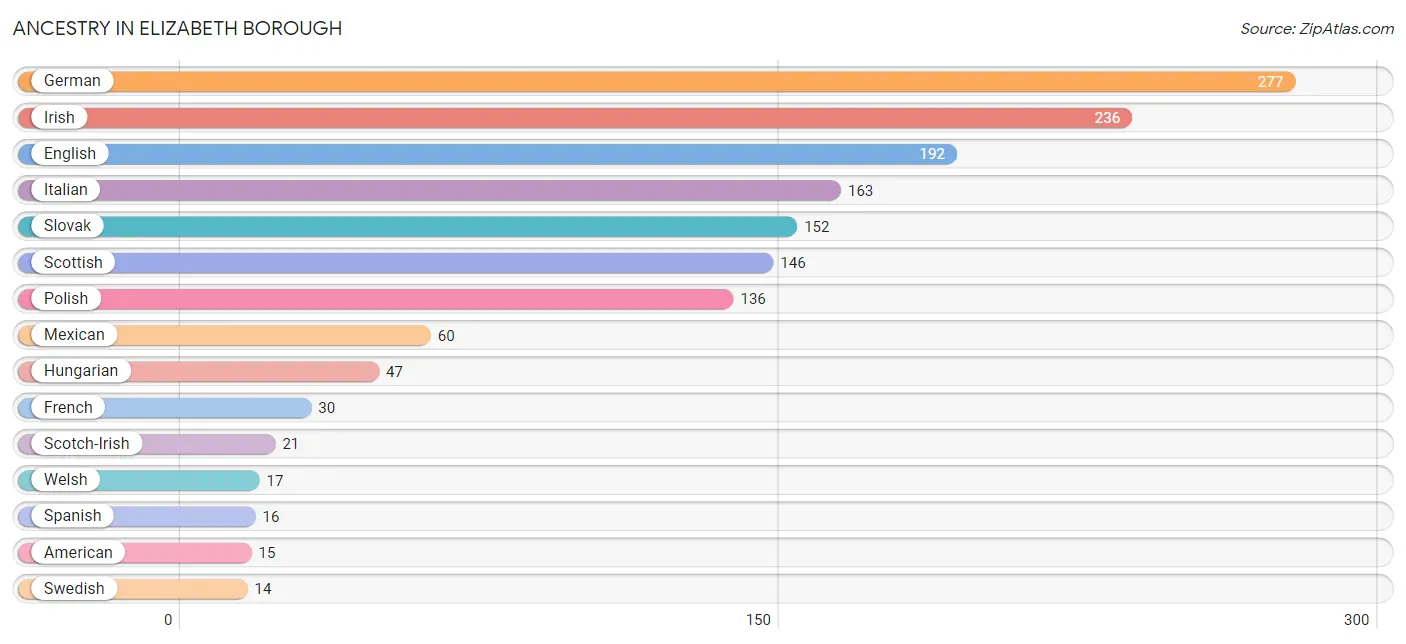
Ancestry in Elizabeth borough
The most populous ancestries reported in Elizabeth borough are German (277 | 19.3%), Irish (236 | 16.5%), English (192 | 13.4%), Italian (163 | 11.4%), and Slovak (152 | 10.6%), together accounting for 71.2% of all Elizabeth borough residents.
| Ancestry | # Population | % Population |
| African | 2 | 0.1% |
| American | 15 | 1.1% |
| Belgian | 3 | 0.2% |
| Blackfeet | 2 | 0.1% |
| Cherokee | 1 | 0.1% |
| Croatian | 8 | 0.6% |
| Czech | 7 | 0.5% |
| Czechoslovakian | 11 | 0.8% |
| Danish | 7 | 0.5% |
| Dutch | 5 | 0.4% |
| English | 192 | 13.4% |
| European | 3 | 0.2% |
| Finnish | 3 | 0.2% |
| French | 30 | 2.1% |
| German | 277 | 19.3% |
| Greek | 9 | 0.6% |
| Hungarian | 47 | 3.3% |
| Irish | 236 | 16.5% |
| Italian | 163 | 11.4% |
| Lithuanian | 2 | 0.1% |
| Mexican | 60 | 4.2% |
| Norwegian | 3 | 0.2% |
| Pennsylvania German | 3 | 0.2% |
| Polish | 136 | 9.5% |
| Puerto Rican | 10 | 0.7% |
| Russian | 8 | 0.6% |
| Scotch-Irish | 21 | 1.5% |
| Scottish | 146 | 10.2% |
| Serbian | 4 | 0.3% |
| Slavic | 3 | 0.2% |
| Slovak | 152 | 10.6% |
| Spanish | 16 | 1.1% |
| Subsaharan African | 2 | 0.1% |
| Swedish | 14 | 1.0% |
| Thai | 9 | 0.6% |
| Welsh | 17 | 1.2% | View All 36 Rows |
Immigrants in Elizabeth borough
The most numerous immigrant groups reported in Elizabeth borough came from Asia (9 | 0.6%), India (9 | 0.6%), and South Central Asia (9 | 0.6%), together accounting for 1.9% of all Elizabeth borough residents.
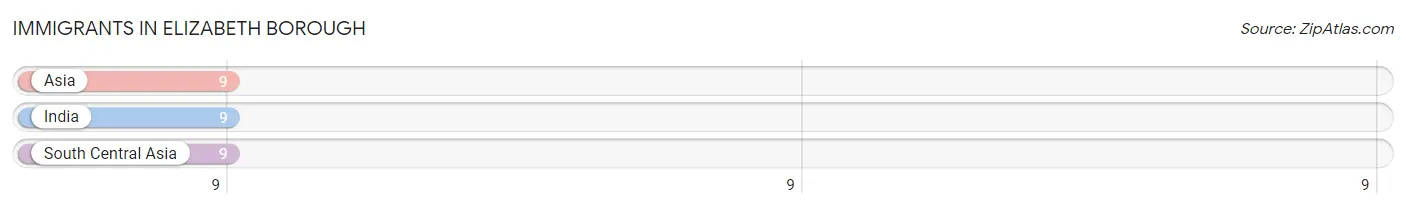
| Immigration Origin | # Population | % Population |
| Asia | 9 | 0.6% |
| India | 9 | 0.6% |
| South Central Asia | 9 | 0.6% | View All 3 Rows |
Sex and Age in Elizabeth borough
Sex and Age in Elizabeth borough
The most populous age groups in Elizabeth borough are 20 to 24 Years (95 | 14.1%) for men and 30 to 34 Years (84 | 11.1%) for women.
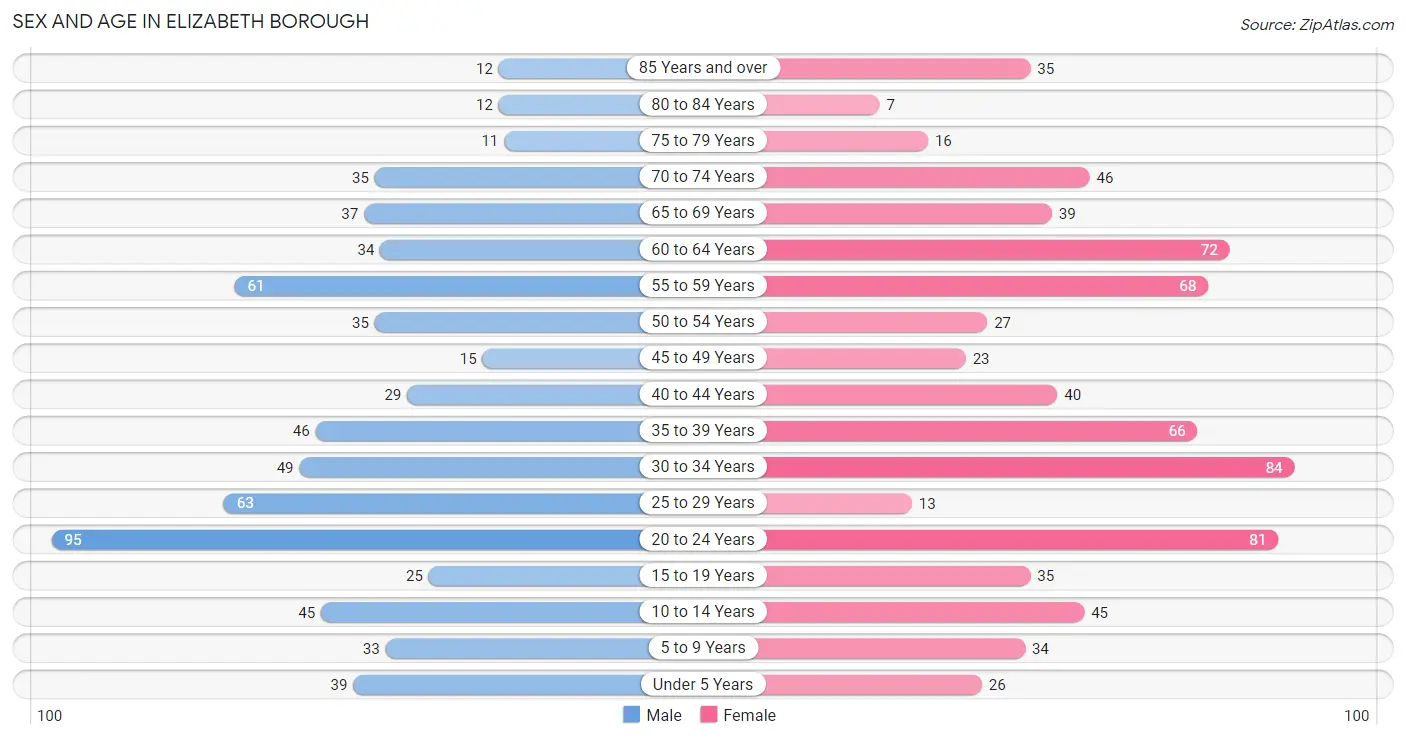
| Age Bracket | Male | Female |
| Under 5 Years | 39 (5.8%) | 26 (3.4%) |
| 5 to 9 Years | 33 (4.9%) | 34 (4.5%) |
| 10 to 14 Years | 45 (6.7%) | 45 (5.9%) |
| 15 to 19 Years | 25 (3.7%) | 35 (4.6%) |
| 20 to 24 Years | 95 (14.1%) | 81 (10.7%) |
| 25 to 29 Years | 63 (9.3%) | 13 (1.7%) |
| 30 to 34 Years | 49 (7.2%) | 84 (11.1%) |
| 35 to 39 Years | 46 (6.8%) | 66 (8.7%) |
| 40 to 44 Years | 29 (4.3%) | 40 (5.3%) |
| 45 to 49 Years | 15 (2.2%) | 23 (3.0%) |
| 50 to 54 Years | 35 (5.2%) | 27 (3.6%) |
| 55 to 59 Years | 61 (9.0%) | 68 (9.0%) |
| 60 to 64 Years | 34 (5.0%) | 72 (9.5%) |
| 65 to 69 Years | 37 (5.5%) | 39 (5.1%) |
| 70 to 74 Years | 35 (5.2%) | 46 (6.1%) |
| 75 to 79 Years | 11 (1.6%) | 16 (2.1%) |
| 80 to 84 Years | 12 (1.8%) | 7 (0.9%) |
| 85 Years and over | 12 (1.8%) | 35 (4.6%) |
| Total | 676 (100.0%) | 757 (100.0%) |
Families and Households in Elizabeth borough
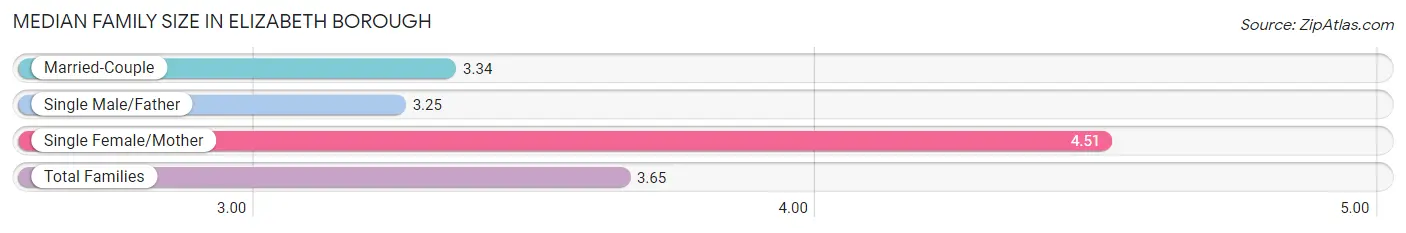
Median Family Size in Elizabeth borough
The median family size in Elizabeth borough is 3.65 persons per family, with single female/mother families (73 | 26.9%) accounting for the largest median family size of 4.51 persons per family. On the other hand, single male/father families (16 | 5.9%) represent the smallest median family size with 3.25 persons per family.
| Family Type | # Families | Family Size |
| Married-Couple | 182 (67.2%) | 3.34 |
| Single Male/Father | 16 (5.9%) | 3.25 |
| Single Female/Mother | 73 (26.9%) | 4.51 |
| Total Families | 271 (100.0%) | 3.65 |
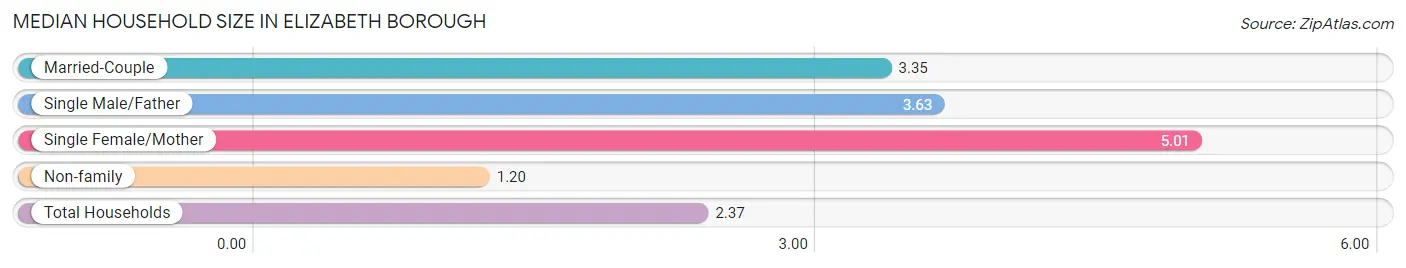
Median Household Size in Elizabeth borough
The median household size in Elizabeth borough is 2.37 persons per household, with single female/mother households (73 | 12.1%) accounting for the largest median household size of 5.01 persons per household. non-family households (334 | 55.2%) represent the smallest median household size with 1.20 persons per household.
| Household Type | # Households | Household Size |
| Married-Couple | 182 (30.1%) | 3.35 |
| Single Male/Father | 16 (2.6%) | 3.63 |
| Single Female/Mother | 73 (12.1%) | 5.01 |
| Non-family | 334 (55.2%) | 1.20 |
| Total Households | 605 (100.0%) | 2.37 |
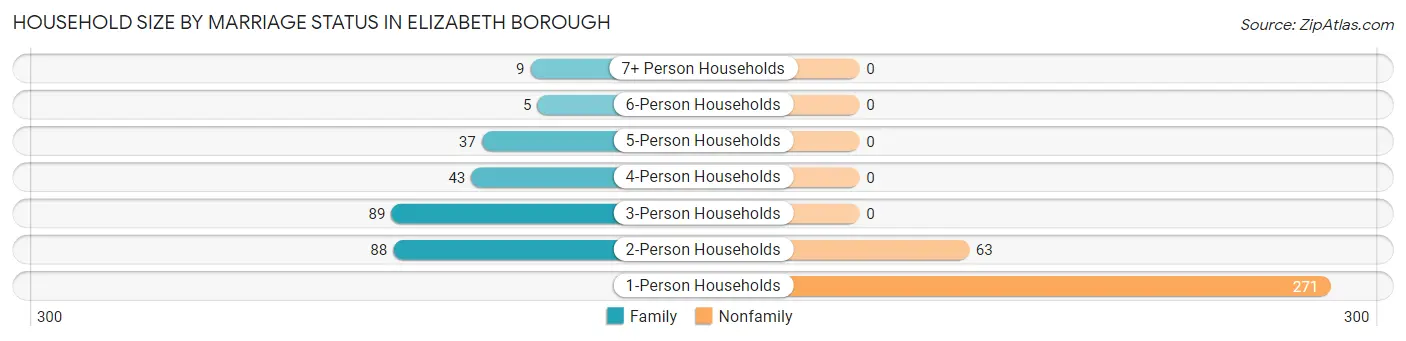
Household Size by Marriage Status in Elizabeth borough
Out of a total of 605 households in Elizabeth borough, 271 (44.8%) are family households, while 334 (55.2%) are nonfamily households. The most numerous type of family households are 3-person households, comprising 89, and the most common type of nonfamily households are 1-person households, comprising 271.
| Household Size | Family Households | Nonfamily Households |
| 1-Person Households | - | 271 (44.8%) |
| 2-Person Households | 88 (14.5%) | 63 (10.4%) |
| 3-Person Households | 89 (14.7%) | 0 (0.0%) |
| 4-Person Households | 43 (7.1%) | 0 (0.0%) |
| 5-Person Households | 37 (6.1%) | 0 (0.0%) |
| 6-Person Households | 5 (0.8%) | 0 (0.0%) |
| 7+ Person Households | 9 (1.5%) | 0 (0.0%) |
| Total | 271 (44.8%) | 334 (55.2%) |
Female Fertility in Elizabeth borough
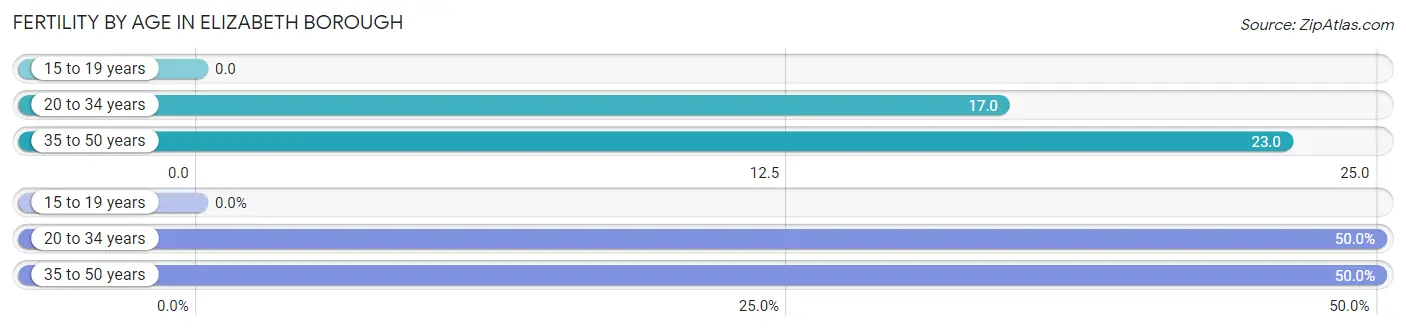
Fertility by Age in Elizabeth borough
Average fertility rate in Elizabeth borough is 17.0 births per 1,000 women. Women in the age bracket of 35 to 50 years have the highest fertility rate with 23.0 births per 1,000 women. Women in the age bracket of 20 to 34 years acount for 50.0% of all women with births.
| Age Bracket | Women with Births | Births / 1,000 Women |
| 15 to 19 years | 0 (0.0%) | 0.0 |
| 20 to 34 years | 3 (50.0%) | 17.0 |
| 35 to 50 years | 3 (50.0%) | 23.0 |
| Total | 6 (100.0%) | 17.0 |
Fertility by Age by Marriage Status in Elizabeth borough
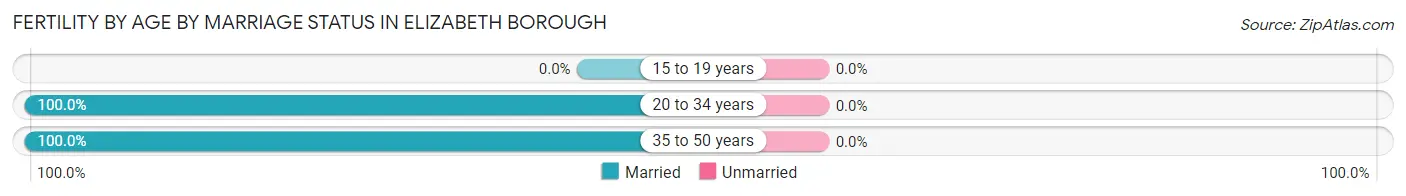
| Age Bracket | Married | Unmarried |
| 15 to 19 years | 0 (0.0%) | 0 (0.0%) |
| 20 to 34 years | 3 (100.0%) | 0 (0.0%) |
| 35 to 50 years | 3 (100.0%) | 0 (0.0%) |
| Total | 6 (100.0%) | 0 (0.0%) |
Fertility by Education in Elizabeth borough
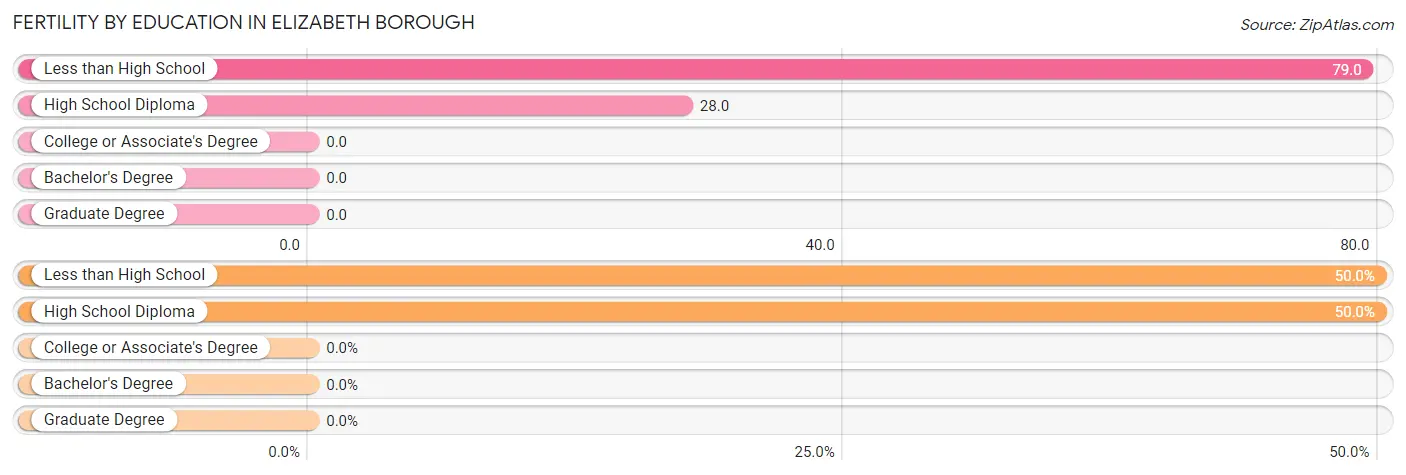
| Educational Attainment | Women with Births | Births / 1,000 Women |
| Less than High School | 3 (50.0%) | 79.0 |
| High School Diploma | 3 (50.0%) | 28.0 |
| College or Associate's Degree | 0 (0.0%) | 0.0 |
| Bachelor's Degree | 0 (0.0%) | 0.0 |
| Graduate Degree | 0 (0.0%) | 0.0 |
| Total | 6 (100.0%) | 17.0 |
Fertility by Education by Marriage Status in Elizabeth borough
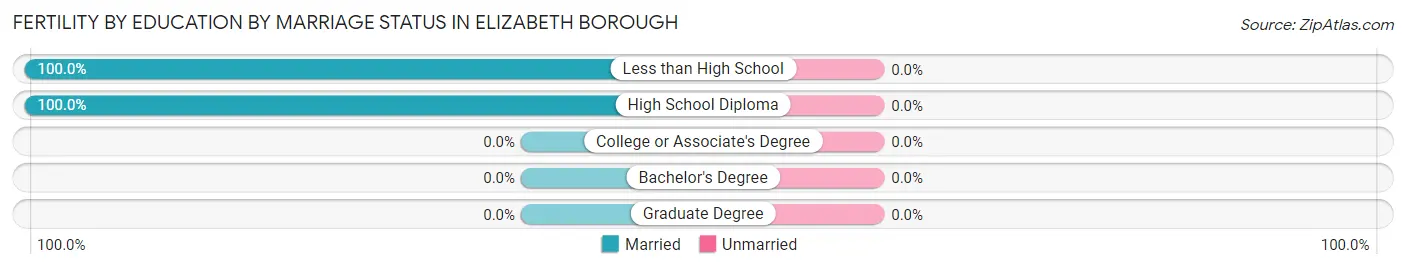
| Educational Attainment | Married | Unmarried |
| Less than High School | 3 (100.0%) | 0 (0.0%) |
| High School Diploma | 3 (100.0%) | 0 (0.0%) |
| College or Associate's Degree | 0 (0.0%) | 0 (0.0%) |
| Bachelor's Degree | 0 (0.0%) | 0 (0.0%) |
| Graduate Degree | 0 (0.0%) | 0 (0.0%) |
| Total | 6 (100.0%) | 0 (0.0%) |
Employment Characteristics in Elizabeth borough
Employment by Class of Employer in Elizabeth borough
Among the 657 employed individuals in Elizabeth borough, private company employees (523 | 79.6%), not-for-profit organizations (57 | 8.7%), and state government employees (27 | 4.1%) make up the most common classes of employment.
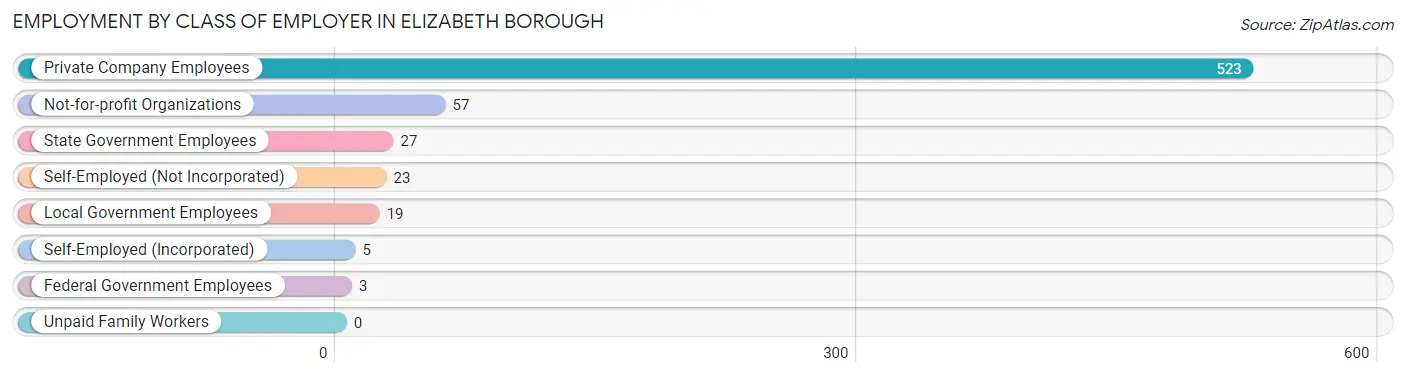
| Employer Class | # Employees | % Employees |
| Private Company Employees | 523 | 79.6% |
| Self-Employed (Incorporated) | 5 | 0.8% |
| Self-Employed (Not Incorporated) | 23 | 3.5% |
| Not-for-profit Organizations | 57 | 8.7% |
| Local Government Employees | 19 | 2.9% |
| State Government Employees | 27 | 4.1% |
| Federal Government Employees | 3 | 0.5% |
| Unpaid Family Workers | 0 | 0.0% |
| Total | 657 | 100.0% |
Employment Status by Age in Elizabeth borough
According to the labor force statistics for Elizabeth borough, out of the total population over 16 years of age (1,197), 60.2% or 721 individuals are in the labor force, with 4.6% or 33 of them unemployed. The age group with the highest labor force participation rate is 25 to 29 years, with 92.1% or 70 individuals in the labor force. Within the labor force, the 16 to 19 years age range has the highest percentage of unemployed individuals, with 11.8% or 4 of them being unemployed.
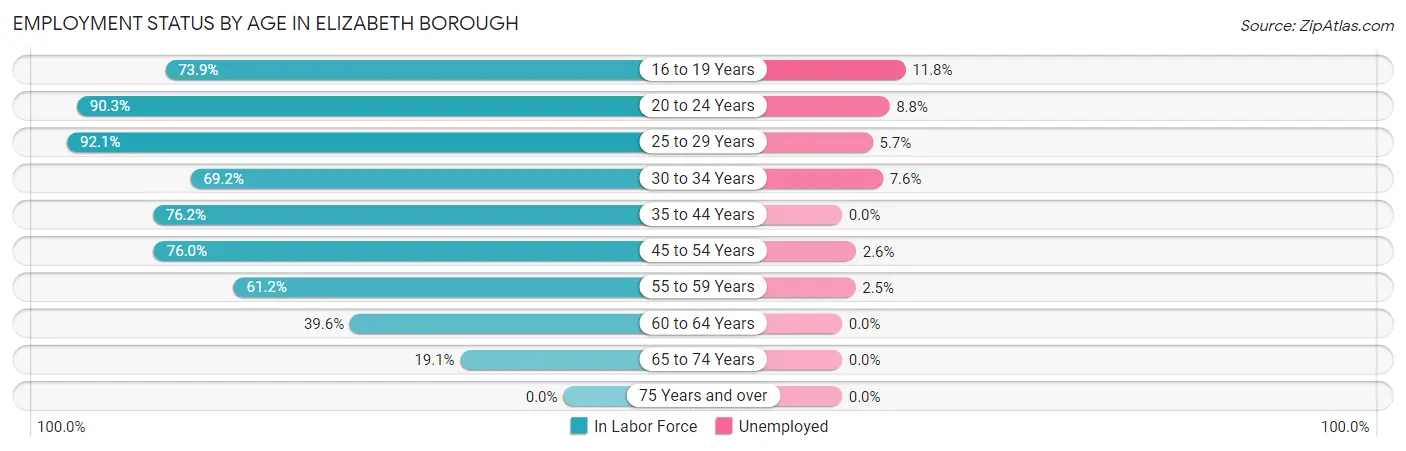
| Age Bracket | In Labor Force | Unemployed |
| 16 to 19 Years | 34 (73.9%) | 4 (11.8%) |
| 20 to 24 Years | 159 (90.3%) | 14 (8.8%) |
| 25 to 29 Years | 70 (92.1%) | 4 (5.7%) |
| 30 to 34 Years | 92 (69.2%) | 7 (7.6%) |
| 35 to 44 Years | 138 (76.2%) | 0 (0.0%) |
| 45 to 54 Years | 76 (76.0%) | 2 (2.6%) |
| 55 to 59 Years | 79 (61.2%) | 2 (2.5%) |
| 60 to 64 Years | 42 (39.6%) | 0 (0.0%) |
| 65 to 74 Years | 30 (19.1%) | 0 (0.0%) |
| 75 Years and over | 0 (0.0%) | 0 (0.0%) |
| Total | 721 (60.2%) | 33 (4.6%) |
Employment Status by Educational Attainment in Elizabeth borough
According to labor force statistics for Elizabeth borough, 68.6% of individuals (497) out of the total population between 25 and 64 years of age (725) are in the labor force, with 3.0% or 15 of them being unemployed. The group with the highest labor force participation rate are those with the educational attainment of bachelor's degree or higher, with 95.7% or 179 individuals in the labor force. Within the labor force, individuals with bachelor's degree or higher education have the highest percentage of unemployment, with 5.6% or 10 of them being unemployed.
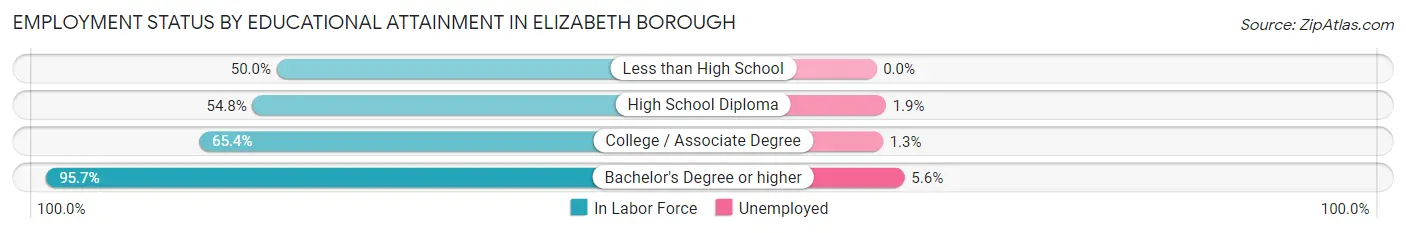
| Educational Attainment | In Labor Force | Unemployed |
| Less than High School | 13 (50.0%) | 0 (0.0%) |
| High School Diploma | 154 (54.8%) | 5 (1.9%) |
| College / Associate Degree | 151 (65.4%) | 3 (1.3%) |
| Bachelor's Degree or higher | 179 (95.7%) | 10 (5.6%) |
| Total | 497 (68.6%) | 22 (3.0%) |
Employment Occupations by Sex in Elizabeth borough
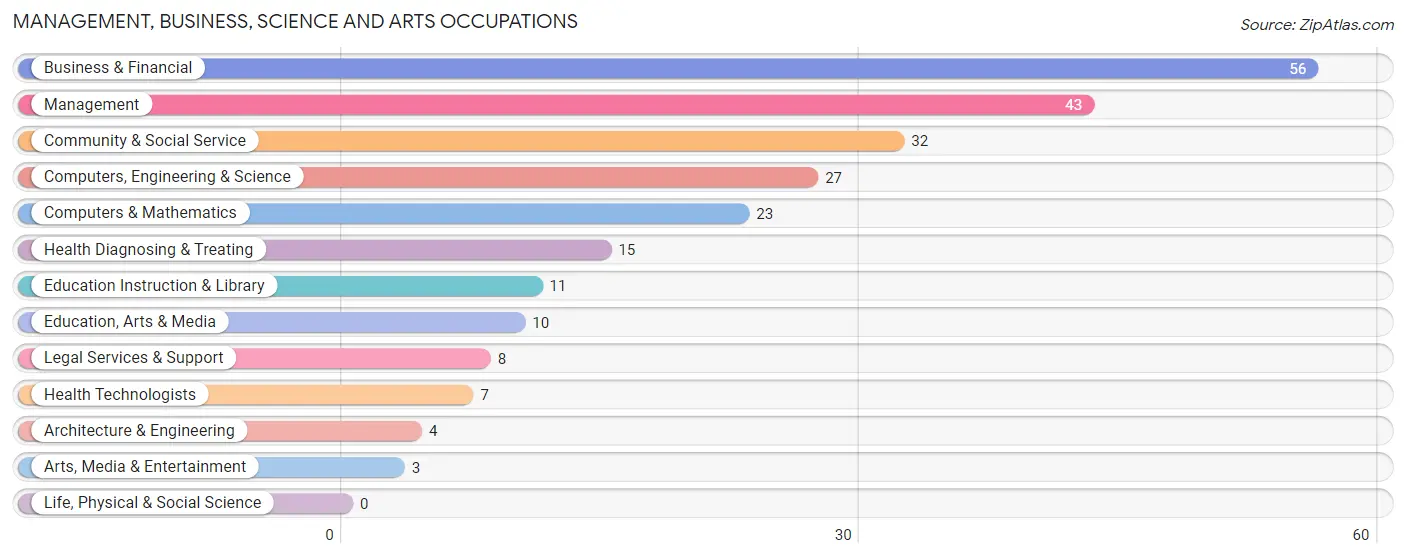
Management, Business, Science and Arts Occupations
The most common Management, Business, Science and Arts occupations in Elizabeth borough are Business & Financial (56 | 8.2%), Management (43 | 6.3%), Community & Social Service (32 | 4.7%), Computers, Engineering & Science (27 | 3.9%), and Computers & Mathematics (23 | 3.4%).
Management, Business, Science and Arts Occupations by Sex
Within the Management, Business, Science and Arts occupations in Elizabeth borough, the most male-oriented occupations are Architecture & Engineering (100.0%), Education, Arts & Media (100.0%), and Computers, Engineering & Science (92.6%), while the most female-oriented occupations are Legal Services & Support (100.0%), Arts, Media & Entertainment (100.0%), and Health Diagnosing & Treating (73.3%).
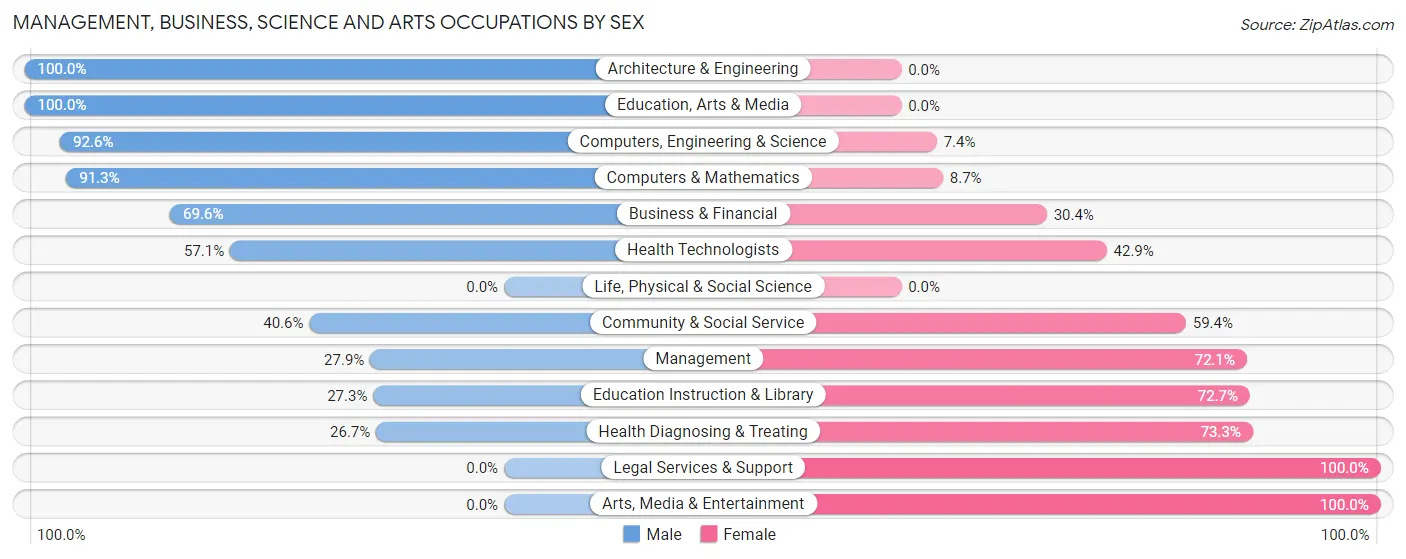
| Occupation | Male | Female |
| Management | 12 (27.9%) | 31 (72.1%) |
| Business & Financial | 39 (69.6%) | 17 (30.4%) |
| Computers, Engineering & Science | 25 (92.6%) | 2 (7.4%) |
| Computers & Mathematics | 21 (91.3%) | 2 (8.7%) |
| Architecture & Engineering | 4 (100.0%) | 0 (0.0%) |
| Life, Physical & Social Science | 0 (0.0%) | 0 (0.0%) |
| Community & Social Service | 13 (40.6%) | 19 (59.4%) |
| Education, Arts & Media | 10 (100.0%) | 0 (0.0%) |
| Legal Services & Support | 0 (0.0%) | 8 (100.0%) |
| Education Instruction & Library | 3 (27.3%) | 8 (72.7%) |
| Arts, Media & Entertainment | 0 (0.0%) | 3 (100.0%) |
| Health Diagnosing & Treating | 4 (26.7%) | 11 (73.3%) |
| Health Technologists | 4 (57.1%) | 3 (42.9%) |
| Total (Category) | 93 (53.8%) | 80 (46.2%) |
| Total (Overall) | 368 (53.6%) | 319 (46.4%) |
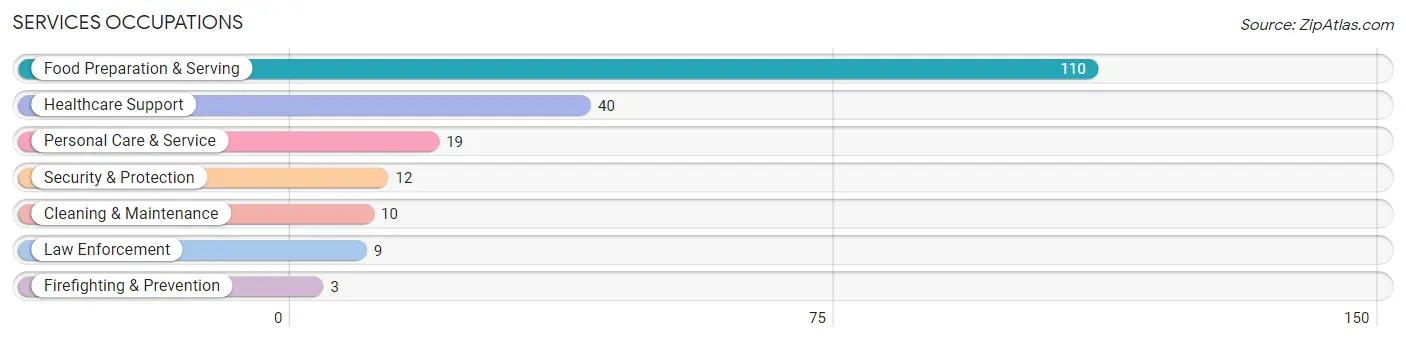
Services Occupations
The most common Services occupations in Elizabeth borough are Food Preparation & Serving (110 | 16.0%), Healthcare Support (40 | 5.8%), Personal Care & Service (19 | 2.8%), Security & Protection (12 | 1.8%), and Cleaning & Maintenance (10 | 1.5%).
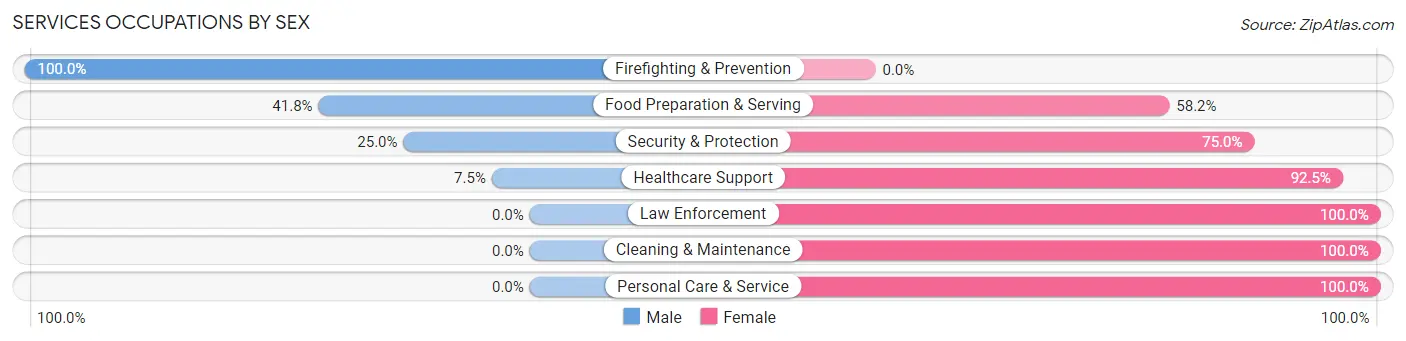
Services Occupations by Sex
Within the Services occupations in Elizabeth borough, the most male-oriented occupations are Firefighting & Prevention (100.0%), Food Preparation & Serving (41.8%), and Security & Protection (25.0%), while the most female-oriented occupations are Law Enforcement (100.0%), Cleaning & Maintenance (100.0%), and Personal Care & Service (100.0%).
| Occupation | Male | Female |
| Healthcare Support | 3 (7.5%) | 37 (92.5%) |
| Security & Protection | 3 (25.0%) | 9 (75.0%) |
| Firefighting & Prevention | 3 (100.0%) | 0 (0.0%) |
| Law Enforcement | 0 (0.0%) | 9 (100.0%) |
| Food Preparation & Serving | 46 (41.8%) | 64 (58.2%) |
| Cleaning & Maintenance | 0 (0.0%) | 10 (100.0%) |
| Personal Care & Service | 0 (0.0%) | 19 (100.0%) |
| Total (Category) | 52 (27.2%) | 139 (72.8%) |
| Total (Overall) | 368 (53.6%) | 319 (46.4%) |
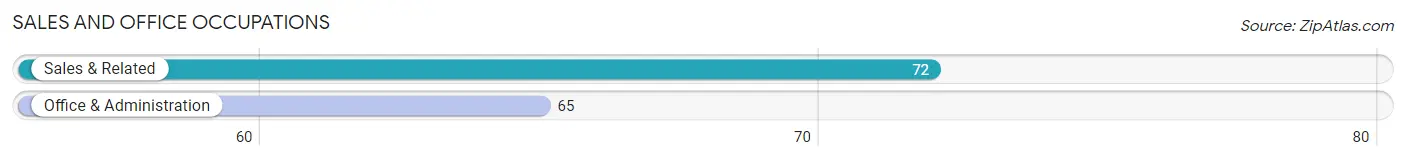
Sales and Office Occupations
The most common Sales and Office occupations in Elizabeth borough are Sales & Related (72 | 10.5%), and Office & Administration (65 | 9.5%).
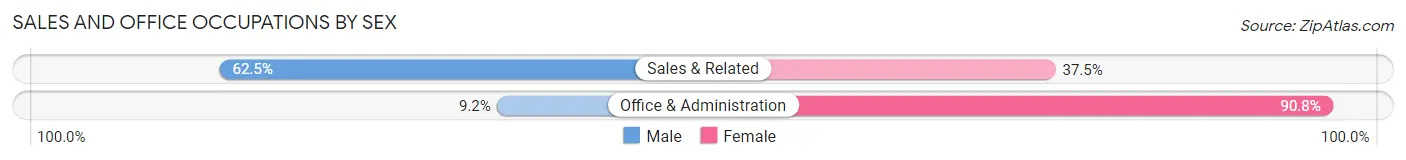
Sales and Office Occupations by Sex
| Occupation | Male | Female |
| Sales & Related | 45 (62.5%) | 27 (37.5%) |
| Office & Administration | 6 (9.2%) | 59 (90.8%) |
| Total (Category) | 51 (37.2%) | 86 (62.8%) |
| Total (Overall) | 368 (53.6%) | 319 (46.4%) |
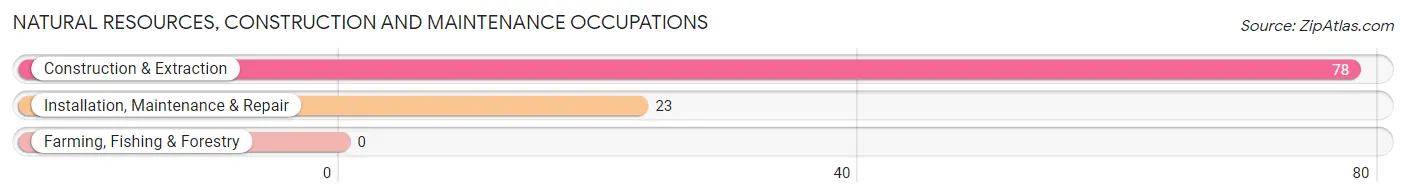
Natural Resources, Construction and Maintenance Occupations
The most common Natural Resources, Construction and Maintenance occupations in Elizabeth borough are Construction & Extraction (78 | 11.4%), and Installation, Maintenance & Repair (23 | 3.4%).
Natural Resources, Construction and Maintenance Occupations by Sex
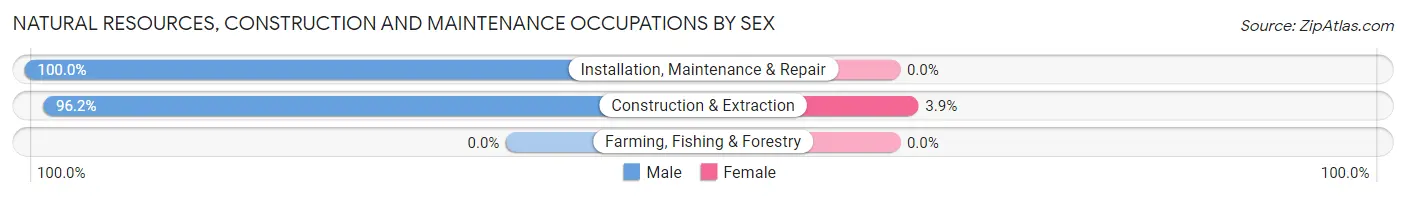
| Occupation | Male | Female |
| Farming, Fishing & Forestry | 0 (0.0%) | 0 (0.0%) |
| Construction & Extraction | 75 (96.2%) | 3 (3.8%) |
| Installation, Maintenance & Repair | 23 (100.0%) | 0 (0.0%) |
| Total (Category) | 98 (97.0%) | 3 (3.0%) |
| Total (Overall) | 368 (53.6%) | 319 (46.4%) |
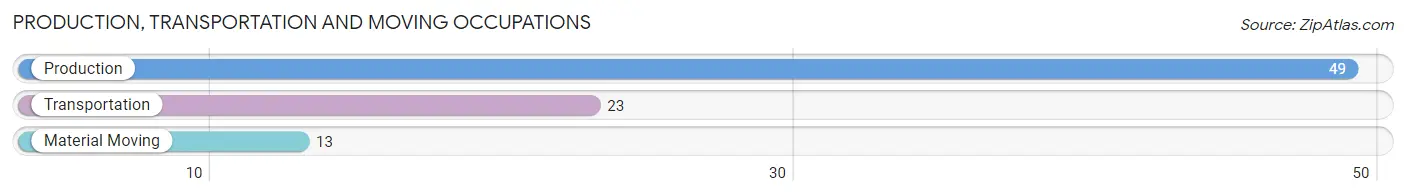
Production, Transportation and Moving Occupations
The most common Production, Transportation and Moving occupations in Elizabeth borough are Production (49 | 7.1%), Transportation (23 | 3.4%), and Material Moving (13 | 1.9%).
Production, Transportation and Moving Occupations by Sex
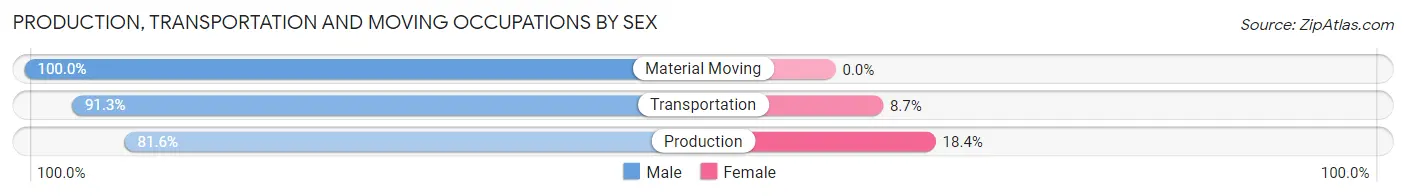
| Occupation | Male | Female |
| Production | 40 (81.6%) | 9 (18.4%) |
| Transportation | 21 (91.3%) | 2 (8.7%) |
| Material Moving | 13 (100.0%) | 0 (0.0%) |
| Total (Category) | 74 (87.1%) | 11 (12.9%) |
| Total (Overall) | 368 (53.6%) | 319 (46.4%) |
Employment Industries by Sex in Elizabeth borough
Employment Industries in Elizabeth borough
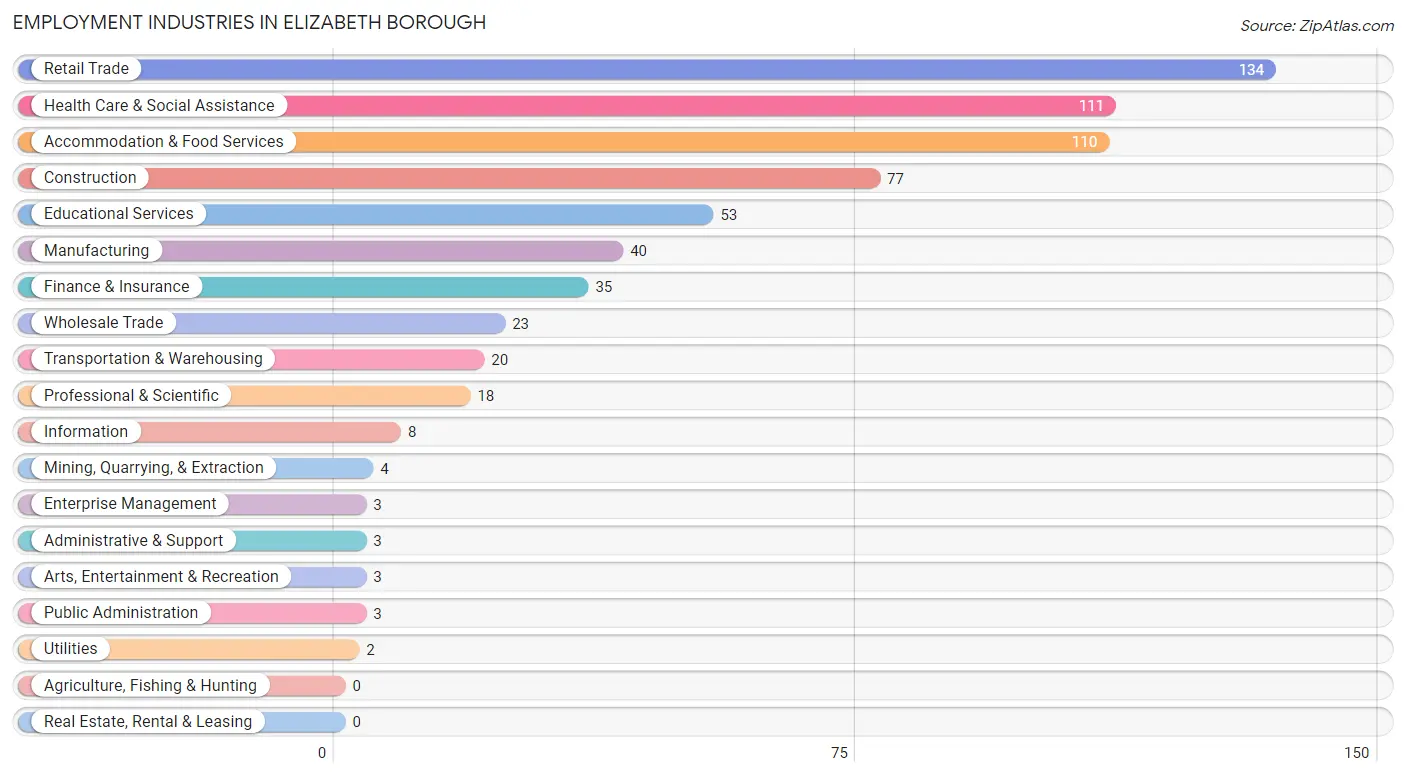
The major employment industries in Elizabeth borough include Retail Trade (134 | 19.5%), Health Care & Social Assistance (111 | 16.2%), Accommodation & Food Services (110 | 16.0%), Construction (77 | 11.2%), and Educational Services (53 | 7.7%).
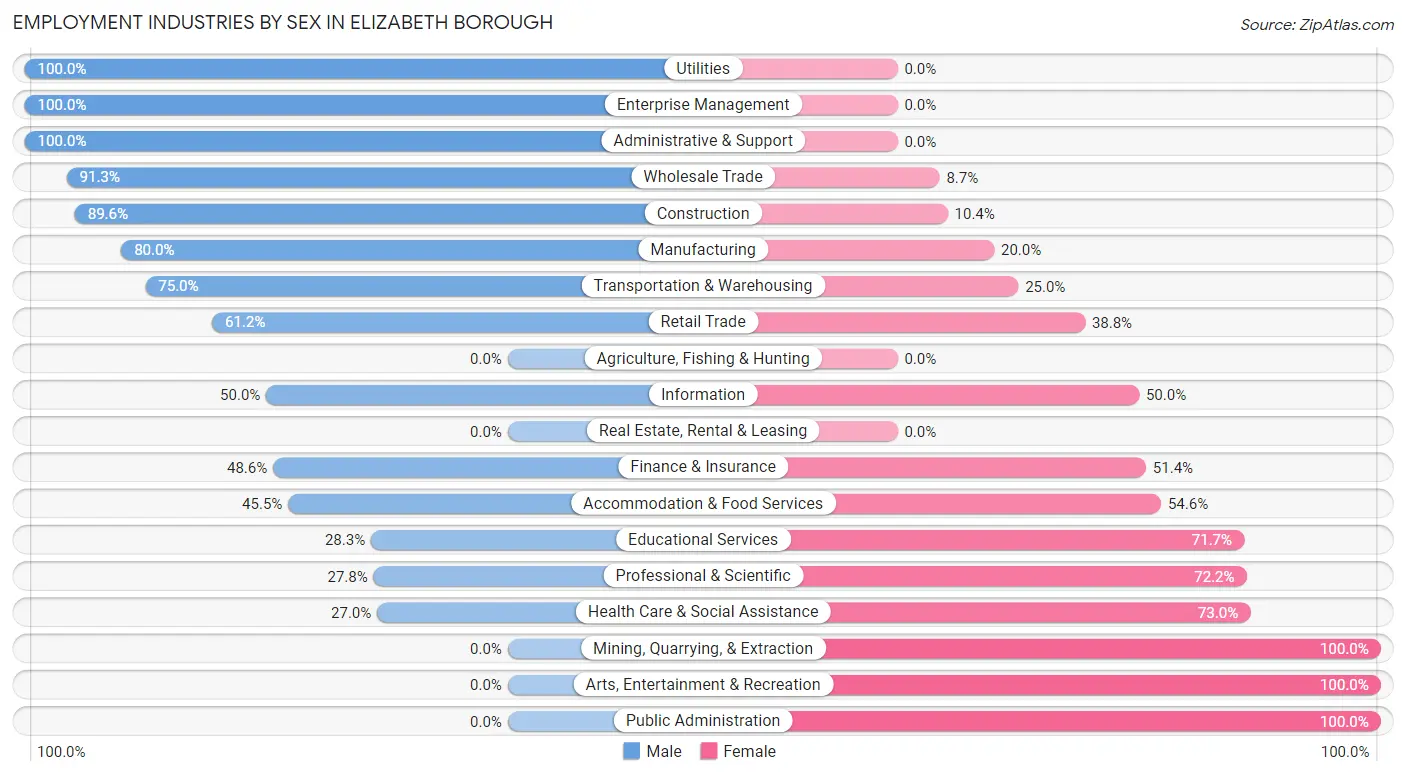
Employment Industries by Sex in Elizabeth borough
The Elizabeth borough industries that see more men than women are Utilities (100.0%), Enterprise Management (100.0%), and Administrative & Support (100.0%), whereas the industries that tend to have a higher number of women are Mining, Quarrying, & Extraction (100.0%), Arts, Entertainment & Recreation (100.0%), and Public Administration (100.0%).
| Industry | Male | Female |
| Agriculture, Fishing & Hunting | 0 (0.0%) | 0 (0.0%) |
| Mining, Quarrying, & Extraction | 0 (0.0%) | 4 (100.0%) |
| Construction | 69 (89.6%) | 8 (10.4%) |
| Manufacturing | 32 (80.0%) | 8 (20.0%) |
| Wholesale Trade | 21 (91.3%) | 2 (8.7%) |
| Retail Trade | 82 (61.2%) | 52 (38.8%) |
| Transportation & Warehousing | 15 (75.0%) | 5 (25.0%) |
| Utilities | 2 (100.0%) | 0 (0.0%) |
| Information | 4 (50.0%) | 4 (50.0%) |
| Finance & Insurance | 17 (48.6%) | 18 (51.4%) |
| Real Estate, Rental & Leasing | 0 (0.0%) | 0 (0.0%) |
| Professional & Scientific | 5 (27.8%) | 13 (72.2%) |
| Enterprise Management | 3 (100.0%) | 0 (0.0%) |
| Administrative & Support | 3 (100.0%) | 0 (0.0%) |
| Educational Services | 15 (28.3%) | 38 (71.7%) |
| Health Care & Social Assistance | 30 (27.0%) | 81 (73.0%) |
| Arts, Entertainment & Recreation | 0 (0.0%) | 3 (100.0%) |
| Accommodation & Food Services | 50 (45.5%) | 60 (54.5%) |
| Public Administration | 0 (0.0%) | 3 (100.0%) |
| Total | 368 (53.6%) | 319 (46.4%) |
Education in Elizabeth borough
School Enrollment in Elizabeth borough
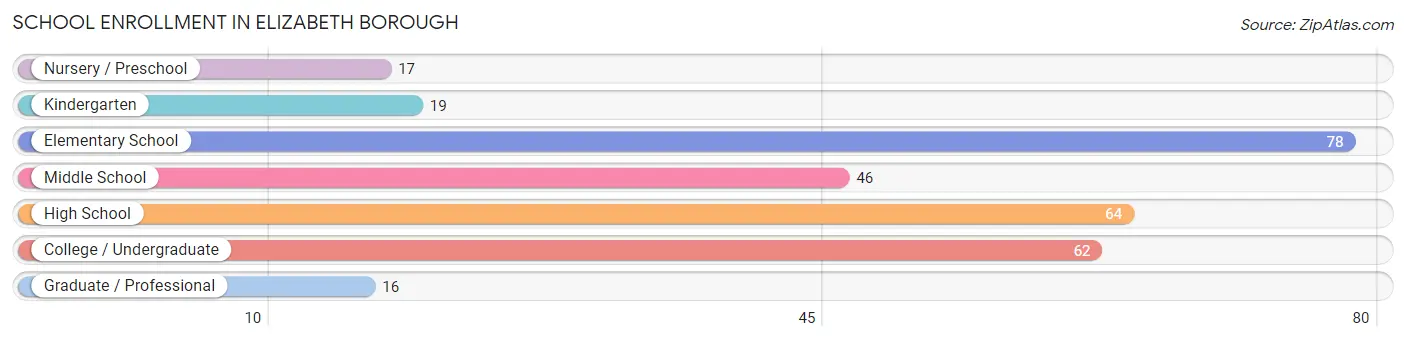
The most common levels of schooling among the 302 students in Elizabeth borough are elementary school (78 | 25.8%), high school (64 | 21.2%), and college / undergraduate (62 | 20.5%).
| School Level | # Students | % Students |
| Nursery / Preschool | 17 | 5.6% |
| Kindergarten | 19 | 6.3% |
| Elementary School | 78 | 25.8% |
| Middle School | 46 | 15.2% |
| High School | 64 | 21.2% |
| College / Undergraduate | 62 | 20.5% |
| Graduate / Professional | 16 | 5.3% |
| Total | 302 | 100.0% |
School Enrollment by Age by Funding Source in Elizabeth borough
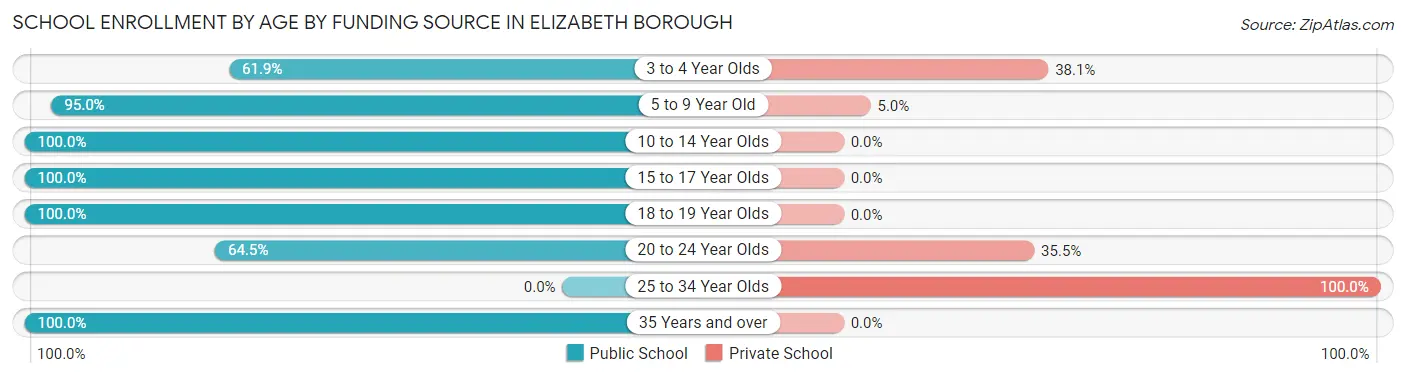
Out of a total of 302 students who are enrolled in schools in Elizabeth borough, 35 (11.6%) attend a private institution, while the remaining 267 (88.4%) are enrolled in public schools. The age group of 25 to 34 year olds has the highest likelihood of being enrolled in private schools, with 2 (100.0% in the age bracket) enrolled. Conversely, the age group of 10 to 14 year olds has the lowest likelihood of being enrolled in a private school, with 90 (100.0% in the age bracket) attending a public institution.
| Age Bracket | Public School | Private School |
| 3 to 4 Year Olds | 13 (61.9%) | 8 (38.1%) |
| 5 to 9 Year Old | 57 (95.0%) | 3 (5.0%) |
| 10 to 14 Year Olds | 90 (100.0%) | 0 (0.0%) |
| 15 to 17 Year Olds | 38 (100.0%) | 0 (0.0%) |
| 18 to 19 Year Olds | 10 (100.0%) | 0 (0.0%) |
| 20 to 24 Year Olds | 40 (64.5%) | 22 (35.5%) |
| 25 to 34 Year Olds | 0 (0.0%) | 2 (100.0%) |
| 35 Years and over | 19 (100.0%) | 0 (0.0%) |
| Total | 267 (88.4%) | 35 (11.6%) |
Educational Attainment by Field of Study in Elizabeth borough
Business (56 | 24.3%), communications (42 | 18.3%), computers & mathematics (32 | 13.9%), education (22 | 9.6%), and engineering (17 | 7.4%) are the most common fields of study among 230 individuals in Elizabeth borough who have obtained a bachelor's degree or higher.
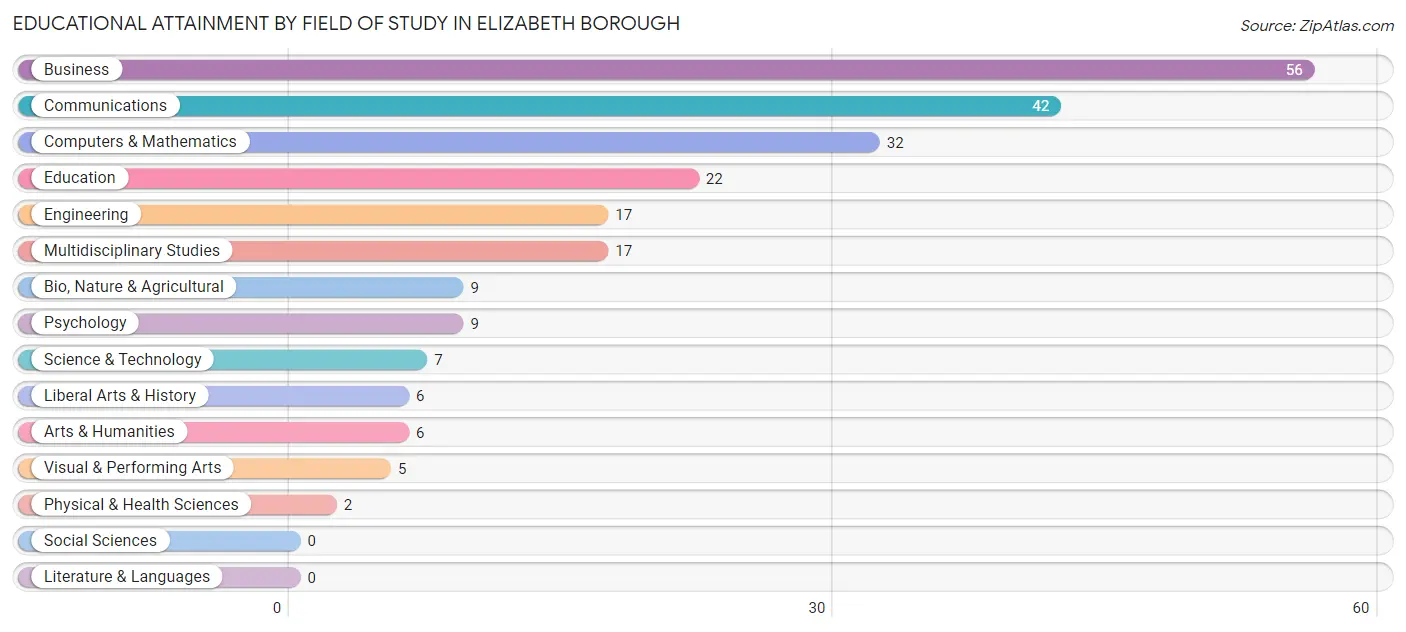
| Field of Study | # Graduates | % Graduates |
| Computers & Mathematics | 32 | 13.9% |
| Bio, Nature & Agricultural | 9 | 3.9% |
| Physical & Health Sciences | 2 | 0.9% |
| Psychology | 9 | 3.9% |
| Social Sciences | 0 | 0.0% |
| Engineering | 17 | 7.4% |
| Multidisciplinary Studies | 17 | 7.4% |
| Science & Technology | 7 | 3.0% |
| Business | 56 | 24.3% |
| Education | 22 | 9.6% |
| Literature & Languages | 0 | 0.0% |
| Liberal Arts & History | 6 | 2.6% |
| Visual & Performing Arts | 5 | 2.2% |
| Communications | 42 | 18.3% |
| Arts & Humanities | 6 | 2.6% |
| Total | 230 | 100.0% |
Transportation & Commute in Elizabeth borough
Vehicle Availability by Sex in Elizabeth borough
The most prevalent vehicle ownership categories in Elizabeth borough are males with 2 vehicles (151, accounting for 41.6%) and females with 2 vehicles (80, making up 51.4%).
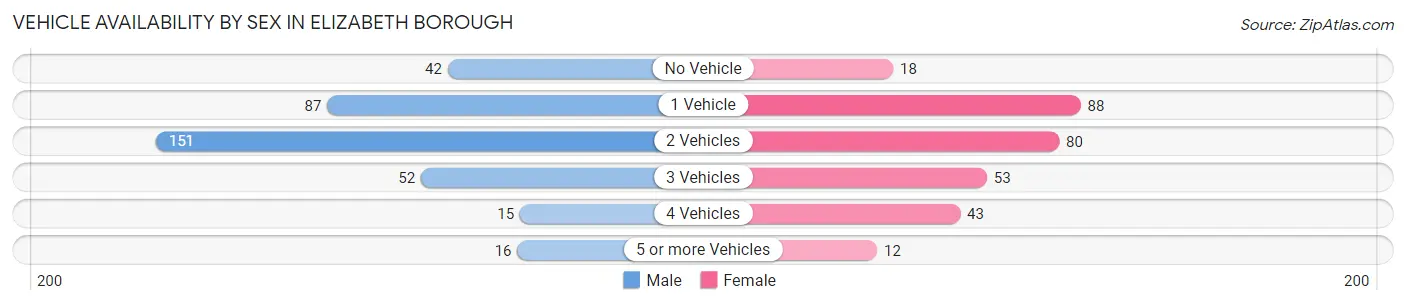
| Vehicles Available | Male | Female |
| No Vehicle | 42 (11.6%) | 18 (6.1%) |
| 1 Vehicle | 87 (24.0%) | 88 (29.9%) |
| 2 Vehicles | 151 (41.6%) | 80 (27.2%) |
| 3 Vehicles | 52 (14.3%) | 53 (18.0%) |
| 4 Vehicles | 15 (4.1%) | 43 (14.6%) |
| 5 or more Vehicles | 16 (4.4%) | 12 (4.1%) |
| Total | 363 (100.0%) | 294 (100.0%) |
Commute Time in Elizabeth borough
The most frequently occuring commute durations in Elizabeth borough are 45 to 59 minutes (142 commuters, 22.5%), 60 to 89 minutes (87 commuters, 13.8%), and 10 to 14 minutes (84 commuters, 13.3%).
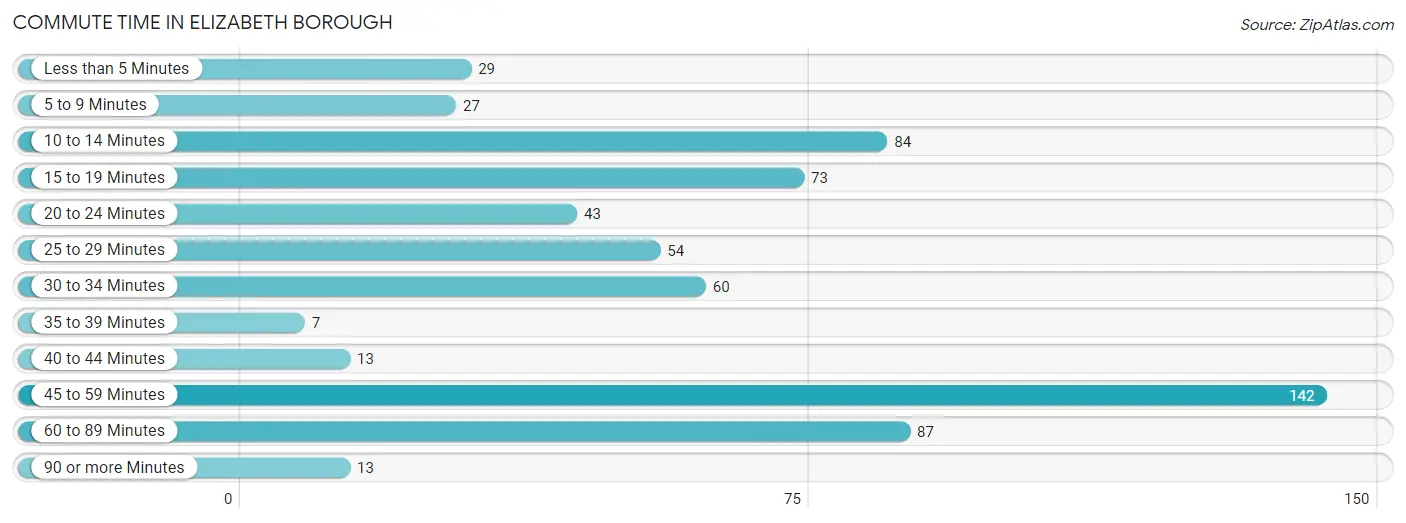
| Commute Time | # Commuters | % Commuters |
| Less than 5 Minutes | 29 | 4.6% |
| 5 to 9 Minutes | 27 | 4.3% |
| 10 to 14 Minutes | 84 | 13.3% |
| 15 to 19 Minutes | 73 | 11.6% |
| 20 to 24 Minutes | 43 | 6.8% |
| 25 to 29 Minutes | 54 | 8.5% |
| 30 to 34 Minutes | 60 | 9.5% |
| 35 to 39 Minutes | 7 | 1.1% |
| 40 to 44 Minutes | 13 | 2.1% |
| 45 to 59 Minutes | 142 | 22.5% |
| 60 to 89 Minutes | 87 | 13.8% |
| 90 or more Minutes | 13 | 2.1% |
Commute Time by Sex in Elizabeth borough
The most common commute times in Elizabeth borough are 45 to 59 minutes (81 commuters, 22.8%) for males and 45 to 59 minutes (61 commuters, 22.0%) for females.
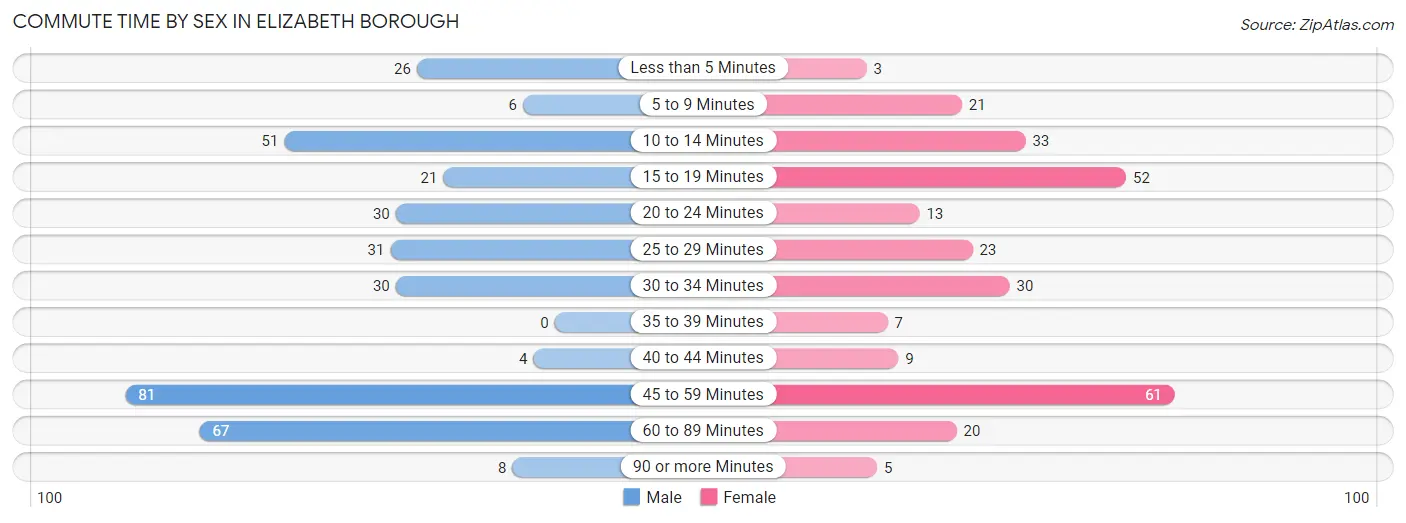
| Commute Time | Male | Female |
| Less than 5 Minutes | 26 (7.3%) | 3 (1.1%) |
| 5 to 9 Minutes | 6 (1.7%) | 21 (7.6%) |
| 10 to 14 Minutes | 51 (14.4%) | 33 (11.9%) |
| 15 to 19 Minutes | 21 (5.9%) | 52 (18.8%) |
| 20 to 24 Minutes | 30 (8.5%) | 13 (4.7%) |
| 25 to 29 Minutes | 31 (8.7%) | 23 (8.3%) |
| 30 to 34 Minutes | 30 (8.5%) | 30 (10.8%) |
| 35 to 39 Minutes | 0 (0.0%) | 7 (2.5%) |
| 40 to 44 Minutes | 4 (1.1%) | 9 (3.3%) |
| 45 to 59 Minutes | 81 (22.8%) | 61 (22.0%) |
| 60 to 89 Minutes | 67 (18.9%) | 20 (7.2%) |
| 90 or more Minutes | 8 (2.2%) | 5 (1.8%) |
Time of Departure to Work by Sex in Elizabeth borough
The most frequent times of departure to work in Elizabeth borough are 5:30 AM to 5:59 AM (57, 16.1%) for males and 8:00 AM to 8:29 AM (54, 19.5%) for females.
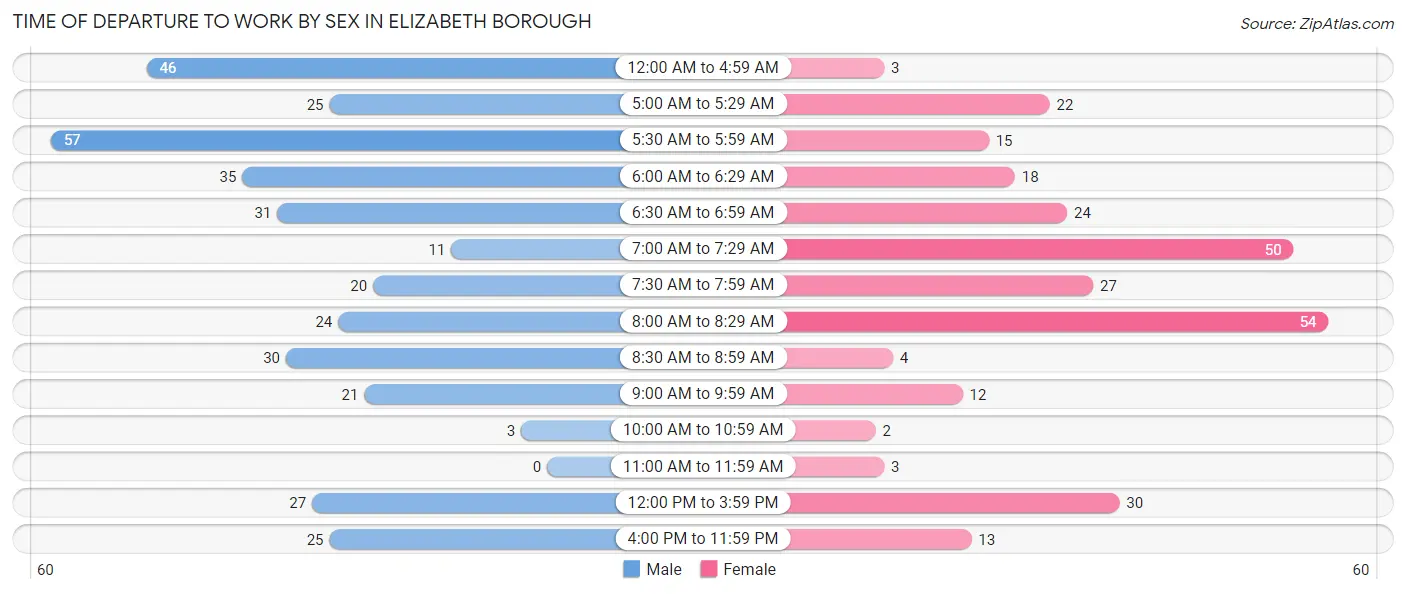
| Time of Departure | Male | Female |
| 12:00 AM to 4:59 AM | 46 (13.0%) | 3 (1.1%) |
| 5:00 AM to 5:29 AM | 25 (7.0%) | 22 (7.9%) |
| 5:30 AM to 5:59 AM | 57 (16.1%) | 15 (5.4%) |
| 6:00 AM to 6:29 AM | 35 (9.9%) | 18 (6.5%) |
| 6:30 AM to 6:59 AM | 31 (8.7%) | 24 (8.7%) |
| 7:00 AM to 7:29 AM | 11 (3.1%) | 50 (18.0%) |
| 7:30 AM to 7:59 AM | 20 (5.6%) | 27 (9.8%) |
| 8:00 AM to 8:29 AM | 24 (6.8%) | 54 (19.5%) |
| 8:30 AM to 8:59 AM | 30 (8.5%) | 4 (1.4%) |
| 9:00 AM to 9:59 AM | 21 (5.9%) | 12 (4.3%) |
| 10:00 AM to 10:59 AM | 3 (0.9%) | 2 (0.7%) |
| 11:00 AM to 11:59 AM | 0 (0.0%) | 3 (1.1%) |
| 12:00 PM to 3:59 PM | 27 (7.6%) | 30 (10.8%) |
| 4:00 PM to 11:59 PM | 25 (7.0%) | 13 (4.7%) |
| Total | 355 (100.0%) | 277 (100.0%) |
Housing Occupancy in Elizabeth borough
Occupancy by Ownership in Elizabeth borough
Of the total 605 dwellings in Elizabeth borough, owner-occupied units account for 346 (57.2%), while renter-occupied units make up 259 (42.8%).
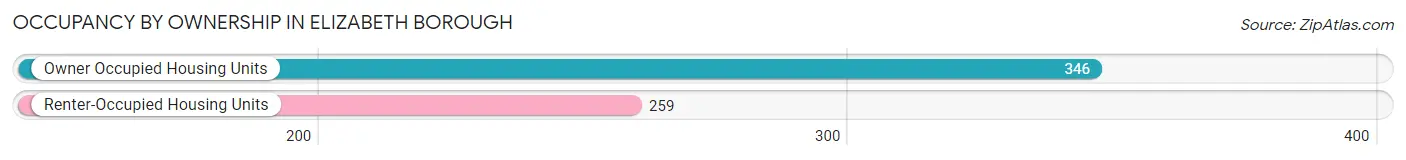
| Occupancy | # Housing Units | % Housing Units |
| Owner Occupied Housing Units | 346 | 57.2% |
| Renter-Occupied Housing Units | 259 | 42.8% |
| Total Occupied Housing Units | 605 | 100.0% |
Occupancy by Household Size in Elizabeth borough
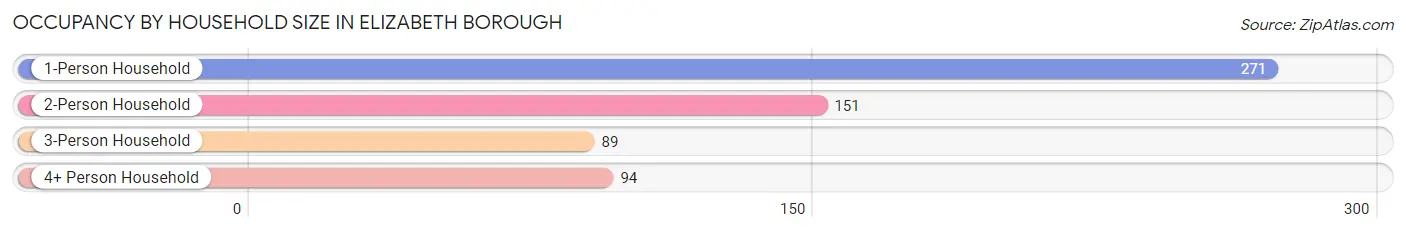
| Household Size | # Housing Units | % Housing Units |
| 1-Person Household | 271 | 44.8% |
| 2-Person Household | 151 | 25.0% |
| 3-Person Household | 89 | 14.7% |
| 4+ Person Household | 94 | 15.5% |
| Total Housing Units | 605 | 100.0% |
Occupancy by Ownership by Household Size in Elizabeth borough
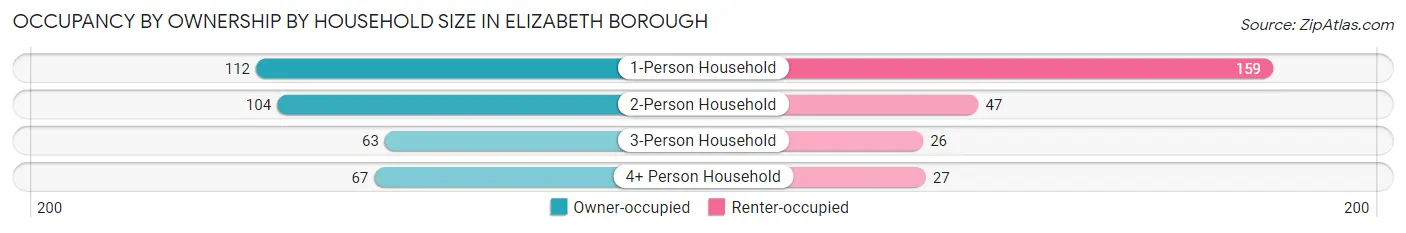
| Household Size | Owner-occupied | Renter-occupied |
| 1-Person Household | 112 (41.3%) | 159 (58.7%) |
| 2-Person Household | 104 (68.9%) | 47 (31.1%) |
| 3-Person Household | 63 (70.8%) | 26 (29.2%) |
| 4+ Person Household | 67 (71.3%) | 27 (28.7%) |
| Total Housing Units | 346 (57.2%) | 259 (42.8%) |
Occupancy by Educational Attainment in Elizabeth borough
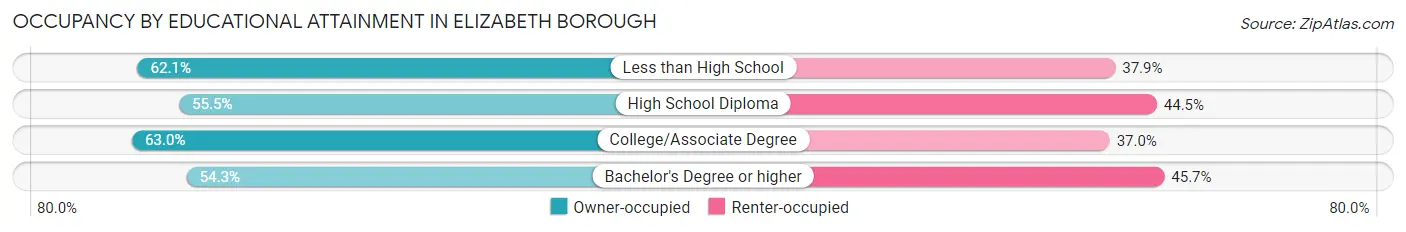
| Household Size | Owner-occupied | Renter-occupied |
| Less than High School | 18 (62.1%) | 11 (37.9%) |
| High School Diploma | 167 (55.5%) | 134 (44.5%) |
| College/Associate Degree | 85 (63.0%) | 50 (37.0%) |
| Bachelor's Degree or higher | 76 (54.3%) | 64 (45.7%) |
Occupancy by Age of Householder in Elizabeth borough
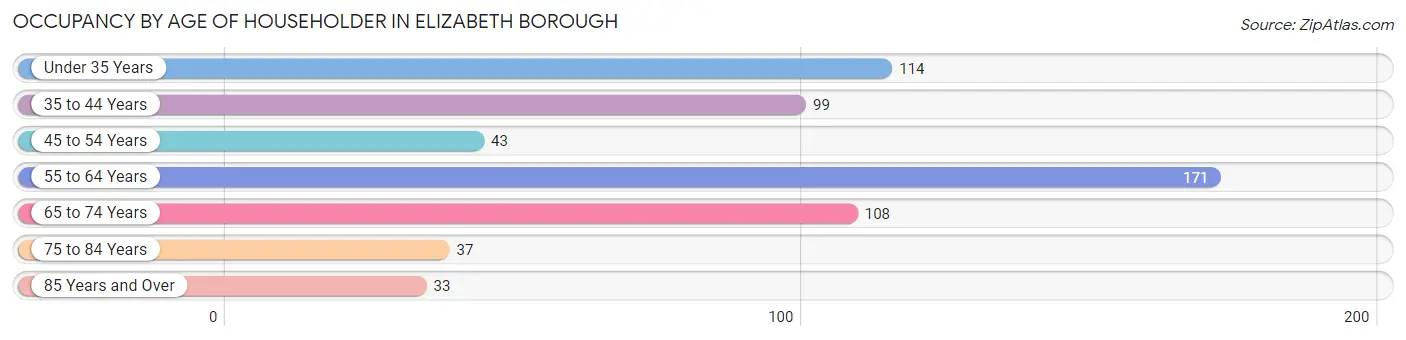
| Age Bracket | # Households | % Households |
| Under 35 Years | 114 | 18.8% |
| 35 to 44 Years | 99 | 16.4% |
| 45 to 54 Years | 43 | 7.1% |
| 55 to 64 Years | 171 | 28.3% |
| 65 to 74 Years | 108 | 17.8% |
| 75 to 84 Years | 37 | 6.1% |
| 85 Years and Over | 33 | 5.4% |
| Total | 605 | 100.0% |
Housing Finances in Elizabeth borough
Median Income by Occupancy in Elizabeth borough
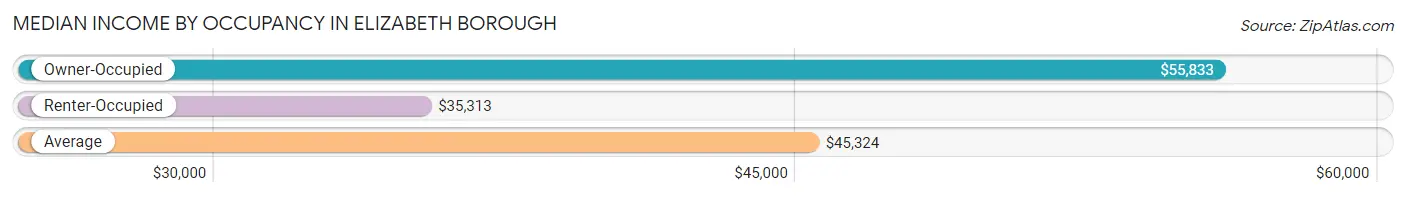
| Occupancy Type | # Households | Median Income |
| Owner-Occupied | 346 (57.2%) | $55,833 |
| Renter-Occupied | 259 (42.8%) | $35,313 |
| Average | 605 (100.0%) | $45,324 |
Occupancy by Householder Income Bracket in Elizabeth borough
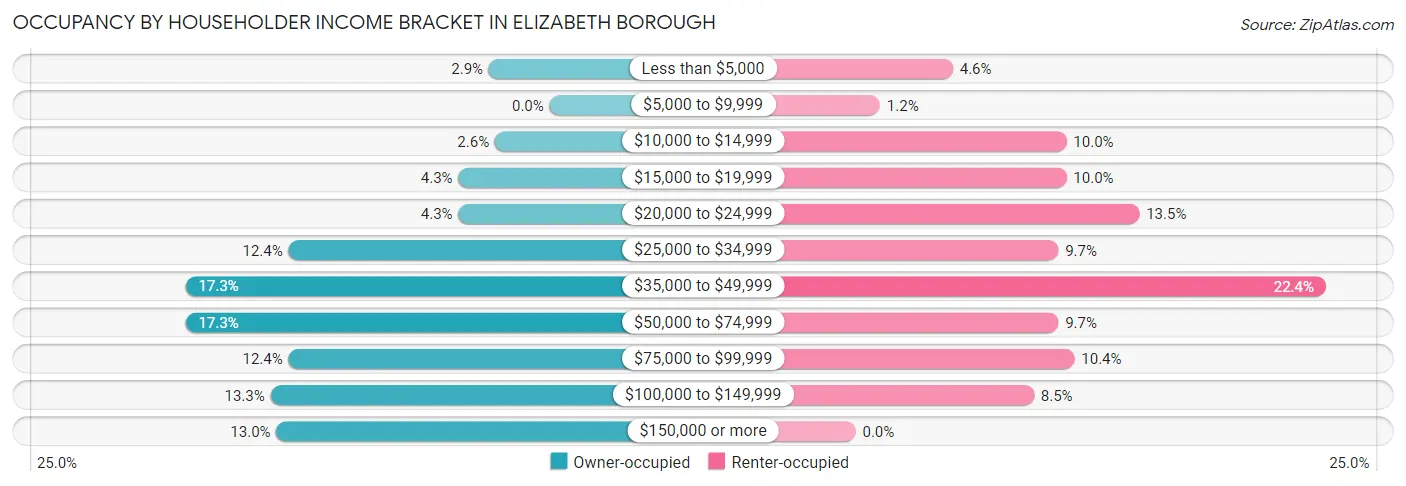
| Income Bracket | Owner-occupied | Renter-occupied |
| Less than $5,000 | 10 (2.9%) | 12 (4.6%) |
| $5,000 to $9,999 | 0 (0.0%) | 3 (1.2%) |
| $10,000 to $14,999 | 9 (2.6%) | 26 (10.0%) |
| $15,000 to $19,999 | 15 (4.3%) | 26 (10.0%) |
| $20,000 to $24,999 | 15 (4.3%) | 35 (13.5%) |
| $25,000 to $34,999 | 43 (12.4%) | 25 (9.7%) |
| $35,000 to $49,999 | 60 (17.3%) | 58 (22.4%) |
| $50,000 to $74,999 | 60 (17.3%) | 25 (9.7%) |
| $75,000 to $99,999 | 43 (12.4%) | 27 (10.4%) |
| $100,000 to $149,999 | 46 (13.3%) | 22 (8.5%) |
| $150,000 or more | 45 (13.0%) | 0 (0.0%) |
| Total | 346 (100.0%) | 259 (100.0%) |
Monthly Housing Cost Tiers in Elizabeth borough
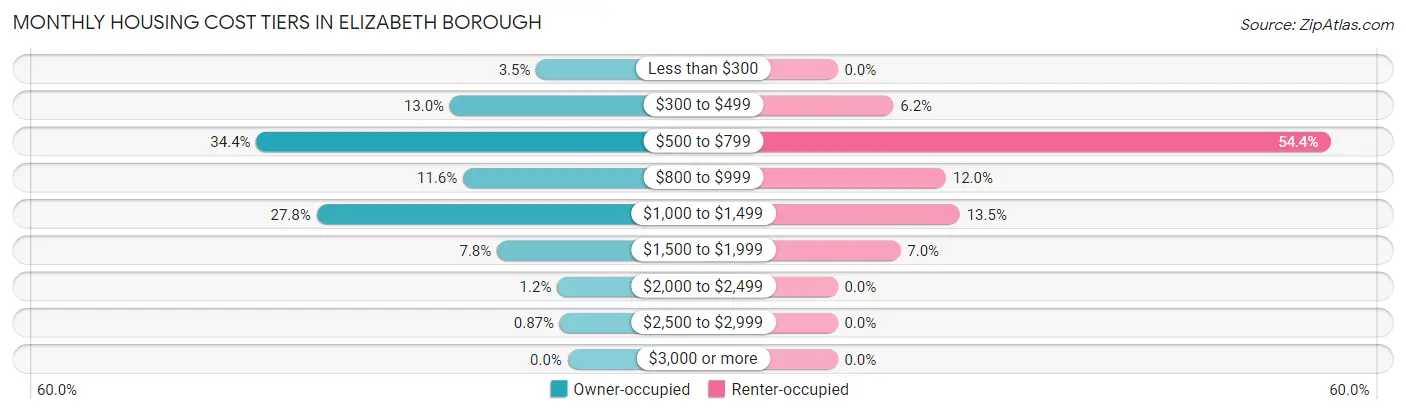
| Monthly Cost | Owner-occupied | Renter-occupied |
| Less than $300 | 12 (3.5%) | 0 (0.0%) |
| $300 to $499 | 45 (13.0%) | 16 (6.2%) |
| $500 to $799 | 119 (34.4%) | 141 (54.4%) |
| $800 to $999 | 40 (11.6%) | 31 (12.0%) |
| $1,000 to $1,499 | 96 (27.8%) | 35 (13.5%) |
| $1,500 to $1,999 | 27 (7.8%) | 18 (7.0%) |
| $2,000 to $2,499 | 4 (1.2%) | 0 (0.0%) |
| $2,500 to $2,999 | 3 (0.9%) | 0 (0.0%) |
| $3,000 or more | 0 (0.0%) | 0 (0.0%) |
| Total | 346 (100.0%) | 259 (100.0%) |
Physical Housing Characteristics in Elizabeth borough
Housing Structures in Elizabeth borough
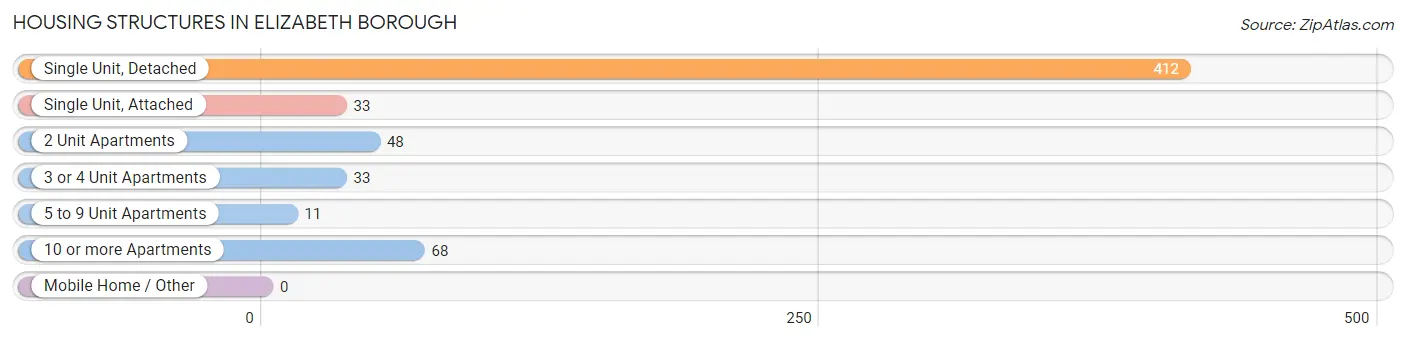
| Structure Type | # Housing Units | % Housing Units |
| Single Unit, Detached | 412 | 68.1% |
| Single Unit, Attached | 33 | 5.4% |
| 2 Unit Apartments | 48 | 7.9% |
| 3 or 4 Unit Apartments | 33 | 5.4% |
| 5 to 9 Unit Apartments | 11 | 1.8% |
| 10 or more Apartments | 68 | 11.2% |
| Mobile Home / Other | 0 | 0.0% |
| Total | 605 | 100.0% |
Housing Structures by Occupancy in Elizabeth borough
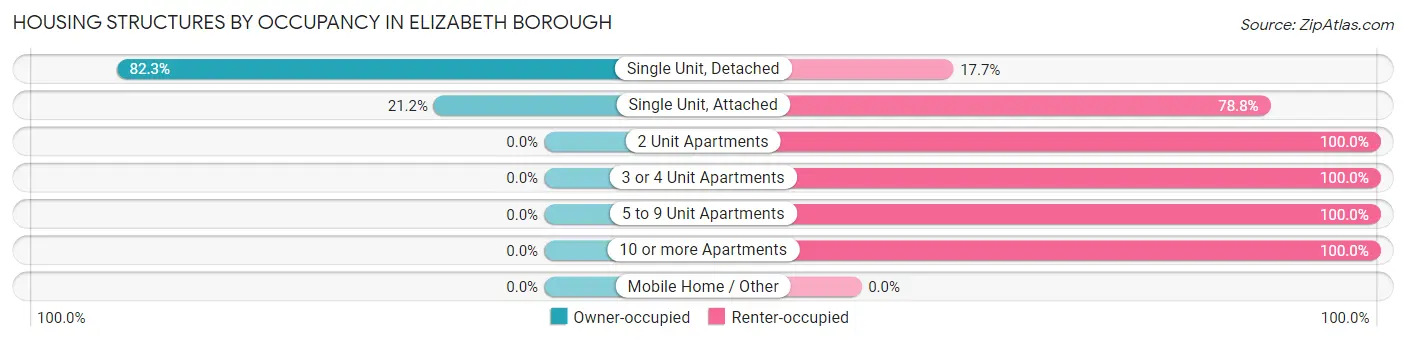
| Structure Type | Owner-occupied | Renter-occupied |
| Single Unit, Detached | 339 (82.3%) | 73 (17.7%) |
| Single Unit, Attached | 7 (21.2%) | 26 (78.8%) |
| 2 Unit Apartments | 0 (0.0%) | 48 (100.0%) |
| 3 or 4 Unit Apartments | 0 (0.0%) | 33 (100.0%) |
| 5 to 9 Unit Apartments | 0 (0.0%) | 11 (100.0%) |
| 10 or more Apartments | 0 (0.0%) | 68 (100.0%) |
| Mobile Home / Other | 0 (0.0%) | 0 (0.0%) |
| Total | 346 (57.2%) | 259 (42.8%) |
Housing Structures by Number of Rooms in Elizabeth borough
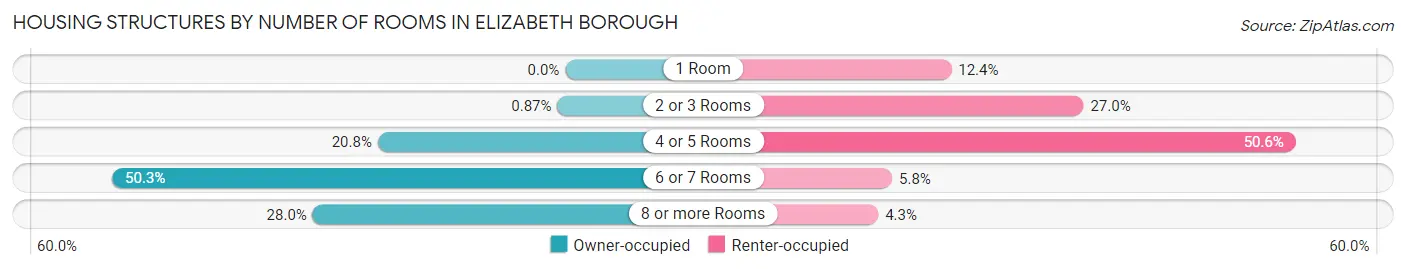
| Number of Rooms | Owner-occupied | Renter-occupied |
| 1 Room | 0 (0.0%) | 32 (12.4%) |
| 2 or 3 Rooms | 3 (0.9%) | 70 (27.0%) |
| 4 or 5 Rooms | 72 (20.8%) | 131 (50.6%) |
| 6 or 7 Rooms | 174 (50.3%) | 15 (5.8%) |
| 8 or more Rooms | 97 (28.0%) | 11 (4.3%) |
| Total | 346 (100.0%) | 259 (100.0%) |
Housing Structure by Heating Type in Elizabeth borough
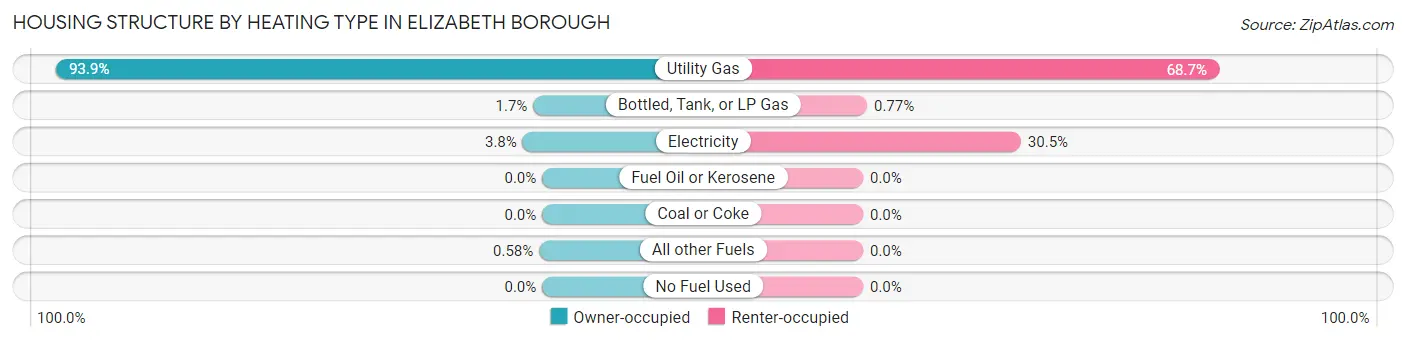
| Heating Type | Owner-occupied | Renter-occupied |
| Utility Gas | 325 (93.9%) | 178 (68.7%) |
| Bottled, Tank, or LP Gas | 6 (1.7%) | 2 (0.8%) |
| Electricity | 13 (3.8%) | 79 (30.5%) |
| Fuel Oil or Kerosene | 0 (0.0%) | 0 (0.0%) |
| Coal or Coke | 0 (0.0%) | 0 (0.0%) |
| All other Fuels | 2 (0.6%) | 0 (0.0%) |
| No Fuel Used | 0 (0.0%) | 0 (0.0%) |
| Total | 346 (100.0%) | 259 (100.0%) |
Household Vehicle Usage in Elizabeth borough
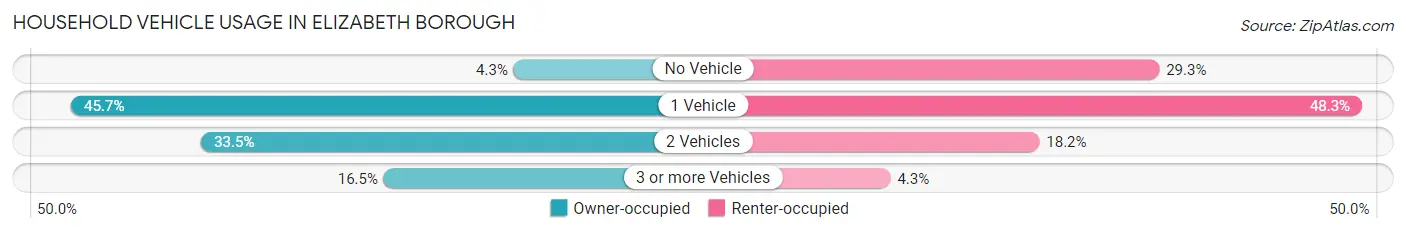
| Vehicles per Household | Owner-occupied | Renter-occupied |
| No Vehicle | 15 (4.3%) | 76 (29.3%) |
| 1 Vehicle | 158 (45.7%) | 125 (48.3%) |
| 2 Vehicles | 116 (33.5%) | 47 (18.1%) |
| 3 or more Vehicles | 57 (16.5%) | 11 (4.3%) |
| Total | 346 (100.0%) | 259 (100.0%) |
Real Estate & Mortgages in Elizabeth borough
Real Estate and Mortgage Overview in Elizabeth borough
| Characteristic | Without Mortgage | With Mortgage |
| Housing Units | 163 | 183 |
| Median Property Value | $88,500 | $110,500 |
| Median Household Income | $42,981 | $26 |
| Monthly Housing Costs | $567 | $0 |
| Real Estate Taxes | $1,935 | $0 |
Property Value by Mortgage Status in Elizabeth borough
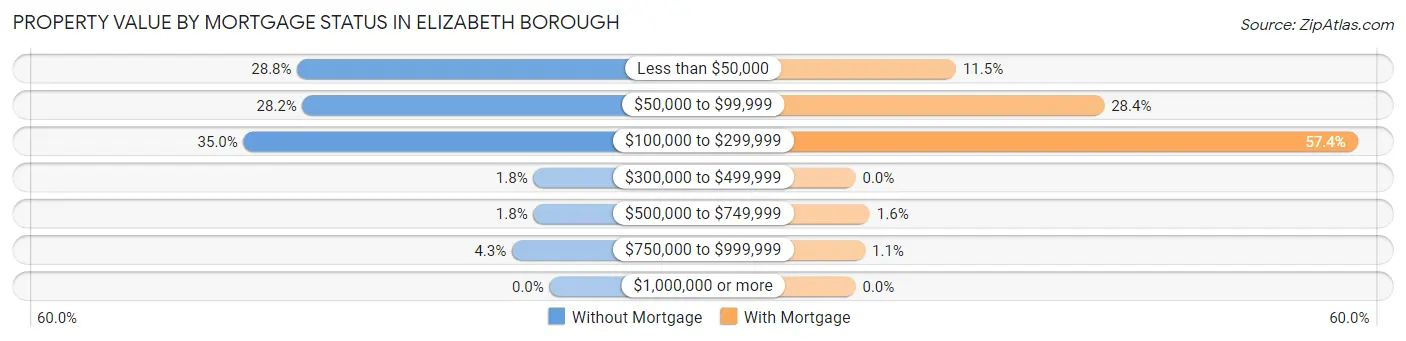
| Property Value | Without Mortgage | With Mortgage |
| Less than $50,000 | 47 (28.8%) | 21 (11.5%) |
| $50,000 to $99,999 | 46 (28.2%) | 52 (28.4%) |
| $100,000 to $299,999 | 57 (35.0%) | 105 (57.4%) |
| $300,000 to $499,999 | 3 (1.8%) | 0 (0.0%) |
| $500,000 to $749,999 | 3 (1.8%) | 3 (1.6%) |
| $750,000 to $999,999 | 7 (4.3%) | 2 (1.1%) |
| $1,000,000 or more | 0 (0.0%) | 0 (0.0%) |
| Total | 163 (100.0%) | 183 (100.0%) |
Household Income by Mortgage Status in Elizabeth borough
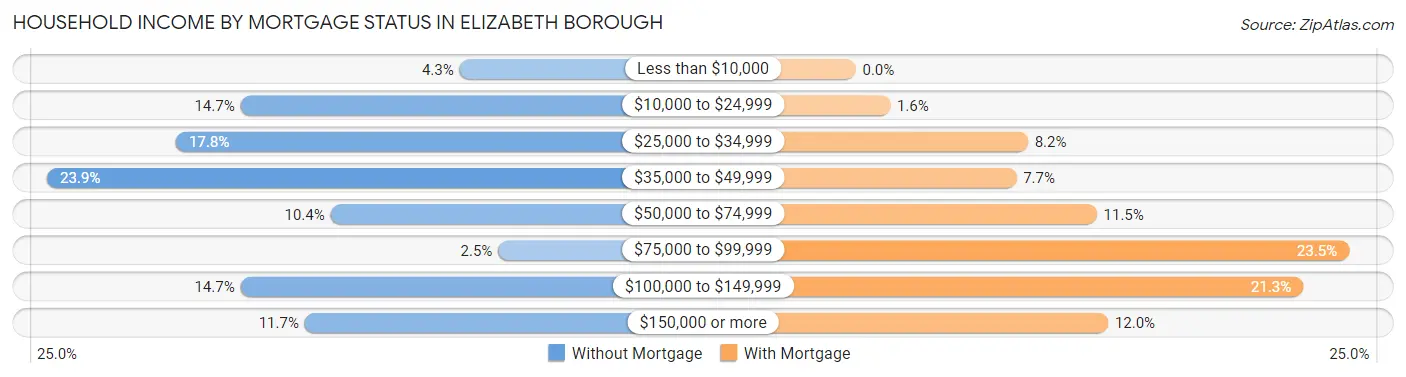
| Household Income | Without Mortgage | With Mortgage |
| Less than $10,000 | 7 (4.3%) | 0 (0.0%) |
| $10,000 to $24,999 | 24 (14.7%) | 3 (1.6%) |
| $25,000 to $34,999 | 29 (17.8%) | 15 (8.2%) |
| $35,000 to $49,999 | 39 (23.9%) | 14 (7.6%) |
| $50,000 to $74,999 | 17 (10.4%) | 21 (11.5%) |
| $75,000 to $99,999 | 4 (2.5%) | 43 (23.5%) |
| $100,000 to $149,999 | 24 (14.7%) | 39 (21.3%) |
| $150,000 or more | 19 (11.7%) | 22 (12.0%) |
| Total | 163 (100.0%) | 183 (100.0%) |
Property Value to Household Income Ratio in Elizabeth borough
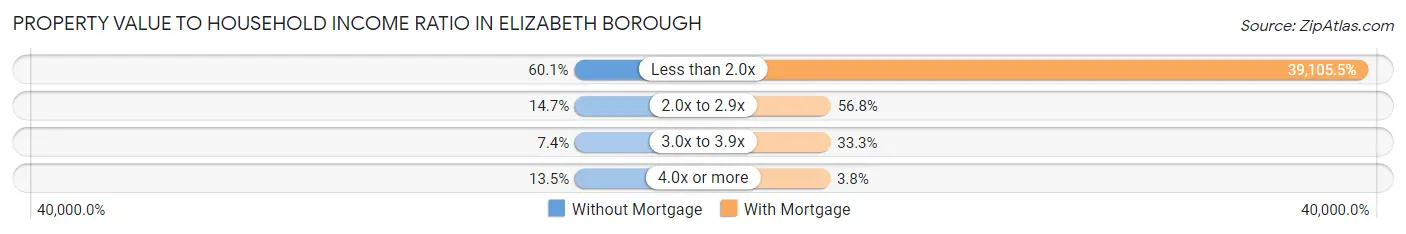
| Value-to-Income Ratio | Without Mortgage | With Mortgage |
| Less than 2.0x | 98 (60.1%) | 71,563 (39,105.5%) |
| 2.0x to 2.9x | 24 (14.7%) | 104 (56.8%) |
| 3.0x to 3.9x | 12 (7.4%) | 61 (33.3%) |
| 4.0x or more | 22 (13.5%) | 7 (3.8%) |
| Total | 163 (100.0%) | 183 (100.0%) |
Real Estate Taxes by Mortgage Status in Elizabeth borough
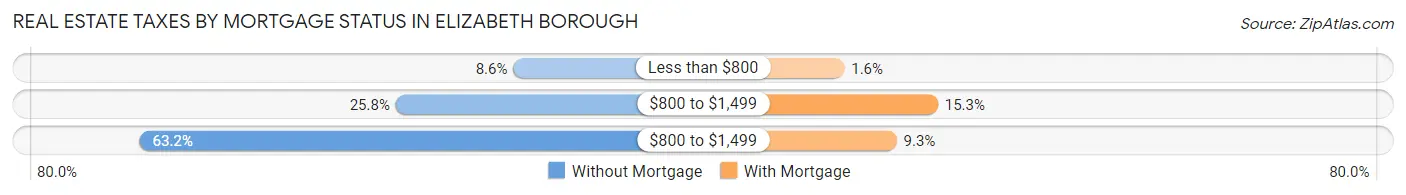
| Property Taxes | Without Mortgage | With Mortgage |
| Less than $800 | 14 (8.6%) | 3 (1.6%) |
| $800 to $1,499 | 42 (25.8%) | 28 (15.3%) |
| $800 to $1,499 | 103 (63.2%) | 17 (9.3%) |
| Total | 163 (100.0%) | 183 (100.0%) |
Health & Disability in Elizabeth borough
Health Insurance Coverage by Age in Elizabeth borough
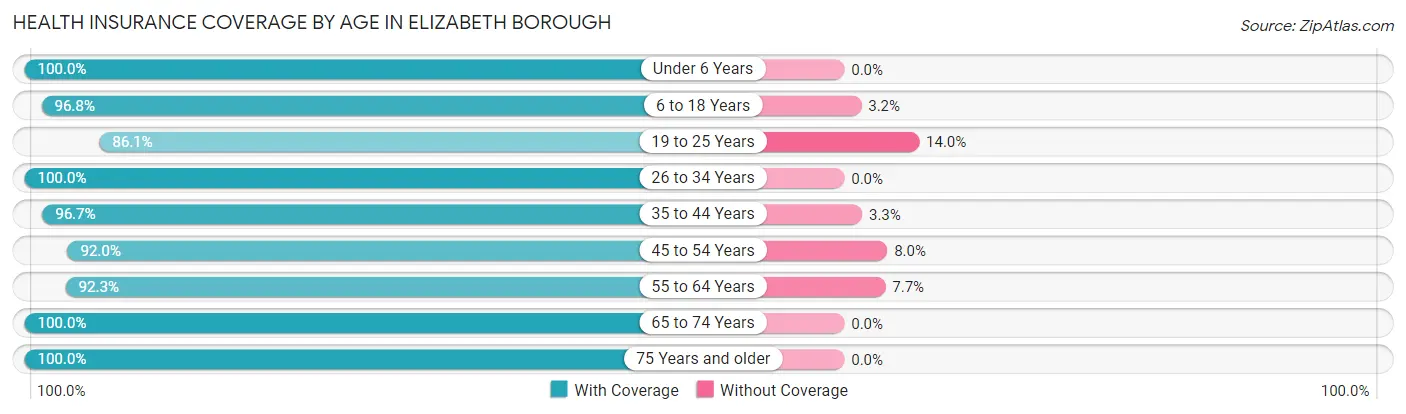
| Age Bracket | With Coverage | Without Coverage |
| Under 6 Years | 80 (100.0%) | 0 (0.0%) |
| 6 to 18 Years | 183 (96.8%) | 6 (3.2%) |
| 19 to 25 Years | 185 (86.1%) | 30 (14.0%) |
| 26 to 34 Years | 183 (100.0%) | 0 (0.0%) |
| 35 to 44 Years | 175 (96.7%) | 6 (3.3%) |
| 45 to 54 Years | 92 (92.0%) | 8 (8.0%) |
| 55 to 64 Years | 217 (92.3%) | 18 (7.7%) |
| 65 to 74 Years | 157 (100.0%) | 0 (0.0%) |
| 75 Years and older | 93 (100.0%) | 0 (0.0%) |
| Total | 1,365 (95.3%) | 68 (4.8%) |
Health Insurance Coverage by Citizenship Status in Elizabeth borough
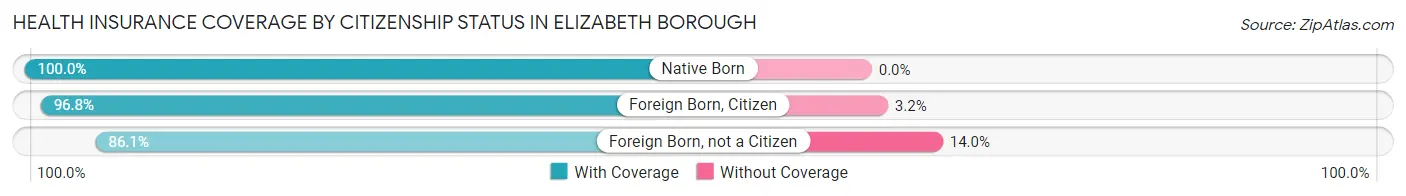
| Citizenship Status | With Coverage | Without Coverage |
| Native Born | 80 (100.0%) | 0 (0.0%) |
| Foreign Born, Citizen | 183 (96.8%) | 6 (3.2%) |
| Foreign Born, not a Citizen | 185 (86.1%) | 30 (14.0%) |
Health Insurance Coverage by Household Income in Elizabeth borough
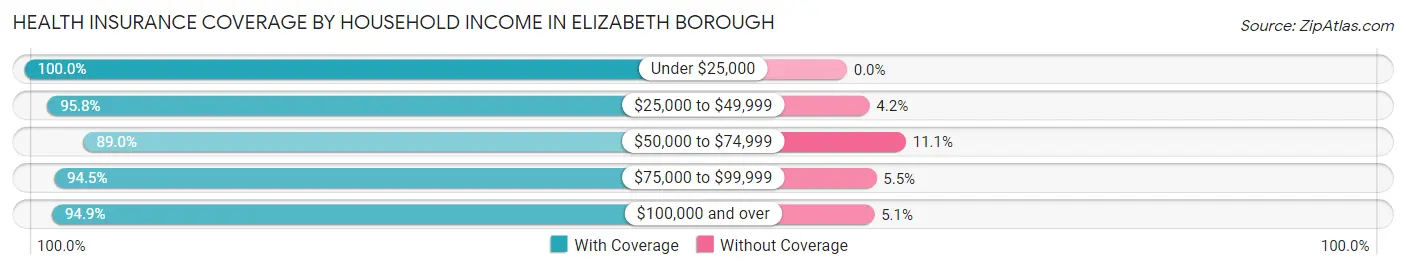
| Household Income | With Coverage | Without Coverage |
| Under $25,000 | 249 (100.0%) | 0 (0.0%) |
| $25,000 to $49,999 | 407 (95.8%) | 18 (4.2%) |
| $50,000 to $74,999 | 153 (88.9%) | 19 (11.1%) |
| $75,000 to $99,999 | 205 (94.5%) | 12 (5.5%) |
| $100,000 and over | 351 (94.9%) | 19 (5.1%) |
Public vs Private Health Insurance Coverage by Age in Elizabeth borough
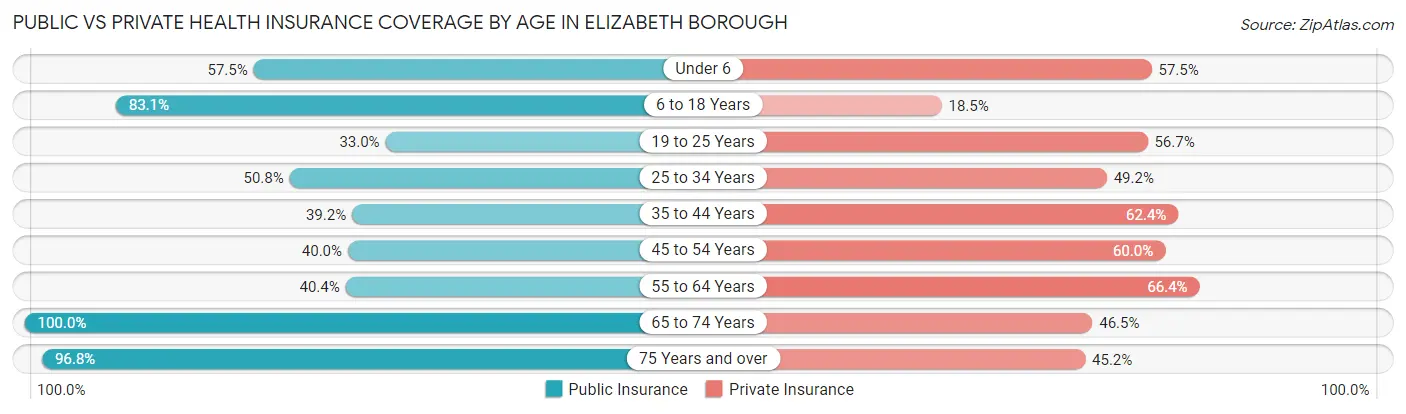
| Age Bracket | Public Insurance | Private Insurance |
| Under 6 | 46 (57.5%) | 46 (57.5%) |
| 6 to 18 Years | 157 (83.1%) | 35 (18.5%) |
| 19 to 25 Years | 71 (33.0%) | 122 (56.7%) |
| 25 to 34 Years | 93 (50.8%) | 90 (49.2%) |
| 35 to 44 Years | 71 (39.2%) | 113 (62.4%) |
| 45 to 54 Years | 40 (40.0%) | 60 (60.0%) |
| 55 to 64 Years | 95 (40.4%) | 156 (66.4%) |
| 65 to 74 Years | 157 (100.0%) | 73 (46.5%) |
| 75 Years and over | 90 (96.8%) | 42 (45.2%) |
| Total | 820 (57.2%) | 737 (51.4%) |
Disability Status by Sex by Age in Elizabeth borough
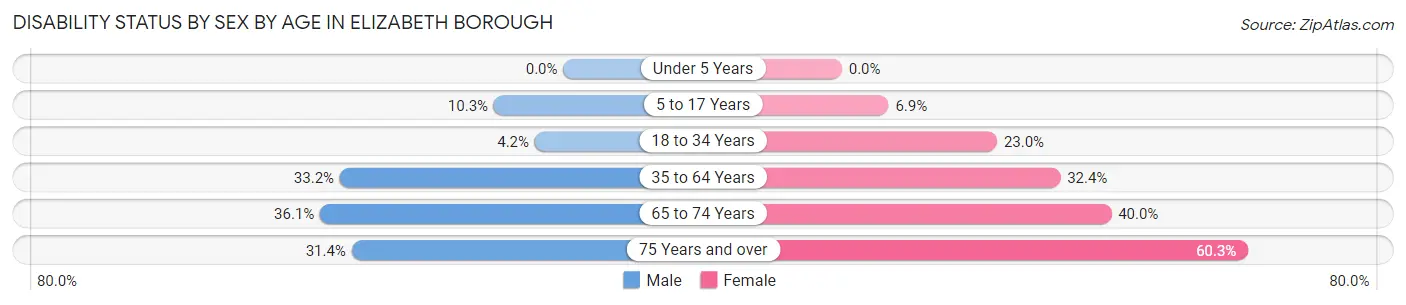
| Age Bracket | Male | Female |
| Under 5 Years | 0 (0.0%) | 0 (0.0%) |
| 5 to 17 Years | 10 (10.3%) | 7 (6.9%) |
| 18 to 34 Years | 9 (4.2%) | 44 (23.0%) |
| 35 to 64 Years | 73 (33.2%) | 96 (32.4%) |
| 65 to 74 Years | 26 (36.1%) | 34 (40.0%) |
| 75 Years and over | 11 (31.4%) | 35 (60.3%) |
Disability Class by Sex by Age in Elizabeth borough
Disability Class: Hearing Difficulty
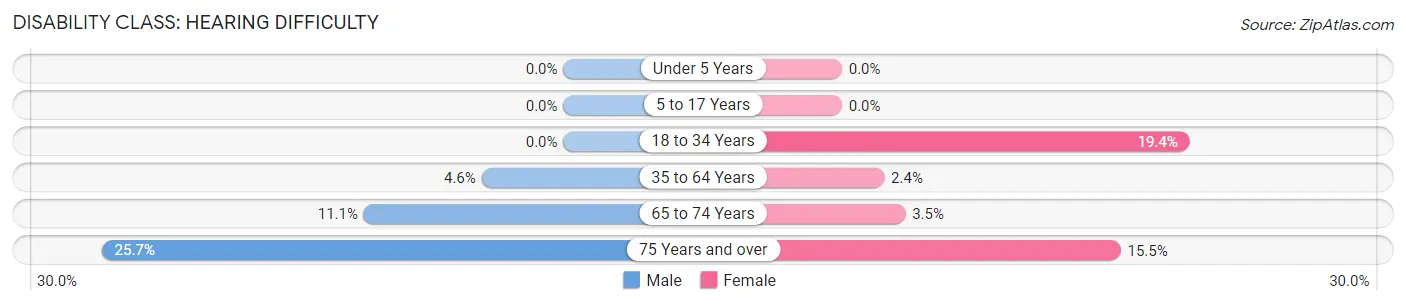
| Age Bracket | Male | Female |
| Under 5 Years | 0 (0.0%) | 0 (0.0%) |
| 5 to 17 Years | 0 (0.0%) | 0 (0.0%) |
| 18 to 34 Years | 0 (0.0%) | 37 (19.4%) |
| 35 to 64 Years | 10 (4.5%) | 7 (2.4%) |
| 65 to 74 Years | 8 (11.1%) | 3 (3.5%) |
| 75 Years and over | 9 (25.7%) | 9 (15.5%) |
Disability Class: Vision Difficulty
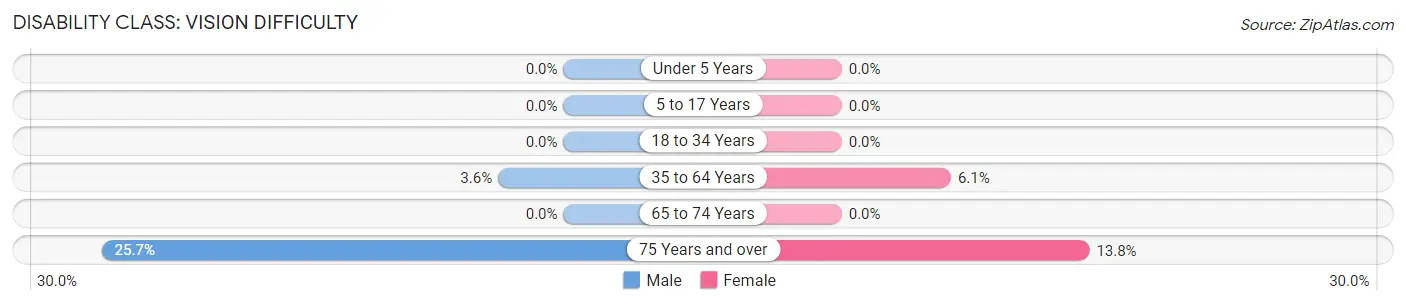
| Age Bracket | Male | Female |
| Under 5 Years | 0 (0.0%) | 0 (0.0%) |
| 5 to 17 Years | 0 (0.0%) | 0 (0.0%) |
| 18 to 34 Years | 0 (0.0%) | 0 (0.0%) |
| 35 to 64 Years | 8 (3.6%) | 18 (6.1%) |
| 65 to 74 Years | 0 (0.0%) | 0 (0.0%) |
| 75 Years and over | 9 (25.7%) | 8 (13.8%) |
Disability Class: Cognitive Difficulty
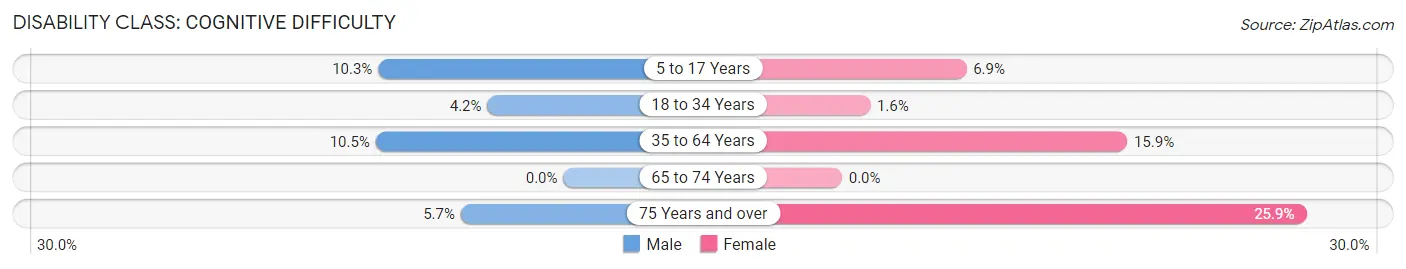
| Age Bracket | Male | Female |
| 5 to 17 Years | 10 (10.3%) | 7 (6.9%) |
| 18 to 34 Years | 9 (4.2%) | 3 (1.6%) |
| 35 to 64 Years | 23 (10.4%) | 47 (15.9%) |
| 65 to 74 Years | 0 (0.0%) | 0 (0.0%) |
| 75 Years and over | 2 (5.7%) | 15 (25.9%) |
Disability Class: Ambulatory Difficulty
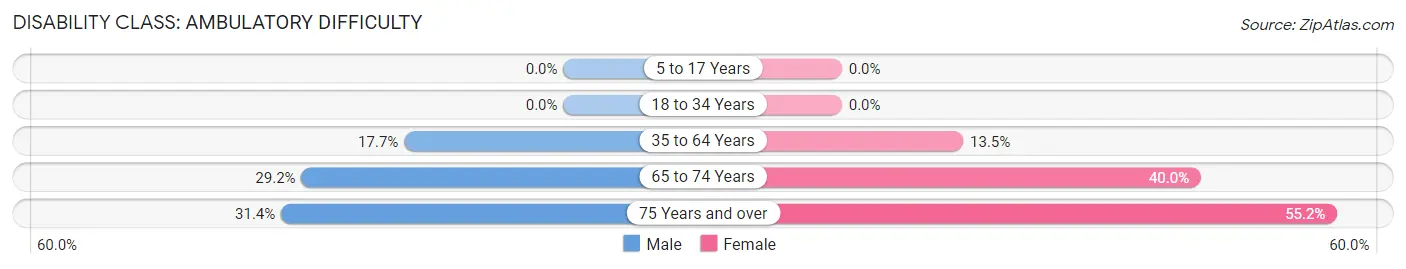
| Age Bracket | Male | Female |
| 5 to 17 Years | 0 (0.0%) | 0 (0.0%) |
| 18 to 34 Years | 0 (0.0%) | 0 (0.0%) |
| 35 to 64 Years | 39 (17.7%) | 40 (13.5%) |
| 65 to 74 Years | 21 (29.2%) | 34 (40.0%) |
| 75 Years and over | 11 (31.4%) | 32 (55.2%) |
Disability Class: Self-Care Difficulty
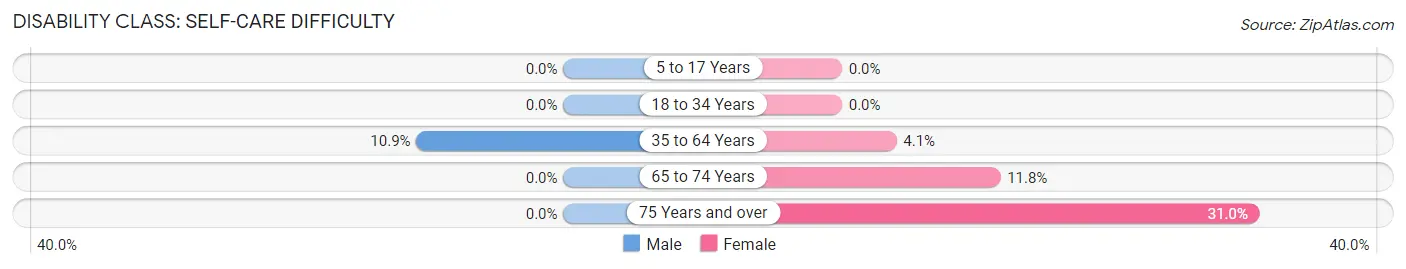
| Age Bracket | Male | Female |
| 5 to 17 Years | 0 (0.0%) | 0 (0.0%) |
| 18 to 34 Years | 0 (0.0%) | 0 (0.0%) |
| 35 to 64 Years | 24 (10.9%) | 12 (4.1%) |
| 65 to 74 Years | 0 (0.0%) | 10 (11.8%) |
| 75 Years and over | 0 (0.0%) | 18 (31.0%) |
Technology Access in Elizabeth borough
Computing Device Access in Elizabeth borough
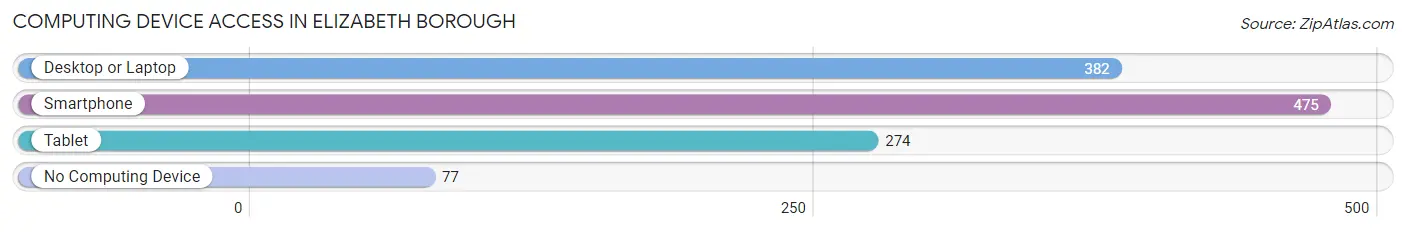
| Device Type | # Households | % Households |
| Desktop or Laptop | 382 | 63.1% |
| Smartphone | 475 | 78.5% |
| Tablet | 274 | 45.3% |
| No Computing Device | 77 | 12.7% |
| Total | 605 | 100.0% |
Internet Access in Elizabeth borough
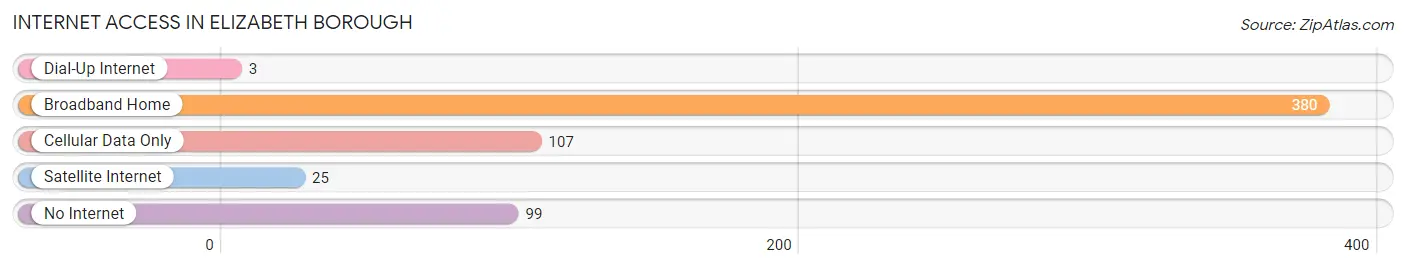
| Internet Type | # Households | % Households |
| Dial-Up Internet | 3 | 0.5% |
| Broadband Home | 380 | 62.8% |
| Cellular Data Only | 107 | 17.7% |
| Satellite Internet | 25 | 4.1% |
| No Internet | 99 | 16.4% |
| Total | 605 | 100.0% |
Elizabeth borough Summary
Borough of Elizabeth Pennsylvania
The Borough of Elizabeth, Pennsylvania is located in Allegheny County, Pennsylvania, approximately 20 miles southeast of Pittsburgh. The borough is situated along the Monongahela River and is part of the Pittsburgh metropolitan area. The borough was founded in 1842 and is home to a population of approximately 2,000 people.
History
The Borough of Elizabeth was founded in 1842 by a group of settlers from Elizabeth, New Jersey. The settlers were led by John B. Negley, who purchased the land from the local Native American tribes. The borough was named after Negley's wife, Elizabeth. The borough was incorporated in 1845 and was the first borough in Allegheny County.
The borough was an important stop on the Pennsylvania Canal, which connected Pittsburgh to Philadelphia. The canal was used to transport goods and passengers between the two cities. The canal was eventually replaced by the Pennsylvania Railroad in the late 19th century.
The borough was also home to several industries, including coal mining, steel production, and glass manufacturing. The borough was also home to several breweries, including the Elizabeth Brewing Company, which was founded in 1876.
Geography
The Borough of Elizabeth is located in Allegheny County, Pennsylvania, approximately 20 miles southeast of Pittsburgh. The borough is situated along the Monongahela River and is part of the Pittsburgh metropolitan area. The borough covers an area of 1.2 square miles and is bordered by the boroughs of West Elizabeth, North Versailles, and McKeesport.
The borough is located in the Allegheny Plateau region of Pennsylvania and is characterized by rolling hills and valleys. The borough is home to several parks, including the Elizabeth Borough Park, which features a playground, picnic area, and walking trails.
Economy
The economy of the Borough of Elizabeth is largely based on manufacturing and retail. The borough is home to several manufacturing companies, including the Elizabeth Steel Company, which produces steel products. The borough is also home to several retail stores, including the Elizabeth Mall, which features a variety of stores and restaurants.
The borough is also home to several small businesses, including restaurants, bars, and shops. The borough is also home to several banks, including the First National Bank of Elizabeth.
Demographics
As of the 2010 census, the Borough of Elizabeth had a population of 2,000 people. The racial makeup of the borough was 95.5% White, 1.5% African American, 0.5% Native American, 0.5% Asian, and 2.0% from other races. The median household income was $37,500 and the median family income was $45,000.
The borough is home to several churches, including the First Presbyterian Church of Elizabeth, which was founded in 1845. The borough is also home to several schools, including the Elizabeth Borough School District, which serves students in grades K-12.
Common Questions
What is Per Capita Income in Elizabeth borough?
Per Capita income in Elizabeth borough is $27,832.
What is the Median Family Income in Elizabeth borough?
Median Family Income in Elizabeth borough is $57,083.
What is the Median Household income in Elizabeth borough?
Median Household Income in Elizabeth borough is $45,324.
What is Income or Wage Gap in Elizabeth borough?
Income or Wage Gap in Elizabeth borough is 63.7%.
Women in Elizabeth borough earn 36.3 cents for every dollar earned by a man.
What is Family Income Deficit in Elizabeth borough?
Family Income Deficit in Elizabeth borough is $9,109.
Families that are below poverty line in Elizabeth borough earn $9,109 less on average than the poverty threshold level.
What is Inequality or Gini Index in Elizabeth borough?
Inequality or Gini Index in Elizabeth borough is 0.43.
What is the Total Population of Elizabeth borough?
Total Population of Elizabeth borough is 1,433.
What is the Total Male Population of Elizabeth borough?
Total Male Population of Elizabeth borough is 676.
What is the Total Female Population of Elizabeth borough?
Total Female Population of Elizabeth borough is 757.
What is the Ratio of Males per 100 Females in Elizabeth borough?
There are 89.30 Males per 100 Females in Elizabeth borough.
What is the Ratio of Females per 100 Males in Elizabeth borough?
There are 111.98 Females per 100 Males in Elizabeth borough.
What is the Median Population Age in Elizabeth borough?
Median Population Age in Elizabeth borough is 38.3 Years.
What is the Average Family Size in Elizabeth borough
Average Family Size in Elizabeth borough is 3.6 People.
What is the Average Household Size in Elizabeth borough
Average Household Size in Elizabeth borough is 2.4 People.
How Large is the Labor Force in Elizabeth borough?
There are 721 People in the Labor Forcein in Elizabeth borough.
What is the Percentage of People in the Labor Force in Elizabeth borough?
60.2% of People are in the Labor Force in Elizabeth borough.
What is the Unemployment Rate in Elizabeth borough?
Unemployment Rate in Elizabeth borough is 4.6%.