Inkerman, PA Map & Demographics
Inkerman Map
Inkerman Overview
$34,450
PER CAPITA INCOME
$50,956
AVG FAMILY INCOME
$39,324
AVG HOUSEHOLD INCOME
0.50
INEQUALITY / GINI INDEX
1,304
TOTAL POPULATION
292
MALE POPULATION
1,012
FEMALE POPULATION
28.85
MALES / 100 FEMALES
346.58
FEMALES / 100 MALES
65.2
MEDIAN AGE
2.4
AVG FAMILY SIZE
1.4
AVG HOUSEHOLD SIZE
366
LABOR FORCE [ PEOPLE ]
31.0%
PERCENT IN LABOR FORCE
5.7%
UNEMPLOYMENT RATE
Inkerman Area Codes
Income in Inkerman
Income Overview in Inkerman
Per Capita Income in Inkerman is $34,450, while median incomes of families and households are $50,956 and $39,324 respectively.
| Characteristic | Number | Measure |
| Per Capita Income | 1,304 | $34,450 |
| Median Family Income | 223 | $50,956 |
| Mean Family Income | 223 | $61,979 |
| Median Household Income | 770 | $39,324 |
| Mean Household Income | 770 | $52,631 |
| Income Deficit | 223 | $0 |
| Wage / Income Gap (%) | 1,304 | 0.00% |
| Wage / Income Gap ($) | 1,304 | 100.00¢ per $1 |
| Gini / Inequality Index | 1,304 | 0.50 |
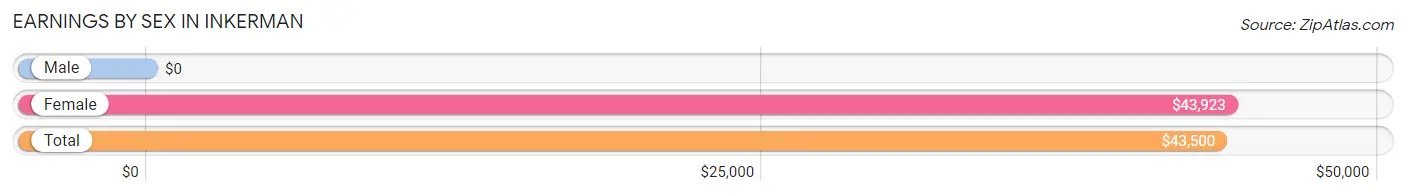
Earnings by Sex in Inkerman
| Sex | Number | Average Earnings |
| Male | 142 (38.8%) | $0 |
| Female | 224 (61.2%) | $43,923 |
| Total | 366 (100.0%) | $43,500 |
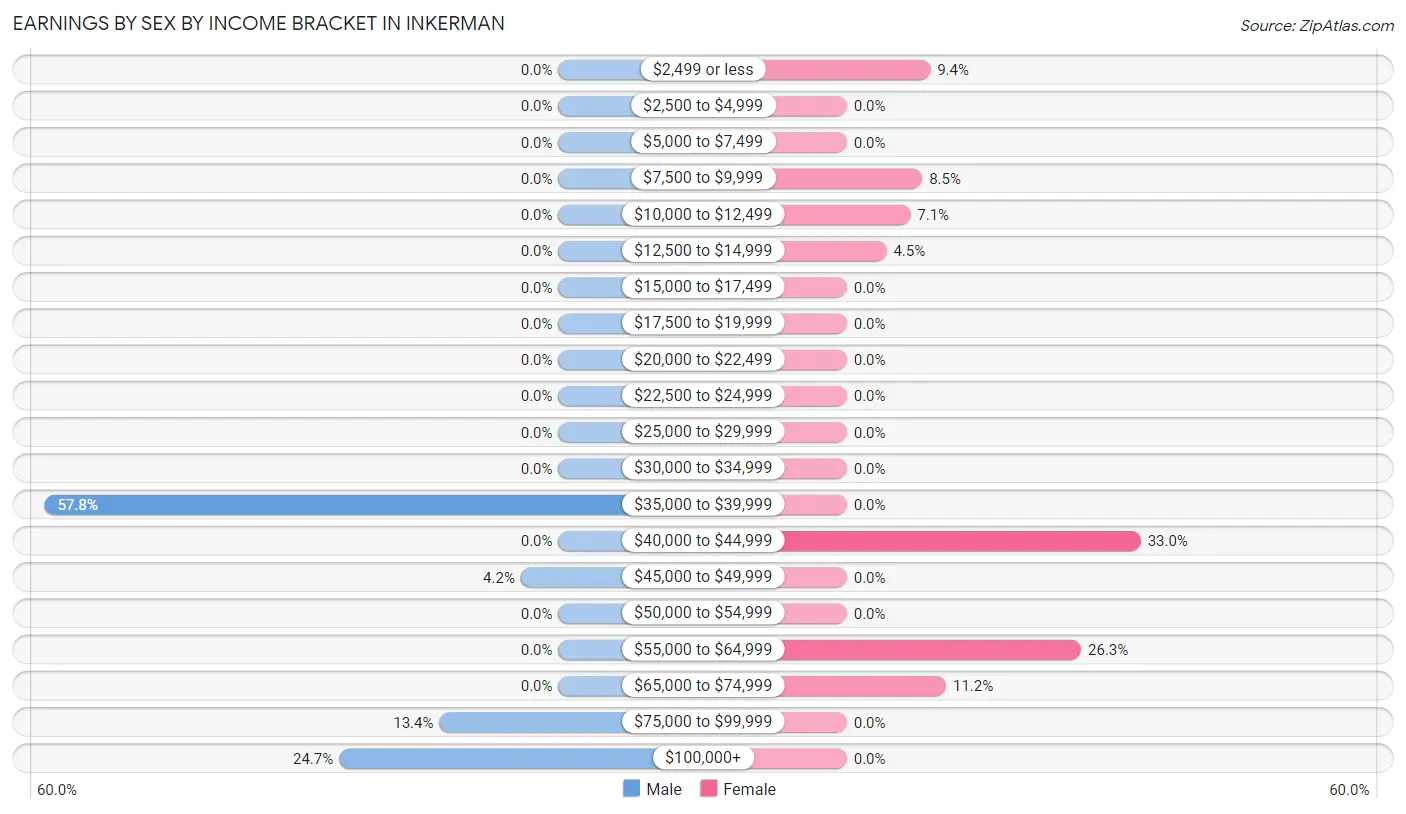
Earnings by Sex by Income Bracket in Inkerman
The most common earnings brackets in Inkerman are $35,000 to $39,999 for men (82 | 57.8%) and $40,000 to $44,999 for women (74 | 33.0%).
| Income | Male | Female |
| $2,499 or less | 0 (0.0%) | 21 (9.4%) |
| $2,500 to $4,999 | 0 (0.0%) | 0 (0.0%) |
| $5,000 to $7,499 | 0 (0.0%) | 0 (0.0%) |
| $7,500 to $9,999 | 0 (0.0%) | 19 (8.5%) |
| $10,000 to $12,499 | 0 (0.0%) | 16 (7.1%) |
| $12,500 to $14,999 | 0 (0.0%) | 10 (4.5%) |
| $15,000 to $17,499 | 0 (0.0%) | 0 (0.0%) |
| $17,500 to $19,999 | 0 (0.0%) | 0 (0.0%) |
| $20,000 to $22,499 | 0 (0.0%) | 0 (0.0%) |
| $22,500 to $24,999 | 0 (0.0%) | 0 (0.0%) |
| $25,000 to $29,999 | 0 (0.0%) | 0 (0.0%) |
| $30,000 to $34,999 | 0 (0.0%) | 0 (0.0%) |
| $35,000 to $39,999 | 82 (57.8%) | 0 (0.0%) |
| $40,000 to $44,999 | 0 (0.0%) | 74 (33.0%) |
| $45,000 to $49,999 | 6 (4.2%) | 0 (0.0%) |
| $50,000 to $54,999 | 0 (0.0%) | 0 (0.0%) |
| $55,000 to $64,999 | 0 (0.0%) | 59 (26.3%) |
| $65,000 to $74,999 | 0 (0.0%) | 25 (11.2%) |
| $75,000 to $99,999 | 19 (13.4%) | 0 (0.0%) |
| $100,000+ | 35 (24.6%) | 0 (0.0%) |
| Total | 142 (100.0%) | 224 (100.0%) |
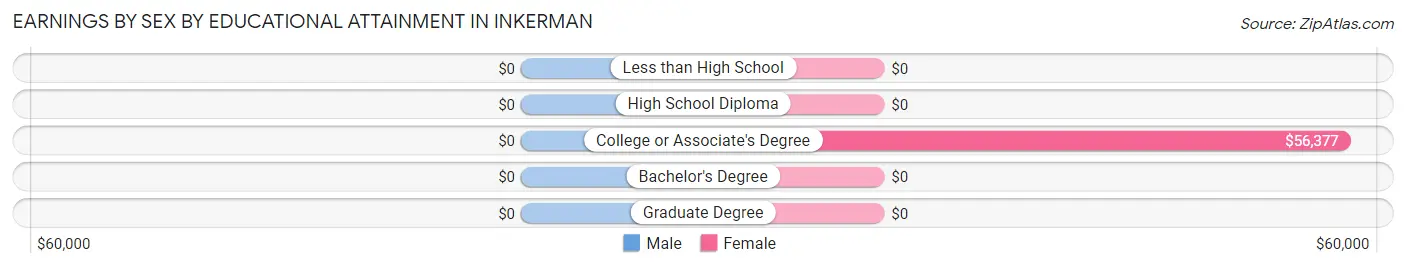
Earnings by Sex by Educational Attainment in Inkerman
| Educational Attainment | Male Income | Female Income |
| Less than High School | - | - |
| High School Diploma | - | - |
| College or Associate's Degree | - | - |
| Bachelor's Degree | - | - |
| Graduate Degree | - | - |
| Total | - | - |
Family Income in Inkerman
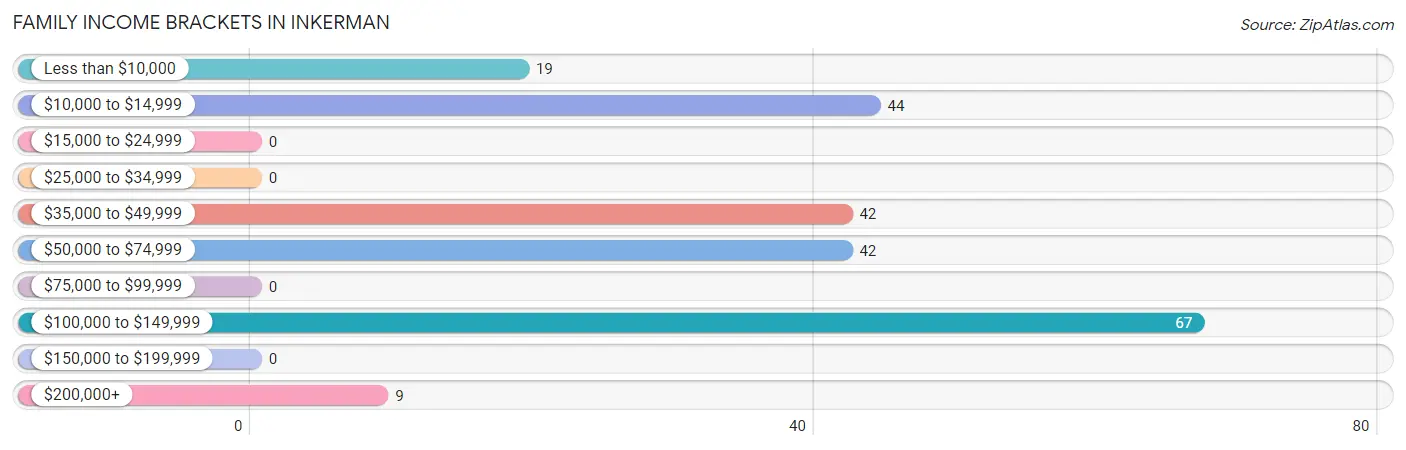
Family Income Brackets in Inkerman
According to the Inkerman family income data, there are 67 families falling into the $100,000 to $149,999 income range, which is the most common income bracket and makes up 30.0% of all families.
| Income Bracket | # Families | % Families |
| Less than $10,000 | 19 | 8.5% |
| $10,000 to $14,999 | 44 | 19.7% |
| $15,000 to $24,999 | 0 | 0.0% |
| $25,000 to $34,999 | 0 | 0.0% |
| $35,000 to $49,999 | 42 | 18.8% |
| $50,000 to $74,999 | 42 | 18.8% |
| $75,000 to $99,999 | 0 | 0.0% |
| $100,000 to $149,999 | 67 | 30.0% |
| $150,000 to $199,999 | 0 | 0.0% |
| $200,000+ | 9 | 4.0% |
Family Income by Famaliy Size in Inkerman
| Income Bracket | # Families | Median Income |
| 2-Person Families | 187 (83.9%) | $0 |
| 3-Person Families | 0 (0.0%) | $0 |
| 4-Person Families | 36 (16.1%) | $0 |
| 5-Person Families | 0 (0.0%) | $0 |
| 6-Person Families | 0 (0.0%) | $0 |
| 7+ Person Families | 0 (0.0%) | $0 |
| Total | 223 (100.0%) | $50,956 |
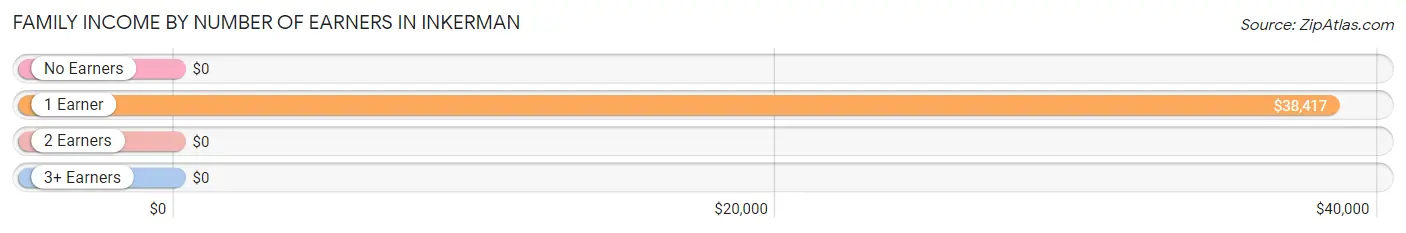
Family Income by Number of Earners in Inkerman
| Number of Earners | # Families | Median Income |
| No Earners | 52 (23.3%) | $0 |
| 1 Earner | 103 (46.2%) | $38,417 |
| 2 Earners | 59 (26.5%) | $0 |
| 3+ Earners | 9 (4.0%) | $0 |
| Total | 223 (100.0%) | $50,956 |
Household Income in Inkerman
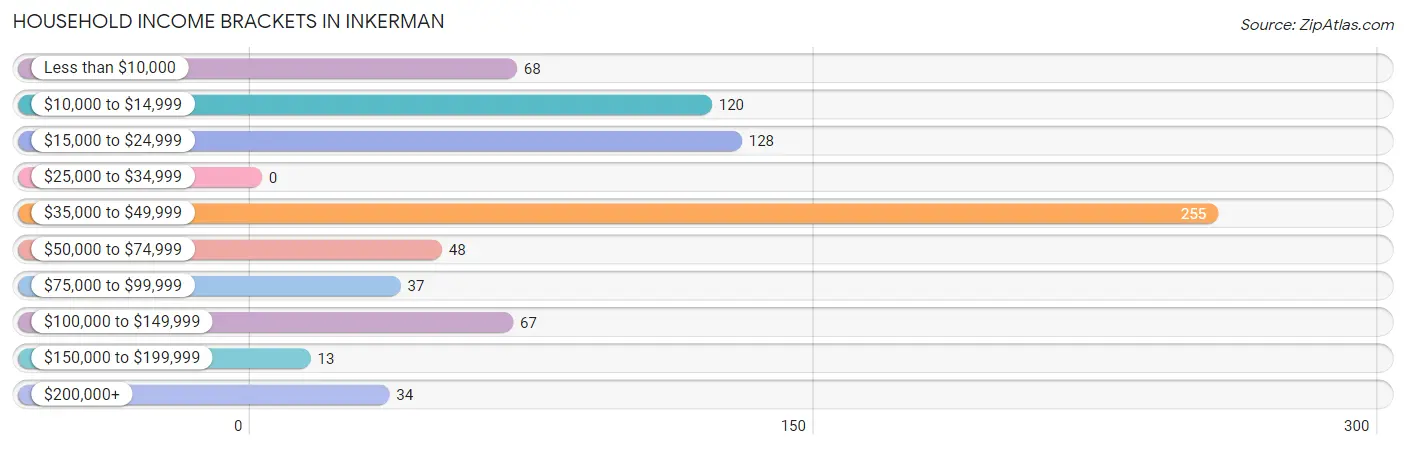
Household Income Brackets in Inkerman
With 255 households falling in the category, the $35,000 to $49,999 income range is the most frequent in Inkerman, accounting for 33.1% of all households.
| Income Bracket | # Households | % Households |
| Less than $10,000 | 68 | 8.8% |
| $10,000 to $14,999 | 120 | 15.6% |
| $15,000 to $24,999 | 128 | 16.6% |
| $25,000 to $34,999 | 0 | 0.0% |
| $35,000 to $49,999 | 255 | 33.1% |
| $50,000 to $74,999 | 48 | 6.2% |
| $75,000 to $99,999 | 37 | 4.8% |
| $100,000 to $149,999 | 67 | 8.7% |
| $150,000 to $199,999 | 13 | 1.7% |
| $200,000+ | 34 | 4.4% |
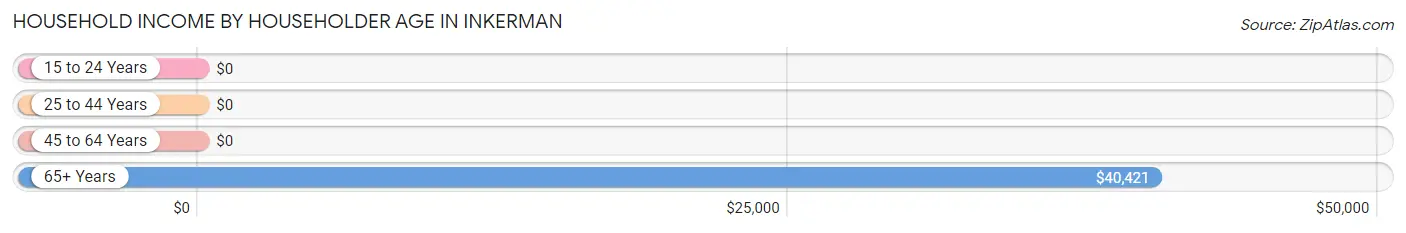
Household Income by Householder Age in Inkerman
The median household income in Inkerman is $39,324, with the highest median household income of $40,421 found in the 65+ years age bracket for the primary householder. A total of 446 households (57.9%) fall into this category. Meanwhile, the 15 to 24 years age bracket for the primary householder has the lowest median household income of $0, with 22 households (2.9%) in this group.
| Income Bracket | # Households | Median Income |
| 15 to 24 Years | 22 (2.9%) | $0 |
| 25 to 44 Years | 27 (3.5%) | $0 |
| 45 to 64 Years | 275 (35.7%) | $0 |
| 65+ Years | 446 (57.9%) | $40,421 |
| Total | 770 (100.0%) | $39,324 |
Poverty in Inkerman
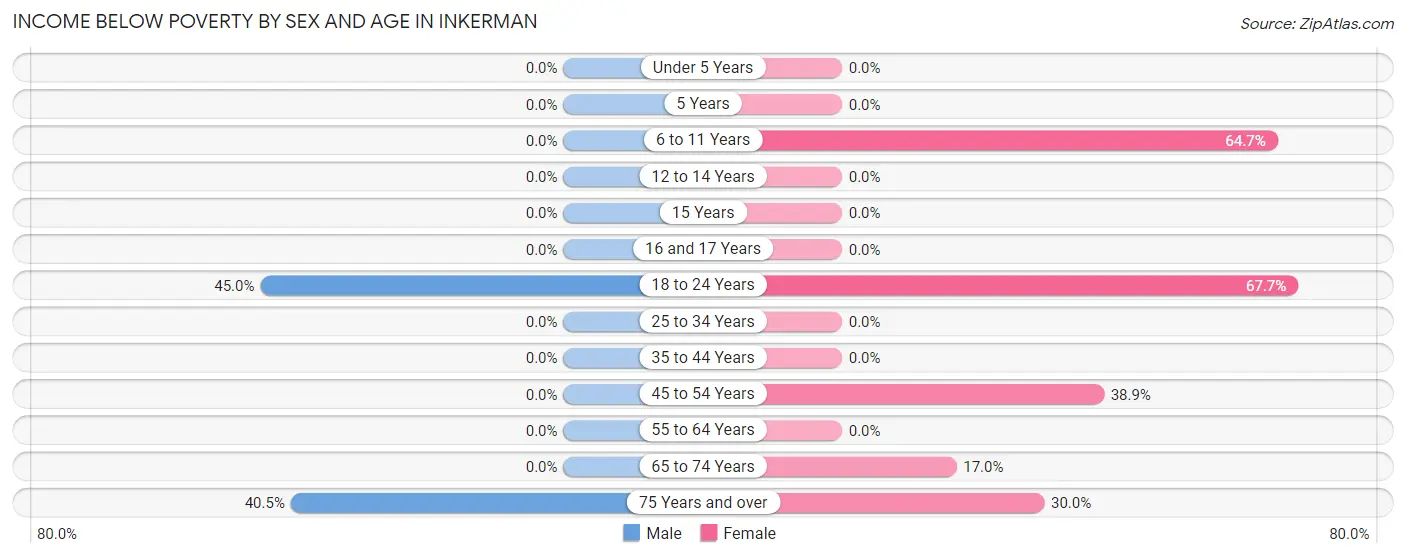
Income Below Poverty by Sex and Age in Inkerman
With 14.1% poverty level for males and 27.1% for females among the residents of Inkerman, 18 to 24 year old males and 18 to 24 year old females are the most vulnerable to poverty, with 18 males (45.0%) and 21 females (67.7%) in their respective age groups living below the poverty level.
| Age Bracket | Male | Female |
| Under 5 Years | 0 (0.0%) | 0 (0.0%) |
| 5 Years | 0 (0.0%) | 0 (0.0%) |
| 6 to 11 Years | 0 (0.0%) | 44 (64.7%) |
| 12 to 14 Years | 0 (0.0%) | 0 (0.0%) |
| 15 Years | 0 (0.0%) | 0 (0.0%) |
| 16 and 17 Years | 0 (0.0%) | 0 (0.0%) |
| 18 to 24 Years | 18 (45.0%) | 21 (67.7%) |
| 25 to 34 Years | 0 (0.0%) | 0 (0.0%) |
| 35 to 44 Years | 0 (0.0%) | 0 (0.0%) |
| 45 to 54 Years | 0 (0.0%) | 63 (38.9%) |
| 55 to 64 Years | 0 (0.0%) | 0 (0.0%) |
| 65 to 74 Years | 0 (0.0%) | 17 (17.0%) |
| 75 Years and over | 17 (40.5%) | 91 (30.0%) |
| Total | 35 (14.1%) | 236 (27.1%) |
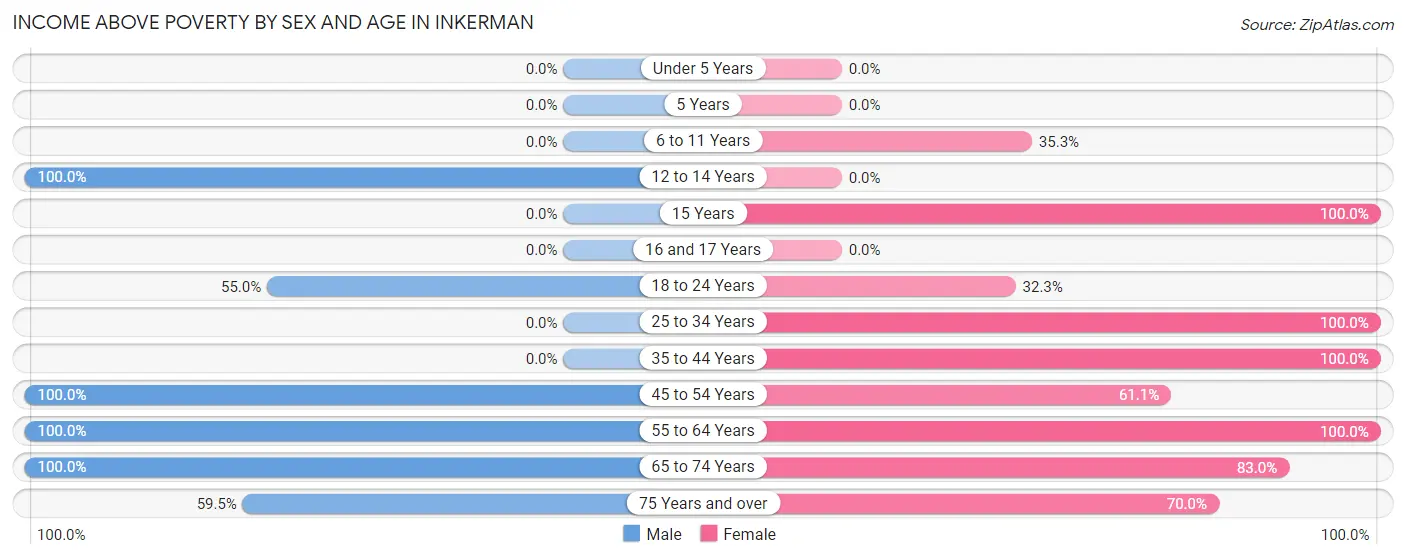
Income Above Poverty by Sex and Age in Inkerman
According to the poverty statistics in Inkerman, males aged 12 to 14 years and females aged 15 years are the age groups that are most secure financially, with 100.0% of males and 100.0% of females in these age groups living above the poverty line.
| Age Bracket | Male | Female |
| Under 5 Years | 0 (0.0%) | 0 (0.0%) |
| 5 Years | 0 (0.0%) | 0 (0.0%) |
| 6 to 11 Years | 0 (0.0%) | 24 (35.3%) |
| 12 to 14 Years | 27 (100.0%) | 0 (0.0%) |
| 15 Years | 0 (0.0%) | 28 (100.0%) |
| 16 and 17 Years | 0 (0.0%) | 0 (0.0%) |
| 18 to 24 Years | 22 (55.0%) | 10 (32.3%) |
| 25 to 34 Years | 0 (0.0%) | 65 (100.0%) |
| 35 to 44 Years | 0 (0.0%) | 27 (100.0%) |
| 45 to 54 Years | 69 (100.0%) | 99 (61.1%) |
| 55 to 64 Years | 34 (100.0%) | 88 (100.0%) |
| 65 to 74 Years | 36 (100.0%) | 83 (83.0%) |
| 75 Years and over | 25 (59.5%) | 212 (70.0%) |
| Total | 213 (85.9%) | 636 (72.9%) |
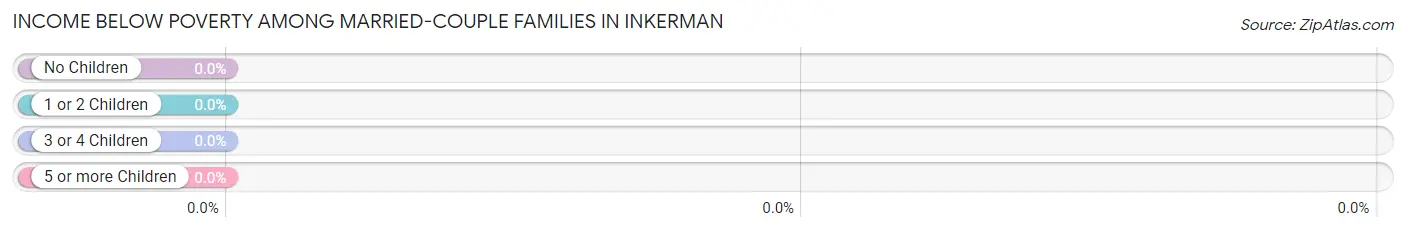
Income Below Poverty Among Married-Couple Families in Inkerman
| Children | Above Poverty | Below Poverty |
| No Children | 49 (100.0%) | 0 (0.0%) |
| 1 or 2 Children | 27 (100.0%) | 0 (0.0%) |
| 3 or 4 Children | 0 (0.0%) | 0 (0.0%) |
| 5 or more Children | 0 (0.0%) | 0 (0.0%) |
| Total | 76 (100.0%) | 0 (0.0%) |
Income Below Poverty Among Single-Parent Households in Inkerman
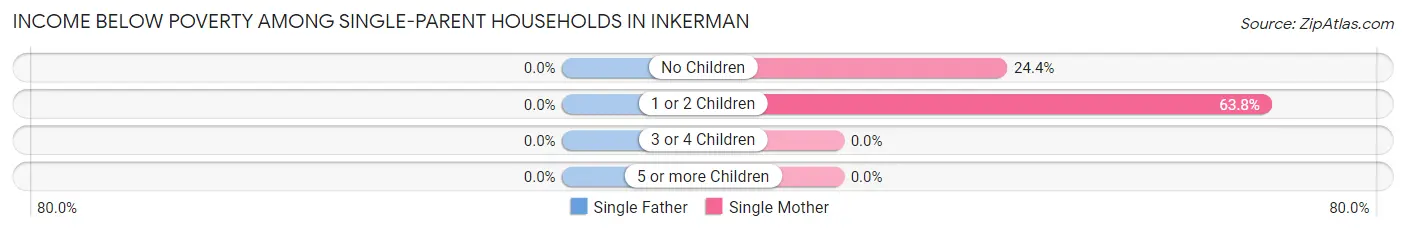
| Children | Single Father | Single Mother |
| No Children | 0 (0.0%) | 19 (24.4%) |
| 1 or 2 Children | 0 (0.0%) | 44 (63.8%) |
| 3 or 4 Children | 0 (0.0%) | 0 (0.0%) |
| 5 or more Children | 0 (0.0%) | 0 (0.0%) |
| Total | 0 (0.0%) | 63 (42.9%) |
Income Below Poverty Among Married-Couple vs Single-Parent Households in Inkerman
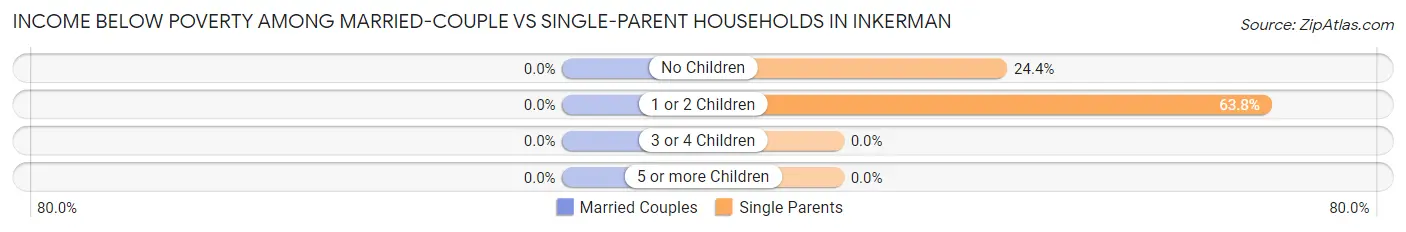
| Children | Married-Couple Families | Single-Parent Households |
| No Children | 0 (0.0%) | 19 (24.4%) |
| 1 or 2 Children | 0 (0.0%) | 44 (63.8%) |
| 3 or 4 Children | 0 (0.0%) | 0 (0.0%) |
| 5 or more Children | 0 (0.0%) | 0 (0.0%) |
| Total | 0 (0.0%) | 63 (42.9%) |
Race in Inkerman
The most populous races in Inkerman are White / Caucasian (1,286 | 98.6%), and Two or more Races (18 | 1.4%).
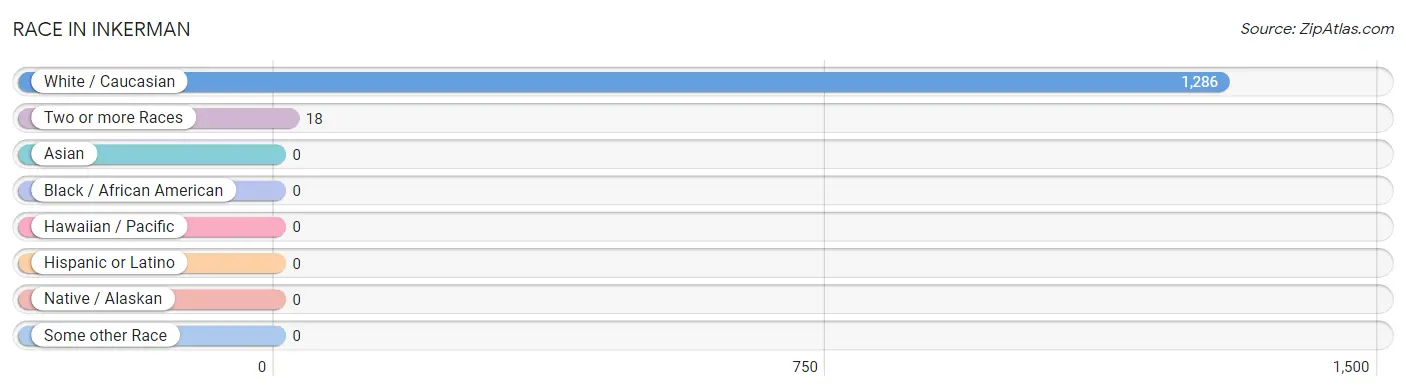
| Race | # Population | % Population |
| Asian | 0 | 0.0% |
| Black / African American | 0 | 0.0% |
| Hawaiian / Pacific | 0 | 0.0% |
| Hispanic or Latino | 0 | 0.0% |
| Native / Alaskan | 0 | 0.0% |
| White / Caucasian | 1,286 | 98.6% |
| Two or more Races | 18 | 1.4% |
| Some other Race | 0 | 0.0% |
| Total | 1,304 | 100.0% |
Ancestry in Inkerman
The most populous ancestries reported in Inkerman are Irish (344 | 26.4%), Italian (294 | 22.6%), German (258 | 19.8%), Polish (142 | 10.9%), and Arab (88 | 6.8%), together accounting for 86.4% of all Inkerman residents.
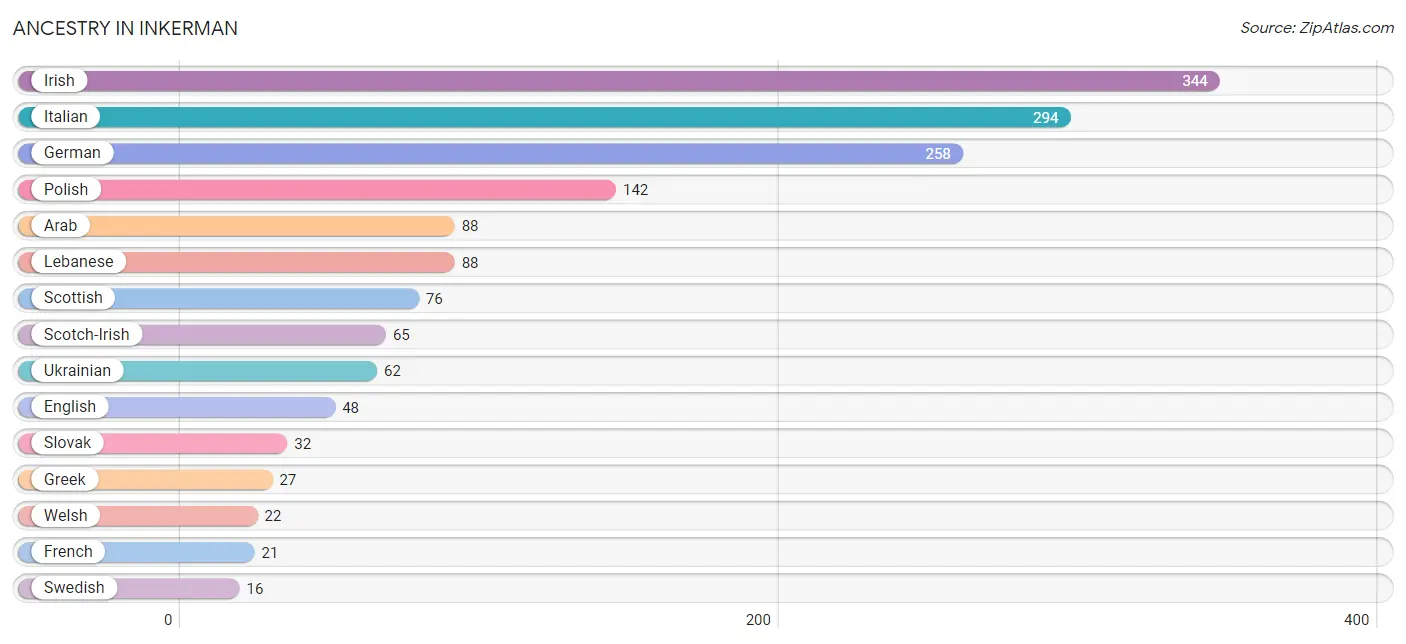
| Ancestry | # Population | % Population |
| American | 6 | 0.5% |
| Arab | 88 | 6.8% |
| Dutch | 15 | 1.1% |
| English | 48 | 3.7% |
| French | 21 | 1.6% |
| German | 258 | 19.8% |
| Greek | 27 | 2.1% |
| Irish | 344 | 26.4% |
| Italian | 294 | 22.6% |
| Lebanese | 88 | 6.8% |
| Lithuanian | 9 | 0.7% |
| Norwegian | 6 | 0.5% |
| Polish | 142 | 10.9% |
| Scotch-Irish | 65 | 5.0% |
| Scottish | 76 | 5.8% |
| Slovak | 32 | 2.5% |
| Swedish | 16 | 1.2% |
| Ukrainian | 62 | 4.8% |
| Welsh | 22 | 1.7% | View All 19 Rows |
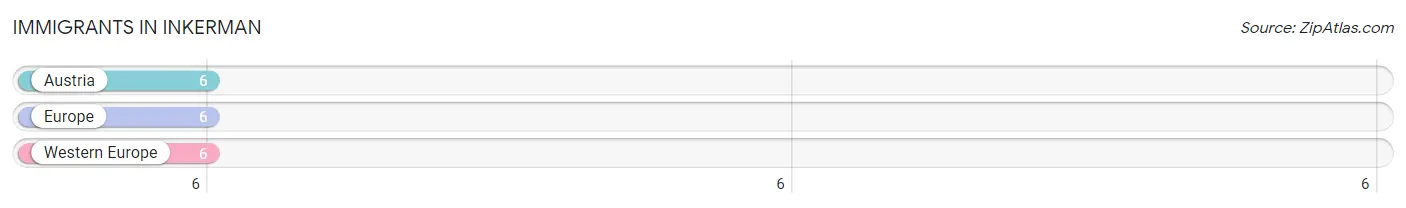
Immigrants in Inkerman
The most numerous immigrant groups reported in Inkerman came from Austria (6 | 0.5%), Europe (6 | 0.5%), and Western Europe (6 | 0.5%), together accounting for 1.4% of all Inkerman residents.
| Immigration Origin | # Population | % Population |
| Austria | 6 | 0.5% |
| Europe | 6 | 0.5% |
| Western Europe | 6 | 0.5% | View All 3 Rows |
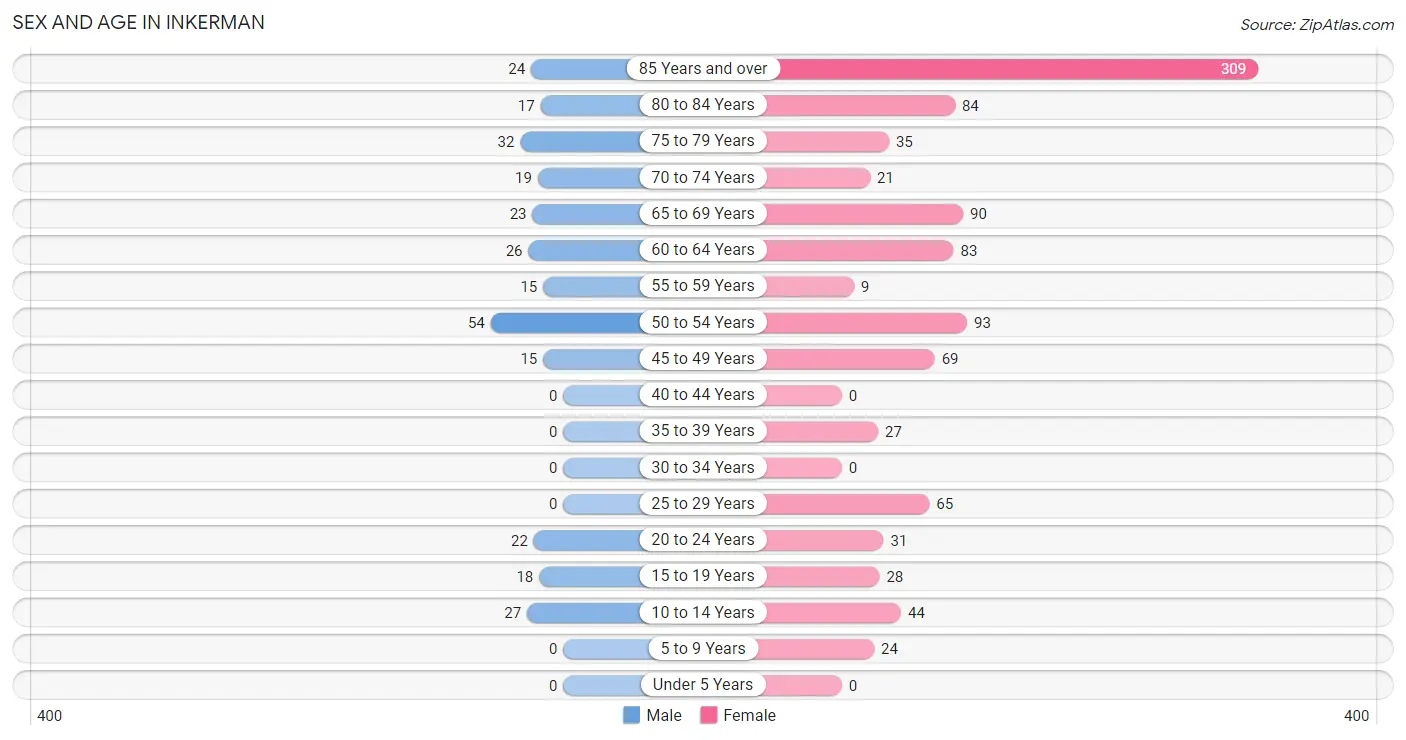
Sex and Age in Inkerman
Sex and Age in Inkerman
The most populous age groups in Inkerman are 50 to 54 Years (54 | 18.5%) for men and 85 Years and over (309 | 30.5%) for women.
| Age Bracket | Male | Female |
| Under 5 Years | 0 (0.0%) | 0 (0.0%) |
| 5 to 9 Years | 0 (0.0%) | 24 (2.4%) |
| 10 to 14 Years | 27 (9.2%) | 44 (4.3%) |
| 15 to 19 Years | 18 (6.2%) | 28 (2.8%) |
| 20 to 24 Years | 22 (7.5%) | 31 (3.1%) |
| 25 to 29 Years | 0 (0.0%) | 65 (6.4%) |
| 30 to 34 Years | 0 (0.0%) | 0 (0.0%) |
| 35 to 39 Years | 0 (0.0%) | 27 (2.7%) |
| 40 to 44 Years | 0 (0.0%) | 0 (0.0%) |
| 45 to 49 Years | 15 (5.1%) | 69 (6.8%) |
| 50 to 54 Years | 54 (18.5%) | 93 (9.2%) |
| 55 to 59 Years | 15 (5.1%) | 9 (0.9%) |
| 60 to 64 Years | 26 (8.9%) | 83 (8.2%) |
| 65 to 69 Years | 23 (7.9%) | 90 (8.9%) |
| 70 to 74 Years | 19 (6.5%) | 21 (2.1%) |
| 75 to 79 Years | 32 (11.0%) | 35 (3.5%) |
| 80 to 84 Years | 17 (5.8%) | 84 (8.3%) |
| 85 Years and over | 24 (8.2%) | 309 (30.5%) |
| Total | 292 (100.0%) | 1,012 (100.0%) |
Families and Households in Inkerman
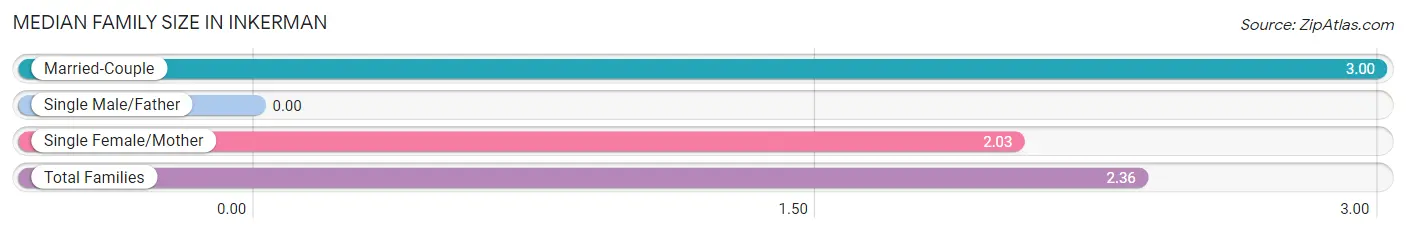
Median Family Size in Inkerman
| Family Type | # Families | Family Size |
| Married-Couple | 76 (34.1%) | 3.00 |
| Single Male/Father | 0 (0.0%) | - |
| Single Female/Mother | 147 (65.9%) | 2.03 |
| Total Families | 223 (100.0%) | 2.36 |
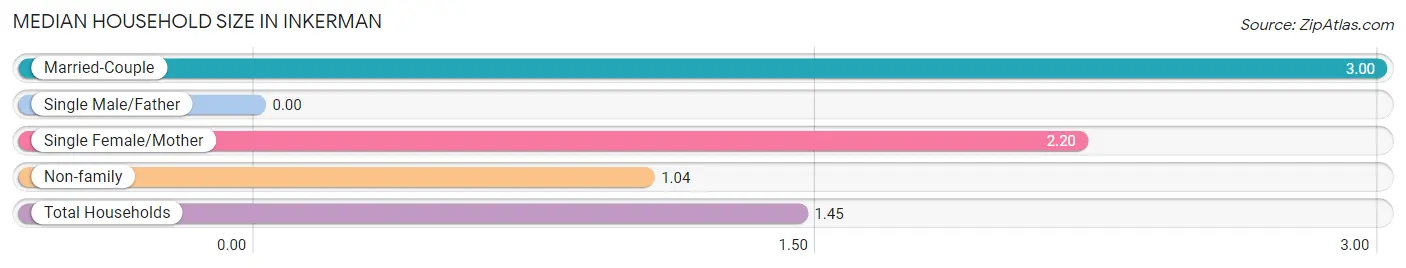
Median Household Size in Inkerman
| Household Type | # Households | Household Size |
| Married-Couple | 76 (9.9%) | 3.00 |
| Single Male/Father | 0 (0.0%) | - |
| Single Female/Mother | 147 (19.1%) | 2.20 |
| Non-family | 547 (71.0%) | 1.04 |
| Total Households | 770 (100.0%) | 1.45 |
Household Size by Marriage Status in Inkerman
Out of a total of 770 households in Inkerman, 223 (29.0%) are family households, while 547 (71.0%) are nonfamily households. The most numerous type of family households are 2-person households, comprising 162, and the most common type of nonfamily households are 1-person households, comprising 525.
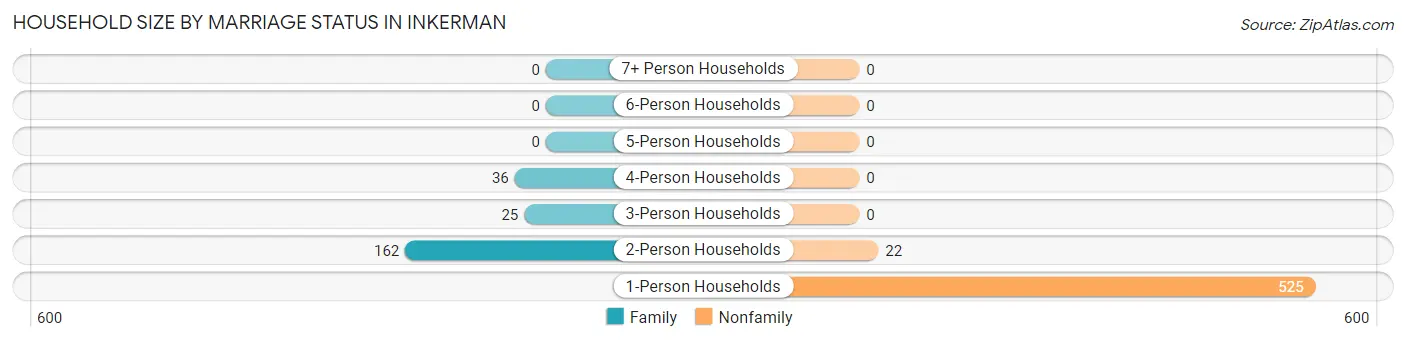
| Household Size | Family Households | Nonfamily Households |
| 1-Person Households | - | 525 (68.2%) |
| 2-Person Households | 162 (21.0%) | 22 (2.9%) |
| 3-Person Households | 25 (3.3%) | 0 (0.0%) |
| 4-Person Households | 36 (4.7%) | 0 (0.0%) |
| 5-Person Households | 0 (0.0%) | 0 (0.0%) |
| 6-Person Households | 0 (0.0%) | 0 (0.0%) |
| 7+ Person Households | 0 (0.0%) | 0 (0.0%) |
| Total | 223 (29.0%) | 547 (71.0%) |
Female Fertility in Inkerman
Fertility by Age in Inkerman
| Age Bracket | Women with Births | Births / 1,000 Women |
| 15 to 19 years | 0 (0.0%) | 0.0 |
| 20 to 34 years | 0 (0.0%) | 0.0 |
| 35 to 50 years | 0 (0.0%) | 0.0 |
| Total | 0 (0.0%) | 0.0 |
Fertility by Age by Marriage Status in Inkerman
| Age Bracket | Married | Unmarried |
| 15 to 19 years | 0 (0.0%) | 0 (0.0%) |
| 20 to 34 years | 0 (0.0%) | 0 (0.0%) |
| 35 to 50 years | 0 (0.0%) | 0 (0.0%) |
| Total | 0 (0.0%) | 0 (0.0%) |
Fertility by Education in Inkerman
| Educational Attainment | Women with Births | Births / 1,000 Women |
| Less than High School | 0 (0.0%) | 0.0 |
| High School Diploma | 0 (0.0%) | 0.0 |
| College or Associate's Degree | 0 (0.0%) | 0.0 |
| Bachelor's Degree | 0 (0.0%) | 0.0 |
| Graduate Degree | 0 (0.0%) | 0.0 |
| Total | 0 (0.0%) | 0.0 |
Fertility by Education by Marriage Status in Inkerman
| Educational Attainment | Married | Unmarried |
| Less than High School | 0 (0.0%) | 0 (0.0%) |
| High School Diploma | 0 (0.0%) | 0 (0.0%) |
| College or Associate's Degree | 0 (0.0%) | 0 (0.0%) |
| Bachelor's Degree | 0 (0.0%) | 0 (0.0%) |
| Graduate Degree | 0 (0.0%) | 0 (0.0%) |
| Total | 0 (0.0%) | 0 (0.0%) |
Employment Characteristics in Inkerman
Employment by Class of Employer in Inkerman
Among the 345 employed individuals in Inkerman, private company employees (263 | 76.2%), self-employed (not incorporated) (28 | 8.1%), and not-for-profit organizations (28 | 8.1%) make up the most common classes of employment.
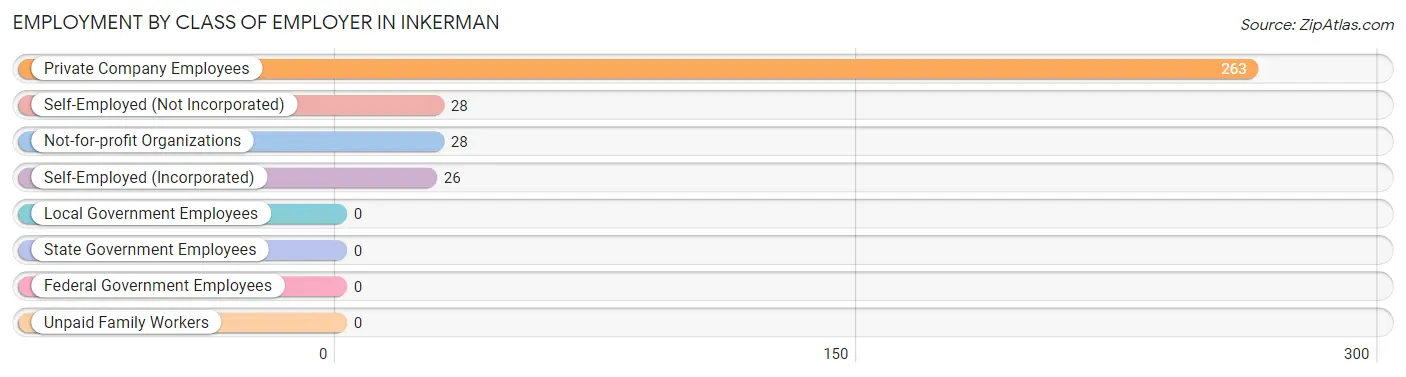
| Employer Class | # Employees | % Employees |
| Private Company Employees | 263 | 76.2% |
| Self-Employed (Incorporated) | 26 | 7.5% |
| Self-Employed (Not Incorporated) | 28 | 8.1% |
| Not-for-profit Organizations | 28 | 8.1% |
| Local Government Employees | 0 | 0.0% |
| State Government Employees | 0 | 0.0% |
| Federal Government Employees | 0 | 0.0% |
| Unpaid Family Workers | 0 | 0.0% |
| Total | 345 | 100.0% |
Employment Status by Age in Inkerman
According to the labor force statistics for Inkerman, out of the total population over 16 years of age (1,181), 31.0% or 366 individuals are in the labor force, with 5.7% or 21 of them unemployed. The age group with the highest labor force participation rate is 20 to 24 years, with 100.0% or 53 individuals in the labor force. Within the labor force, the 20 to 24 years age range has the highest percentage of unemployed individuals, with 39.6% or 21 of them being unemployed.
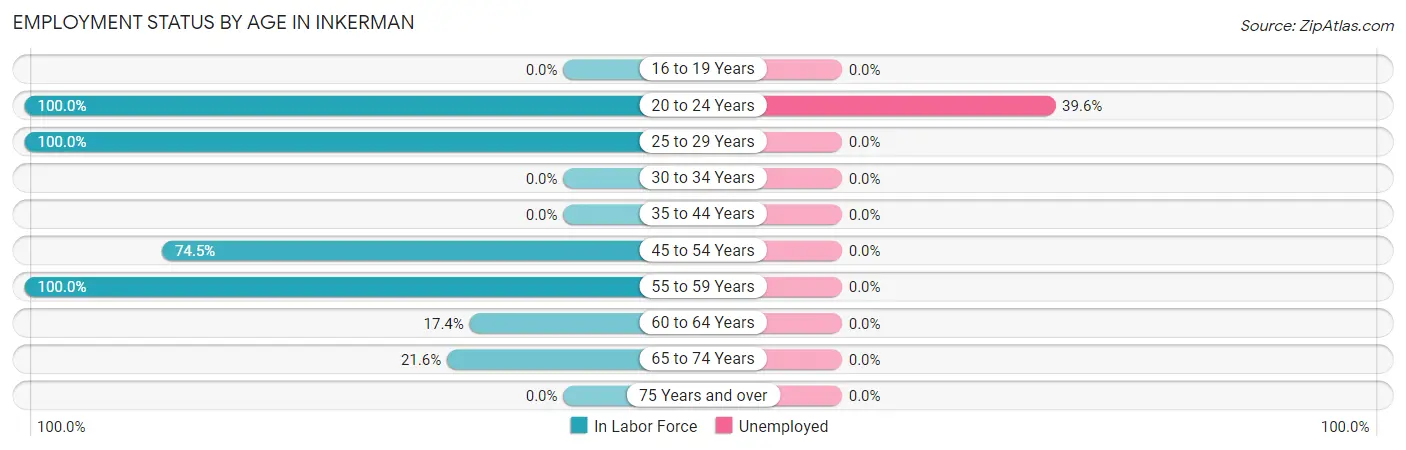
| Age Bracket | In Labor Force | Unemployed |
| 16 to 19 Years | 0 (0.0%) | 0 (0.0%) |
| 20 to 24 Years | 53 (100.0%) | 21 (39.6%) |
| 25 to 29 Years | 65 (100.0%) | 0 (0.0%) |
| 30 to 34 Years | 0 (0.0%) | 0 (0.0%) |
| 35 to 44 Years | 0 (0.0%) | 0 (0.0%) |
| 45 to 54 Years | 172 (74.5%) | 0 (0.0%) |
| 55 to 59 Years | 24 (100.0%) | 0 (0.0%) |
| 60 to 64 Years | 19 (17.4%) | 0 (0.0%) |
| 65 to 74 Years | 33 (21.6%) | 0 (0.0%) |
| 75 Years and over | 0 (0.0%) | 0 (0.0%) |
| Total | 366 (31.0%) | 21 (5.7%) |
Employment Status by Educational Attainment in Inkerman
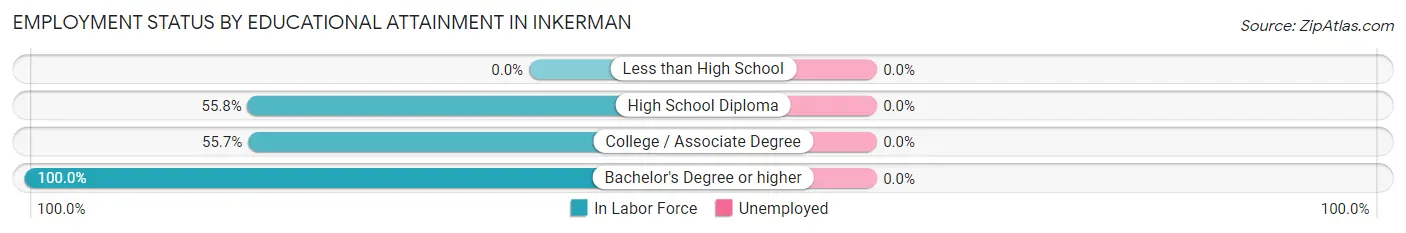
| Educational Attainment | In Labor Force | Unemployed |
| Less than High School | 0 (0.0%) | 0 (0.0%) |
| High School Diploma | 24 (55.8%) | 0 (0.0%) |
| College / Associate Degree | 176 (55.7%) | 0 (0.0%) |
| Bachelor's Degree or higher | 80 (100.0%) | 0 (0.0%) |
| Total | 280 (61.4%) | 0 (0.0%) |
Employment Occupations by Sex in Inkerman
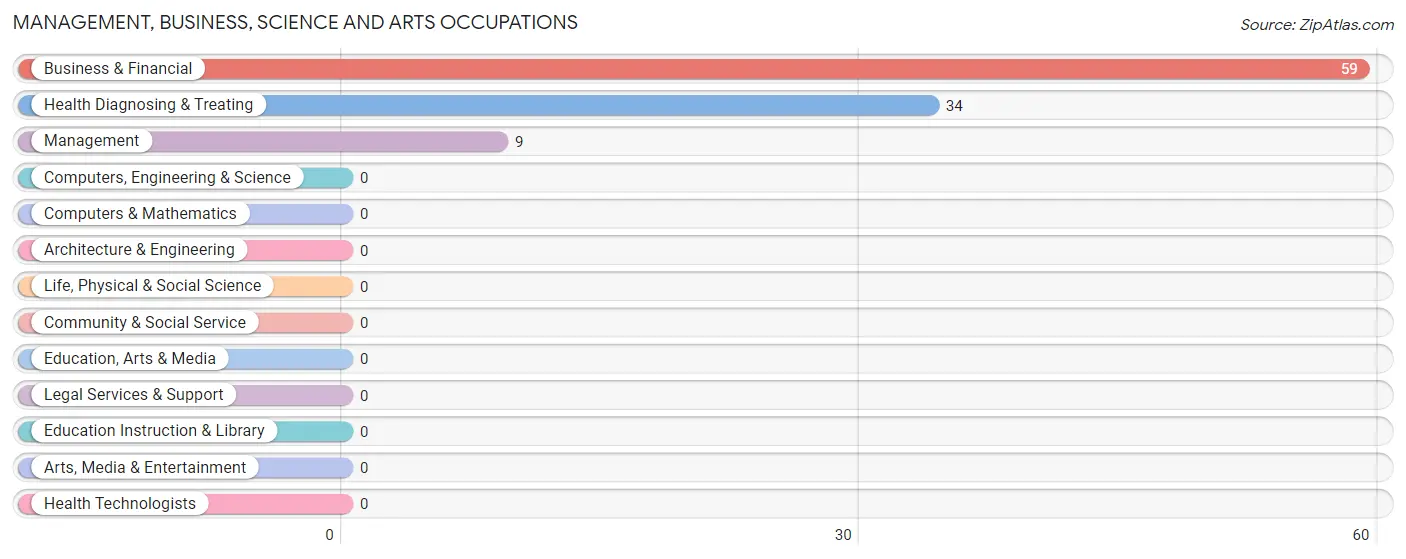
Management, Business, Science and Arts Occupations
The most common Management, Business, Science and Arts occupations in Inkerman are Business & Financial (59 | 17.1%), Health Diagnosing & Treating (34 | 9.9%), and Management (9 | 2.6%).
Management, Business, Science and Arts Occupations by Sex
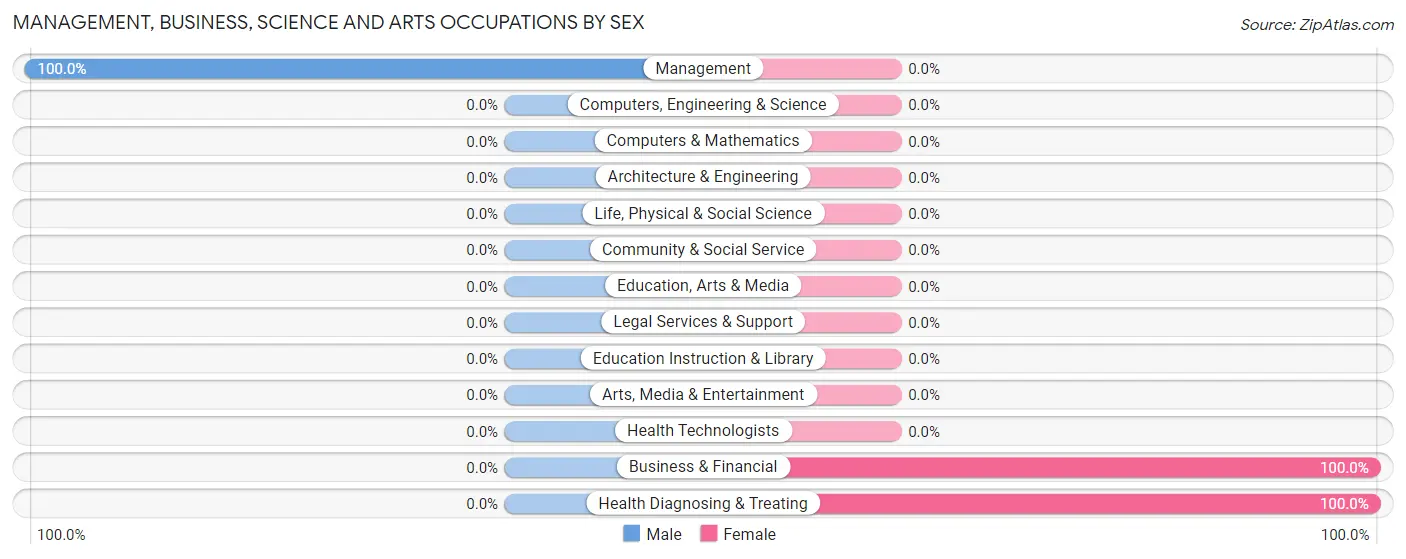
| Occupation | Male | Female |
| Management | 9 (100.0%) | 0 (0.0%) |
| Business & Financial | 0 (0.0%) | 59 (100.0%) |
| Computers, Engineering & Science | 0 (0.0%) | 0 (0.0%) |
| Computers & Mathematics | 0 (0.0%) | 0 (0.0%) |
| Architecture & Engineering | 0 (0.0%) | 0 (0.0%) |
| Life, Physical & Social Science | 0 (0.0%) | 0 (0.0%) |
| Community & Social Service | 0 (0.0%) | 0 (0.0%) |
| Education, Arts & Media | 0 (0.0%) | 0 (0.0%) |
| Legal Services & Support | 0 (0.0%) | 0 (0.0%) |
| Education Instruction & Library | 0 (0.0%) | 0 (0.0%) |
| Arts, Media & Entertainment | 0 (0.0%) | 0 (0.0%) |
| Health Diagnosing & Treating | 0 (0.0%) | 34 (100.0%) |
| Health Technologists | 0 (0.0%) | 0 (0.0%) |
| Total (Category) | 9 (8.8%) | 93 (91.2%) |
| Total (Overall) | 142 (41.2%) | 203 (58.8%) |
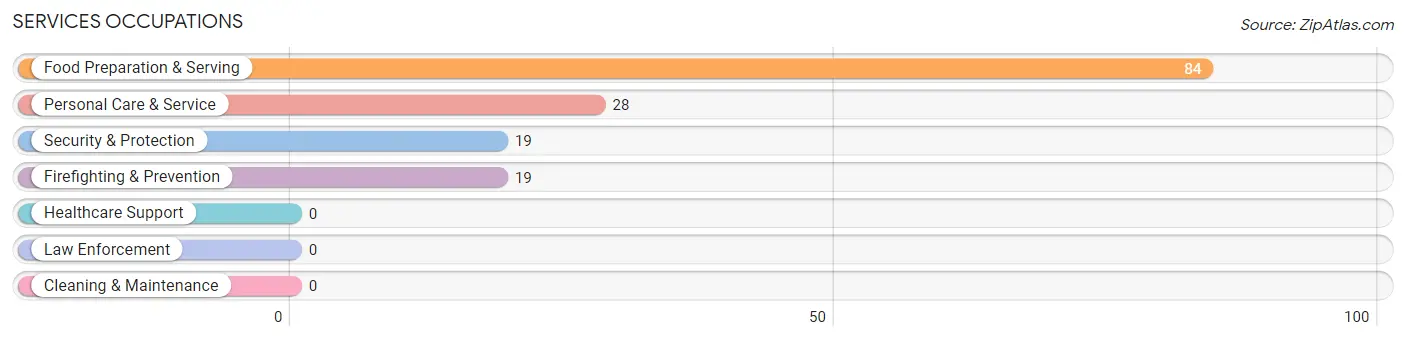
Services Occupations
The most common Services occupations in Inkerman are Food Preparation & Serving (84 | 24.3%), Personal Care & Service (28 | 8.1%), Security & Protection (19 | 5.5%), and Firefighting & Prevention (19 | 5.5%).
Services Occupations by Sex
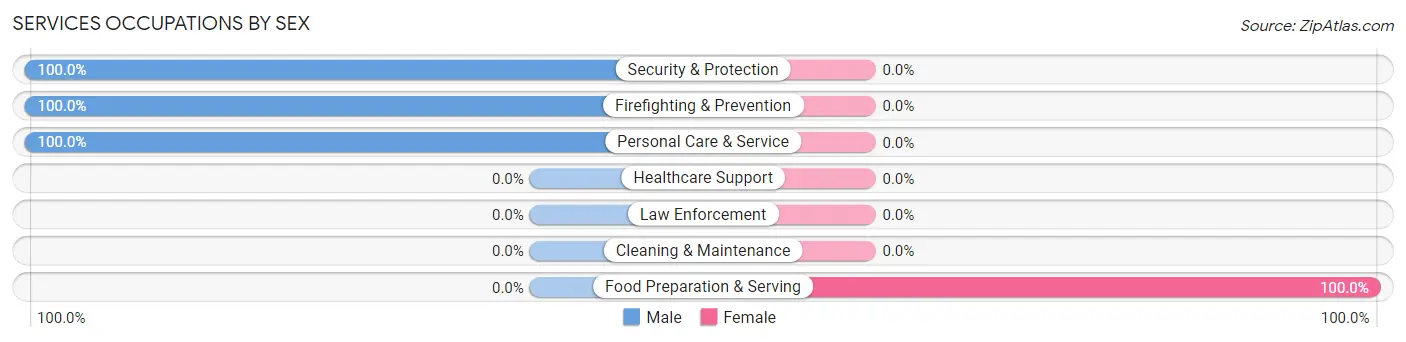
| Occupation | Male | Female |
| Healthcare Support | 0 (0.0%) | 0 (0.0%) |
| Security & Protection | 19 (100.0%) | 0 (0.0%) |
| Firefighting & Prevention | 19 (100.0%) | 0 (0.0%) |
| Law Enforcement | 0 (0.0%) | 0 (0.0%) |
| Food Preparation & Serving | 0 (0.0%) | 84 (100.0%) |
| Cleaning & Maintenance | 0 (0.0%) | 0 (0.0%) |
| Personal Care & Service | 28 (100.0%) | 0 (0.0%) |
| Total (Category) | 47 (35.9%) | 84 (64.1%) |
| Total (Overall) | 142 (41.2%) | 203 (58.8%) |
Sales and Office Occupations
The most common Sales and Office occupations in Inkerman are , and Sales & Related (16 | 4.6%).
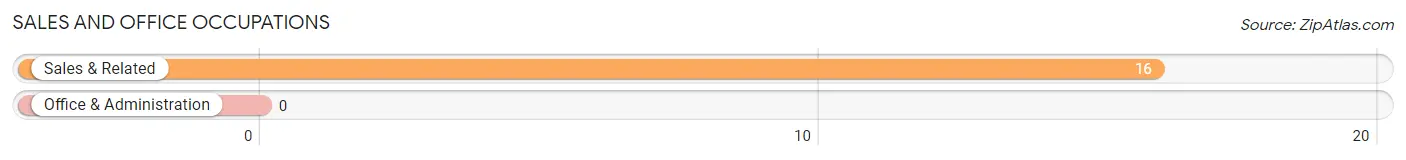
Sales and Office Occupations by Sex
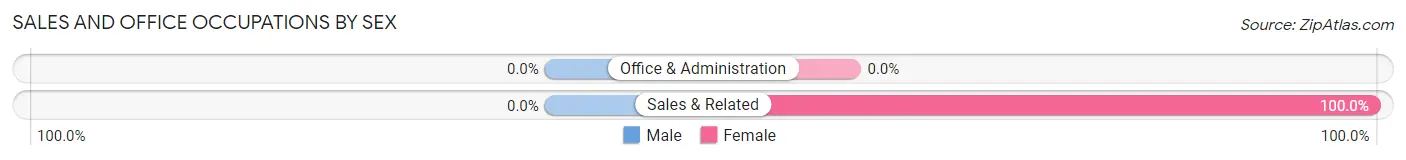
| Occupation | Male | Female |
| Sales & Related | 0 (0.0%) | 16 (100.0%) |
| Office & Administration | 0 (0.0%) | 0 (0.0%) |
| Total (Category) | 0 (0.0%) | 16 (100.0%) |
| Total (Overall) | 142 (41.2%) | 203 (58.8%) |
Natural Resources, Construction and Maintenance Occupations
The most common Natural Resources, Construction and Maintenance occupations in Inkerman are , and Installation, Maintenance & Repair (10 | 2.9%).
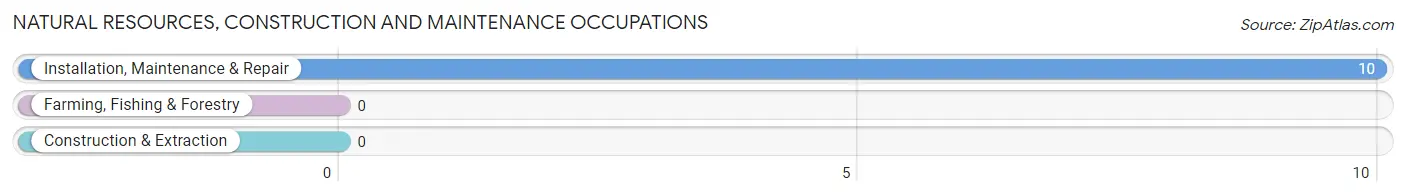
Natural Resources, Construction and Maintenance Occupations by Sex
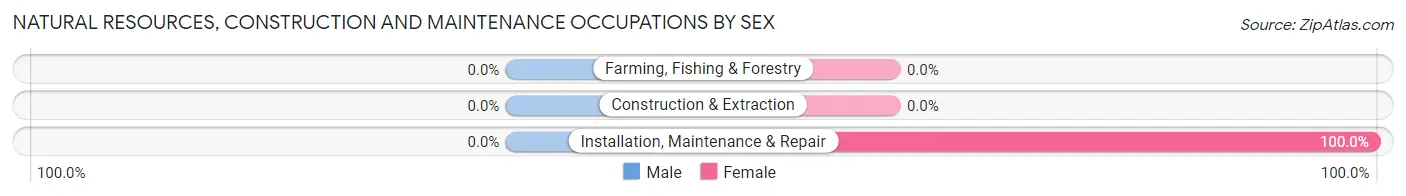
| Occupation | Male | Female |
| Farming, Fishing & Forestry | 0 (0.0%) | 0 (0.0%) |
| Construction & Extraction | 0 (0.0%) | 0 (0.0%) |
| Installation, Maintenance & Repair | 0 (0.0%) | 10 (100.0%) |
| Total (Category) | 0 (0.0%) | 10 (100.0%) |
| Total (Overall) | 142 (41.2%) | 203 (58.8%) |
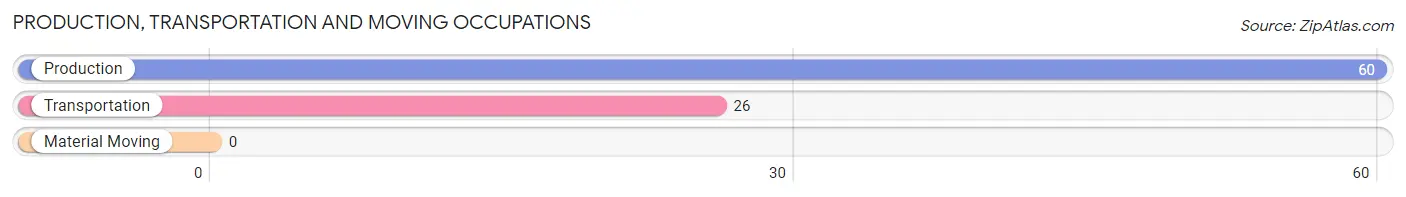
Production, Transportation and Moving Occupations
The most common Production, Transportation and Moving occupations in Inkerman are Production (60 | 17.4%), and Transportation (26 | 7.5%).
Production, Transportation and Moving Occupations by Sex
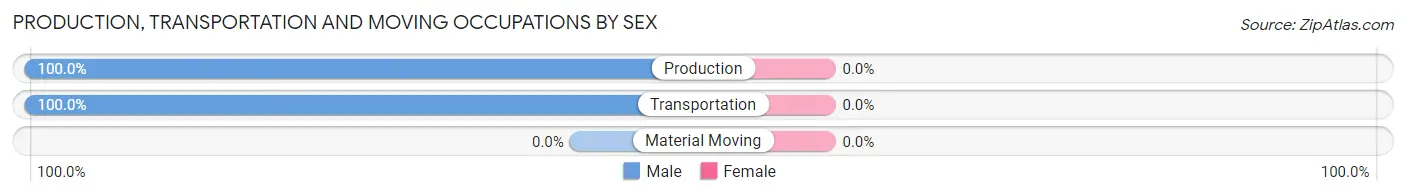
| Occupation | Male | Female |
| Production | 60 (100.0%) | 0 (0.0%) |
| Transportation | 26 (100.0%) | 0 (0.0%) |
| Material Moving | 0 (0.0%) | 0 (0.0%) |
| Total (Category) | 86 (100.0%) | 0 (0.0%) |
| Total (Overall) | 142 (41.2%) | 203 (58.8%) |
Employment Industries by Sex in Inkerman
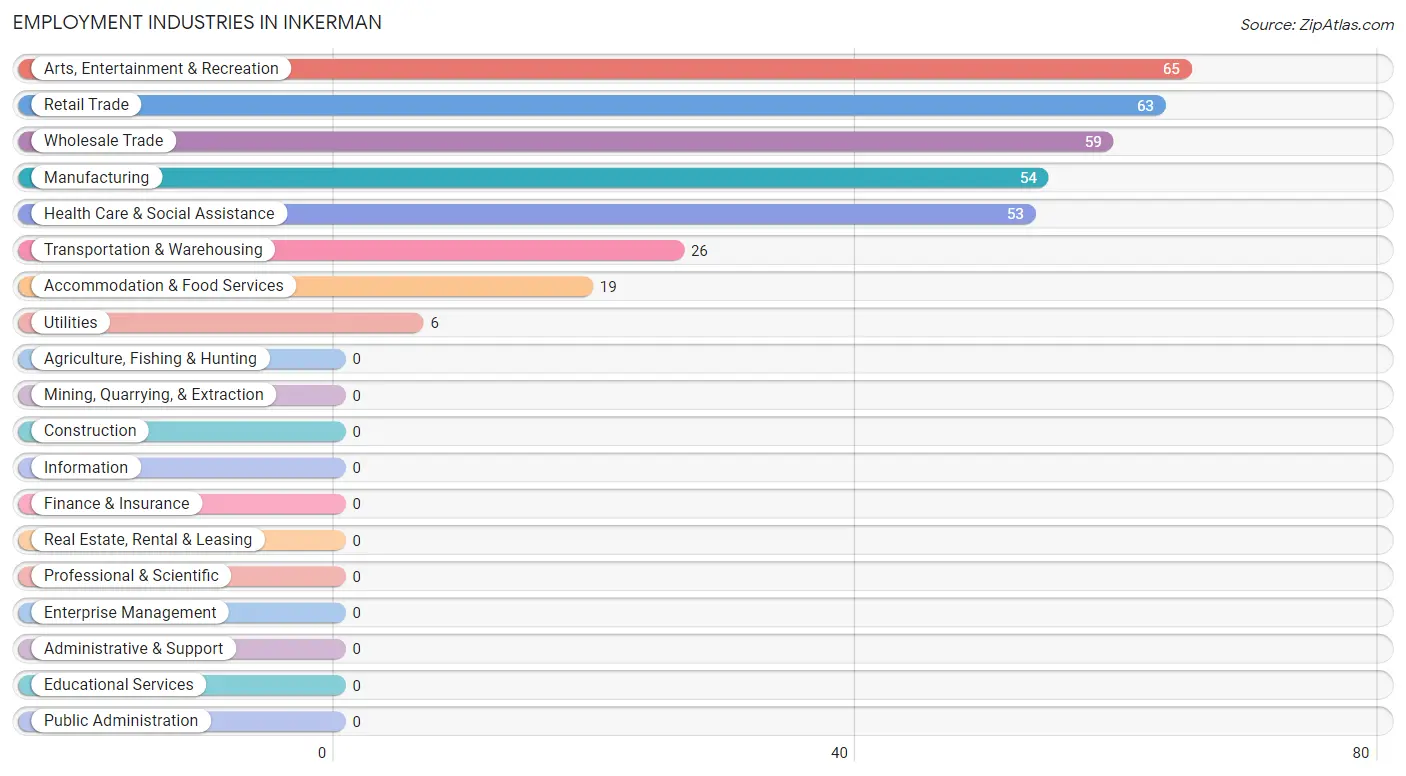
Employment Industries in Inkerman
The major employment industries in Inkerman include Arts, Entertainment & Recreation (65 | 18.8%), Retail Trade (63 | 18.3%), Wholesale Trade (59 | 17.1%), Manufacturing (54 | 15.7%), and Health Care & Social Assistance (53 | 15.4%).
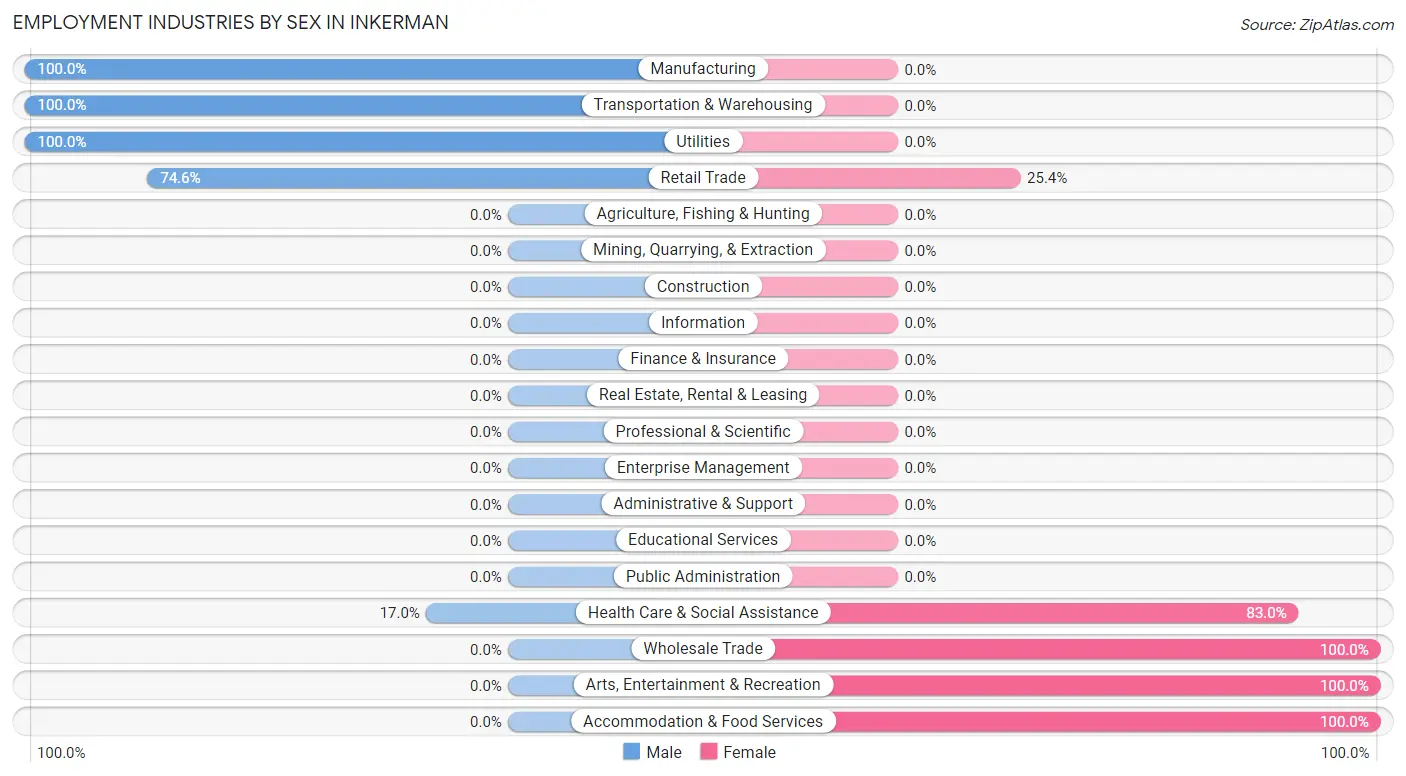
Employment Industries by Sex in Inkerman
The Inkerman industries that see more men than women are Manufacturing (100.0%), Transportation & Warehousing (100.0%), and Utilities (100.0%), whereas the industries that tend to have a higher number of women are Wholesale Trade (100.0%), Arts, Entertainment & Recreation (100.0%), and Accommodation & Food Services (100.0%).
| Industry | Male | Female |
| Agriculture, Fishing & Hunting | 0 (0.0%) | 0 (0.0%) |
| Mining, Quarrying, & Extraction | 0 (0.0%) | 0 (0.0%) |
| Construction | 0 (0.0%) | 0 (0.0%) |
| Manufacturing | 54 (100.0%) | 0 (0.0%) |
| Wholesale Trade | 0 (0.0%) | 59 (100.0%) |
| Retail Trade | 47 (74.6%) | 16 (25.4%) |
| Transportation & Warehousing | 26 (100.0%) | 0 (0.0%) |
| Utilities | 6 (100.0%) | 0 (0.0%) |
| Information | 0 (0.0%) | 0 (0.0%) |
| Finance & Insurance | 0 (0.0%) | 0 (0.0%) |
| Real Estate, Rental & Leasing | 0 (0.0%) | 0 (0.0%) |
| Professional & Scientific | 0 (0.0%) | 0 (0.0%) |
| Enterprise Management | 0 (0.0%) | 0 (0.0%) |
| Administrative & Support | 0 (0.0%) | 0 (0.0%) |
| Educational Services | 0 (0.0%) | 0 (0.0%) |
| Health Care & Social Assistance | 9 (17.0%) | 44 (83.0%) |
| Arts, Entertainment & Recreation | 0 (0.0%) | 65 (100.0%) |
| Accommodation & Food Services | 0 (0.0%) | 19 (100.0%) |
| Public Administration | 0 (0.0%) | 0 (0.0%) |
| Total | 142 (41.2%) | 203 (58.8%) |
Education in Inkerman
School Enrollment in Inkerman
The most common levels of schooling among the 219 students in Inkerman are elementary school (68 | 31.0%), graduate / professional (65 | 29.7%), and college / undergraduate (31 | 14.2%).
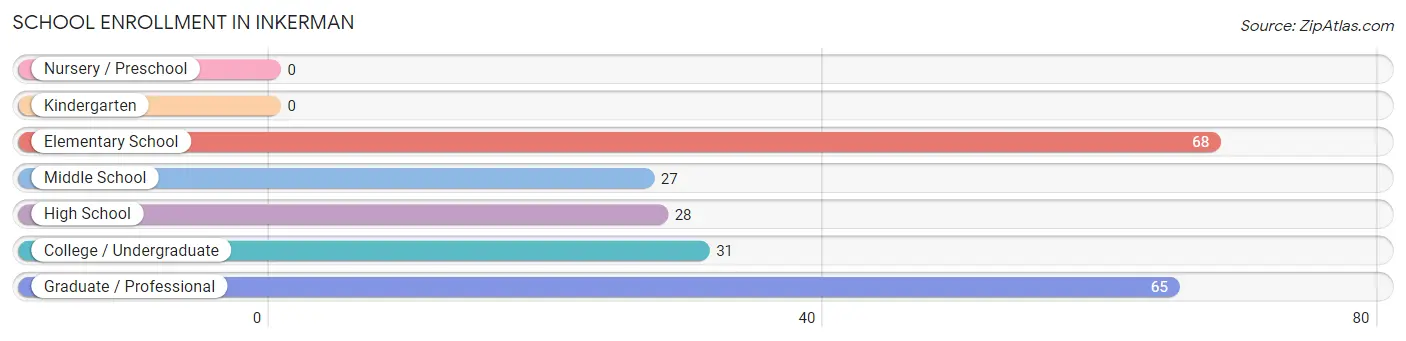
| School Level | # Students | % Students |
| Nursery / Preschool | 0 | 0.0% |
| Kindergarten | 0 | 0.0% |
| Elementary School | 68 | 31.0% |
| Middle School | 27 | 12.3% |
| High School | 28 | 12.8% |
| College / Undergraduate | 31 | 14.2% |
| Graduate / Professional | 65 | 29.7% |
| Total | 219 | 100.0% |
School Enrollment by Age by Funding Source in Inkerman
Out of a total of 219 students who are enrolled in schools in Inkerman, 75 (34.2%) attend a private institution, while the remaining 144 (65.8%) are enrolled in public schools. The age group of 25 to 34 year olds has the highest likelihood of being enrolled in private schools, with 65 (100.0% in the age bracket) enrolled. Conversely, the age group of 5 to 9 year old has the lowest likelihood of being enrolled in a private school, with 24 (100.0% in the age bracket) attending a public institution.
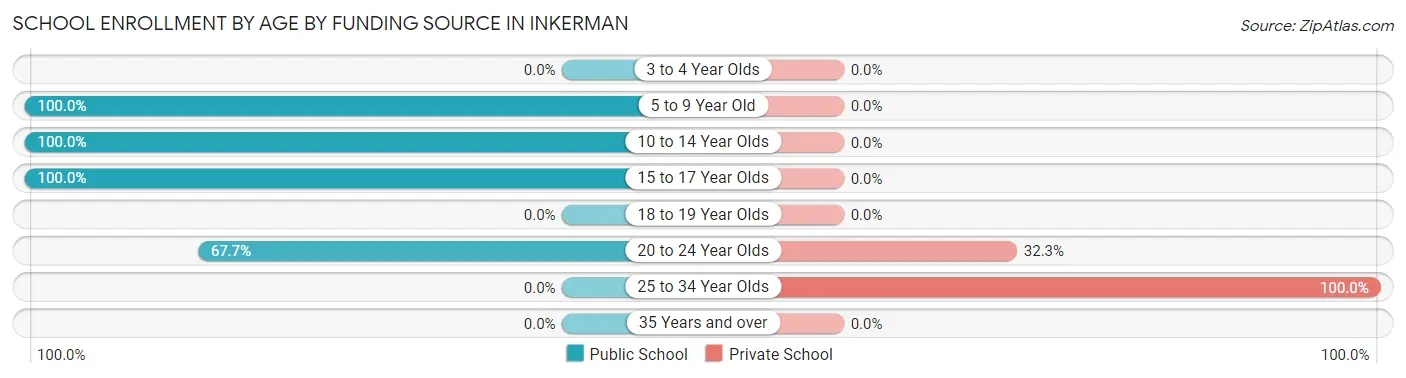
| Age Bracket | Public School | Private School |
| 3 to 4 Year Olds | 0 (0.0%) | 0 (0.0%) |
| 5 to 9 Year Old | 24 (100.0%) | 0 (0.0%) |
| 10 to 14 Year Olds | 71 (100.0%) | 0 (0.0%) |
| 15 to 17 Year Olds | 28 (100.0%) | 0 (0.0%) |
| 18 to 19 Year Olds | 0 (0.0%) | 0 (0.0%) |
| 20 to 24 Year Olds | 21 (67.7%) | 10 (32.3%) |
| 25 to 34 Year Olds | 0 (0.0%) | 65 (100.0%) |
| 35 Years and over | 0 (0.0%) | 0 (0.0%) |
| Total | 144 (65.8%) | 75 (34.2%) |
Educational Attainment by Field of Study in Inkerman
Business (95 | 39.9%), education (71 | 29.8%), social sciences (53 | 22.3%), computers & mathematics (13 | 5.5%), and science & technology (6 | 2.5%) are the most common fields of study among 238 individuals in Inkerman who have obtained a bachelor's degree or higher.
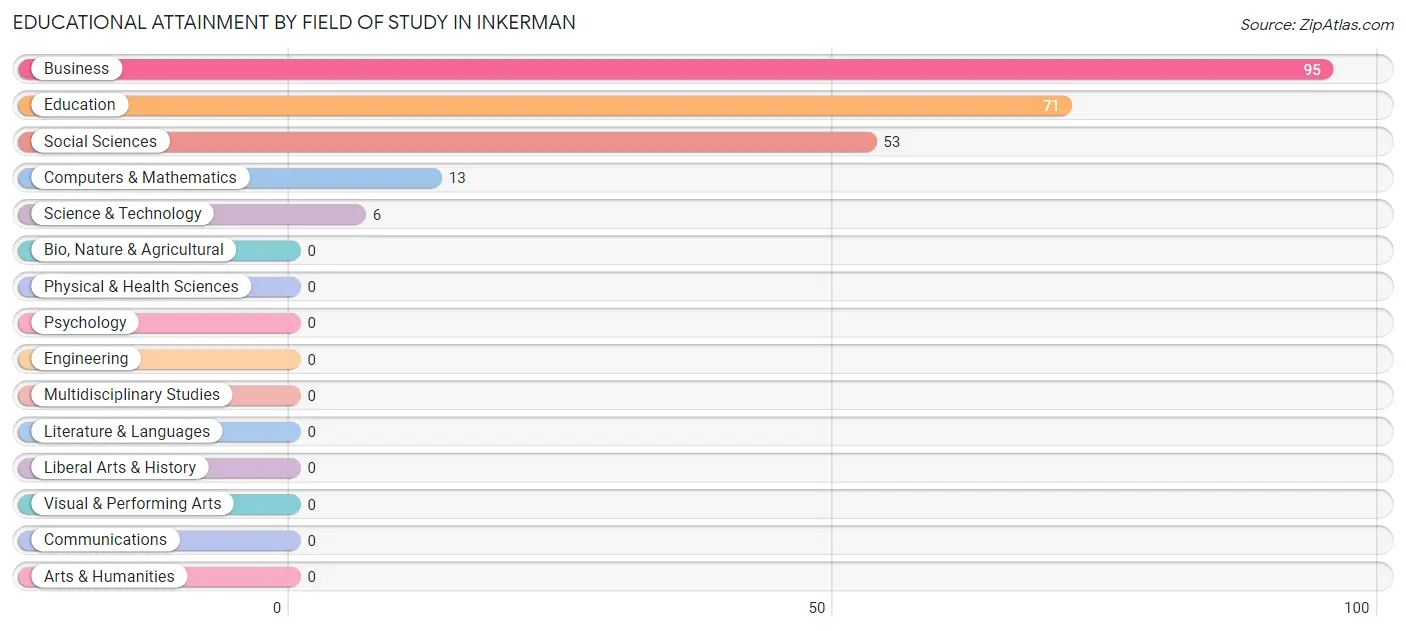
| Field of Study | # Graduates | % Graduates |
| Computers & Mathematics | 13 | 5.5% |
| Bio, Nature & Agricultural | 0 | 0.0% |
| Physical & Health Sciences | 0 | 0.0% |
| Psychology | 0 | 0.0% |
| Social Sciences | 53 | 22.3% |
| Engineering | 0 | 0.0% |
| Multidisciplinary Studies | 0 | 0.0% |
| Science & Technology | 6 | 2.5% |
| Business | 95 | 39.9% |
| Education | 71 | 29.8% |
| Literature & Languages | 0 | 0.0% |
| Liberal Arts & History | 0 | 0.0% |
| Visual & Performing Arts | 0 | 0.0% |
| Communications | 0 | 0.0% |
| Arts & Humanities | 0 | 0.0% |
| Total | 238 | 100.0% |
Transportation & Commute in Inkerman
Vehicle Availability by Sex in Inkerman
The most prevalent vehicle ownership categories in Inkerman are males with 1 vehicle (66, accounting for 46.5%) and females with 1 vehicle (44, making up 32.5%).
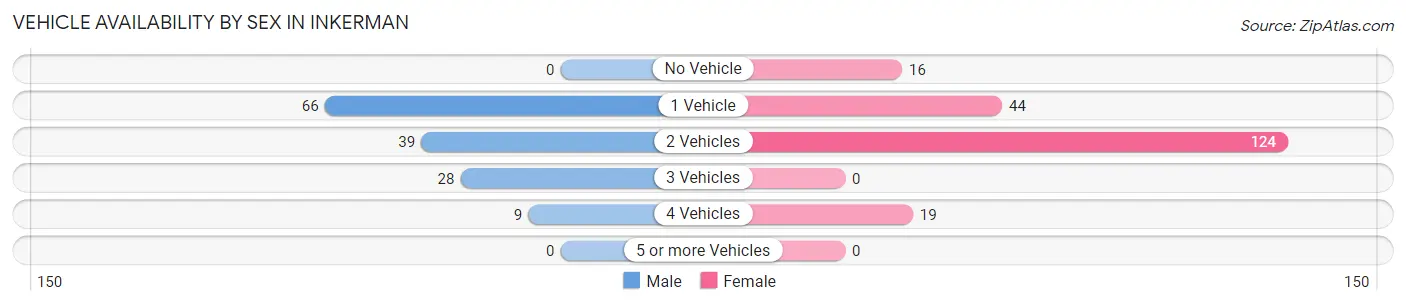
| Vehicles Available | Male | Female |
| No Vehicle | 0 (0.0%) | 16 (7.9%) |
| 1 Vehicle | 66 (46.5%) | 44 (21.7%) |
| 2 Vehicles | 39 (27.5%) | 124 (61.1%) |
| 3 Vehicles | 28 (19.7%) | 0 (0.0%) |
| 4 Vehicles | 9 (6.3%) | 19 (9.4%) |
| 5 or more Vehicles | 0 (0.0%) | 0 (0.0%) |
| Total | 142 (100.0%) | 203 (100.0%) |
Commute Time in Inkerman
The most frequently occuring commute durations in Inkerman are 20 to 24 minutes (129 commuters, 45.1%), 60 to 89 minutes (53 commuters, 18.5%), and 10 to 14 minutes (36 commuters, 12.6%).
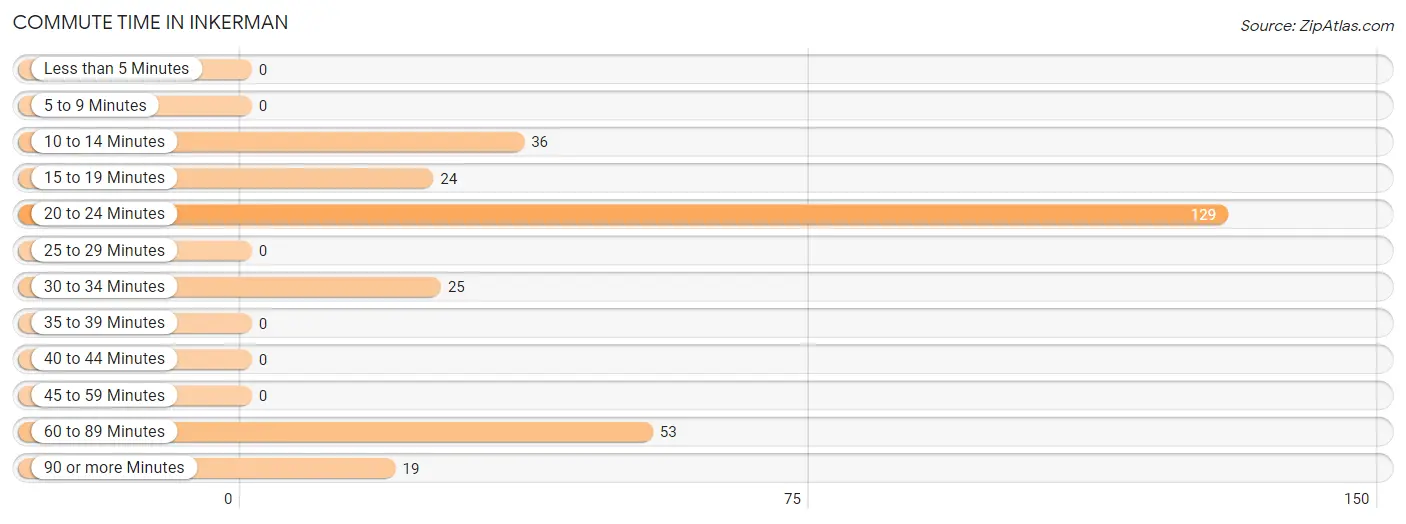
| Commute Time | # Commuters | % Commuters |
| Less than 5 Minutes | 0 | 0.0% |
| 5 to 9 Minutes | 0 | 0.0% |
| 10 to 14 Minutes | 36 | 12.6% |
| 15 to 19 Minutes | 24 | 8.4% |
| 20 to 24 Minutes | 129 | 45.1% |
| 25 to 29 Minutes | 0 | 0.0% |
| 30 to 34 Minutes | 25 | 8.7% |
| 35 to 39 Minutes | 0 | 0.0% |
| 40 to 44 Minutes | 0 | 0.0% |
| 45 to 59 Minutes | 0 | 0.0% |
| 60 to 89 Minutes | 53 | 18.5% |
| 90 or more Minutes | 19 | 6.6% |
Commute Time by Sex in Inkerman
The most common commute times in Inkerman are 20 to 24 minutes (48 commuters, 33.8%) for males and 20 to 24 minutes (81 commuters, 56.2%) for females.
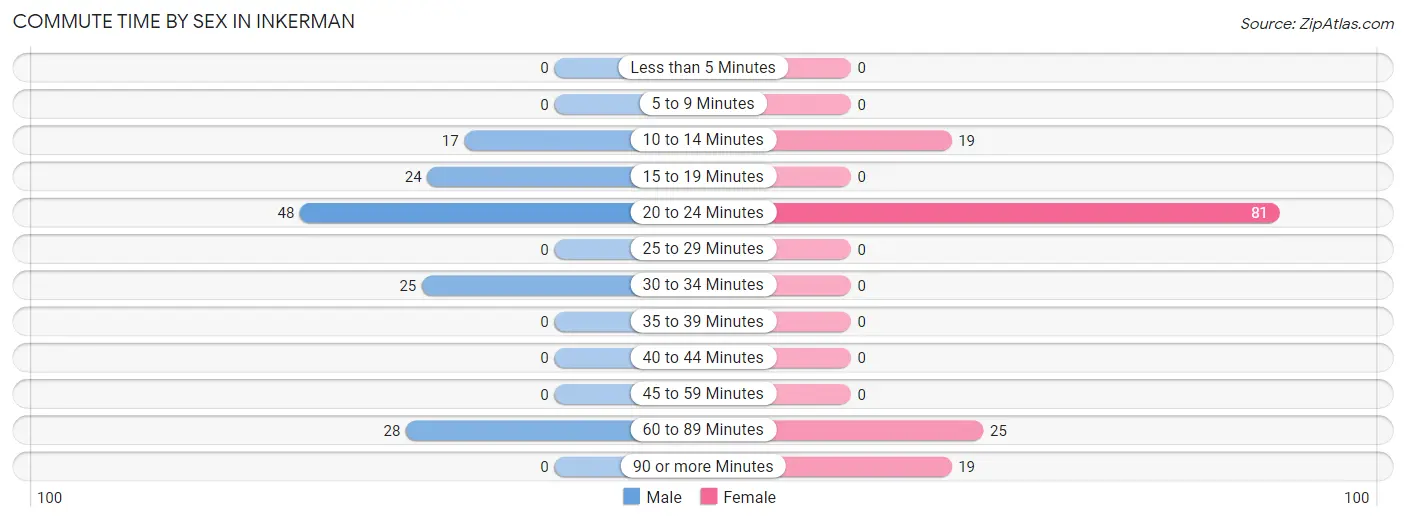
| Commute Time | Male | Female |
| Less than 5 Minutes | 0 (0.0%) | 0 (0.0%) |
| 5 to 9 Minutes | 0 (0.0%) | 0 (0.0%) |
| 10 to 14 Minutes | 17 (12.0%) | 19 (13.2%) |
| 15 to 19 Minutes | 24 (16.9%) | 0 (0.0%) |
| 20 to 24 Minutes | 48 (33.8%) | 81 (56.2%) |
| 25 to 29 Minutes | 0 (0.0%) | 0 (0.0%) |
| 30 to 34 Minutes | 25 (17.6%) | 0 (0.0%) |
| 35 to 39 Minutes | 0 (0.0%) | 0 (0.0%) |
| 40 to 44 Minutes | 0 (0.0%) | 0 (0.0%) |
| 45 to 59 Minutes | 0 (0.0%) | 0 (0.0%) |
| 60 to 89 Minutes | 28 (19.7%) | 25 (17.4%) |
| 90 or more Minutes | 0 (0.0%) | 19 (13.2%) |
Time of Departure to Work by Sex in Inkerman
The most frequent times of departure to work in Inkerman are 7:30 AM to 7:59 AM (28, 19.7%) for males and 8:00 AM to 8:29 AM (65, 45.1%) for females.
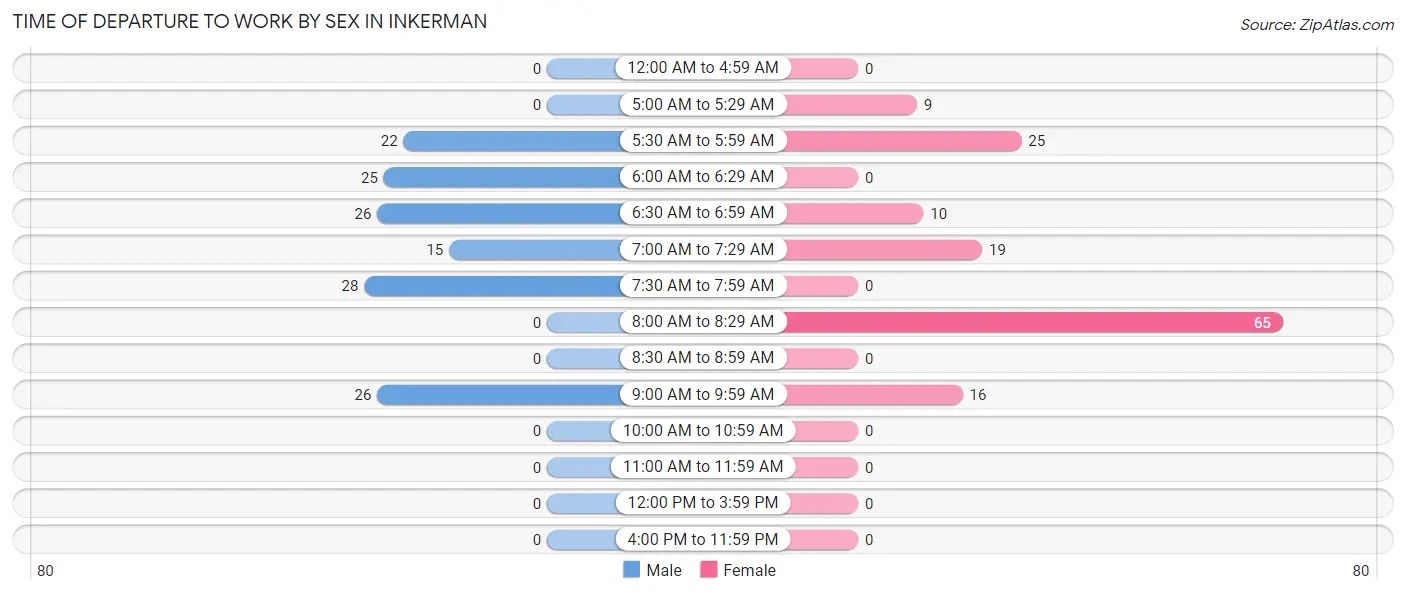
| Time of Departure | Male | Female |
| 12:00 AM to 4:59 AM | 0 (0.0%) | 0 (0.0%) |
| 5:00 AM to 5:29 AM | 0 (0.0%) | 9 (6.2%) |
| 5:30 AM to 5:59 AM | 22 (15.5%) | 25 (17.4%) |
| 6:00 AM to 6:29 AM | 25 (17.6%) | 0 (0.0%) |
| 6:30 AM to 6:59 AM | 26 (18.3%) | 10 (6.9%) |
| 7:00 AM to 7:29 AM | 15 (10.6%) | 19 (13.2%) |
| 7:30 AM to 7:59 AM | 28 (19.7%) | 0 (0.0%) |
| 8:00 AM to 8:29 AM | 0 (0.0%) | 65 (45.1%) |
| 8:30 AM to 8:59 AM | 0 (0.0%) | 0 (0.0%) |
| 9:00 AM to 9:59 AM | 26 (18.3%) | 16 (11.1%) |
| 10:00 AM to 10:59 AM | 0 (0.0%) | 0 (0.0%) |
| 11:00 AM to 11:59 AM | 0 (0.0%) | 0 (0.0%) |
| 12:00 PM to 3:59 PM | 0 (0.0%) | 0 (0.0%) |
| 4:00 PM to 11:59 PM | 0 (0.0%) | 0 (0.0%) |
| Total | 142 (100.0%) | 144 (100.0%) |
Housing Occupancy in Inkerman
Occupancy by Ownership in Inkerman
Of the total 770 dwellings in Inkerman, owner-occupied units account for 295 (38.3%), while renter-occupied units make up 475 (61.7%).
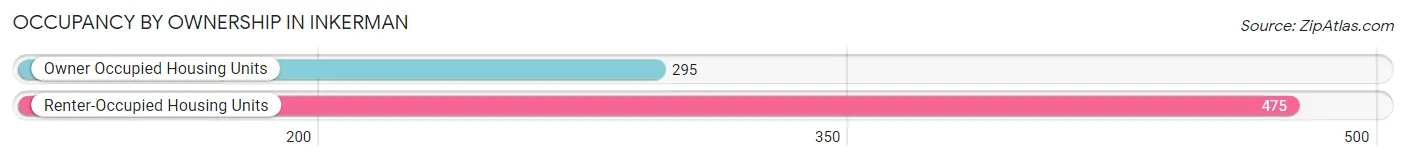
| Occupancy | # Housing Units | % Housing Units |
| Owner Occupied Housing Units | 295 | 38.3% |
| Renter-Occupied Housing Units | 475 | 61.7% |
| Total Occupied Housing Units | 770 | 100.0% |
Occupancy by Household Size in Inkerman
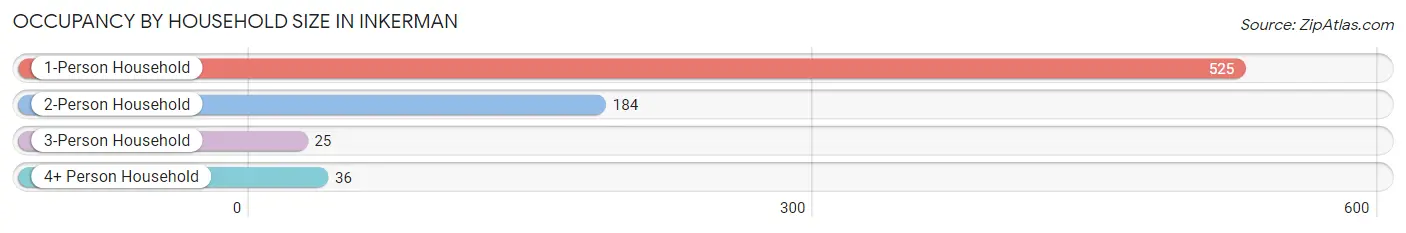
| Household Size | # Housing Units | % Housing Units |
| 1-Person Household | 525 | 68.2% |
| 2-Person Household | 184 | 23.9% |
| 3-Person Household | 25 | 3.3% |
| 4+ Person Household | 36 | 4.7% |
| Total Housing Units | 770 | 100.0% |
Occupancy by Ownership by Household Size in Inkerman
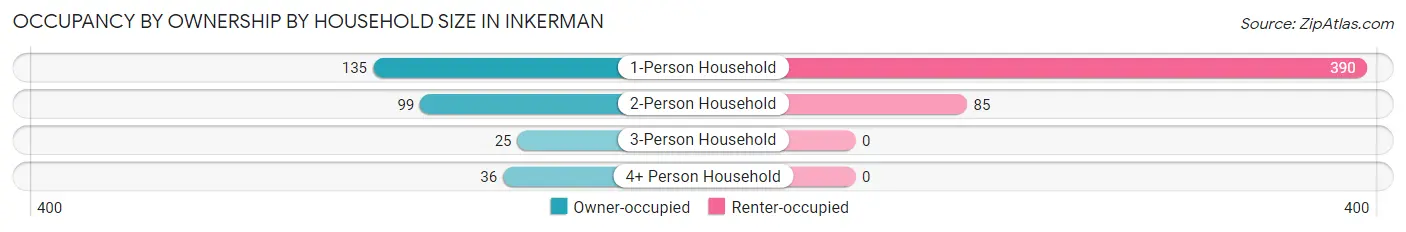
| Household Size | Owner-occupied | Renter-occupied |
| 1-Person Household | 135 (25.7%) | 390 (74.3%) |
| 2-Person Household | 99 (53.8%) | 85 (46.2%) |
| 3-Person Household | 25 (100.0%) | 0 (0.0%) |
| 4+ Person Household | 36 (100.0%) | 0 (0.0%) |
| Total Housing Units | 295 (38.3%) | 475 (61.7%) |
Occupancy by Educational Attainment in Inkerman
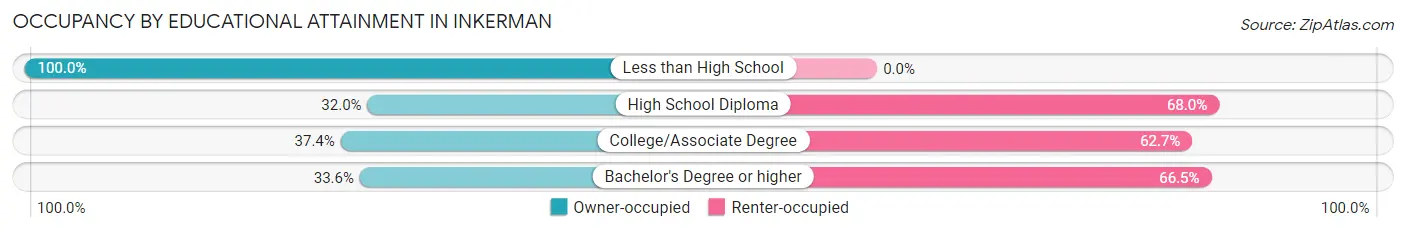
| Household Size | Owner-occupied | Renter-occupied |
| Less than High School | 34 (100.0%) | 0 (0.0%) |
| High School Diploma | 49 (32.0%) | 104 (68.0%) |
| College/Associate Degree | 161 (37.3%) | 270 (62.6%) |
| Bachelor's Degree or higher | 51 (33.6%) | 101 (66.4%) |
Occupancy by Age of Householder in Inkerman
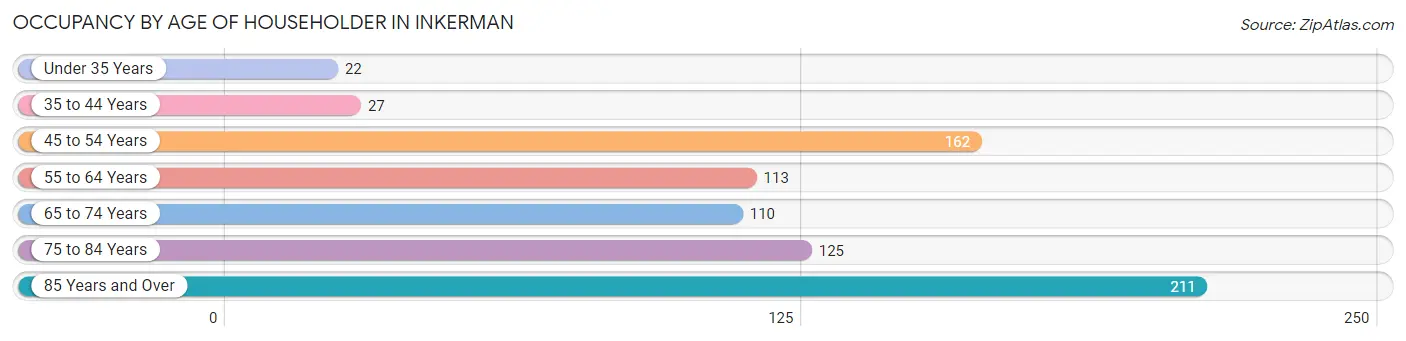
| Age Bracket | # Households | % Households |
| Under 35 Years | 22 | 2.9% |
| 35 to 44 Years | 27 | 3.5% |
| 45 to 54 Years | 162 | 21.0% |
| 55 to 64 Years | 113 | 14.7% |
| 65 to 74 Years | 110 | 14.3% |
| 75 to 84 Years | 125 | 16.2% |
| 85 Years and Over | 211 | 27.4% |
| Total | 770 | 100.0% |
Housing Finances in Inkerman
Median Income by Occupancy in Inkerman
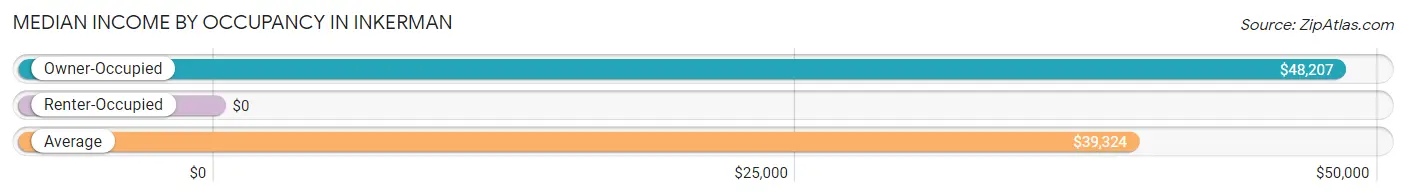
| Occupancy Type | # Households | Median Income |
| Owner-Occupied | 295 (38.3%) | $48,207 |
| Renter-Occupied | 475 (61.7%) | $0 |
| Average | 770 (100.0%) | $39,324 |
Occupancy by Householder Income Bracket in Inkerman
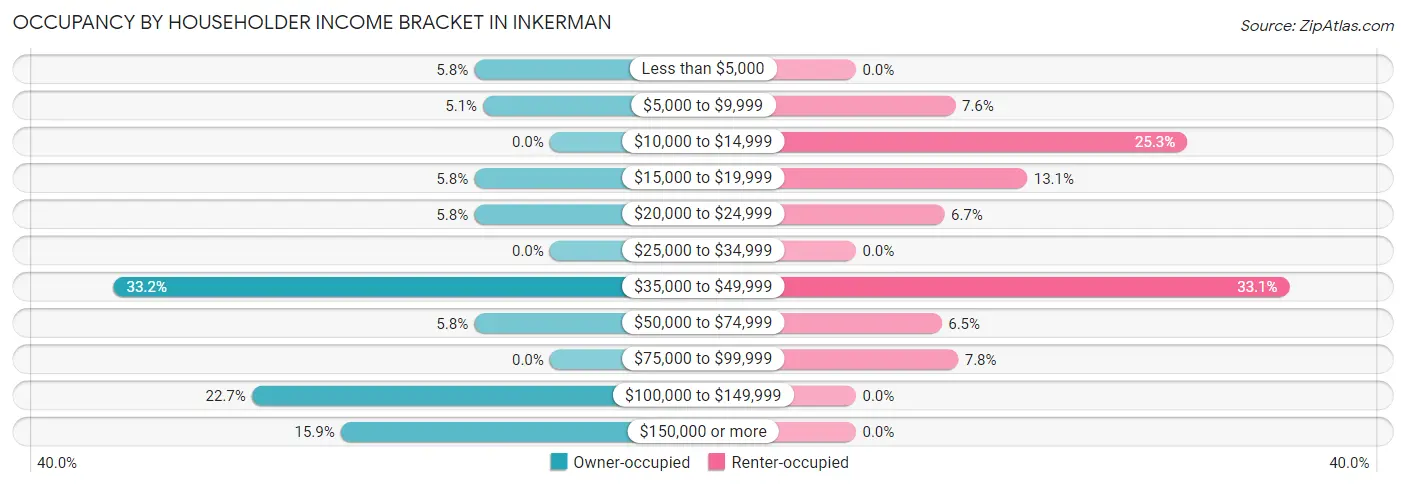
| Income Bracket | Owner-occupied | Renter-occupied |
| Less than $5,000 | 17 (5.8%) | 0 (0.0%) |
| $5,000 to $9,999 | 15 (5.1%) | 36 (7.6%) |
| $10,000 to $14,999 | 0 (0.0%) | 120 (25.3%) |
| $15,000 to $19,999 | 17 (5.8%) | 62 (13.1%) |
| $20,000 to $24,999 | 17 (5.8%) | 32 (6.7%) |
| $25,000 to $34,999 | 0 (0.0%) | 0 (0.0%) |
| $35,000 to $49,999 | 98 (33.2%) | 157 (33.1%) |
| $50,000 to $74,999 | 17 (5.8%) | 31 (6.5%) |
| $75,000 to $99,999 | 0 (0.0%) | 37 (7.8%) |
| $100,000 to $149,999 | 67 (22.7%) | 0 (0.0%) |
| $150,000 or more | 47 (15.9%) | 0 (0.0%) |
| Total | 295 (100.0%) | 475 (100.0%) |
Monthly Housing Cost Tiers in Inkerman
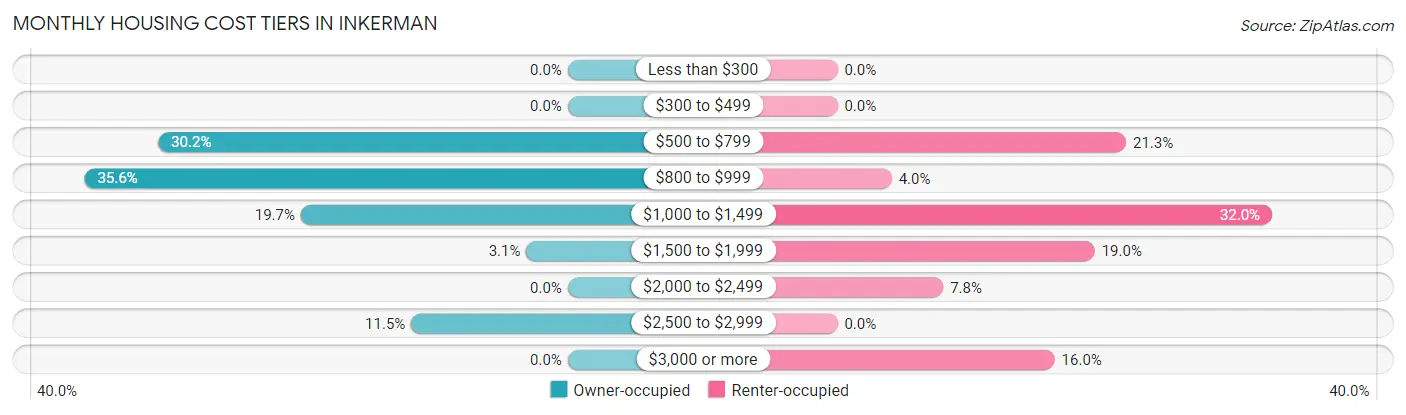
| Monthly Cost | Owner-occupied | Renter-occupied |
| Less than $300 | 0 (0.0%) | 0 (0.0%) |
| $300 to $499 | 0 (0.0%) | 0 (0.0%) |
| $500 to $799 | 89 (30.2%) | 101 (21.3%) |
| $800 to $999 | 105 (35.6%) | 19 (4.0%) |
| $1,000 to $1,499 | 58 (19.7%) | 152 (32.0%) |
| $1,500 to $1,999 | 9 (3.0%) | 90 (19.0%) |
| $2,000 to $2,499 | 0 (0.0%) | 37 (7.8%) |
| $2,500 to $2,999 | 34 (11.5%) | 0 (0.0%) |
| $3,000 or more | 0 (0.0%) | 76 (16.0%) |
| Total | 295 (100.0%) | 475 (100.0%) |
Physical Housing Characteristics in Inkerman
Housing Structures in Inkerman
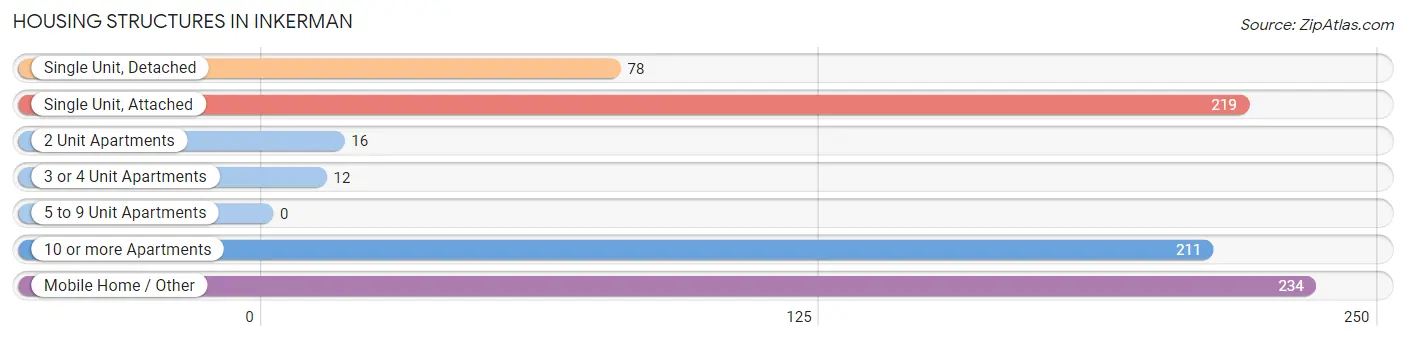
| Structure Type | # Housing Units | % Housing Units |
| Single Unit, Detached | 78 | 10.1% |
| Single Unit, Attached | 219 | 28.4% |
| 2 Unit Apartments | 16 | 2.1% |
| 3 or 4 Unit Apartments | 12 | 1.6% |
| 5 to 9 Unit Apartments | 0 | 0.0% |
| 10 or more Apartments | 211 | 27.4% |
| Mobile Home / Other | 234 | 30.4% |
| Total | 770 | 100.0% |
Housing Structures by Occupancy in Inkerman
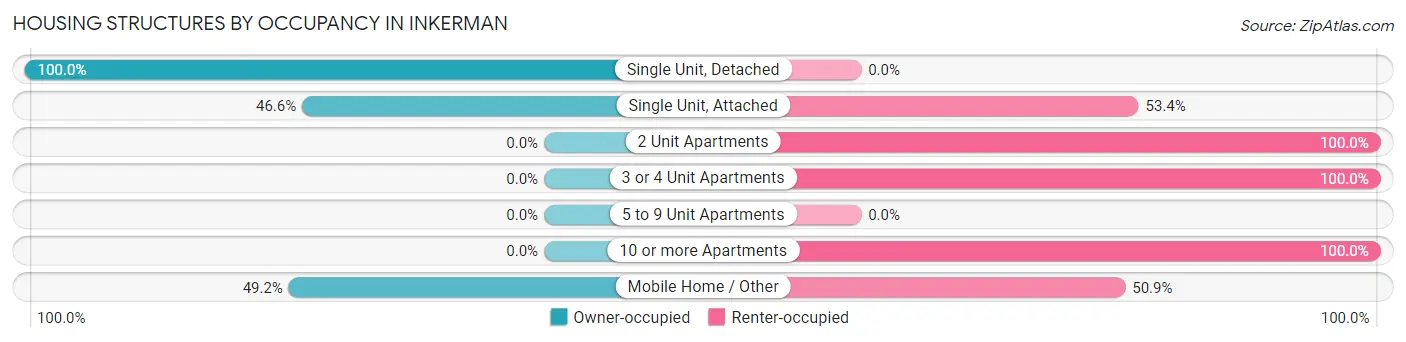
| Structure Type | Owner-occupied | Renter-occupied |
| Single Unit, Detached | 78 (100.0%) | 0 (0.0%) |
| Single Unit, Attached | 102 (46.6%) | 117 (53.4%) |
| 2 Unit Apartments | 0 (0.0%) | 16 (100.0%) |
| 3 or 4 Unit Apartments | 0 (0.0%) | 12 (100.0%) |
| 5 to 9 Unit Apartments | 0 (0.0%) | 0 (0.0%) |
| 10 or more Apartments | 0 (0.0%) | 211 (100.0%) |
| Mobile Home / Other | 115 (49.1%) | 119 (50.8%) |
| Total | 295 (38.3%) | 475 (61.7%) |
Housing Structures by Number of Rooms in Inkerman
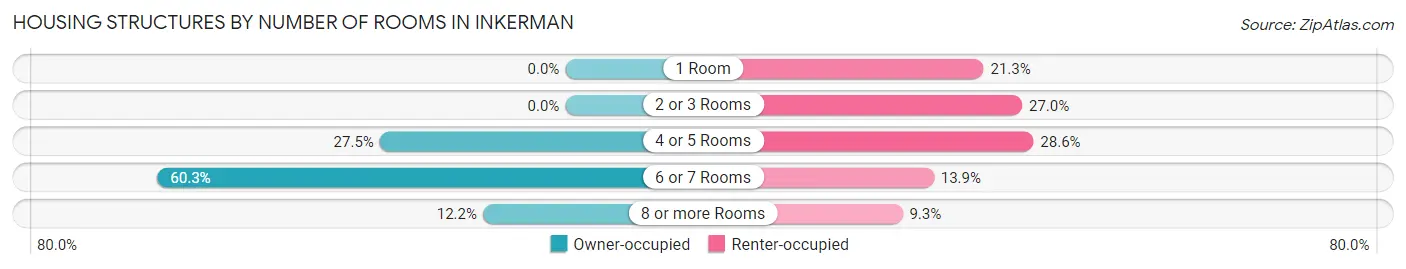
| Number of Rooms | Owner-occupied | Renter-occupied |
| 1 Room | 0 (0.0%) | 101 (21.3%) |
| 2 or 3 Rooms | 0 (0.0%) | 128 (27.0%) |
| 4 or 5 Rooms | 81 (27.5%) | 136 (28.6%) |
| 6 or 7 Rooms | 178 (60.3%) | 66 (13.9%) |
| 8 or more Rooms | 36 (12.2%) | 44 (9.3%) |
| Total | 295 (100.0%) | 475 (100.0%) |
Housing Structure by Heating Type in Inkerman
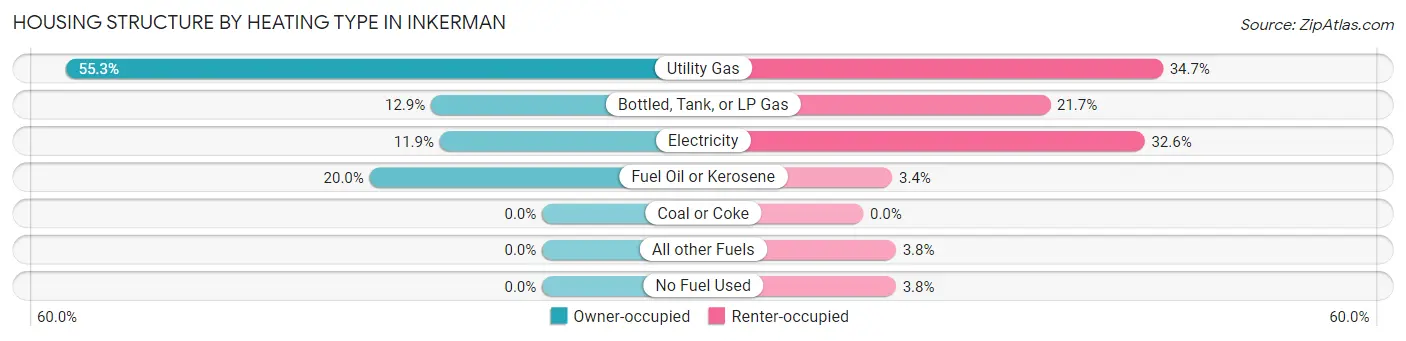
| Heating Type | Owner-occupied | Renter-occupied |
| Utility Gas | 163 (55.2%) | 165 (34.7%) |
| Bottled, Tank, or LP Gas | 38 (12.9%) | 103 (21.7%) |
| Electricity | 35 (11.9%) | 155 (32.6%) |
| Fuel Oil or Kerosene | 59 (20.0%) | 16 (3.4%) |
| Coal or Coke | 0 (0.0%) | 0 (0.0%) |
| All other Fuels | 0 (0.0%) | 18 (3.8%) |
| No Fuel Used | 0 (0.0%) | 18 (3.8%) |
| Total | 295 (100.0%) | 475 (100.0%) |
Household Vehicle Usage in Inkerman
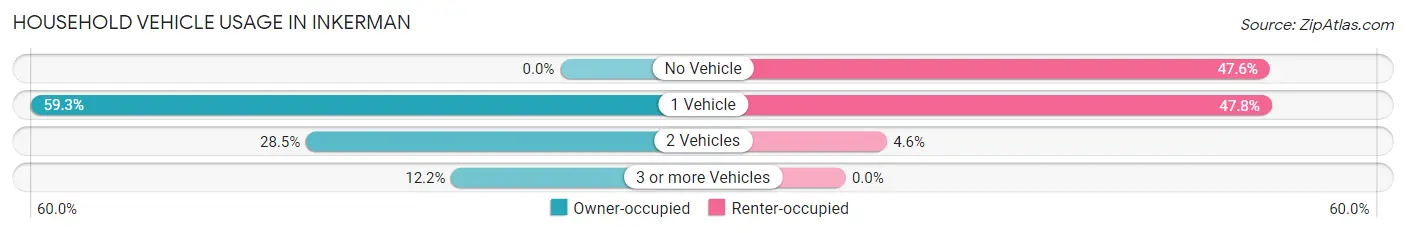
| Vehicles per Household | Owner-occupied | Renter-occupied |
| No Vehicle | 0 (0.0%) | 226 (47.6%) |
| 1 Vehicle | 175 (59.3%) | 227 (47.8%) |
| 2 Vehicles | 84 (28.5%) | 22 (4.6%) |
| 3 or more Vehicles | 36 (12.2%) | 0 (0.0%) |
| Total | 295 (100.0%) | 475 (100.0%) |
Real Estate & Mortgages in Inkerman
Real Estate and Mortgage Overview in Inkerman
| Characteristic | Without Mortgage | With Mortgage |
| Housing Units | 252 | 43 |
| Median Property Value | - | - |
| Median Household Income | - | - |
| Monthly Housing Costs | $893 | $0 |
| Real Estate Taxes | $2,036 | $0 |
Property Value by Mortgage Status in Inkerman
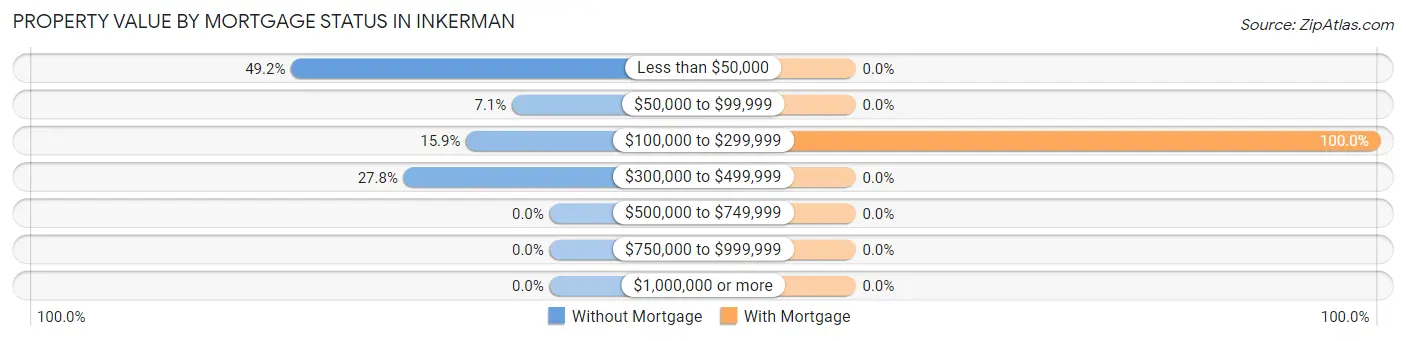
| Property Value | Without Mortgage | With Mortgage |
| Less than $50,000 | 124 (49.2%) | 0 (0.0%) |
| $50,000 to $99,999 | 18 (7.1%) | 0 (0.0%) |
| $100,000 to $299,999 | 40 (15.9%) | 43 (100.0%) |
| $300,000 to $499,999 | 70 (27.8%) | 0 (0.0%) |
| $500,000 to $749,999 | 0 (0.0%) | 0 (0.0%) |
| $750,000 to $999,999 | 0 (0.0%) | 0 (0.0%) |
| $1,000,000 or more | 0 (0.0%) | 0 (0.0%) |
| Total | 252 (100.0%) | 43 (100.0%) |
Household Income by Mortgage Status in Inkerman
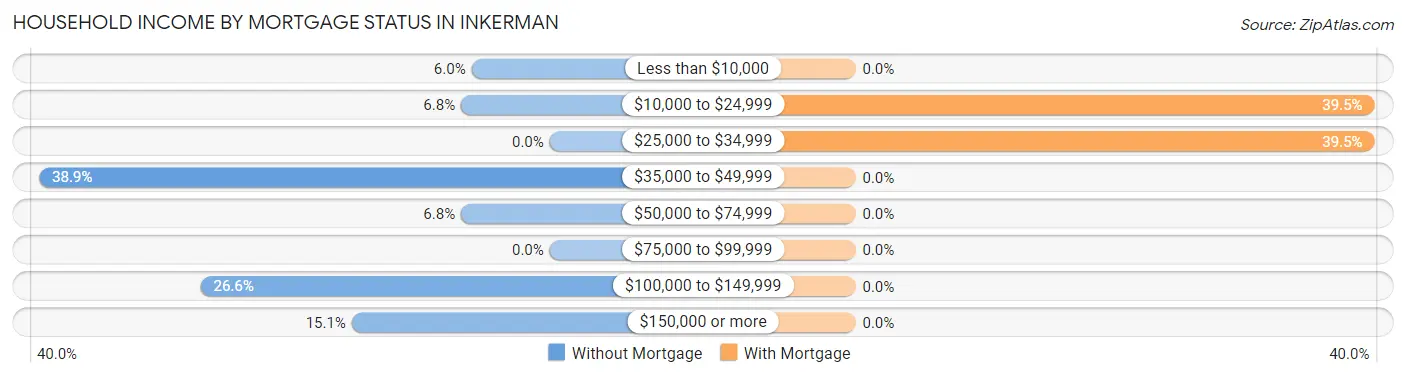
| Household Income | Without Mortgage | With Mortgage |
| Less than $10,000 | 15 (5.9%) | 0 (0.0%) |
| $10,000 to $24,999 | 17 (6.8%) | 17 (39.5%) |
| $25,000 to $34,999 | 0 (0.0%) | 17 (39.5%) |
| $35,000 to $49,999 | 98 (38.9%) | 0 (0.0%) |
| $50,000 to $74,999 | 17 (6.8%) | 0 (0.0%) |
| $75,000 to $99,999 | 0 (0.0%) | 0 (0.0%) |
| $100,000 to $149,999 | 67 (26.6%) | 0 (0.0%) |
| $150,000 or more | 38 (15.1%) | 0 (0.0%) |
| Total | 252 (100.0%) | 43 (100.0%) |
Property Value to Household Income Ratio in Inkerman
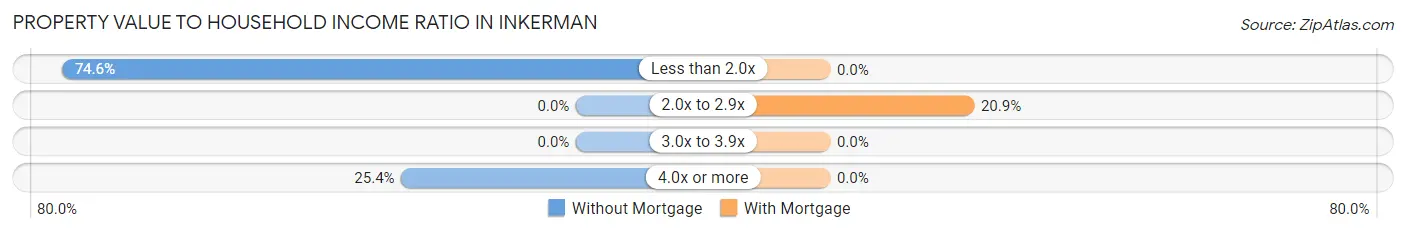
| Value-to-Income Ratio | Without Mortgage | With Mortgage |
| Less than 2.0x | 188 (74.6%) | 0 (0.0%) |
| 2.0x to 2.9x | 0 (0.0%) | 9 (20.9%) |
| 3.0x to 3.9x | 0 (0.0%) | 0 (0.0%) |
| 4.0x or more | 64 (25.4%) | 0 (0.0%) |
| Total | 252 (100.0%) | 43 (100.0%) |
Real Estate Taxes by Mortgage Status in Inkerman
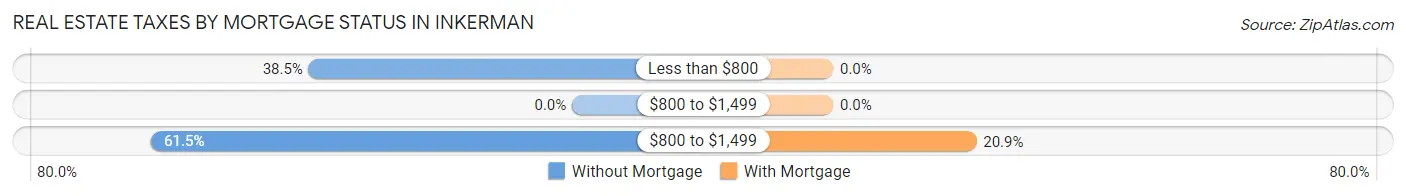
| Property Taxes | Without Mortgage | With Mortgage |
| Less than $800 | 97 (38.5%) | 0 (0.0%) |
| $800 to $1,499 | 0 (0.0%) | 0 (0.0%) |
| $800 to $1,499 | 155 (61.5%) | 9 (20.9%) |
| Total | 252 (100.0%) | 43 (100.0%) |
Health & Disability in Inkerman
Health Insurance Coverage by Age in Inkerman
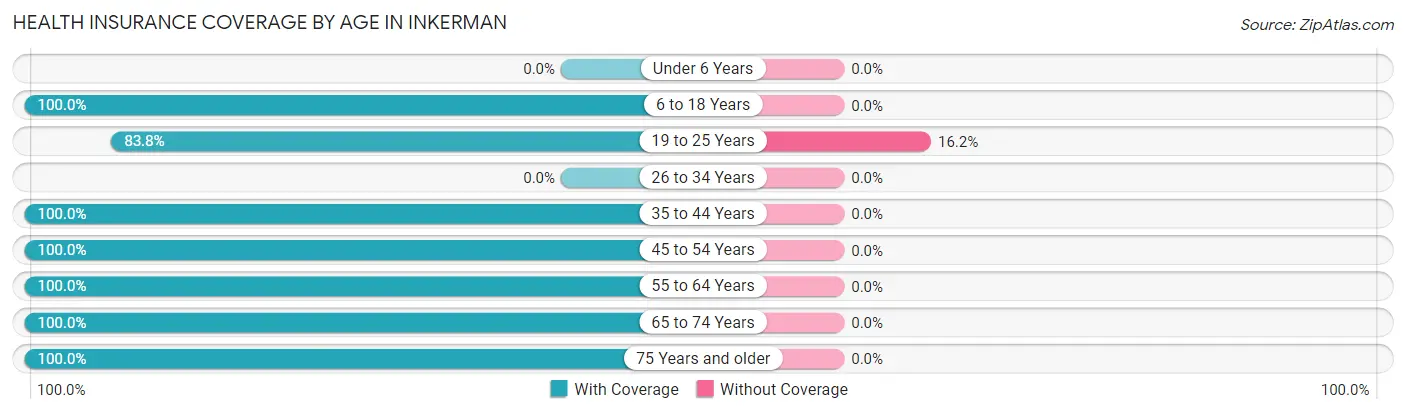
| Age Bracket | With Coverage | Without Coverage |
| Under 6 Years | 0 (0.0%) | 0 (0.0%) |
| 6 to 18 Years | 123 (100.0%) | 0 (0.0%) |
| 19 to 25 Years | 114 (83.8%) | 22 (16.2%) |
| 26 to 34 Years | 0 (0.0%) | 0 (0.0%) |
| 35 to 44 Years | 27 (100.0%) | 0 (0.0%) |
| 45 to 54 Years | 231 (100.0%) | 0 (0.0%) |
| 55 to 64 Years | 122 (100.0%) | 0 (0.0%) |
| 65 to 74 Years | 136 (100.0%) | 0 (0.0%) |
| 75 Years and older | 345 (100.0%) | 0 (0.0%) |
| Total | 1,098 (98.0%) | 22 (2.0%) |
Health Insurance Coverage by Citizenship Status in Inkerman
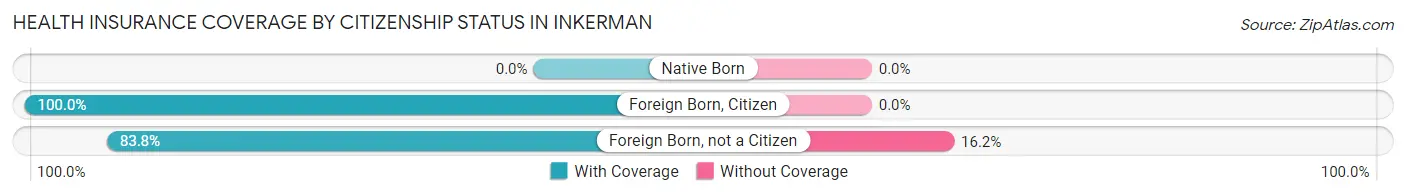
| Citizenship Status | With Coverage | Without Coverage |
| Native Born | 0 (0.0%) | 0 (0.0%) |
| Foreign Born, Citizen | 123 (100.0%) | 0 (0.0%) |
| Foreign Born, not a Citizen | 114 (83.8%) | 22 (16.2%) |
Health Insurance Coverage by Household Income in Inkerman
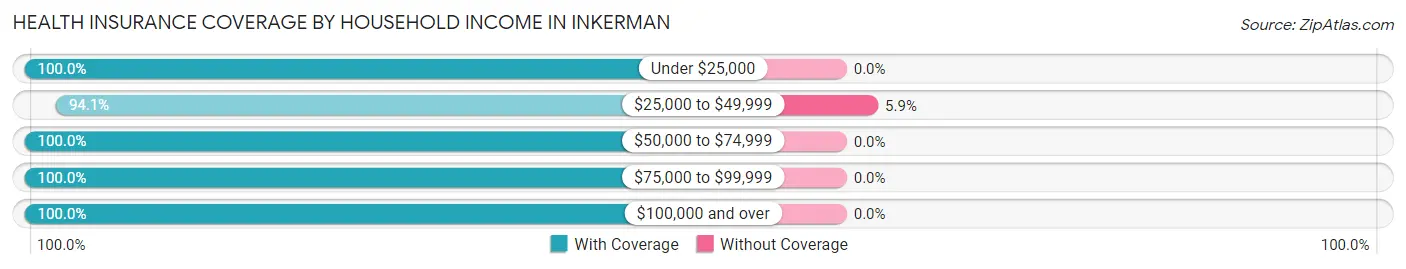
| Household Income | With Coverage | Without Coverage |
| Under $25,000 | 378 (100.0%) | 0 (0.0%) |
| $25,000 to $49,999 | 352 (94.1%) | 22 (5.9%) |
| $50,000 to $74,999 | 65 (100.0%) | 0 (0.0%) |
| $75,000 to $99,999 | 37 (100.0%) | 0 (0.0%) |
| $100,000 and over | 266 (100.0%) | 0 (0.0%) |
Public vs Private Health Insurance Coverage by Age in Inkerman
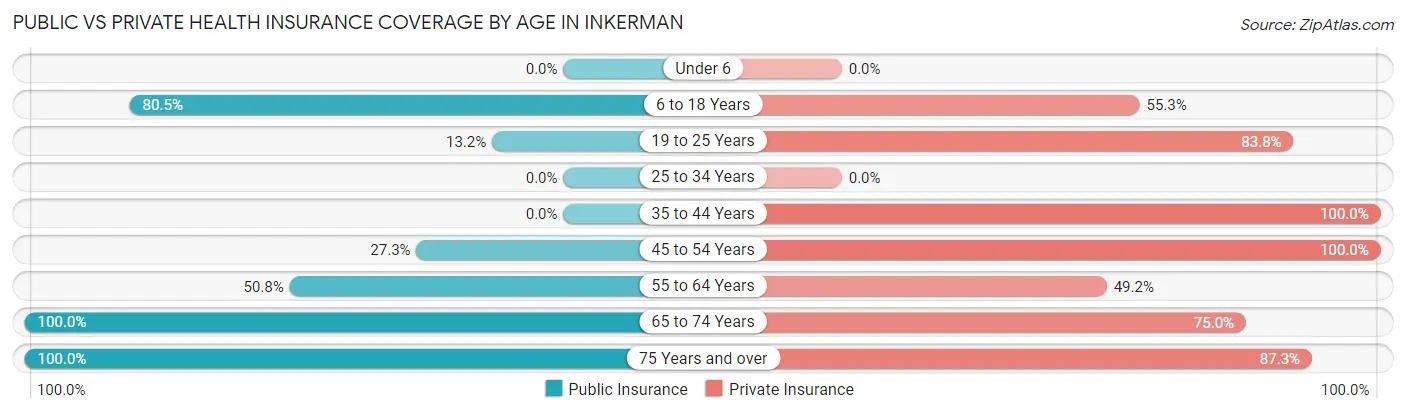
| Age Bracket | Public Insurance | Private Insurance |
| Under 6 | 0 (0.0%) | 0 (0.0%) |
| 6 to 18 Years | 99 (80.5%) | 68 (55.3%) |
| 19 to 25 Years | 18 (13.2%) | 114 (83.8%) |
| 25 to 34 Years | 0 (0.0%) | 0 (0.0%) |
| 35 to 44 Years | 0 (0.0%) | 27 (100.0%) |
| 45 to 54 Years | 63 (27.3%) | 231 (100.0%) |
| 55 to 64 Years | 62 (50.8%) | 60 (49.2%) |
| 65 to 74 Years | 136 (100.0%) | 102 (75.0%) |
| 75 Years and over | 345 (100.0%) | 301 (87.3%) |
| Total | 723 (64.5%) | 903 (80.6%) |
Disability Status by Sex by Age in Inkerman
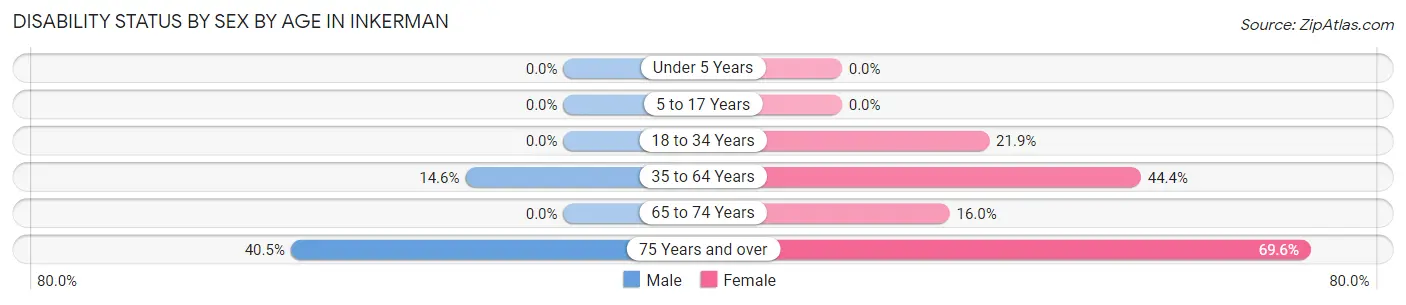
| Age Bracket | Male | Female |
| Under 5 Years | 0 (0.0%) | 0 (0.0%) |
| 5 to 17 Years | 0 (0.0%) | 0 (0.0%) |
| 18 to 34 Years | 0 (0.0%) | 21 (21.9%) |
| 35 to 64 Years | 15 (14.6%) | 123 (44.4%) |
| 65 to 74 Years | 0 (0.0%) | 16 (16.0%) |
| 75 Years and over | 17 (40.5%) | 211 (69.6%) |
Disability Class by Sex by Age in Inkerman
Disability Class: Hearing Difficulty
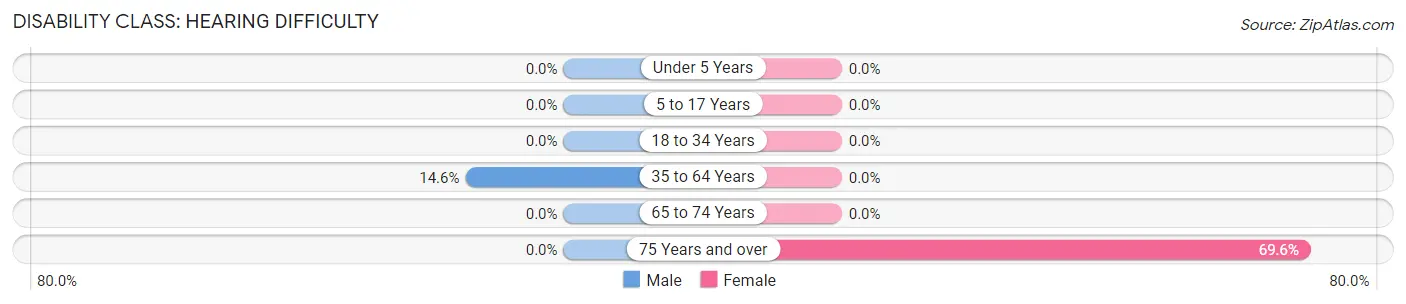
| Age Bracket | Male | Female |
| Under 5 Years | 0 (0.0%) | 0 (0.0%) |
| 5 to 17 Years | 0 (0.0%) | 0 (0.0%) |
| 18 to 34 Years | 0 (0.0%) | 0 (0.0%) |
| 35 to 64 Years | 15 (14.6%) | 0 (0.0%) |
| 65 to 74 Years | 0 (0.0%) | 0 (0.0%) |
| 75 Years and over | 0 (0.0%) | 211 (69.6%) |
Disability Class: Vision Difficulty
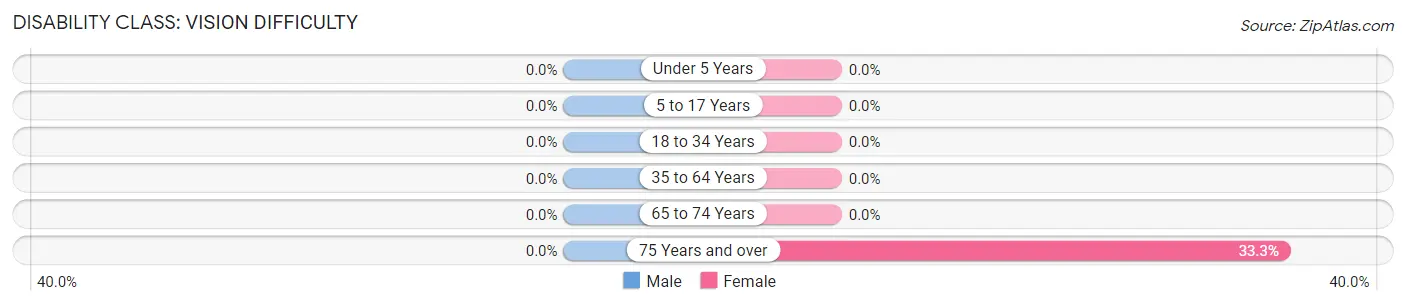
| Age Bracket | Male | Female |
| Under 5 Years | 0 (0.0%) | 0 (0.0%) |
| 5 to 17 Years | 0 (0.0%) | 0 (0.0%) |
| 18 to 34 Years | 0 (0.0%) | 0 (0.0%) |
| 35 to 64 Years | 0 (0.0%) | 0 (0.0%) |
| 65 to 74 Years | 0 (0.0%) | 0 (0.0%) |
| 75 Years and over | 0 (0.0%) | 101 (33.3%) |
Disability Class: Cognitive Difficulty
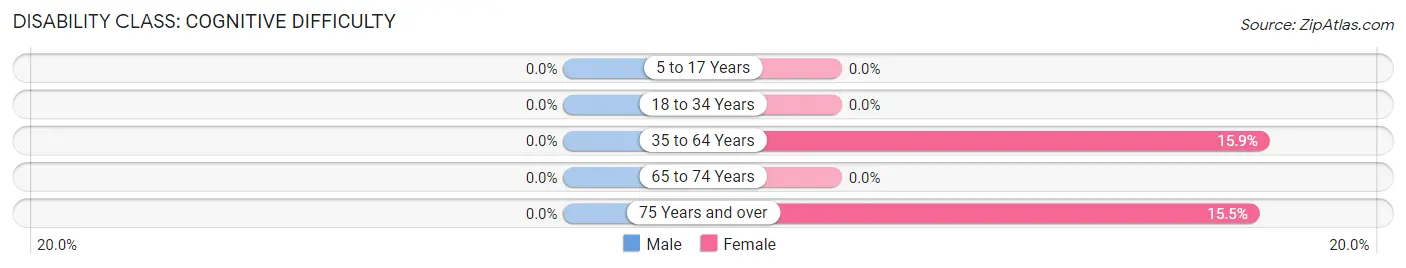
| Age Bracket | Male | Female |
| 5 to 17 Years | 0 (0.0%) | 0 (0.0%) |
| 18 to 34 Years | 0 (0.0%) | 0 (0.0%) |
| 35 to 64 Years | 0 (0.0%) | 44 (15.9%) |
| 65 to 74 Years | 0 (0.0%) | 0 (0.0%) |
| 75 Years and over | 0 (0.0%) | 47 (15.5%) |
Disability Class: Ambulatory Difficulty
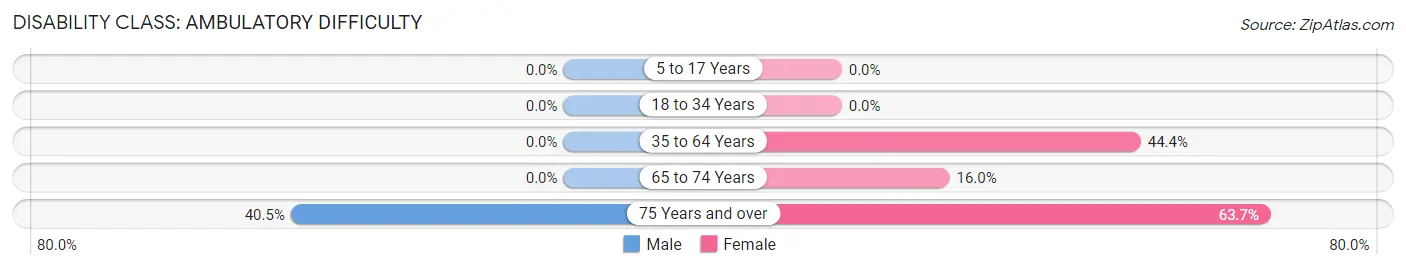
| Age Bracket | Male | Female |
| 5 to 17 Years | 0 (0.0%) | 0 (0.0%) |
| 18 to 34 Years | 0 (0.0%) | 0 (0.0%) |
| 35 to 64 Years | 0 (0.0%) | 123 (44.4%) |
| 65 to 74 Years | 0 (0.0%) | 16 (16.0%) |
| 75 Years and over | 17 (40.5%) | 193 (63.7%) |
Disability Class: Self-Care Difficulty
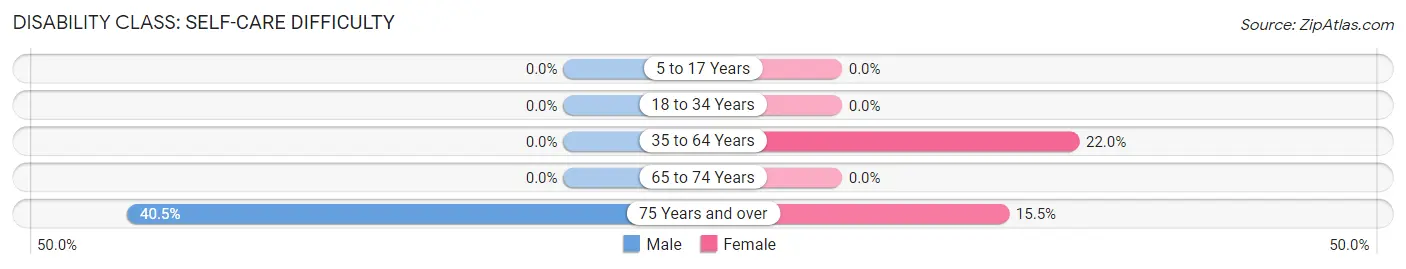
| Age Bracket | Male | Female |
| 5 to 17 Years | 0 (0.0%) | 0 (0.0%) |
| 18 to 34 Years | 0 (0.0%) | 0 (0.0%) |
| 35 to 64 Years | 0 (0.0%) | 61 (22.0%) |
| 65 to 74 Years | 0 (0.0%) | 0 (0.0%) |
| 75 Years and over | 17 (40.5%) | 47 (15.5%) |
Technology Access in Inkerman
Computing Device Access in Inkerman
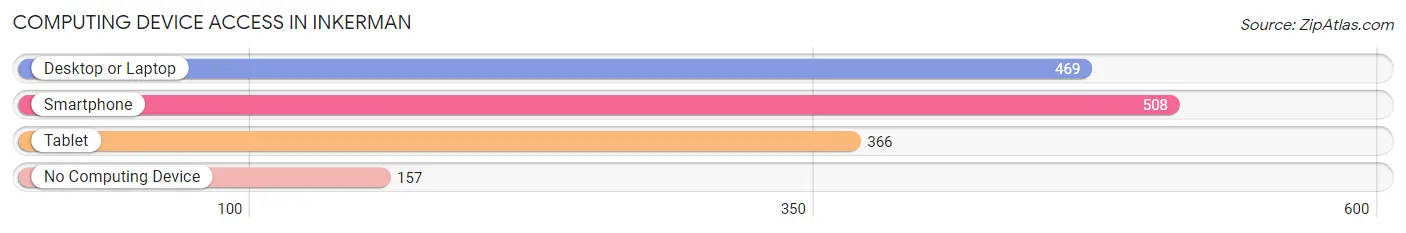
| Device Type | # Households | % Households |
| Desktop or Laptop | 469 | 60.9% |
| Smartphone | 508 | 66.0% |
| Tablet | 366 | 47.5% |
| No Computing Device | 157 | 20.4% |
| Total | 770 | 100.0% |
Internet Access in Inkerman
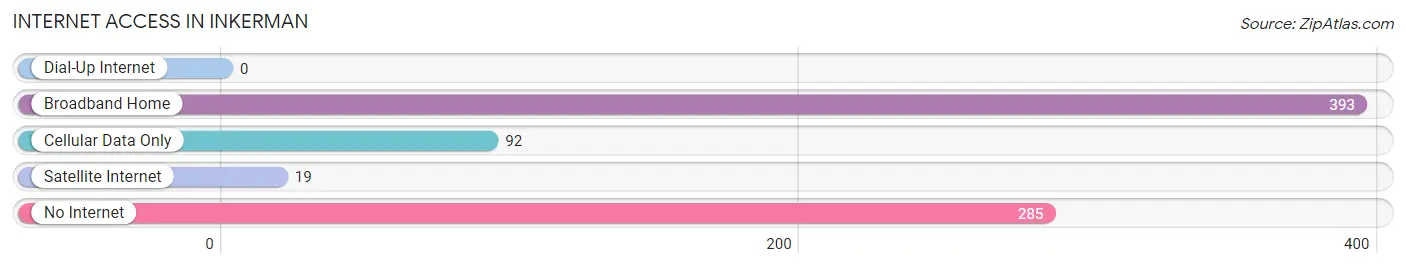
| Internet Type | # Households | % Households |
| Dial-Up Internet | 0 | 0.0% |
| Broadband Home | 393 | 51.0% |
| Cellular Data Only | 92 | 11.9% |
| Satellite Internet | 19 | 2.5% |
| No Internet | 285 | 37.0% |
| Total | 770 | 100.0% |
Inkerman Summary
Inkerman, Pennsylvania is a small borough located in the northeastern corner of Northumberland County. It is situated along the Susquehanna River, approximately 10 miles south of the city of Sunbury. The borough was incorporated in 1876 and has a population of approximately 1,000 people.
History
Inkerman was first settled in the late 1700s by German immigrants. The town was originally known as “Inkerman’s Mill” and was named after the Inkerman family who owned a grist mill in the area. The town was officially incorporated in 1876 and was named after the Inkerman family.
In the late 1800s, the town was a major hub for the lumber industry. The lumber industry was a major source of employment for the town’s residents and helped to fuel the local economy. The lumber industry eventually declined in the early 1900s, but the town continued to thrive due to its proximity to the Susquehanna River.
In the early 1900s, the town was home to several factories, including a paper mill, a brickyard, and a tannery. These factories provided employment for many of the town’s residents and helped to fuel the local economy.
Geography
Inkerman is located in the northeastern corner of Northumberland County, approximately 10 miles south of the city of Sunbury. The borough is situated along the Susquehanna River and is bordered by the townships of Upper Augusta, Lower Augusta, and Point Township. The borough is approximately 1.5 square miles in size and is home to approximately 1,000 people.
The terrain of Inkerman is mostly flat and is covered with a mix of farmland and wooded areas. The borough is located in the Appalachian Mountains and is surrounded by rolling hills and valleys. The climate in Inkerman is generally mild, with temperatures ranging from the low 30s in the winter to the mid-80s in the summer.
Economy
Inkerman’s economy is largely based on agriculture and tourism. The town is home to several farms, which produce a variety of crops, including corn, soybeans, and hay. The town is also home to several tourist attractions, including the Susquehanna River, the Appalachian Trail, and the nearby state parks.
In addition to agriculture and tourism, Inkerman is home to several small businesses, including restaurants, retail stores, and service providers. The town is also home to several manufacturing companies, including a paper mill, a brickyard, and a tannery.
Demographics
As of the 2010 census, Inkerman had a population of 1,000 people. The racial makeup of the town was 97.2% White, 0.7% African American, 0.3% Native American, 0.2% Asian, and 1.6% from other races. The median household income in Inkerman was $37,500, and the median family income was $45,000.
Inkerman is a small, rural town with a close-knit community. The town is home to several churches, a volunteer fire department, and a public library. The town is also home to several parks and recreational areas, including a public swimming pool and a skate park.
Common Questions
What is Per Capita Income in Inkerman?
Per Capita income in Inkerman is $34,450.
What is the Median Family Income in Inkerman?
Median Family Income in Inkerman is $50,956.
What is the Median Household income in Inkerman?
Median Household Income in Inkerman is $39,324.
What is Inequality or Gini Index in Inkerman?
Inequality or Gini Index in Inkerman is 0.50.
What is the Total Population of Inkerman?
Total Population of Inkerman is 1,304.
What is the Total Male Population of Inkerman?
Total Male Population of Inkerman is 292.
What is the Total Female Population of Inkerman?
Total Female Population of Inkerman is 1,012.
What is the Ratio of Males per 100 Females in Inkerman?
There are 28.85 Males per 100 Females in Inkerman.
What is the Ratio of Females per 100 Males in Inkerman?
There are 346.58 Females per 100 Males in Inkerman.
What is the Median Population Age in Inkerman?
Median Population Age in Inkerman is 65.2 Years.
What is the Average Family Size in Inkerman
Average Family Size in Inkerman is 2.4 People.
What is the Average Household Size in Inkerman
Average Household Size in Inkerman is 1.4 People.
How Large is the Labor Force in Inkerman?
There are 366 People in the Labor Forcein in Inkerman.
What is the Percentage of People in the Labor Force in Inkerman?
31.0% of People are in the Labor Force in Inkerman.
What is the Unemployment Rate in Inkerman?
Unemployment Rate in Inkerman is 5.7%.