Bressler, PA Map & Demographics
Bressler Map
Bressler Overview
$32,771
PER CAPITA INCOME
$88,480
AVG FAMILY INCOME
$83,000
AVG HOUSEHOLD INCOME
20.3%
WAGE / INCOME GAP [ % ]
79.7¢/ $1
WAGE / INCOME GAP [ $ ]
0.43
INEQUALITY / GINI INDEX
2,220
TOTAL POPULATION
1,173
MALE POPULATION
1,047
FEMALE POPULATION
112.03
MALES / 100 FEMALES
89.26
FEMALES / 100 MALES
44.1
MEDIAN AGE
3.7
AVG FAMILY SIZE
2.9
AVG HOUSEHOLD SIZE
1,122
LABOR FORCE [ PEOPLE ]
66.4%
PERCENT IN LABOR FORCE
0.9%
UNEMPLOYMENT RATE
Bressler Area Codes
Income in Bressler
Income Overview in Bressler
Per Capita Income in Bressler is $32,771, while median incomes of families and households are $88,480 and $83,000 respectively.
| Characteristic | Number | Measure |
| Per Capita Income | 2,220 | $32,771 |
| Median Family Income | 536 | $88,480 |
| Mean Family Income | 536 | $80,681 |
| Median Household Income | 752 | $83,000 |
| Mean Household Income | 752 | $96,866 |
| Income Deficit | 536 | $0 |
| Wage / Income Gap (%) | 2,220 | 20.25% |
| Wage / Income Gap ($) | 2,220 | 79.75¢ per $1 |
| Gini / Inequality Index | 2,220 | 0.43 |
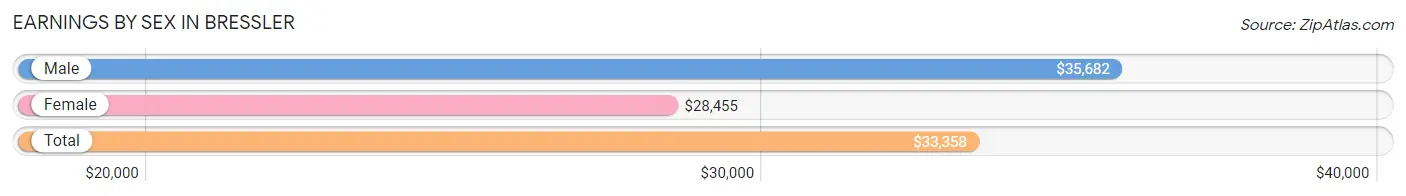
Earnings by Sex in Bressler
Average Earnings in Bressler are $33,358, $35,682 for men and $28,455 for women, a difference of 20.3%.
| Sex | Number | Average Earnings |
| Male | 694 (59.0%) | $35,682 |
| Female | 483 (41.0%) | $28,455 |
| Total | 1,177 (100.0%) | $33,358 |
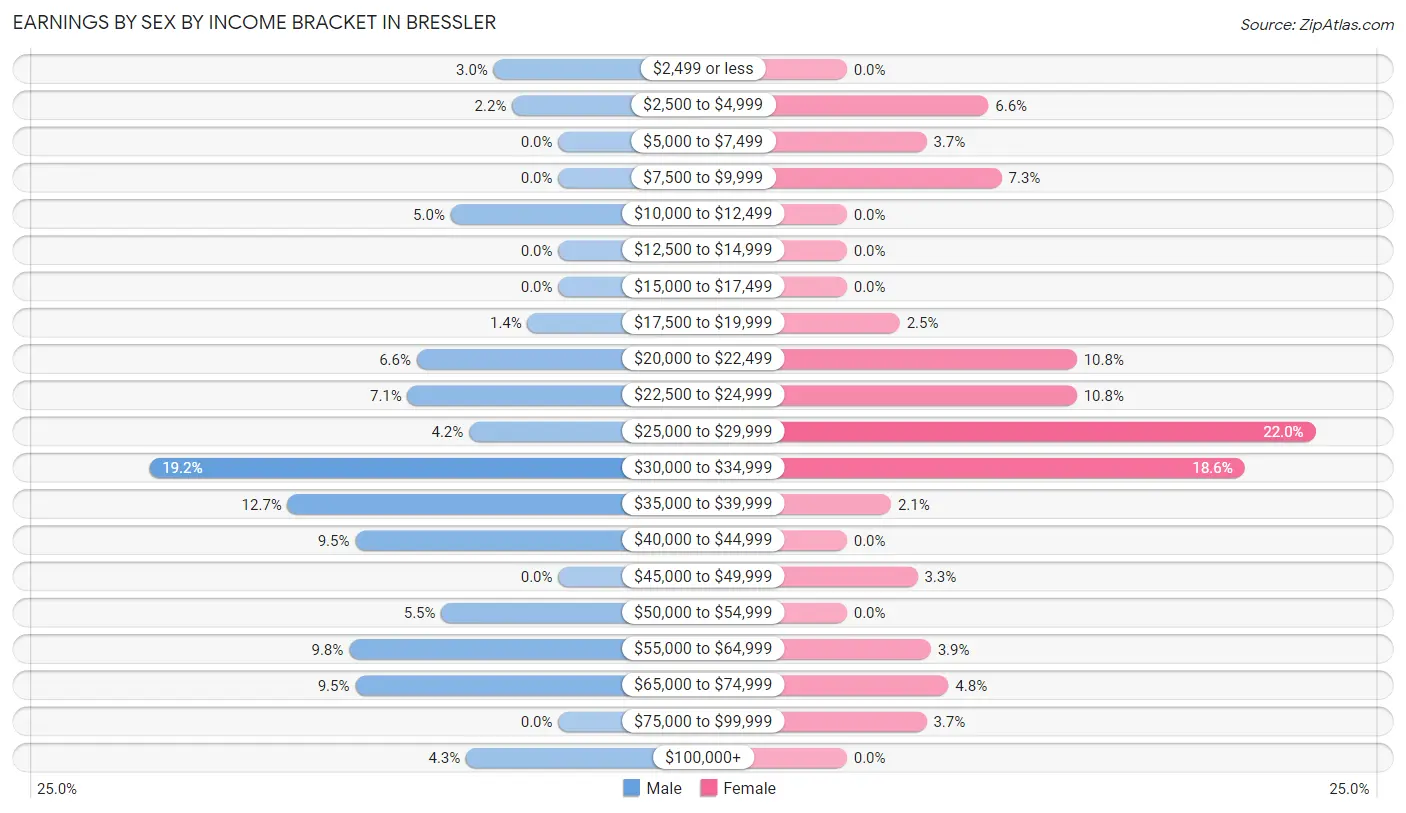
Earnings by Sex by Income Bracket in Bressler
The most common earnings brackets in Bressler are $30,000 to $34,999 for men (133 | 19.2%) and $25,000 to $29,999 for women (106 | 22.0%).
| Income | Male | Female |
| $2,499 or less | 21 (3.0%) | 0 (0.0%) |
| $2,500 to $4,999 | 15 (2.2%) | 32 (6.6%) |
| $5,000 to $7,499 | 0 (0.0%) | 18 (3.7%) |
| $7,500 to $9,999 | 0 (0.0%) | 35 (7.2%) |
| $10,000 to $12,499 | 35 (5.0%) | 0 (0.0%) |
| $12,500 to $14,999 | 0 (0.0%) | 0 (0.0%) |
| $15,000 to $17,499 | 0 (0.0%) | 0 (0.0%) |
| $17,500 to $19,999 | 10 (1.4%) | 12 (2.5%) |
| $20,000 to $22,499 | 46 (6.6%) | 52 (10.8%) |
| $22,500 to $24,999 | 49 (7.1%) | 52 (10.8%) |
| $25,000 to $29,999 | 29 (4.2%) | 106 (22.0%) |
| $30,000 to $34,999 | 133 (19.2%) | 90 (18.6%) |
| $35,000 to $39,999 | 88 (12.7%) | 10 (2.1%) |
| $40,000 to $44,999 | 66 (9.5%) | 0 (0.0%) |
| $45,000 to $49,999 | 0 (0.0%) | 16 (3.3%) |
| $50,000 to $54,999 | 38 (5.5%) | 0 (0.0%) |
| $55,000 to $64,999 | 68 (9.8%) | 19 (3.9%) |
| $65,000 to $74,999 | 66 (9.5%) | 23 (4.8%) |
| $75,000 to $99,999 | 0 (0.0%) | 18 (3.7%) |
| $100,000+ | 30 (4.3%) | 0 (0.0%) |
| Total | 694 (100.0%) | 483 (100.0%) |
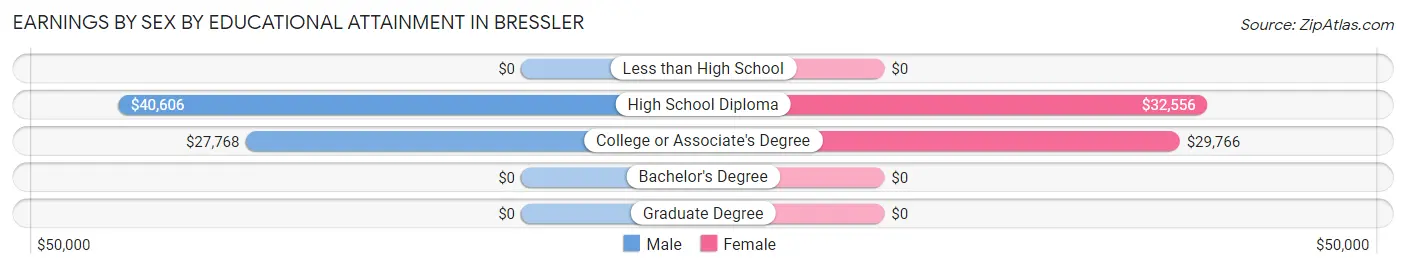
Earnings by Sex by Educational Attainment in Bressler
Average earnings in Bressler are $37,424 for men and $28,833 for women, a difference of 23.0%. Men with an educational attainment of high school diploma enjoy the highest average annual earnings of $40,606, while those with college or associate's degree education earn the least with $27,768. Women with an educational attainment of high school diploma earn the most with the average annual earnings of $32,556, while those with college or associate's degree education have the smallest earnings of $29,766.
| Educational Attainment | Male Income | Female Income |
| Less than High School | - | - |
| High School Diploma | $40,606 | $32,556 |
| College or Associate's Degree | $27,768 | $29,766 |
| Bachelor's Degree | - | - |
| Graduate Degree | - | - |
| Total | $37,424 | $28,833 |
Family Income in Bressler
Family Income Brackets in Bressler
According to the Bressler family income data, there are 217 families falling into the $75,000 to $99,999 income range, which is the most common income bracket and makes up 40.5% of all families.
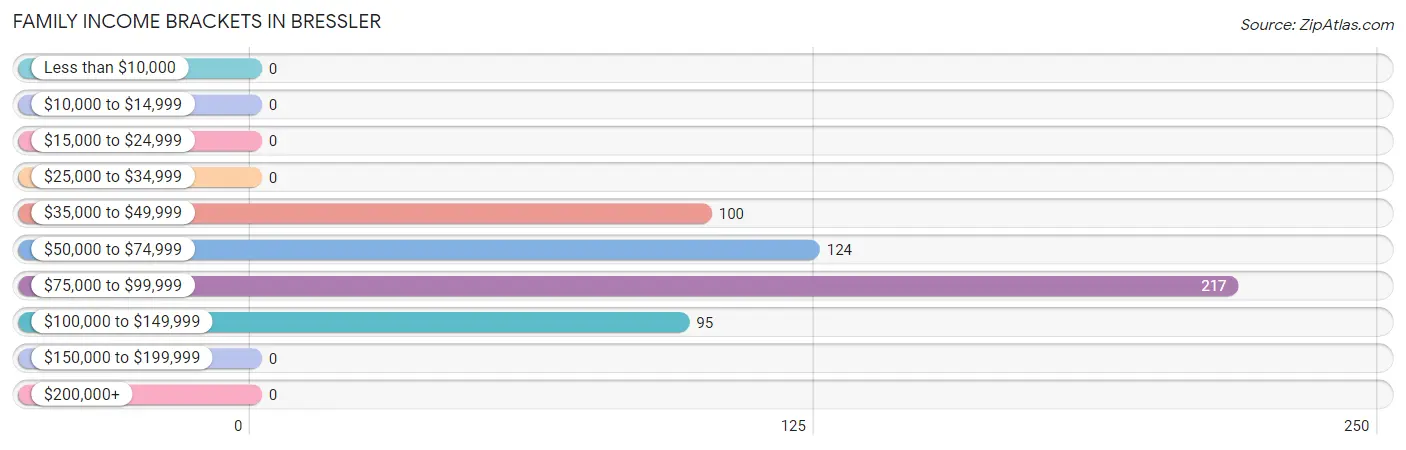
| Income Bracket | # Families | % Families |
| Less than $10,000 | 0 | 0.0% |
| $10,000 to $14,999 | 0 | 0.0% |
| $15,000 to $24,999 | 0 | 0.0% |
| $25,000 to $34,999 | 0 | 0.0% |
| $35,000 to $49,999 | 100 | 18.7% |
| $50,000 to $74,999 | 124 | 23.1% |
| $75,000 to $99,999 | 217 | 40.5% |
| $100,000 to $149,999 | 95 | 17.7% |
| $150,000 to $199,999 | 0 | 0.0% |
| $200,000+ | 0 | 0.0% |
Family Income by Famaliy Size in Bressler
2-person families (137 | 25.6%) account for the highest median family income in Bressler with $92,768 per family, while 2-person families (137 | 25.6%) have the highest median income of $46,384 per family member.
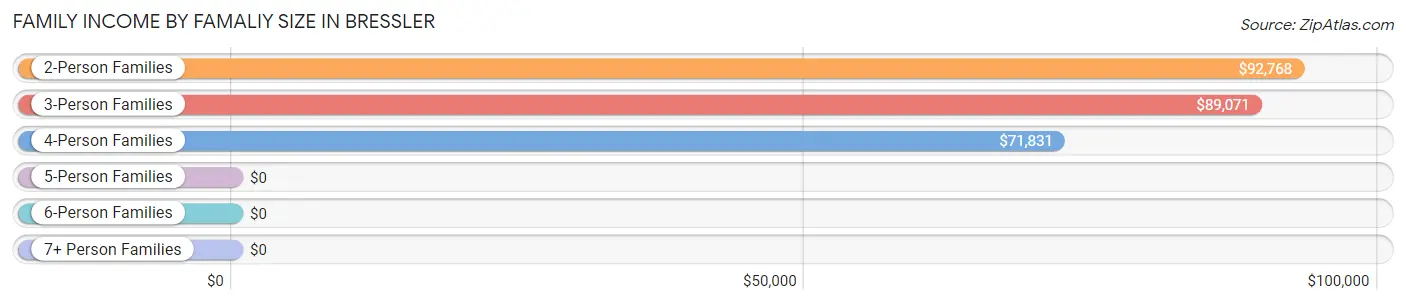
| Income Bracket | # Families | Median Income |
| 2-Person Families | 137 (25.6%) | $92,768 |
| 3-Person Families | 163 (30.4%) | $89,071 |
| 4-Person Families | 133 (24.8%) | $71,831 |
| 5-Person Families | 44 (8.2%) | $0 |
| 6-Person Families | 18 (3.4%) | $0 |
| 7+ Person Families | 41 (7.6%) | $0 |
| Total | 536 (100.0%) | $88,480 |
Family Income by Number of Earners in Bressler
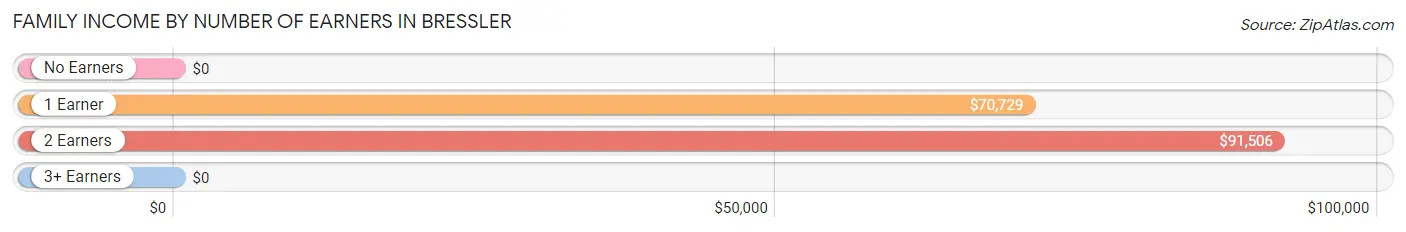
| Number of Earners | # Families | Median Income |
| No Earners | 11 (2.1%) | $0 |
| 1 Earner | 45 (8.4%) | $70,729 |
| 2 Earners | 365 (68.1%) | $91,506 |
| 3+ Earners | 115 (21.5%) | $0 |
| Total | 536 (100.0%) | $88,480 |
Household Income in Bressler
Household Income Brackets in Bressler
With 227 households falling in the category, the $75,000 to $99,999 income range is the most frequent in Bressler, accounting for 30.2% of all households.
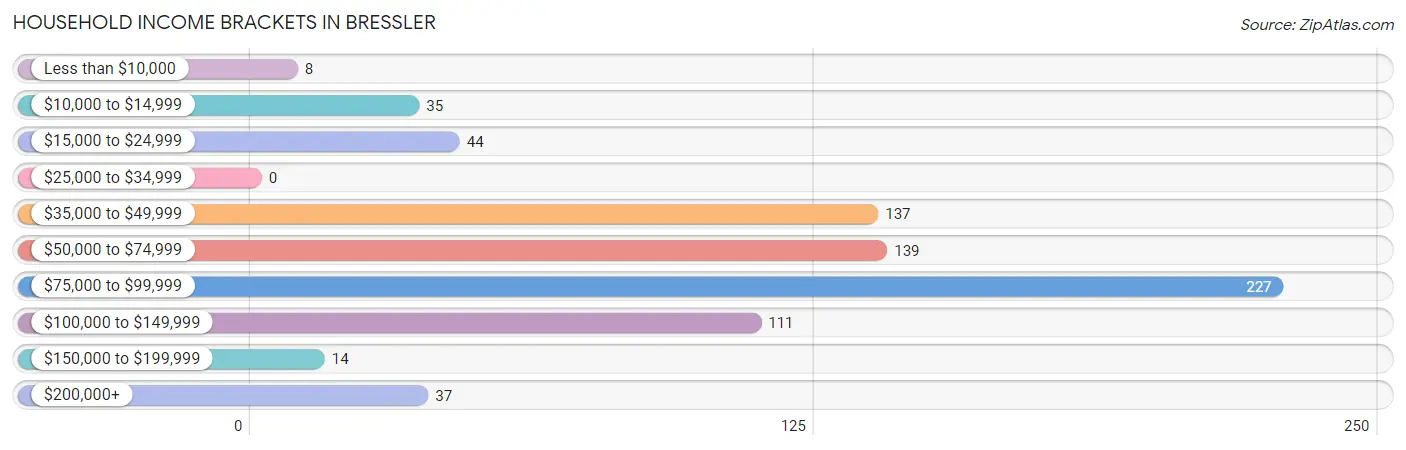
| Income Bracket | # Households | % Households |
| Less than $10,000 | 8 | 1.1% |
| $10,000 to $14,999 | 35 | 4.7% |
| $15,000 to $24,999 | 44 | 5.9% |
| $25,000 to $34,999 | 0 | 0.0% |
| $35,000 to $49,999 | 137 | 18.2% |
| $50,000 to $74,999 | 139 | 18.5% |
| $75,000 to $99,999 | 227 | 30.2% |
| $100,000 to $149,999 | 111 | 14.8% |
| $150,000 to $199,999 | 14 | 1.9% |
| $200,000+ | 37 | 4.9% |
Household Income by Householder Age in Bressler
The median household income in Bressler is $83,000, with the highest median household income of $89,493 found in the 45 to 64 years age bracket for the primary householder. A total of 372 households (49.5%) fall into this category.
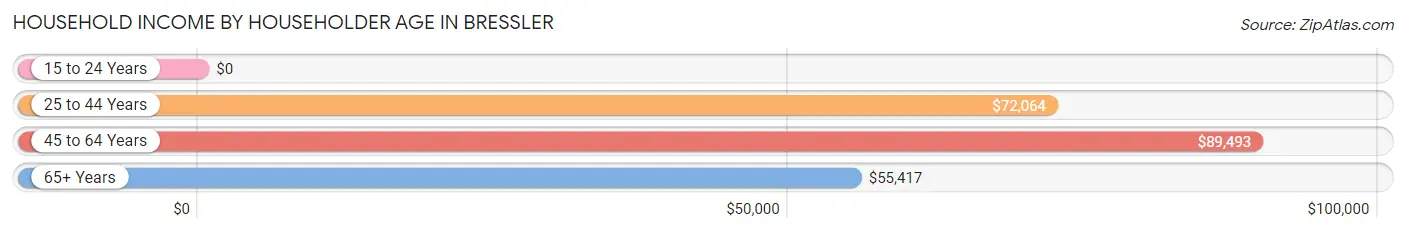
| Income Bracket | # Households | Median Income |
| 15 to 24 Years | 0 (0.0%) | $0 |
| 25 to 44 Years | 151 (20.1%) | $72,064 |
| 45 to 64 Years | 372 (49.5%) | $89,493 |
| 65+ Years | 229 (30.4%) | $55,417 |
| Total | 752 (100.0%) | $83,000 |
Poverty in Bressler
Income Below Poverty by Sex and Age in Bressler
With 2.6% poverty level for males and 2.0% for females among the residents of Bressler, 25 to 34 year old males and 75 year old and over females are the most vulnerable to poverty, with 31 males (15.7%) and 13 females (23.6%) in their respective age groups living below the poverty level.
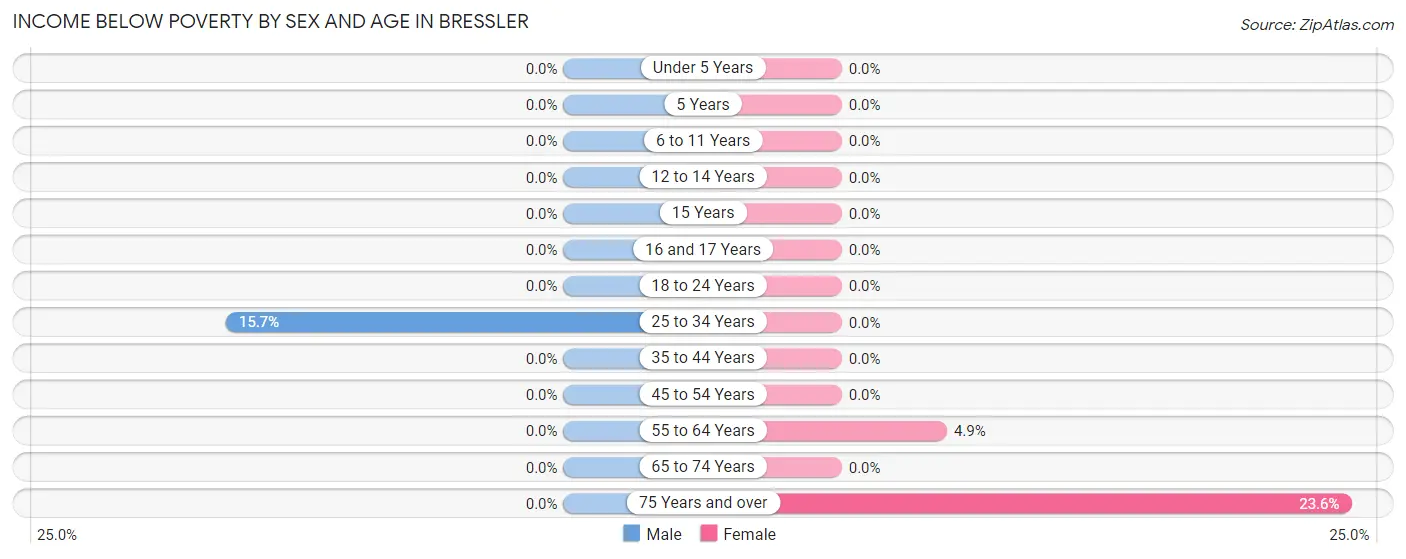
| Age Bracket | Male | Female |
| Under 5 Years | 0 (0.0%) | 0 (0.0%) |
| 5 Years | 0 (0.0%) | 0 (0.0%) |
| 6 to 11 Years | 0 (0.0%) | 0 (0.0%) |
| 12 to 14 Years | 0 (0.0%) | 0 (0.0%) |
| 15 Years | 0 (0.0%) | 0 (0.0%) |
| 16 and 17 Years | 0 (0.0%) | 0 (0.0%) |
| 18 to 24 Years | 0 (0.0%) | 0 (0.0%) |
| 25 to 34 Years | 31 (15.7%) | 0 (0.0%) |
| 35 to 44 Years | 0 (0.0%) | 0 (0.0%) |
| 45 to 54 Years | 0 (0.0%) | 0 (0.0%) |
| 55 to 64 Years | 0 (0.0%) | 8 (4.9%) |
| 65 to 74 Years | 0 (0.0%) | 0 (0.0%) |
| 75 Years and over | 0 (0.0%) | 13 (23.6%) |
| Total | 31 (2.6%) | 21 (2.0%) |
Income Above Poverty by Sex and Age in Bressler
According to the poverty statistics in Bressler, males aged under 5 years and females aged 5 years are the age groups that are most secure financially, with 100.0% of males and 100.0% of females in these age groups living above the poverty line.
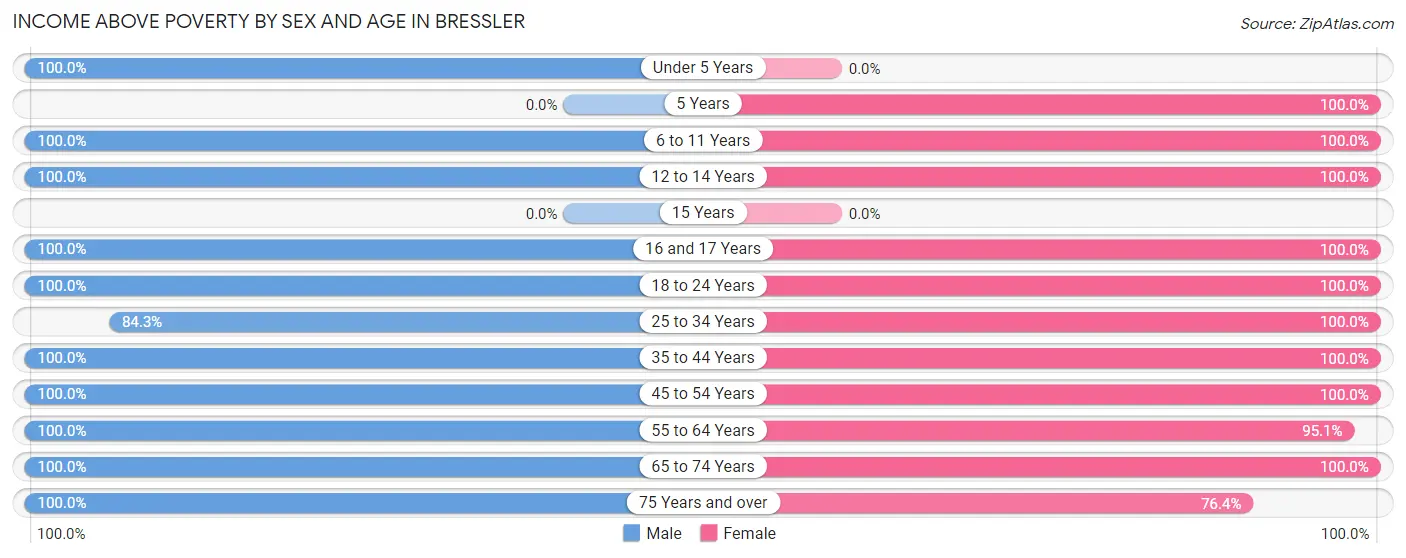
| Age Bracket | Male | Female |
| Under 5 Years | 132 (100.0%) | 0 (0.0%) |
| 5 Years | 0 (0.0%) | 72 (100.0%) |
| 6 to 11 Years | 68 (100.0%) | 124 (100.0%) |
| 12 to 14 Years | 88 (100.0%) | 46 (100.0%) |
| 15 Years | 0 (0.0%) | 0 (0.0%) |
| 16 and 17 Years | 81 (100.0%) | 20 (100.0%) |
| 18 to 24 Years | 10 (100.0%) | 32 (100.0%) |
| 25 to 34 Years | 167 (84.3%) | 127 (100.0%) |
| 35 to 44 Years | 91 (100.0%) | 70 (100.0%) |
| 45 to 54 Years | 119 (100.0%) | 202 (100.0%) |
| 55 to 64 Years | 325 (100.0%) | 156 (95.1%) |
| 65 to 74 Years | 27 (100.0%) | 135 (100.0%) |
| 75 Years and over | 34 (100.0%) | 42 (76.4%) |
| Total | 1,142 (97.4%) | 1,026 (98.0%) |
Income Below Poverty Among Married-Couple Families in Bressler
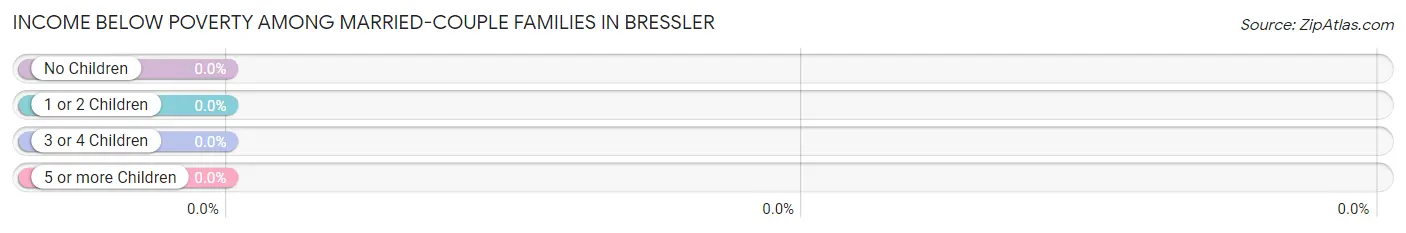
| Children | Above Poverty | Below Poverty |
| No Children | 296 (100.0%) | 0 (0.0%) |
| 1 or 2 Children | 78 (100.0%) | 0 (0.0%) |
| 3 or 4 Children | 62 (100.0%) | 0 (0.0%) |
| 5 or more Children | 0 (0.0%) | 0 (0.0%) |
| Total | 436 (100.0%) | 0 (0.0%) |
Income Below Poverty Among Single-Parent Households in Bressler
| Children | Single Father | Single Mother |
| No Children | 0 (0.0%) | 0 (0.0%) |
| 1 or 2 Children | 0 (0.0%) | 0 (0.0%) |
| 3 or 4 Children | 0 (0.0%) | 0 (0.0%) |
| 5 or more Children | 0 (0.0%) | 0 (0.0%) |
| Total | 0 (0.0%) | 0 (0.0%) |
Income Below Poverty Among Married-Couple vs Single-Parent Households in Bressler
| Children | Married-Couple Families | Single-Parent Households |
| No Children | 0 (0.0%) | 0 (0.0%) |
| 1 or 2 Children | 0 (0.0%) | 0 (0.0%) |
| 3 or 4 Children | 0 (0.0%) | 0 (0.0%) |
| 5 or more Children | 0 (0.0%) | 0 (0.0%) |
| Total | 0 (0.0%) | 0 (0.0%) |
Race in Bressler
The most populous races in Bressler are White / Caucasian (1,462 | 65.9%), Hispanic or Latino (663 | 29.9%), and Two or more Races (453 | 20.4%).
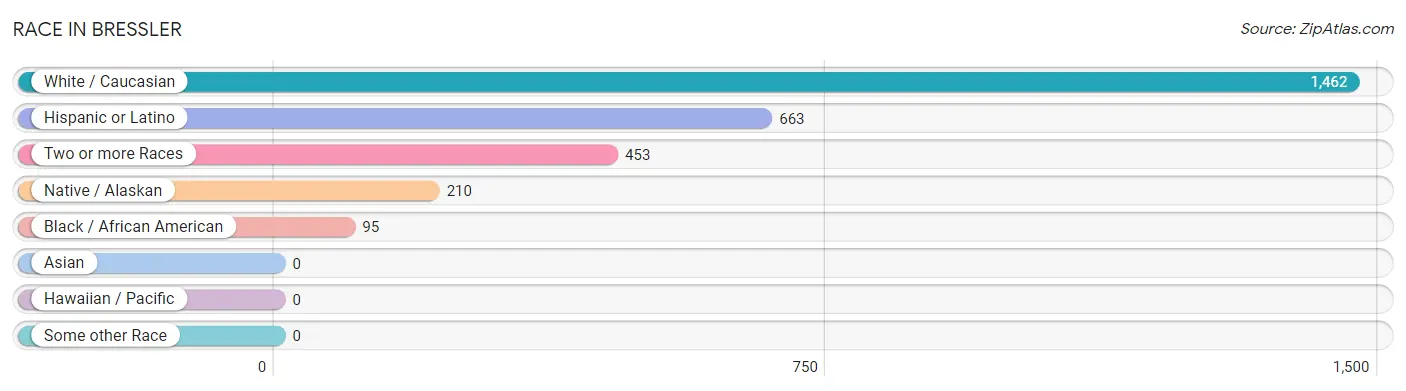
| Race | # Population | % Population |
| Asian | 0 | 0.0% |
| Black / African American | 95 | 4.3% |
| Hawaiian / Pacific | 0 | 0.0% |
| Hispanic or Latino | 663 | 29.9% |
| Native / Alaskan | 210 | 9.5% |
| White / Caucasian | 1,462 | 65.9% |
| Two or more Races | 453 | 20.4% |
| Some other Race | 0 | 0.0% |
| Total | 2,220 | 100.0% |
Ancestry in Bressler
The most populous ancestries reported in Bressler are Mexican (663 | 29.9%), American (294 | 13.2%), German (213 | 9.6%), Mexican American Indian (210 | 9.5%), and Italian (105 | 4.7%), together accounting for 66.9% of all Bressler residents.
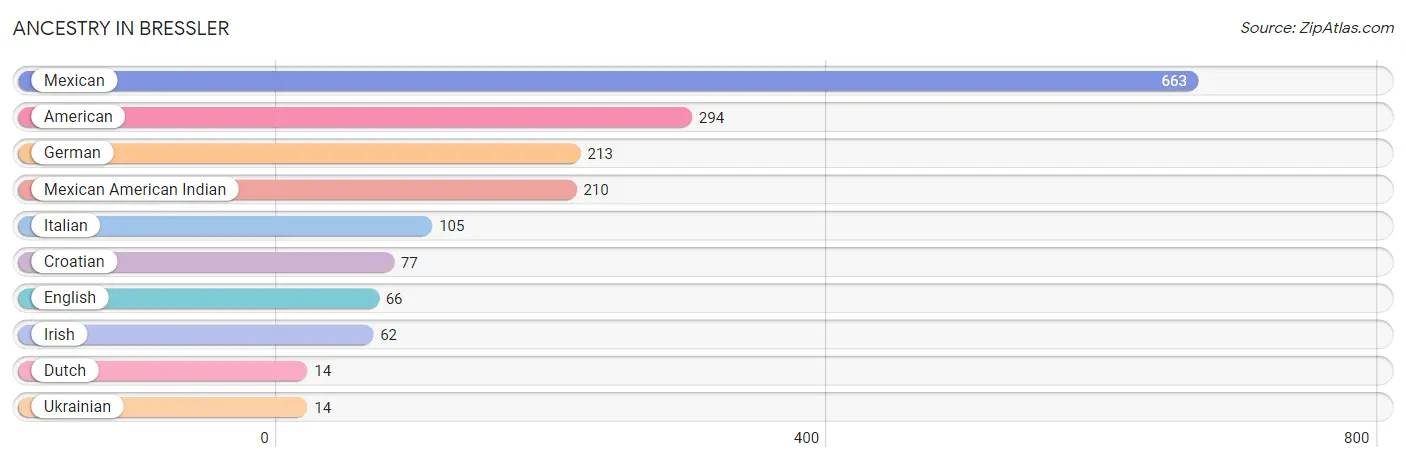
| Ancestry | # Population | % Population |
| American | 294 | 13.2% |
| Croatian | 77 | 3.5% |
| Dutch | 14 | 0.6% |
| English | 66 | 3.0% |
| German | 213 | 9.6% |
| Irish | 62 | 2.8% |
| Italian | 105 | 4.7% |
| Mexican | 663 | 29.9% |
| Mexican American Indian | 210 | 9.5% |
| Ukrainian | 14 | 0.6% | View All 10 Rows |
Immigrants in Bressler
The most numerous immigrant groups reported in Bressler came from Central America (358 | 16.1%), Latin America (358 | 16.1%), Mexico (358 | 16.1%), Bosnia and Herzegovina (104 | 4.7%), and Eastern Europe (104 | 4.7%), together accounting for 57.7% of all Bressler residents.
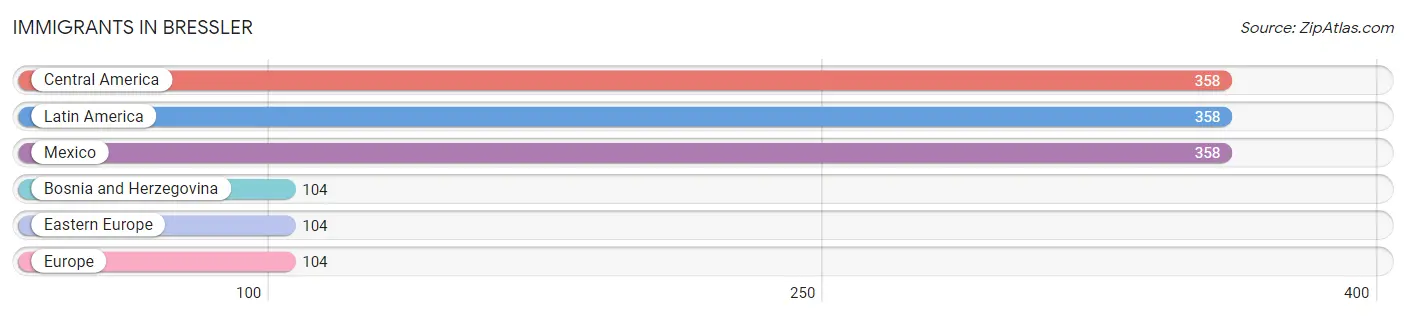
| Immigration Origin | # Population | % Population |
| Bosnia and Herzegovina | 104 | 4.7% |
| Central America | 358 | 16.1% |
| Eastern Europe | 104 | 4.7% |
| Europe | 104 | 4.7% |
| Latin America | 358 | 16.1% |
| Mexico | 358 | 16.1% | View All 6 Rows |
Sex and Age in Bressler
Sex and Age in Bressler
The most populous age groups in Bressler are 55 to 59 Years (178 | 15.2%) for men and 55 to 59 Years (156 | 14.9%) for women.
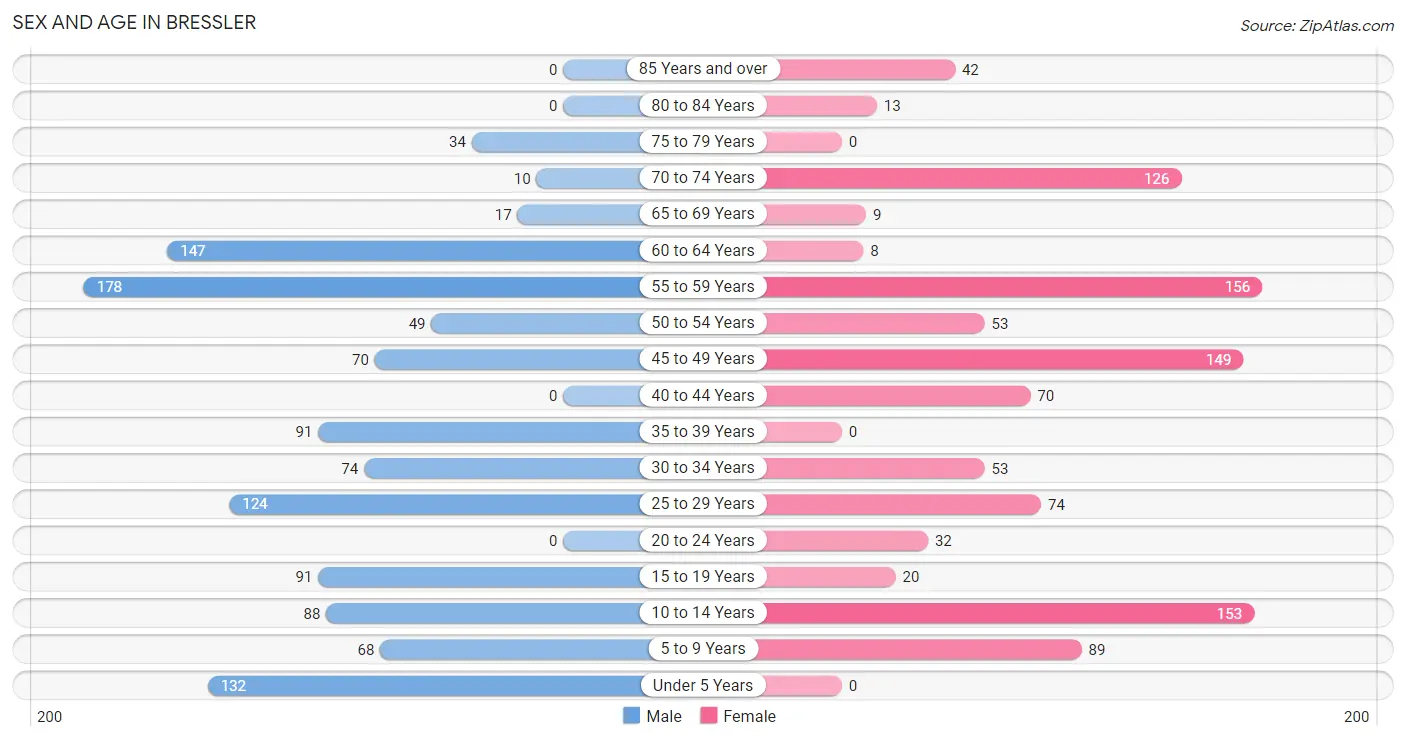
| Age Bracket | Male | Female |
| Under 5 Years | 132 (11.3%) | 0 (0.0%) |
| 5 to 9 Years | 68 (5.8%) | 89 (8.5%) |
| 10 to 14 Years | 88 (7.5%) | 153 (14.6%) |
| 15 to 19 Years | 91 (7.8%) | 20 (1.9%) |
| 20 to 24 Years | 0 (0.0%) | 32 (3.1%) |
| 25 to 29 Years | 124 (10.6%) | 74 (7.1%) |
| 30 to 34 Years | 74 (6.3%) | 53 (5.1%) |
| 35 to 39 Years | 91 (7.8%) | 0 (0.0%) |
| 40 to 44 Years | 0 (0.0%) | 70 (6.7%) |
| 45 to 49 Years | 70 (6.0%) | 149 (14.2%) |
| 50 to 54 Years | 49 (4.2%) | 53 (5.1%) |
| 55 to 59 Years | 178 (15.2%) | 156 (14.9%) |
| 60 to 64 Years | 147 (12.5%) | 8 (0.8%) |
| 65 to 69 Years | 17 (1.5%) | 9 (0.9%) |
| 70 to 74 Years | 10 (0.9%) | 126 (12.0%) |
| 75 to 79 Years | 34 (2.9%) | 0 (0.0%) |
| 80 to 84 Years | 0 (0.0%) | 13 (1.2%) |
| 85 Years and over | 0 (0.0%) | 42 (4.0%) |
| Total | 1,173 (100.0%) | 1,047 (100.0%) |
Families and Households in Bressler
Median Family Size in Bressler
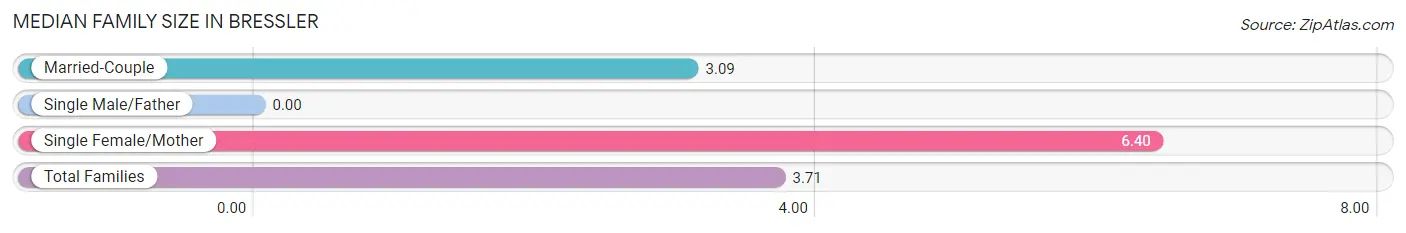
| Family Type | # Families | Family Size |
| Married-Couple | 436 (81.3%) | 3.09 |
| Single Male/Father | 0 (0.0%) | - |
| Single Female/Mother | 100 (18.7%) | 6.40 |
| Total Families | 536 (100.0%) | 3.71 |
Median Household Size in Bressler
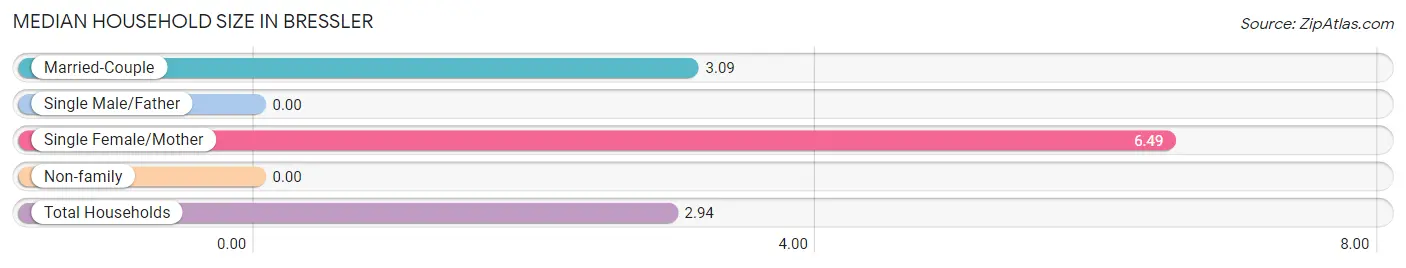
| Household Type | # Households | Household Size |
| Married-Couple | 436 (58.0%) | 3.09 |
| Single Male/Father | 0 (0.0%) | - |
| Single Female/Mother | 100 (13.3%) | 6.49 |
| Non-family | 216 (28.7%) | - |
| Total Households | 752 (100.0%) | 2.94 |
Household Size by Marriage Status in Bressler
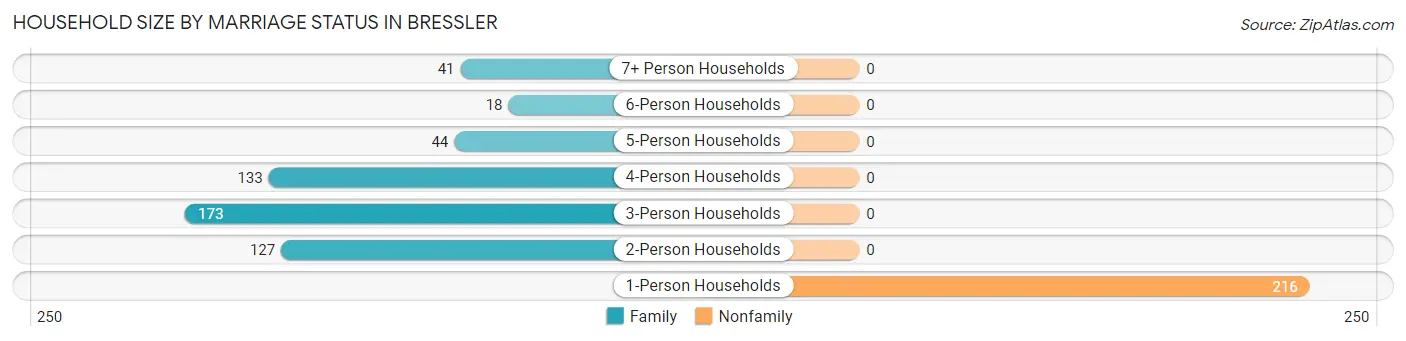
Out of a total of 752 households in Bressler, 536 (71.3%) are family households, while 216 (28.7%) are nonfamily households. The most numerous type of family households are 3-person households, comprising 173, and the most common type of nonfamily households are 1-person households, comprising 216.
| Household Size | Family Households | Nonfamily Households |
| 1-Person Households | - | 216 (28.7%) |
| 2-Person Households | 127 (16.9%) | 0 (0.0%) |
| 3-Person Households | 173 (23.0%) | 0 (0.0%) |
| 4-Person Households | 133 (17.7%) | 0 (0.0%) |
| 5-Person Households | 44 (5.9%) | 0 (0.0%) |
| 6-Person Households | 18 (2.4%) | 0 (0.0%) |
| 7+ Person Households | 41 (5.4%) | 0 (0.0%) |
| Total | 536 (71.3%) | 216 (28.7%) |
Female Fertility in Bressler
Fertility by Age in Bressler
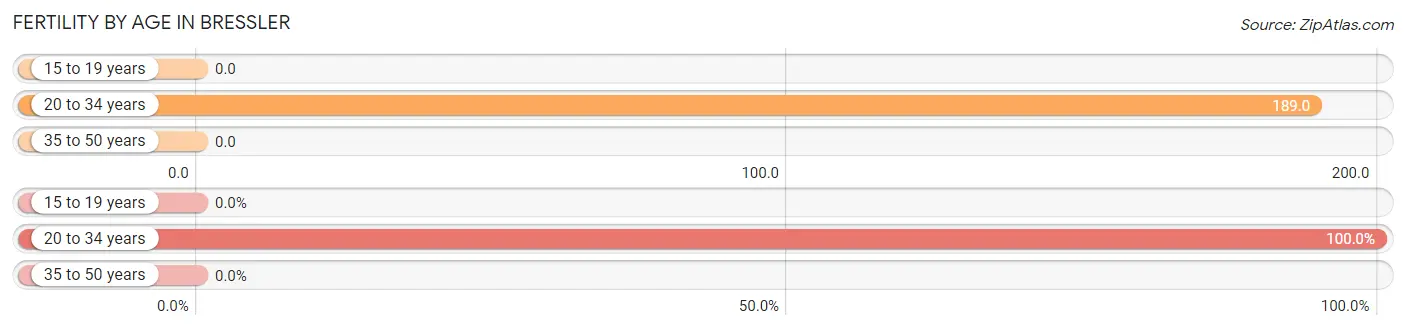
Average fertility rate in Bressler is 75.0 births per 1,000 women. Women in the age bracket of 20 to 34 years have the highest fertility rate with 189.0 births per 1,000 women. Women in the age bracket of 20 to 34 years acount for 100.0% of all women with births.
| Age Bracket | Women with Births | Births / 1,000 Women |
| 15 to 19 years | 0 (0.0%) | 0.0 |
| 20 to 34 years | 30 (100.0%) | 189.0 |
| 35 to 50 years | 0 (0.0%) | 0.0 |
| Total | 30 (100.0%) | 75.0 |
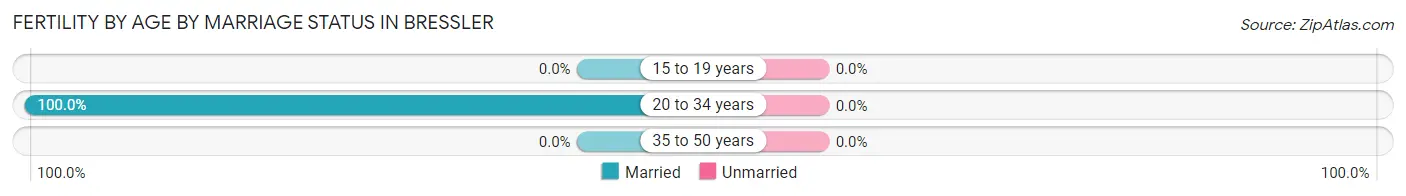
Fertility by Age by Marriage Status in Bressler
| Age Bracket | Married | Unmarried |
| 15 to 19 years | 0 (0.0%) | 0 (0.0%) |
| 20 to 34 years | 30 (100.0%) | 0 (0.0%) |
| 35 to 50 years | 0 (0.0%) | 0 (0.0%) |
| Total | 30 (100.0%) | 0 (0.0%) |
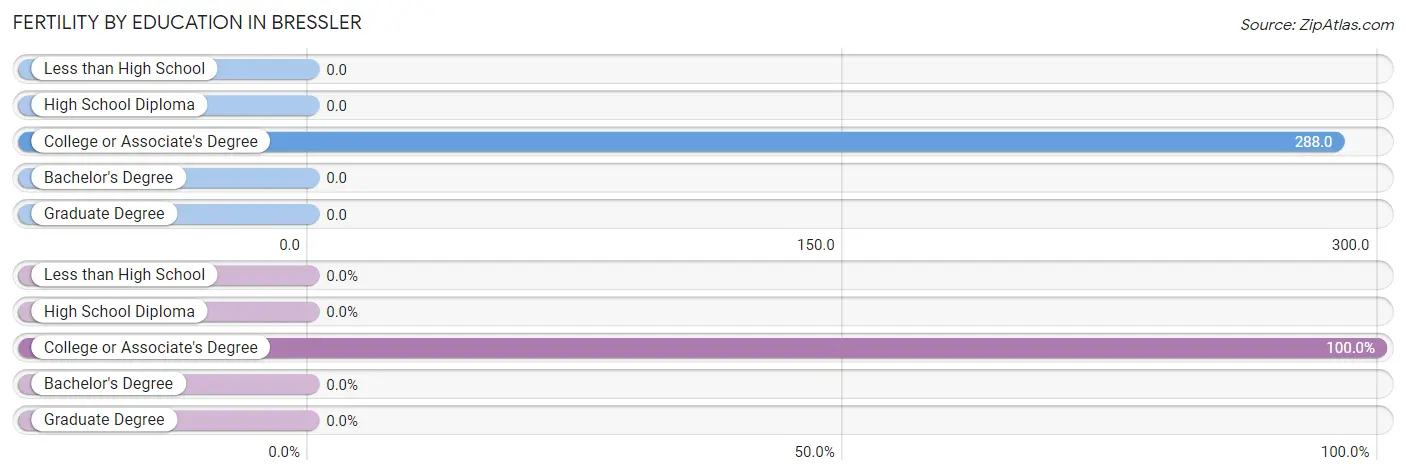
Fertility by Education in Bressler
| Educational Attainment | Women with Births | Births / 1,000 Women |
| Less than High School | 0 (0.0%) | 0.0 |
| High School Diploma | 0 (0.0%) | 0.0 |
| College or Associate's Degree | 30 (100.0%) | 288.0 |
| Bachelor's Degree | 0 (0.0%) | 0.0 |
| Graduate Degree | 0 (0.0%) | 0.0 |
| Total | 30 (100.0%) | 75.0 |
Fertility by Education by Marriage Status in Bressler
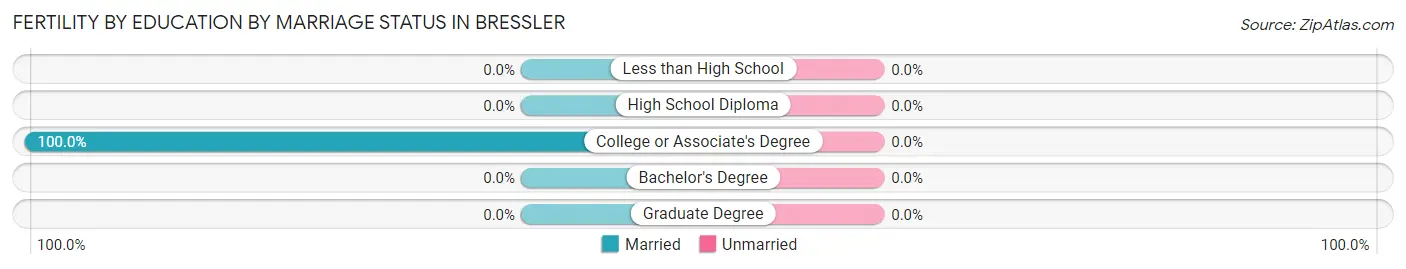
| Educational Attainment | Married | Unmarried |
| Less than High School | 0 (0.0%) | 0 (0.0%) |
| High School Diploma | 0 (0.0%) | 0 (0.0%) |
| College or Associate's Degree | 30 (100.0%) | 0 (0.0%) |
| Bachelor's Degree | 0 (0.0%) | 0 (0.0%) |
| Graduate Degree | 0 (0.0%) | 0 (0.0%) |
| Total | 30 (100.0%) | 0 (0.0%) |
Employment Characteristics in Bressler
Employment by Class of Employer in Bressler
Among the 1,103 employed individuals in Bressler, private company employees (844 | 76.5%), federal government employees (80 | 7.2%), and not-for-profit organizations (57 | 5.2%) make up the most common classes of employment.
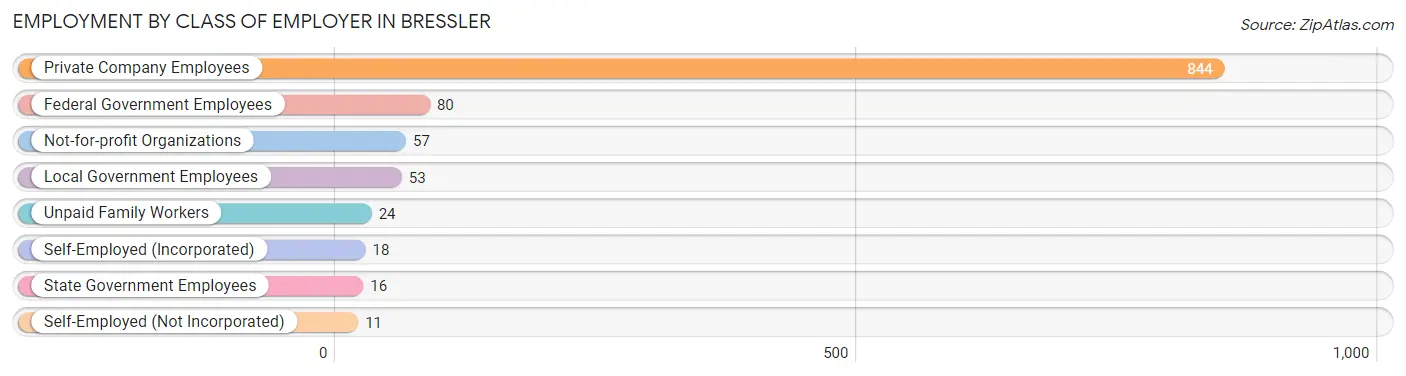
| Employer Class | # Employees | % Employees |
| Private Company Employees | 844 | 76.5% |
| Self-Employed (Incorporated) | 18 | 1.6% |
| Self-Employed (Not Incorporated) | 11 | 1.0% |
| Not-for-profit Organizations | 57 | 5.2% |
| Local Government Employees | 53 | 4.8% |
| State Government Employees | 16 | 1.5% |
| Federal Government Employees | 80 | 7.2% |
| Unpaid Family Workers | 24 | 2.2% |
| Total | 1,103 | 100.0% |
Employment Status by Age in Bressler
According to the labor force statistics for Bressler, out of the total population over 16 years of age (1,690), 66.4% or 1,122 individuals are in the labor force, with 0.9% or 10 of them unemployed. The age group with the highest labor force participation rate is 35 to 44 years, with 100.0% or 161 individuals in the labor force. Within the labor force, the 16 to 19 years age range has the highest percentage of unemployed individuals, with 21.7% or 10 of them being unemployed.
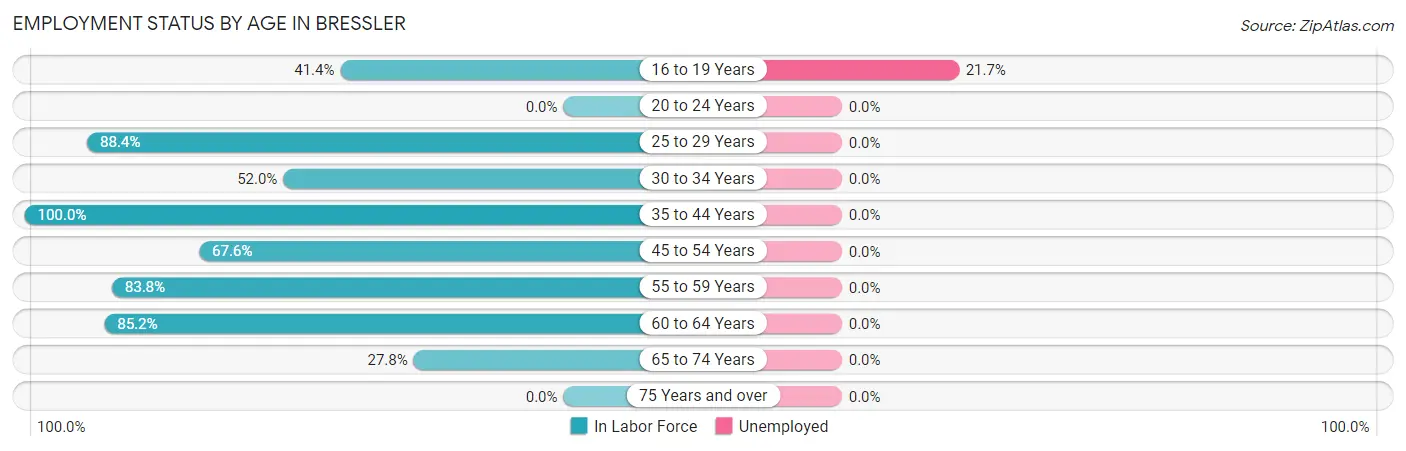
| Age Bracket | In Labor Force | Unemployed |
| 16 to 19 Years | 46 (41.4%) | 10 (21.7%) |
| 20 to 24 Years | 0 (0.0%) | 0 (0.0%) |
| 25 to 29 Years | 175 (88.4%) | 0 (0.0%) |
| 30 to 34 Years | 66 (52.0%) | 0 (0.0%) |
| 35 to 44 Years | 161 (100.0%) | 0 (0.0%) |
| 45 to 54 Years | 217 (67.6%) | 0 (0.0%) |
| 55 to 59 Years | 280 (83.8%) | 0 (0.0%) |
| 60 to 64 Years | 132 (85.2%) | 0 (0.0%) |
| 65 to 74 Years | 45 (27.8%) | 0 (0.0%) |
| 75 Years and over | 0 (0.0%) | 0 (0.0%) |
| Total | 1,122 (66.4%) | 10 (0.9%) |
Employment Status by Educational Attainment in Bressler
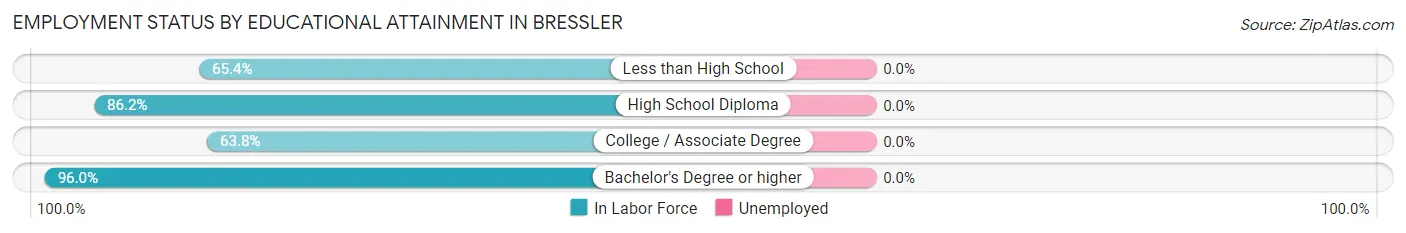
| Educational Attainment | In Labor Force | Unemployed |
| Less than High School | 104 (65.4%) | 0 (0.0%) |
| High School Diploma | 531 (86.2%) | 0 (0.0%) |
| College / Associate Degree | 206 (63.8%) | 0 (0.0%) |
| Bachelor's Degree or higher | 190 (96.0%) | 0 (0.0%) |
| Total | 1,032 (79.6%) | 0 (0.0%) |
Employment Occupations by Sex in Bressler
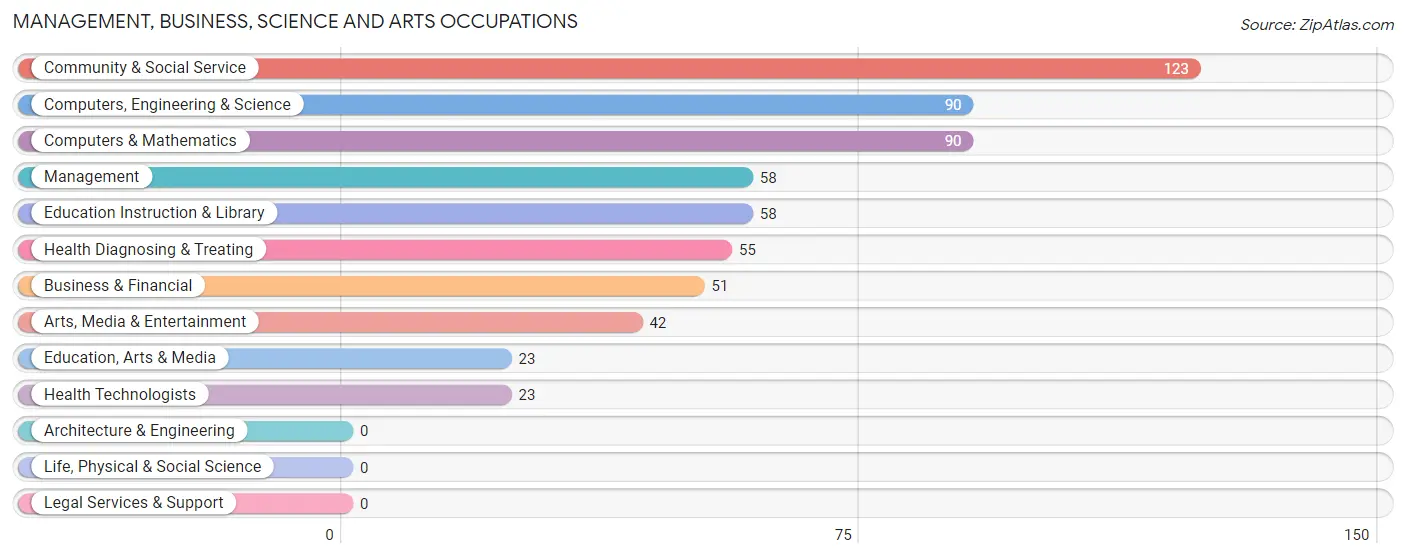
Management, Business, Science and Arts Occupations
The most common Management, Business, Science and Arts occupations in Bressler are Community & Social Service (123 | 11.1%), Computers, Engineering & Science (90 | 8.1%), Computers & Mathematics (90 | 8.1%), Management (58 | 5.2%), and Education Instruction & Library (58 | 5.2%).
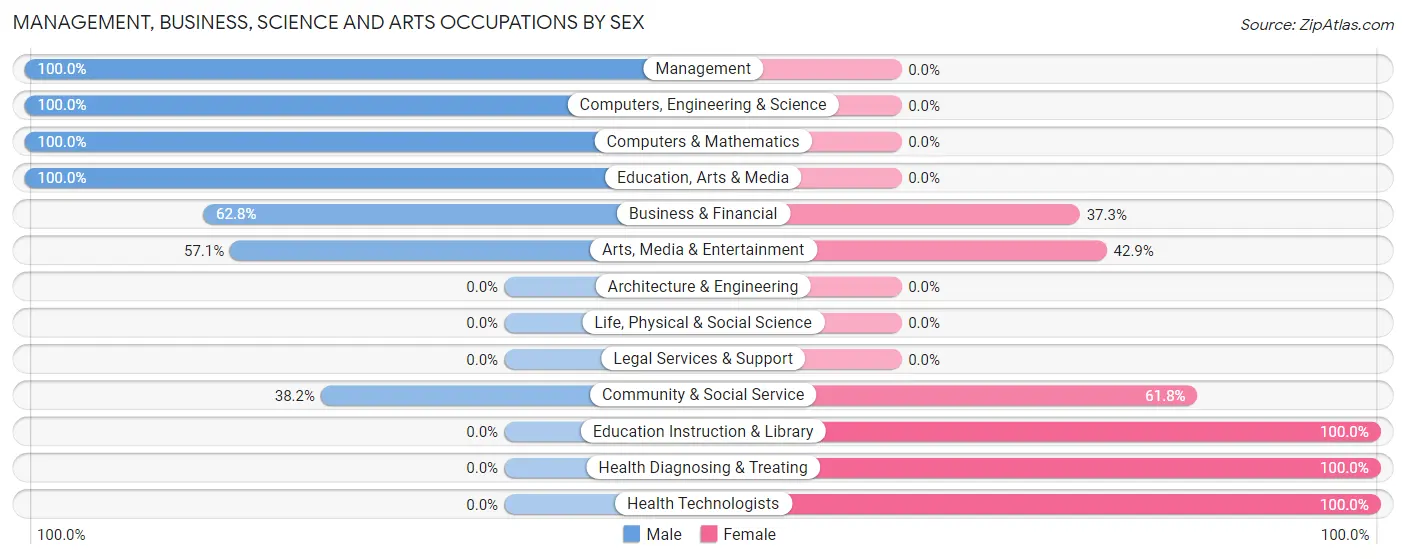
Management, Business, Science and Arts Occupations by Sex
Within the Management, Business, Science and Arts occupations in Bressler, the most male-oriented occupations are Management (100.0%), Computers, Engineering & Science (100.0%), and Computers & Mathematics (100.0%), while the most female-oriented occupations are Education Instruction & Library (100.0%), Health Diagnosing & Treating (100.0%), and Health Technologists (100.0%).
| Occupation | Male | Female |
| Management | 58 (100.0%) | 0 (0.0%) |
| Business & Financial | 32 (62.7%) | 19 (37.2%) |
| Computers, Engineering & Science | 90 (100.0%) | 0 (0.0%) |
| Computers & Mathematics | 90 (100.0%) | 0 (0.0%) |
| Architecture & Engineering | 0 (0.0%) | 0 (0.0%) |
| Life, Physical & Social Science | 0 (0.0%) | 0 (0.0%) |
| Community & Social Service | 47 (38.2%) | 76 (61.8%) |
| Education, Arts & Media | 23 (100.0%) | 0 (0.0%) |
| Legal Services & Support | 0 (0.0%) | 0 (0.0%) |
| Education Instruction & Library | 0 (0.0%) | 58 (100.0%) |
| Arts, Media & Entertainment | 24 (57.1%) | 18 (42.9%) |
| Health Diagnosing & Treating | 0 (0.0%) | 55 (100.0%) |
| Health Technologists | 0 (0.0%) | 23 (100.0%) |
| Total (Category) | 227 (60.2%) | 150 (39.8%) |
| Total (Overall) | 661 (59.4%) | 451 (40.6%) |
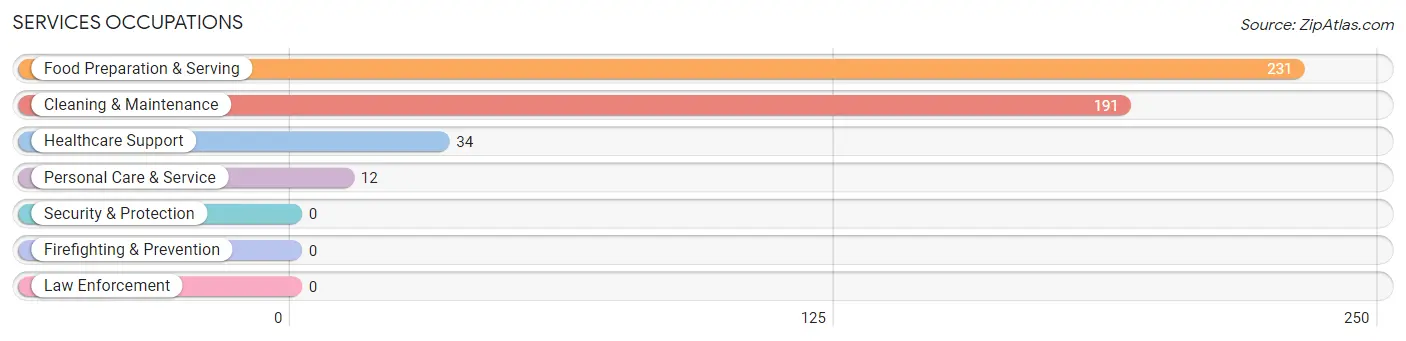
Services Occupations
The most common Services occupations in Bressler are Food Preparation & Serving (231 | 20.8%), Cleaning & Maintenance (191 | 17.2%), Healthcare Support (34 | 3.1%), and Personal Care & Service (12 | 1.1%).
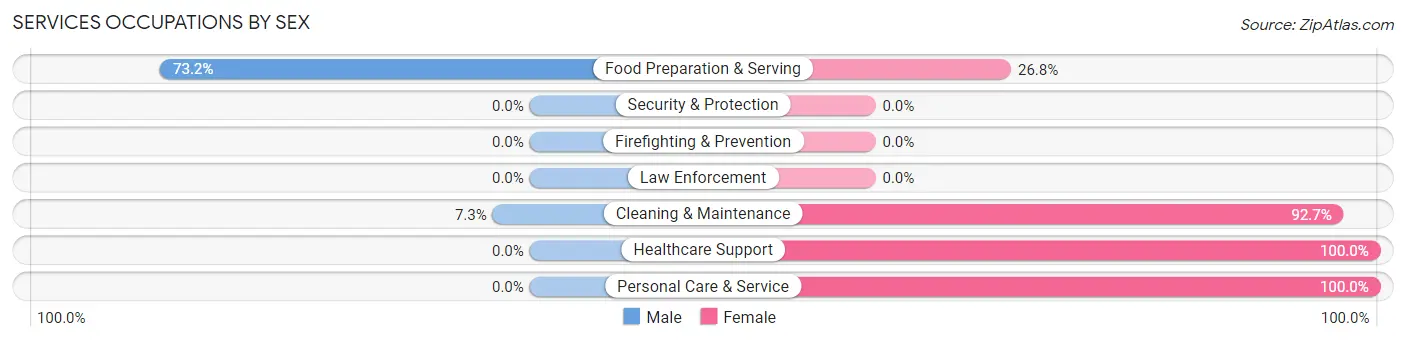
Services Occupations by Sex
Within the Services occupations in Bressler, the most male-oriented occupations are Food Preparation & Serving (73.2%), and Cleaning & Maintenance (7.3%), while the most female-oriented occupations are Healthcare Support (100.0%), Personal Care & Service (100.0%), and Cleaning & Maintenance (92.7%).
| Occupation | Male | Female |
| Healthcare Support | 0 (0.0%) | 34 (100.0%) |
| Security & Protection | 0 (0.0%) | 0 (0.0%) |
| Firefighting & Prevention | 0 (0.0%) | 0 (0.0%) |
| Law Enforcement | 0 (0.0%) | 0 (0.0%) |
| Food Preparation & Serving | 169 (73.2%) | 62 (26.8%) |
| Cleaning & Maintenance | 14 (7.3%) | 177 (92.7%) |
| Personal Care & Service | 0 (0.0%) | 12 (100.0%) |
| Total (Category) | 183 (39.1%) | 285 (60.9%) |
| Total (Overall) | 661 (59.4%) | 451 (40.6%) |
Sales and Office Occupations
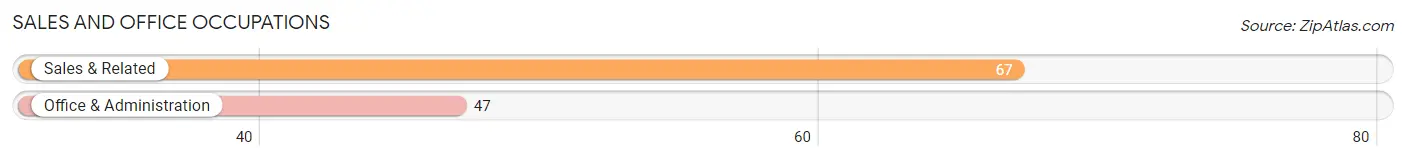
The most common Sales and Office occupations in Bressler are Sales & Related (67 | 6.0%), and Office & Administration (47 | 4.2%).
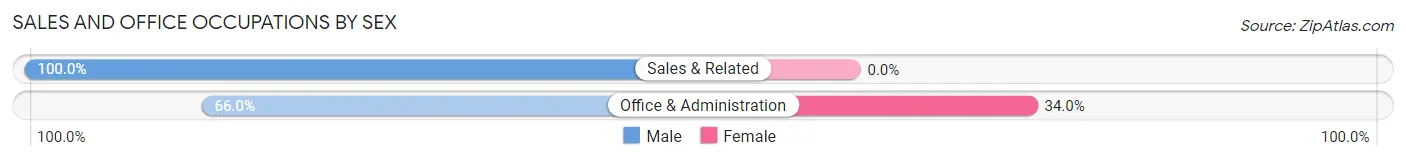
Sales and Office Occupations by Sex
| Occupation | Male | Female |
| Sales & Related | 67 (100.0%) | 0 (0.0%) |
| Office & Administration | 31 (66.0%) | 16 (34.0%) |
| Total (Category) | 98 (86.0%) | 16 (14.0%) |
| Total (Overall) | 661 (59.4%) | 451 (40.6%) |
Natural Resources, Construction and Maintenance Occupations
Natural Resources, Construction and Maintenance Occupations by Sex
| Occupation | Male | Female |
| Farming, Fishing & Forestry | 0 (0.0%) | 0 (0.0%) |
| Construction & Extraction | 0 (0.0%) | 0 (0.0%) |
| Installation, Maintenance & Repair | 0 (0.0%) | 0 (0.0%) |
| Total (Category) | 0 (0.0%) | 0 (0.0%) |
| Total (Overall) | 661 (59.4%) | 451 (40.6%) |
Production, Transportation and Moving Occupations
The most common Production, Transportation and Moving occupations in Bressler are Production (79 | 7.1%), Material Moving (64 | 5.8%), and Transportation (10 | 0.9%).
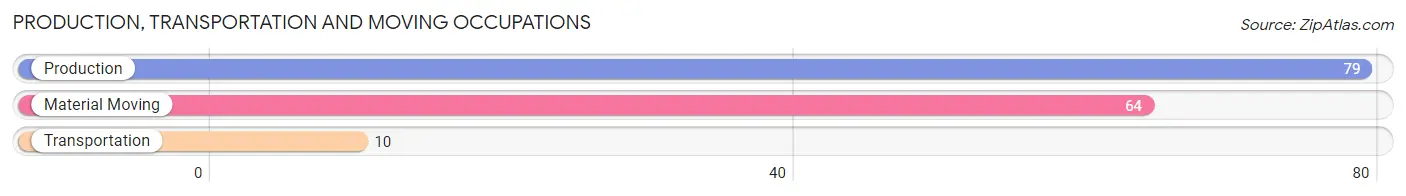
Production, Transportation and Moving Occupations by Sex
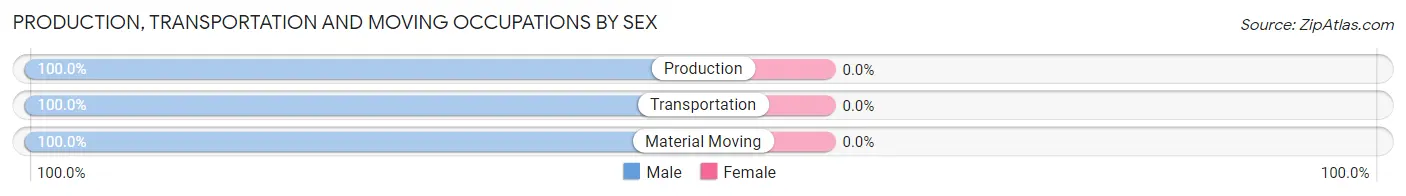
| Occupation | Male | Female |
| Production | 79 (100.0%) | 0 (0.0%) |
| Transportation | 10 (100.0%) | 0 (0.0%) |
| Material Moving | 64 (100.0%) | 0 (0.0%) |
| Total (Category) | 153 (100.0%) | 0 (0.0%) |
| Total (Overall) | 661 (59.4%) | 451 (40.6%) |
Employment Industries by Sex in Bressler
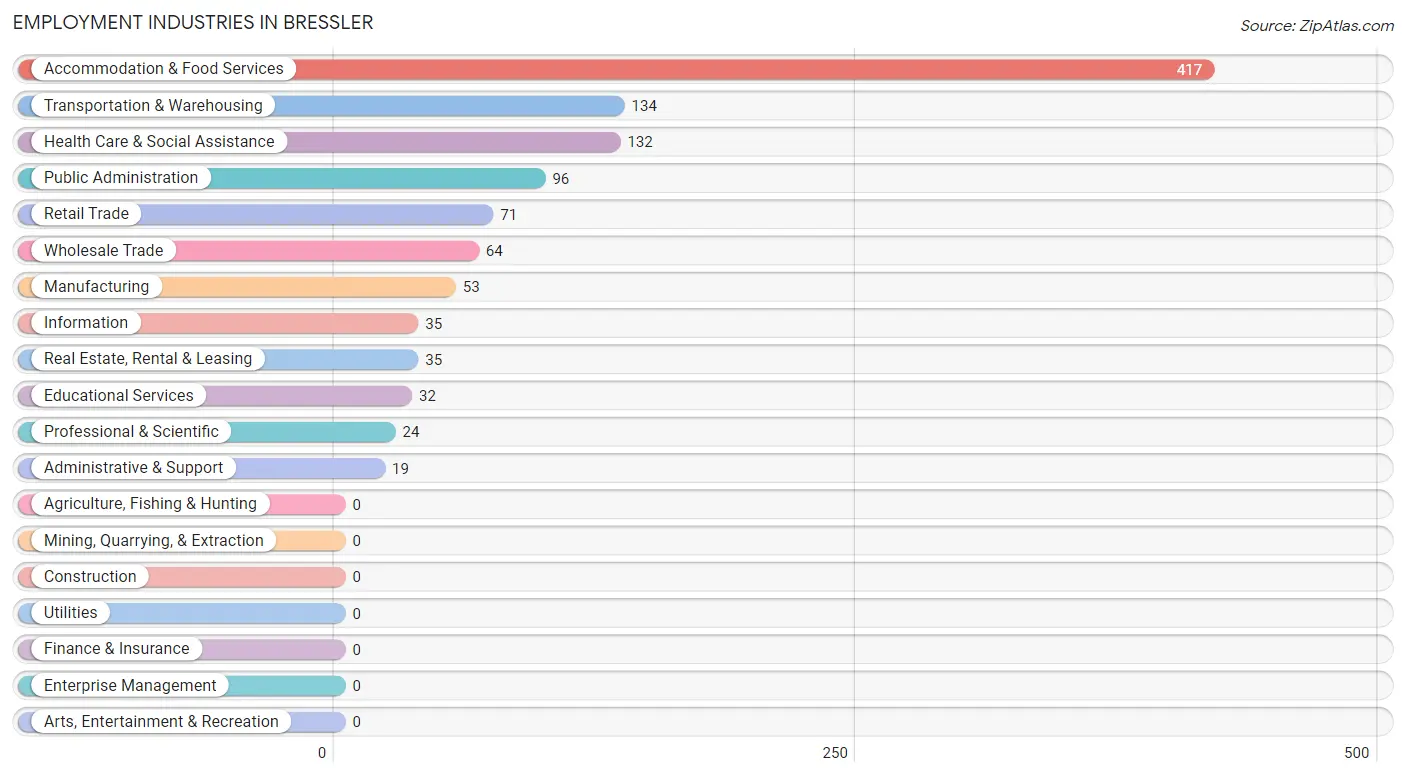
Employment Industries in Bressler
The major employment industries in Bressler include Accommodation & Food Services (417 | 37.5%), Transportation & Warehousing (134 | 12.0%), Health Care & Social Assistance (132 | 11.9%), Public Administration (96 | 8.6%), and Retail Trade (71 | 6.4%).
Employment Industries by Sex in Bressler
The Bressler industries that see more men than women are Manufacturing (100.0%), Wholesale Trade (100.0%), and Information (100.0%), whereas the industries that tend to have a higher number of women are Real Estate, Rental & Leasing (100.0%), Administrative & Support (100.0%), and Health Care & Social Assistance (82.6%).
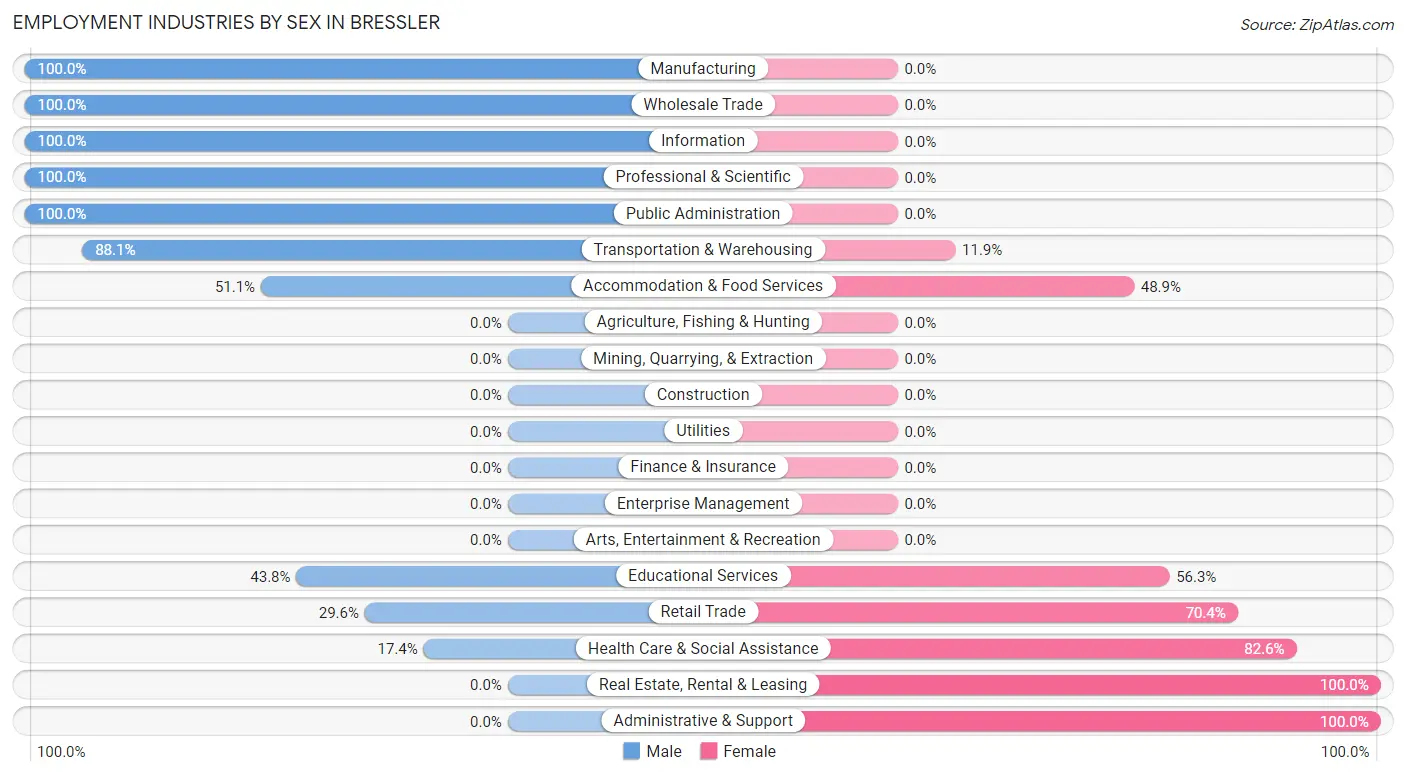
| Industry | Male | Female |
| Agriculture, Fishing & Hunting | 0 (0.0%) | 0 (0.0%) |
| Mining, Quarrying, & Extraction | 0 (0.0%) | 0 (0.0%) |
| Construction | 0 (0.0%) | 0 (0.0%) |
| Manufacturing | 53 (100.0%) | 0 (0.0%) |
| Wholesale Trade | 64 (100.0%) | 0 (0.0%) |
| Retail Trade | 21 (29.6%) | 50 (70.4%) |
| Transportation & Warehousing | 118 (88.1%) | 16 (11.9%) |
| Utilities | 0 (0.0%) | 0 (0.0%) |
| Information | 35 (100.0%) | 0 (0.0%) |
| Finance & Insurance | 0 (0.0%) | 0 (0.0%) |
| Real Estate, Rental & Leasing | 0 (0.0%) | 35 (100.0%) |
| Professional & Scientific | 24 (100.0%) | 0 (0.0%) |
| Enterprise Management | 0 (0.0%) | 0 (0.0%) |
| Administrative & Support | 0 (0.0%) | 19 (100.0%) |
| Educational Services | 14 (43.8%) | 18 (56.2%) |
| Health Care & Social Assistance | 23 (17.4%) | 109 (82.6%) |
| Arts, Entertainment & Recreation | 0 (0.0%) | 0 (0.0%) |
| Accommodation & Food Services | 213 (51.1%) | 204 (48.9%) |
| Public Administration | 96 (100.0%) | 0 (0.0%) |
| Total | 661 (59.4%) | 451 (40.6%) |
Education in Bressler
School Enrollment in Bressler
The most common levels of schooling among the 438 students in Bressler are middle school (224 | 51.1%), elementary school (85 | 19.4%), and high school (82 | 18.7%).
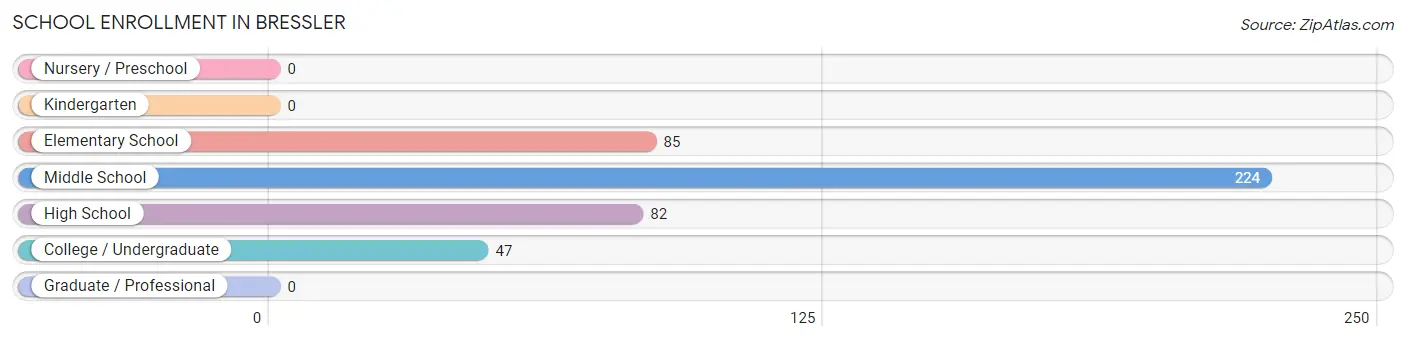
| School Level | # Students | % Students |
| Nursery / Preschool | 0 | 0.0% |
| Kindergarten | 0 | 0.0% |
| Elementary School | 85 | 19.4% |
| Middle School | 224 | 51.1% |
| High School | 82 | 18.7% |
| College / Undergraduate | 47 | 10.7% |
| Graduate / Professional | 0 | 0.0% |
| Total | 438 | 100.0% |
School Enrollment by Age by Funding Source in Bressler
Out of a total of 438 students who are enrolled in schools in Bressler, 72 (16.4%) attend a private institution, while the remaining 366 (83.6%) are enrolled in public schools. The age group of 15 to 17 year olds has the highest likelihood of being enrolled in private schools, with 20 (30.8% in the age bracket) enrolled. Conversely, the age group of 20 to 24 year olds has the lowest likelihood of being enrolled in a private school, with 32 (100.0% in the age bracket) attending a public institution.
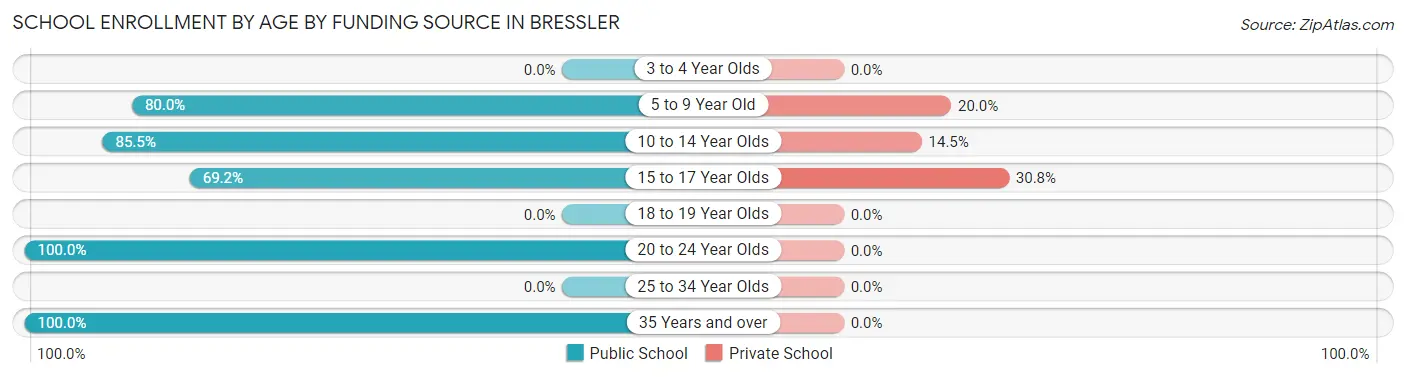
| Age Bracket | Public School | Private School |
| 3 to 4 Year Olds | 0 (0.0%) | 0 (0.0%) |
| 5 to 9 Year Old | 68 (80.0%) | 17 (20.0%) |
| 10 to 14 Year Olds | 206 (85.5%) | 35 (14.5%) |
| 15 to 17 Year Olds | 45 (69.2%) | 20 (30.8%) |
| 18 to 19 Year Olds | 0 (0.0%) | 0 (0.0%) |
| 20 to 24 Year Olds | 32 (100.0%) | 0 (0.0%) |
| 25 to 34 Year Olds | 0 (0.0%) | 0 (0.0%) |
| 35 Years and over | 15 (100.0%) | 0 (0.0%) |
| Total | 366 (83.6%) | 72 (16.4%) |
Educational Attainment by Field of Study in Bressler
Literature & languages (61 | 20.4%), liberal arts & history (61 | 20.4%), science & technology (57 | 19.1%), business (45 | 15.0%), and visual & performing arts (24 | 8.0%) are the most common fields of study among 299 individuals in Bressler who have obtained a bachelor's degree or higher.
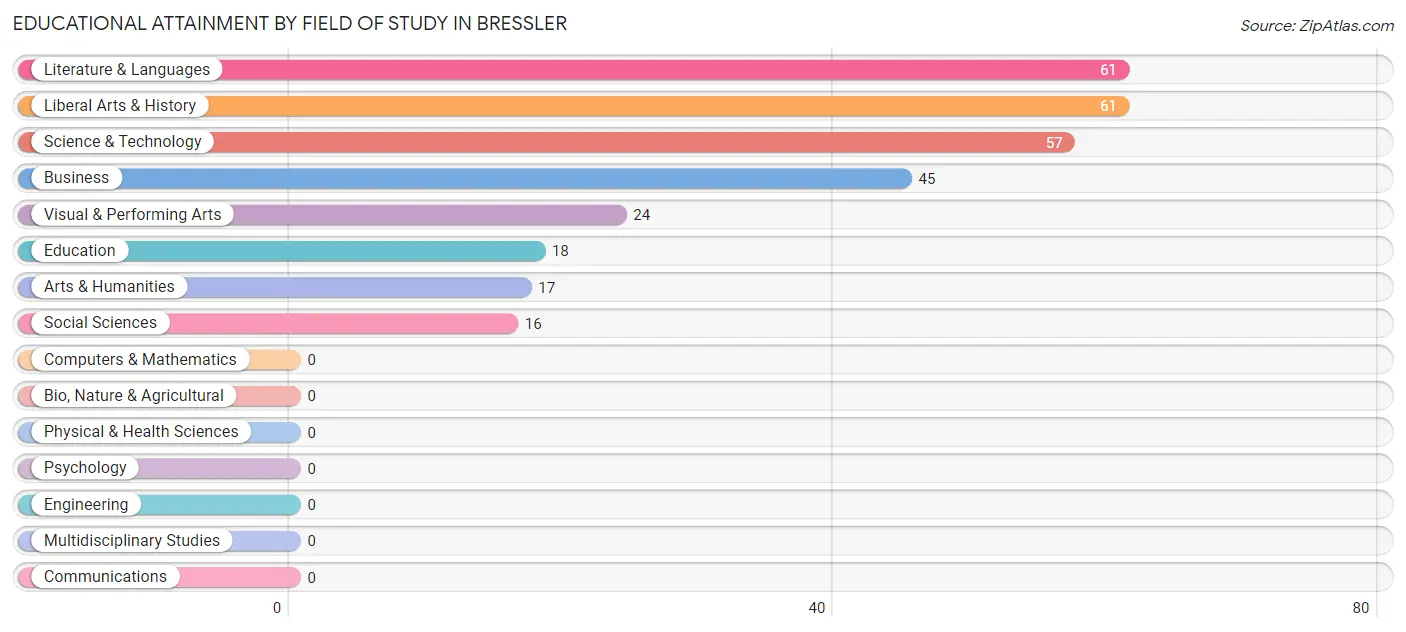
| Field of Study | # Graduates | % Graduates |
| Computers & Mathematics | 0 | 0.0% |
| Bio, Nature & Agricultural | 0 | 0.0% |
| Physical & Health Sciences | 0 | 0.0% |
| Psychology | 0 | 0.0% |
| Social Sciences | 16 | 5.3% |
| Engineering | 0 | 0.0% |
| Multidisciplinary Studies | 0 | 0.0% |
| Science & Technology | 57 | 19.1% |
| Business | 45 | 15.0% |
| Education | 18 | 6.0% |
| Literature & Languages | 61 | 20.4% |
| Liberal Arts & History | 61 | 20.4% |
| Visual & Performing Arts | 24 | 8.0% |
| Communications | 0 | 0.0% |
| Arts & Humanities | 17 | 5.7% |
| Total | 299 | 100.0% |
Transportation & Commute in Bressler
Vehicle Availability by Sex in Bressler
The most prevalent vehicle ownership categories in Bressler are males with 2 vehicles (450, accounting for 69.0%) and females with 2 vehicles (280, making up 99.8%).
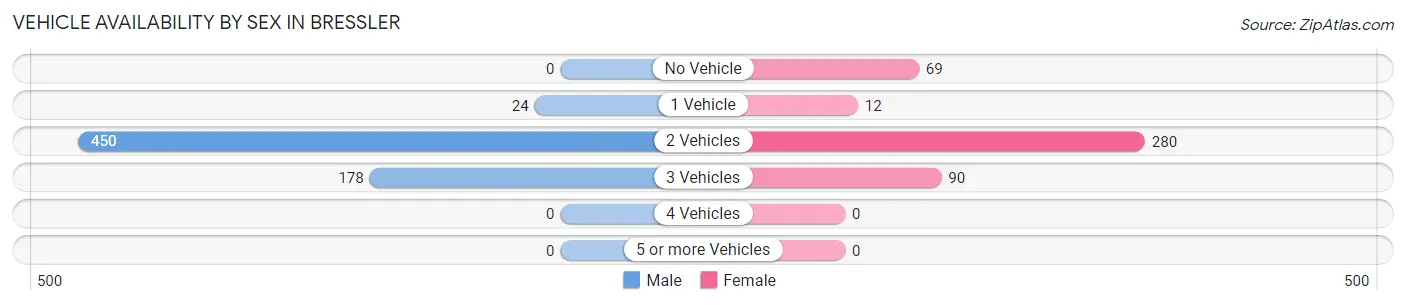
| Vehicles Available | Male | Female |
| No Vehicle | 0 (0.0%) | 69 (15.3%) |
| 1 Vehicle | 24 (3.7%) | 12 (2.7%) |
| 2 Vehicles | 450 (69.0%) | 280 (62.1%) |
| 3 Vehicles | 178 (27.3%) | 90 (20.0%) |
| 4 Vehicles | 0 (0.0%) | 0 (0.0%) |
| 5 or more Vehicles | 0 (0.0%) | 0 (0.0%) |
| Total | 652 (100.0%) | 451 (100.0%) |
Commute Time in Bressler
The most frequently occuring commute durations in Bressler are 15 to 19 minutes (366 commuters, 35.7%), 20 to 24 minutes (202 commuters, 19.7%), and 5 to 9 minutes (159 commuters, 15.5%).
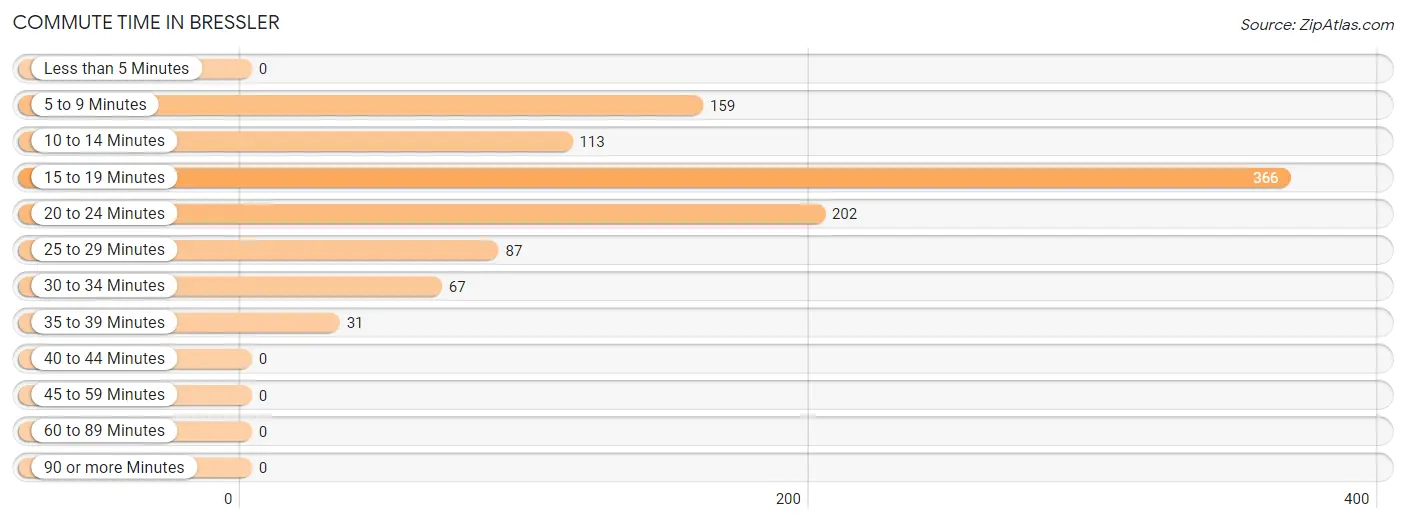
| Commute Time | # Commuters | % Commuters |
| Less than 5 Minutes | 0 | 0.0% |
| 5 to 9 Minutes | 159 | 15.5% |
| 10 to 14 Minutes | 113 | 11.0% |
| 15 to 19 Minutes | 366 | 35.7% |
| 20 to 24 Minutes | 202 | 19.7% |
| 25 to 29 Minutes | 87 | 8.5% |
| 30 to 34 Minutes | 67 | 6.5% |
| 35 to 39 Minutes | 31 | 3.0% |
| 40 to 44 Minutes | 0 | 0.0% |
| 45 to 59 Minutes | 0 | 0.0% |
| 60 to 89 Minutes | 0 | 0.0% |
| 90 or more Minutes | 0 | 0.0% |
Commute Time by Sex in Bressler
The most common commute times in Bressler are 15 to 19 minutes (253 commuters, 41.4%) for males and 15 to 19 minutes (113 commuters, 27.3%) for females.
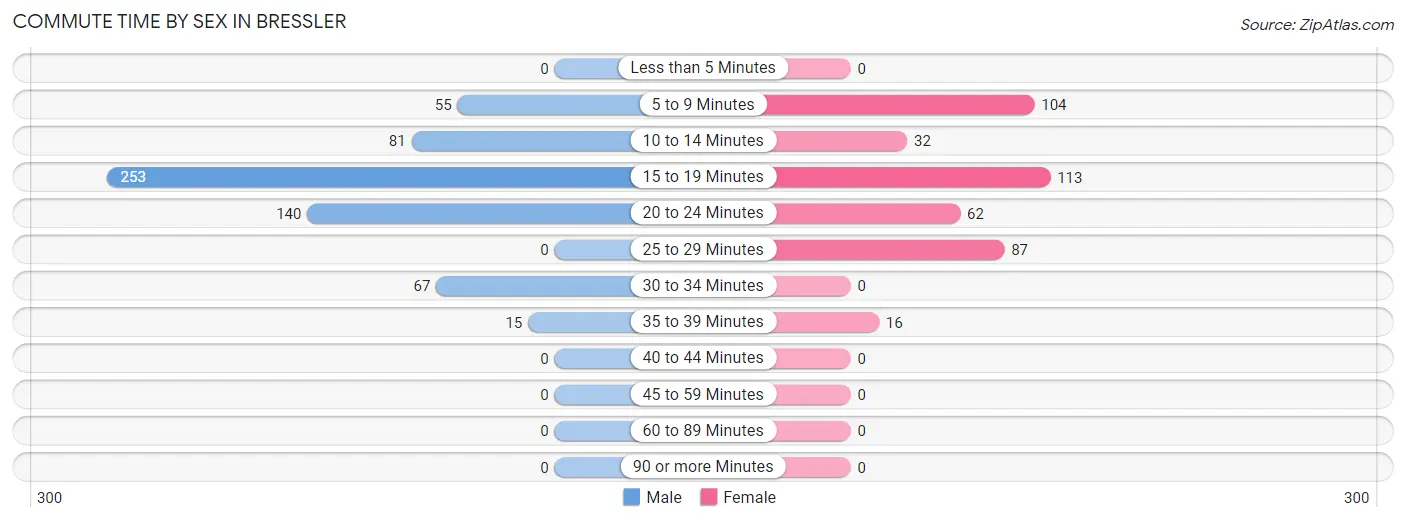
| Commute Time | Male | Female |
| Less than 5 Minutes | 0 (0.0%) | 0 (0.0%) |
| 5 to 9 Minutes | 55 (9.0%) | 104 (25.1%) |
| 10 to 14 Minutes | 81 (13.3%) | 32 (7.7%) |
| 15 to 19 Minutes | 253 (41.4%) | 113 (27.3%) |
| 20 to 24 Minutes | 140 (22.9%) | 62 (15.0%) |
| 25 to 29 Minutes | 0 (0.0%) | 87 (21.0%) |
| 30 to 34 Minutes | 67 (11.0%) | 0 (0.0%) |
| 35 to 39 Minutes | 15 (2.5%) | 16 (3.9%) |
| 40 to 44 Minutes | 0 (0.0%) | 0 (0.0%) |
| 45 to 59 Minutes | 0 (0.0%) | 0 (0.0%) |
| 60 to 89 Minutes | 0 (0.0%) | 0 (0.0%) |
| 90 or more Minutes | 0 (0.0%) | 0 (0.0%) |
Time of Departure to Work by Sex in Bressler
The most frequent times of departure to work in Bressler are 9:00 AM to 9:59 AM (120, 19.6%) for males and 7:00 AM to 7:29 AM (90, 21.7%) for females.
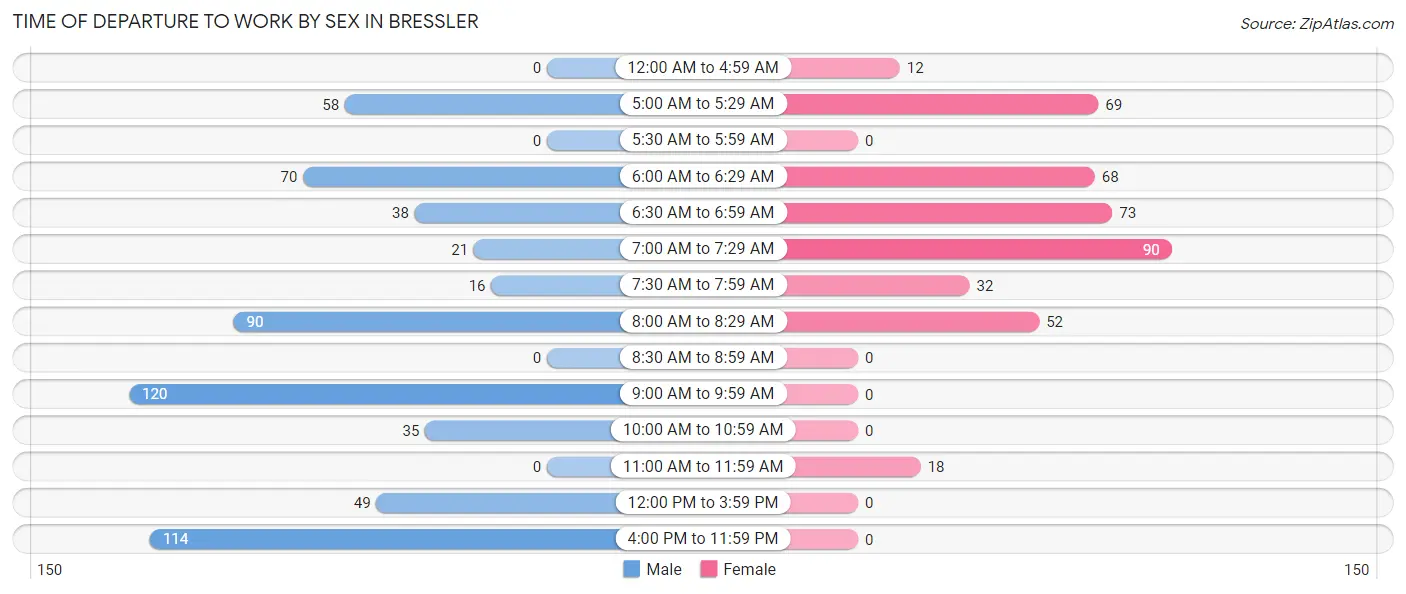
| Time of Departure | Male | Female |
| 12:00 AM to 4:59 AM | 0 (0.0%) | 12 (2.9%) |
| 5:00 AM to 5:29 AM | 58 (9.5%) | 69 (16.7%) |
| 5:30 AM to 5:59 AM | 0 (0.0%) | 0 (0.0%) |
| 6:00 AM to 6:29 AM | 70 (11.5%) | 68 (16.4%) |
| 6:30 AM to 6:59 AM | 38 (6.2%) | 73 (17.6%) |
| 7:00 AM to 7:29 AM | 21 (3.4%) | 90 (21.7%) |
| 7:30 AM to 7:59 AM | 16 (2.6%) | 32 (7.7%) |
| 8:00 AM to 8:29 AM | 90 (14.7%) | 52 (12.6%) |
| 8:30 AM to 8:59 AM | 0 (0.0%) | 0 (0.0%) |
| 9:00 AM to 9:59 AM | 120 (19.6%) | 0 (0.0%) |
| 10:00 AM to 10:59 AM | 35 (5.7%) | 0 (0.0%) |
| 11:00 AM to 11:59 AM | 0 (0.0%) | 18 (4.3%) |
| 12:00 PM to 3:59 PM | 49 (8.0%) | 0 (0.0%) |
| 4:00 PM to 11:59 PM | 114 (18.7%) | 0 (0.0%) |
| Total | 611 (100.0%) | 414 (100.0%) |
Housing Occupancy in Bressler
Occupancy by Ownership in Bressler
Of the total 752 dwellings in Bressler, owner-occupied units account for 598 (79.5%), while renter-occupied units make up 154 (20.5%).
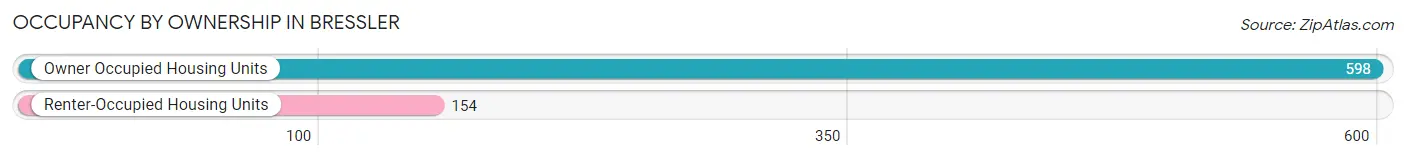
| Occupancy | # Housing Units | % Housing Units |
| Owner Occupied Housing Units | 598 | 79.5% |
| Renter-Occupied Housing Units | 154 | 20.5% |
| Total Occupied Housing Units | 752 | 100.0% |
Occupancy by Household Size in Bressler
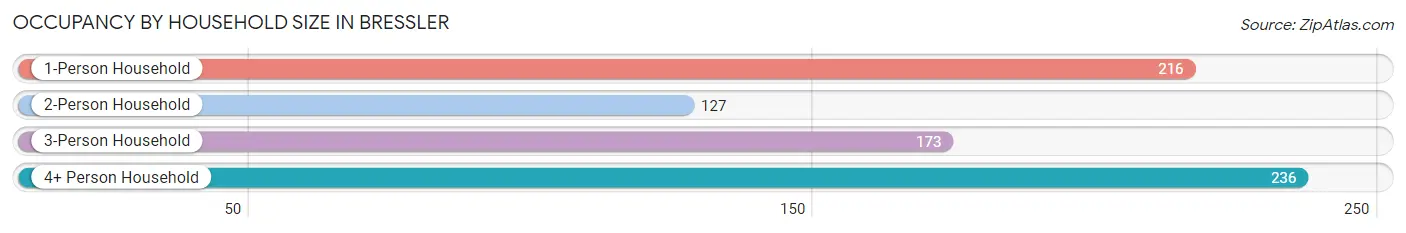
| Household Size | # Housing Units | % Housing Units |
| 1-Person Household | 216 | 28.7% |
| 2-Person Household | 127 | 16.9% |
| 3-Person Household | 173 | 23.0% |
| 4+ Person Household | 236 | 31.4% |
| Total Housing Units | 752 | 100.0% |
Occupancy by Ownership by Household Size in Bressler
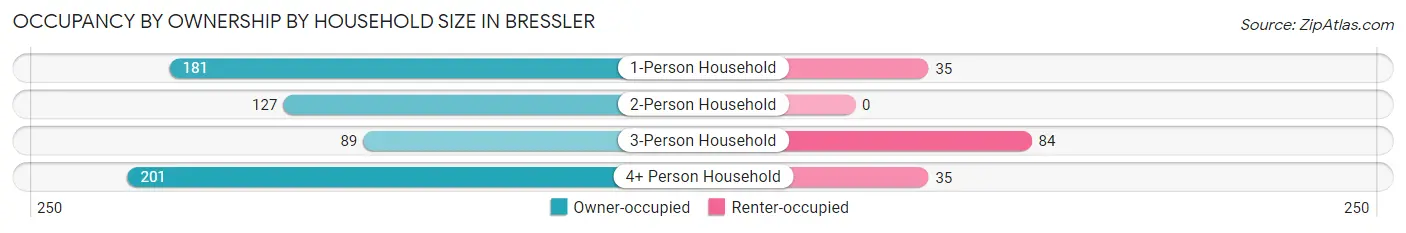
| Household Size | Owner-occupied | Renter-occupied |
| 1-Person Household | 181 (83.8%) | 35 (16.2%) |
| 2-Person Household | 127 (100.0%) | 0 (0.0%) |
| 3-Person Household | 89 (51.4%) | 84 (48.5%) |
| 4+ Person Household | 201 (85.2%) | 35 (14.8%) |
| Total Housing Units | 598 (79.5%) | 154 (20.5%) |
Occupancy by Educational Attainment in Bressler
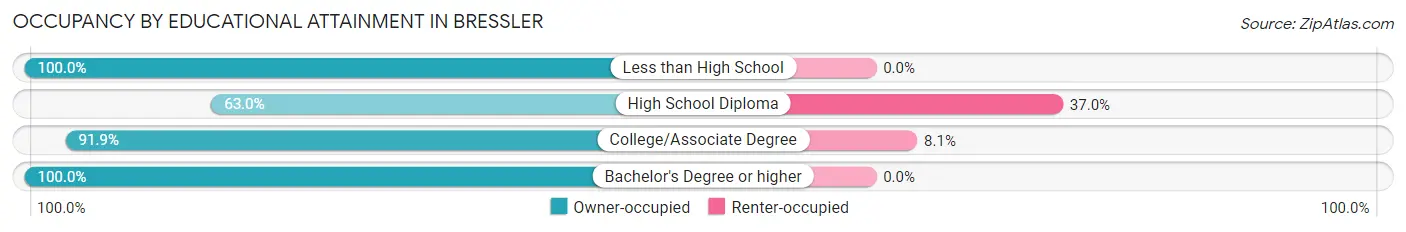
| Household Size | Owner-occupied | Renter-occupied |
| Less than High School | 123 (100.0%) | 0 (0.0%) |
| High School Diploma | 245 (63.0%) | 144 (37.0%) |
| College/Associate Degree | 113 (91.9%) | 10 (8.1%) |
| Bachelor's Degree or higher | 117 (100.0%) | 0 (0.0%) |
Occupancy by Age of Householder in Bressler
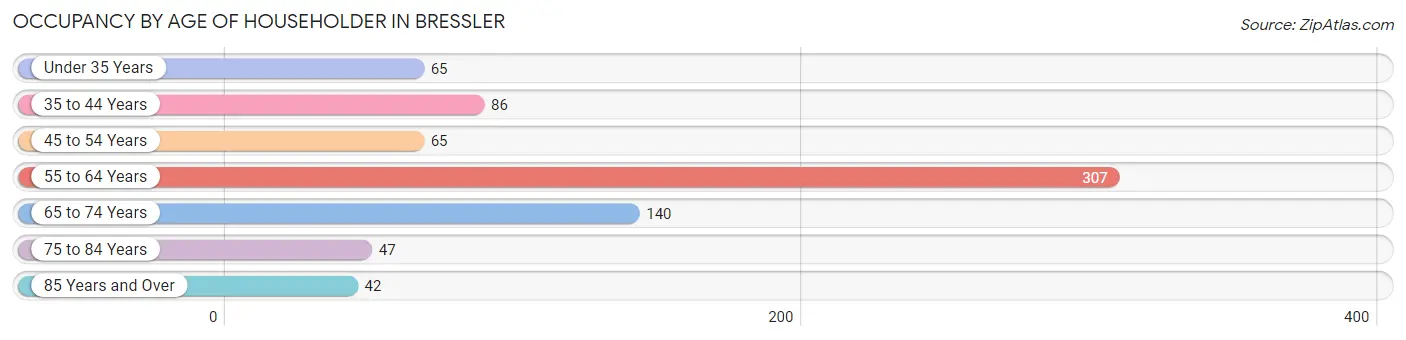
| Age Bracket | # Households | % Households |
| Under 35 Years | 65 | 8.6% |
| 35 to 44 Years | 86 | 11.4% |
| 45 to 54 Years | 65 | 8.6% |
| 55 to 64 Years | 307 | 40.8% |
| 65 to 74 Years | 140 | 18.6% |
| 75 to 84 Years | 47 | 6.2% |
| 85 Years and Over | 42 | 5.6% |
| Total | 752 | 100.0% |
Housing Finances in Bressler
Median Income by Occupancy in Bressler
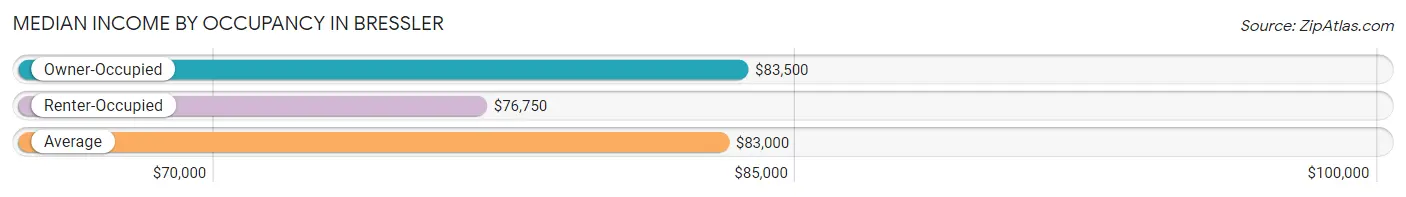
| Occupancy Type | # Households | Median Income |
| Owner-Occupied | 598 (79.5%) | $83,500 |
| Renter-Occupied | 154 (20.5%) | $76,750 |
| Average | 752 (100.0%) | $83,000 |
Occupancy by Householder Income Bracket in Bressler
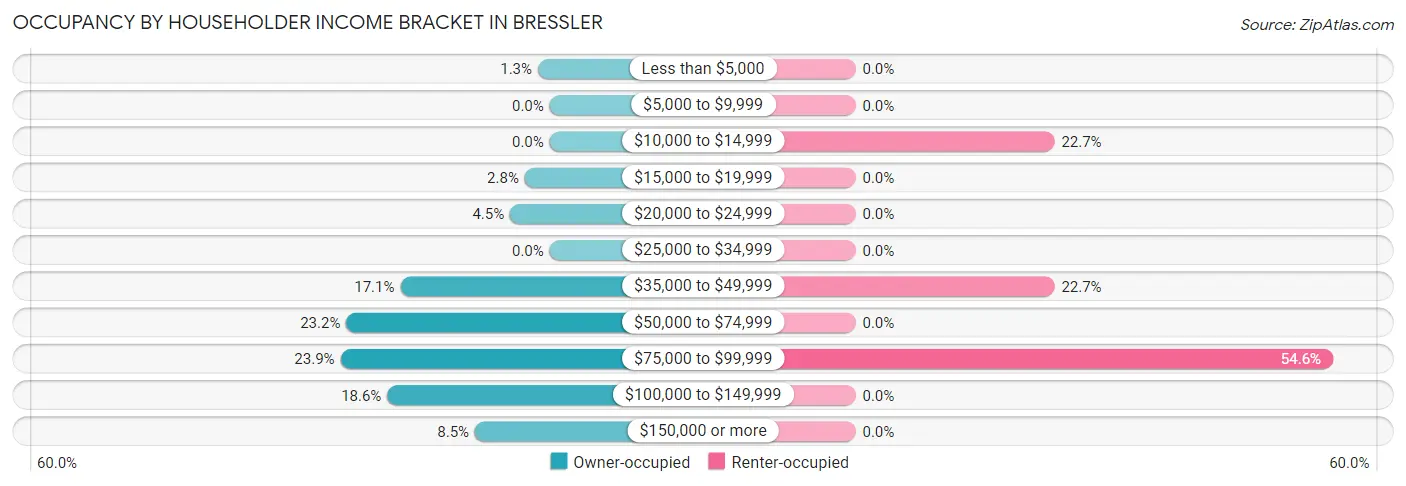
| Income Bracket | Owner-occupied | Renter-occupied |
| Less than $5,000 | 8 (1.3%) | 0 (0.0%) |
| $5,000 to $9,999 | 0 (0.0%) | 0 (0.0%) |
| $10,000 to $14,999 | 0 (0.0%) | 35 (22.7%) |
| $15,000 to $19,999 | 17 (2.8%) | 0 (0.0%) |
| $20,000 to $24,999 | 27 (4.5%) | 0 (0.0%) |
| $25,000 to $34,999 | 0 (0.0%) | 0 (0.0%) |
| $35,000 to $49,999 | 102 (17.1%) | 35 (22.7%) |
| $50,000 to $74,999 | 139 (23.2%) | 0 (0.0%) |
| $75,000 to $99,999 | 143 (23.9%) | 84 (54.5%) |
| $100,000 to $149,999 | 111 (18.6%) | 0 (0.0%) |
| $150,000 or more | 51 (8.5%) | 0 (0.0%) |
| Total | 598 (100.0%) | 154 (100.0%) |
Monthly Housing Cost Tiers in Bressler
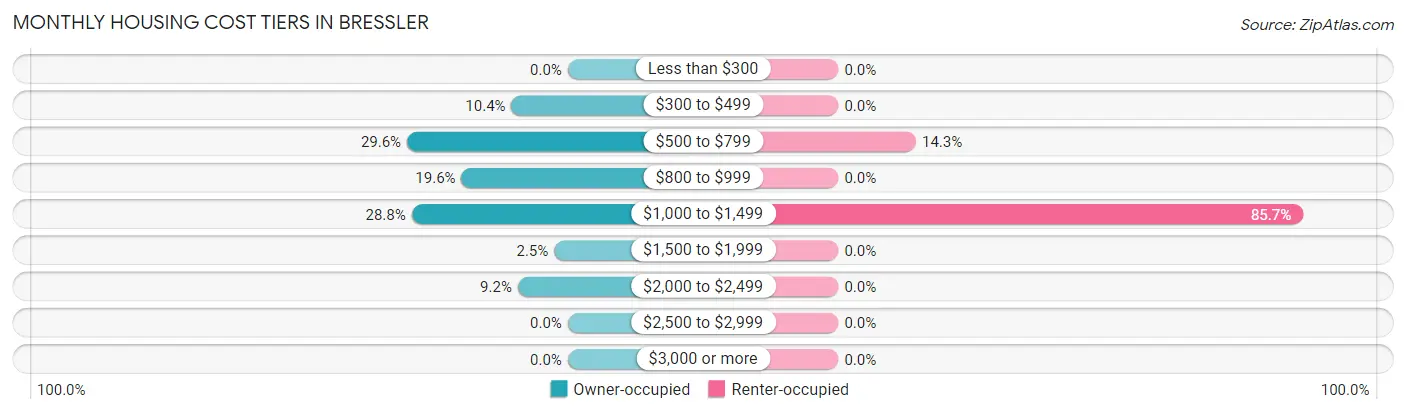
| Monthly Cost | Owner-occupied | Renter-occupied |
| Less than $300 | 0 (0.0%) | 0 (0.0%) |
| $300 to $499 | 62 (10.4%) | 0 (0.0%) |
| $500 to $799 | 177 (29.6%) | 22 (14.3%) |
| $800 to $999 | 117 (19.6%) | 0 (0.0%) |
| $1,000 to $1,499 | 172 (28.8%) | 132 (85.7%) |
| $1,500 to $1,999 | 15 (2.5%) | 0 (0.0%) |
| $2,000 to $2,499 | 55 (9.2%) | 0 (0.0%) |
| $2,500 to $2,999 | 0 (0.0%) | 0 (0.0%) |
| $3,000 or more | 0 (0.0%) | 0 (0.0%) |
| Total | 598 (100.0%) | 154 (100.0%) |
Physical Housing Characteristics in Bressler
Housing Structures in Bressler
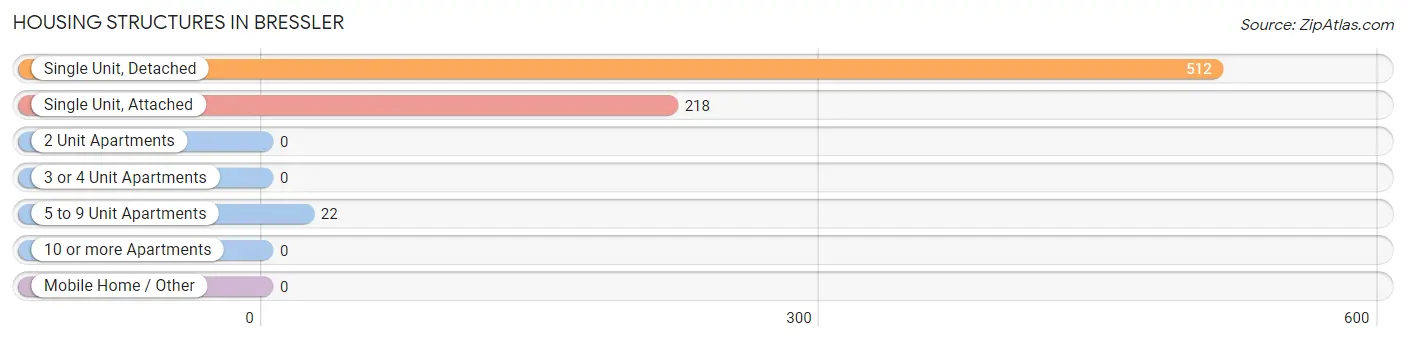
| Structure Type | # Housing Units | % Housing Units |
| Single Unit, Detached | 512 | 68.1% |
| Single Unit, Attached | 218 | 29.0% |
| 2 Unit Apartments | 0 | 0.0% |
| 3 or 4 Unit Apartments | 0 | 0.0% |
| 5 to 9 Unit Apartments | 22 | 2.9% |
| 10 or more Apartments | 0 | 0.0% |
| Mobile Home / Other | 0 | 0.0% |
| Total | 752 | 100.0% |
Housing Structures by Occupancy in Bressler
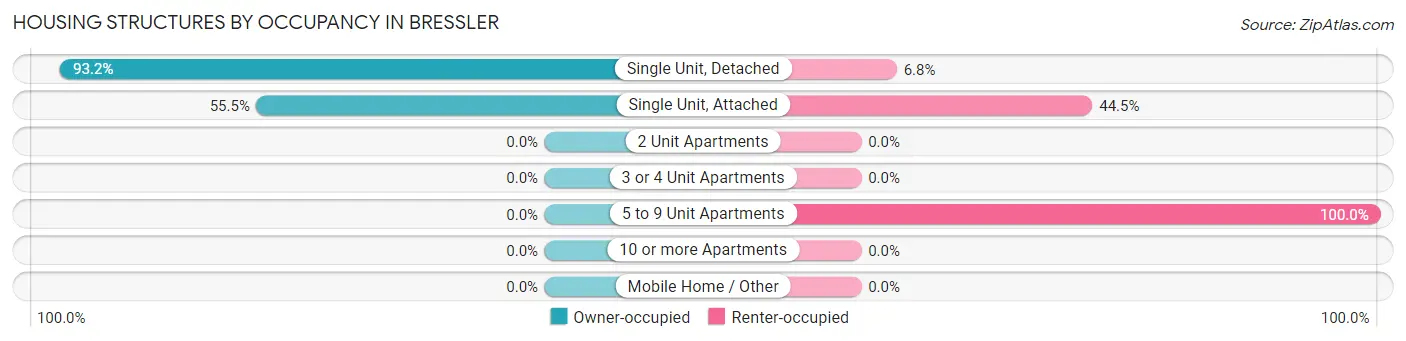
| Structure Type | Owner-occupied | Renter-occupied |
| Single Unit, Detached | 477 (93.2%) | 35 (6.8%) |
| Single Unit, Attached | 121 (55.5%) | 97 (44.5%) |
| 2 Unit Apartments | 0 (0.0%) | 0 (0.0%) |
| 3 or 4 Unit Apartments | 0 (0.0%) | 0 (0.0%) |
| 5 to 9 Unit Apartments | 0 (0.0%) | 22 (100.0%) |
| 10 or more Apartments | 0 (0.0%) | 0 (0.0%) |
| Mobile Home / Other | 0 (0.0%) | 0 (0.0%) |
| Total | 598 (79.5%) | 154 (20.5%) |
Housing Structures by Number of Rooms in Bressler
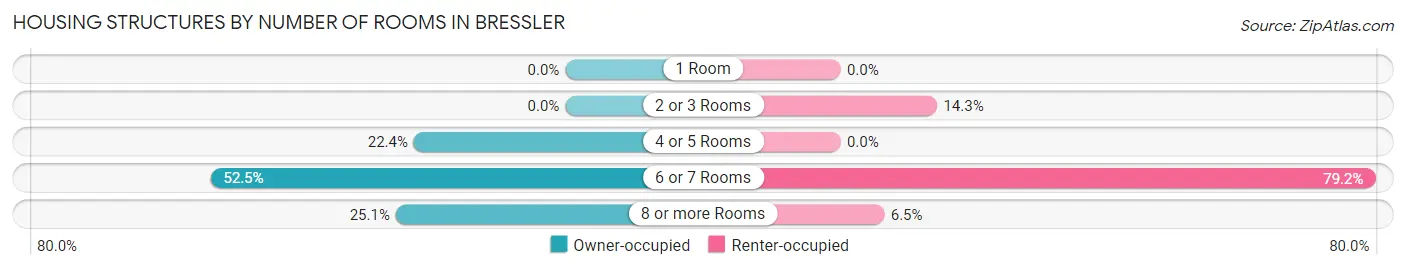
| Number of Rooms | Owner-occupied | Renter-occupied |
| 1 Room | 0 (0.0%) | 0 (0.0%) |
| 2 or 3 Rooms | 0 (0.0%) | 22 (14.3%) |
| 4 or 5 Rooms | 134 (22.4%) | 0 (0.0%) |
| 6 or 7 Rooms | 314 (52.5%) | 122 (79.2%) |
| 8 or more Rooms | 150 (25.1%) | 10 (6.5%) |
| Total | 598 (100.0%) | 154 (100.0%) |
Housing Structure by Heating Type in Bressler
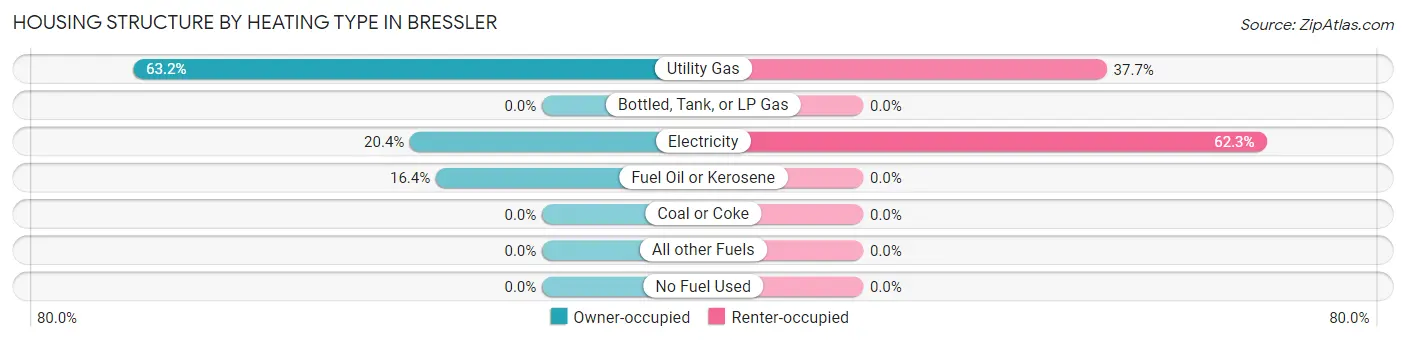
| Heating Type | Owner-occupied | Renter-occupied |
| Utility Gas | 378 (63.2%) | 58 (37.7%) |
| Bottled, Tank, or LP Gas | 0 (0.0%) | 0 (0.0%) |
| Electricity | 122 (20.4%) | 96 (62.3%) |
| Fuel Oil or Kerosene | 98 (16.4%) | 0 (0.0%) |
| Coal or Coke | 0 (0.0%) | 0 (0.0%) |
| All other Fuels | 0 (0.0%) | 0 (0.0%) |
| No Fuel Used | 0 (0.0%) | 0 (0.0%) |
| Total | 598 (100.0%) | 154 (100.0%) |
Household Vehicle Usage in Bressler
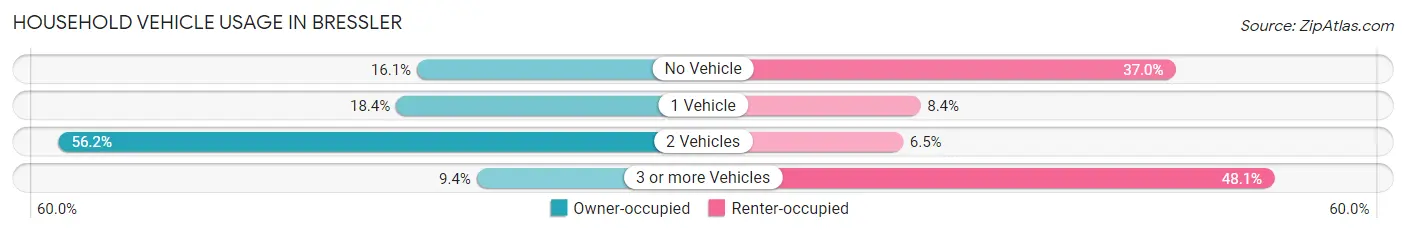
| Vehicles per Household | Owner-occupied | Renter-occupied |
| No Vehicle | 96 (16.1%) | 57 (37.0%) |
| 1 Vehicle | 110 (18.4%) | 13 (8.4%) |
| 2 Vehicles | 336 (56.2%) | 10 (6.5%) |
| 3 or more Vehicles | 56 (9.4%) | 74 (48.0%) |
| Total | 598 (100.0%) | 154 (100.0%) |
Real Estate & Mortgages in Bressler
Real Estate and Mortgage Overview in Bressler
| Characteristic | Without Mortgage | With Mortgage |
| Housing Units | 292 | 306 |
| Median Property Value | $161,400 | $134,300 |
| Median Household Income | $65,980 | $28 |
| Monthly Housing Costs | $573 | $0 |
| Real Estate Taxes | $2,503 | $0 |
Property Value by Mortgage Status in Bressler
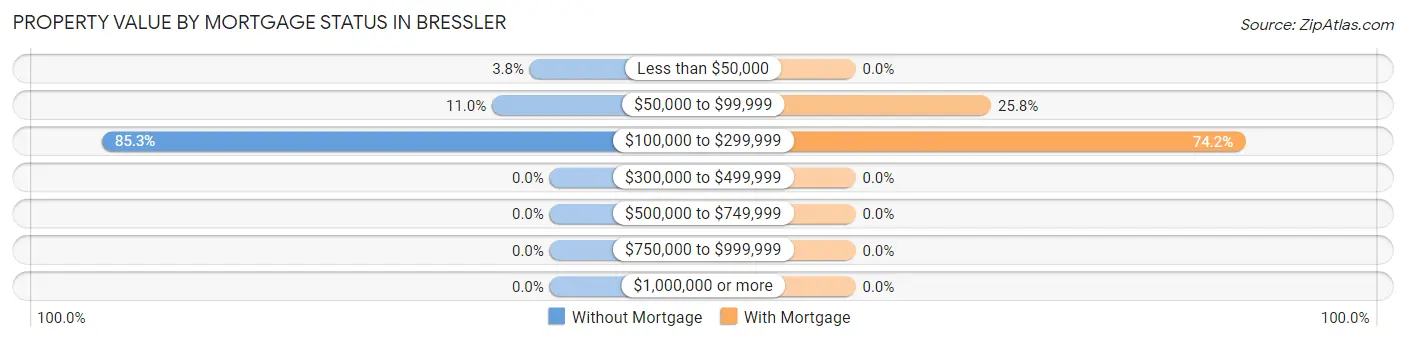
| Property Value | Without Mortgage | With Mortgage |
| Less than $50,000 | 11 (3.8%) | 0 (0.0%) |
| $50,000 to $99,999 | 32 (11.0%) | 79 (25.8%) |
| $100,000 to $299,999 | 249 (85.3%) | 227 (74.2%) |
| $300,000 to $499,999 | 0 (0.0%) | 0 (0.0%) |
| $500,000 to $749,999 | 0 (0.0%) | 0 (0.0%) |
| $750,000 to $999,999 | 0 (0.0%) | 0 (0.0%) |
| $1,000,000 or more | 0 (0.0%) | 0 (0.0%) |
| Total | 292 (100.0%) | 306 (100.0%) |
Household Income by Mortgage Status in Bressler
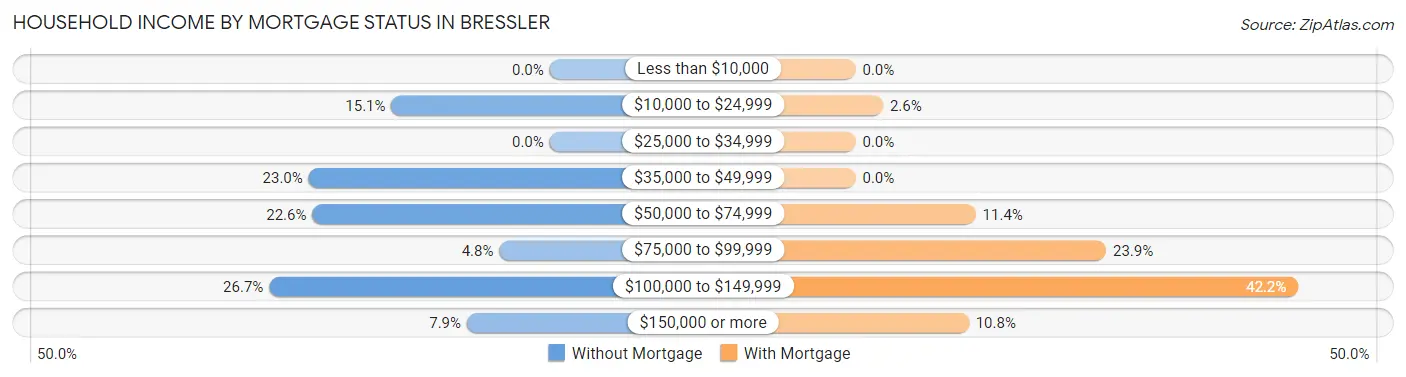
| Household Income | Without Mortgage | With Mortgage |
| Less than $10,000 | 0 (0.0%) | 0 (0.0%) |
| $10,000 to $24,999 | 44 (15.1%) | 8 (2.6%) |
| $25,000 to $34,999 | 0 (0.0%) | 0 (0.0%) |
| $35,000 to $49,999 | 67 (23.0%) | 0 (0.0%) |
| $50,000 to $74,999 | 66 (22.6%) | 35 (11.4%) |
| $75,000 to $99,999 | 14 (4.8%) | 73 (23.9%) |
| $100,000 to $149,999 | 78 (26.7%) | 129 (42.2%) |
| $150,000 or more | 23 (7.9%) | 33 (10.8%) |
| Total | 292 (100.0%) | 306 (100.0%) |
Property Value to Household Income Ratio in Bressler
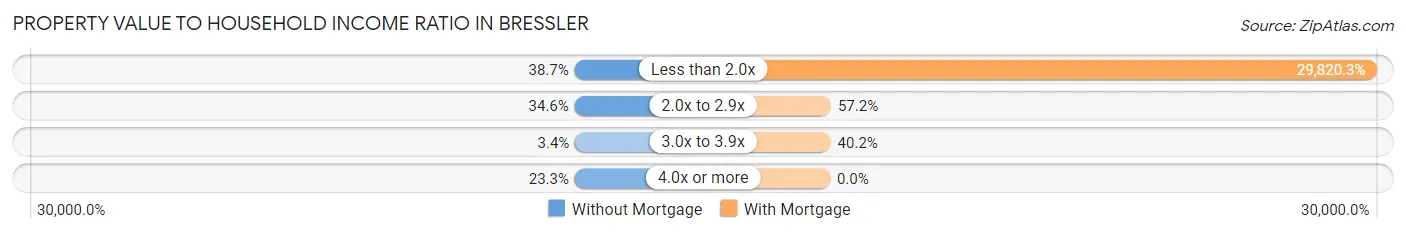
| Value-to-Income Ratio | Without Mortgage | With Mortgage |
| Less than 2.0x | 113 (38.7%) | 91,250 (29,820.3%) |
| 2.0x to 2.9x | 101 (34.6%) | 175 (57.2%) |
| 3.0x to 3.9x | 10 (3.4%) | 123 (40.2%) |
| 4.0x or more | 68 (23.3%) | 0 (0.0%) |
| Total | 292 (100.0%) | 306 (100.0%) |
Real Estate Taxes by Mortgage Status in Bressler
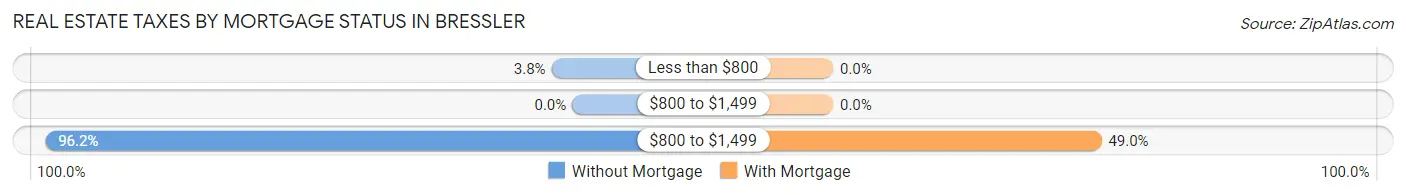
| Property Taxes | Without Mortgage | With Mortgage |
| Less than $800 | 11 (3.8%) | 0 (0.0%) |
| $800 to $1,499 | 0 (0.0%) | 0 (0.0%) |
| $800 to $1,499 | 281 (96.2%) | 150 (49.0%) |
| Total | 292 (100.0%) | 306 (100.0%) |
Health & Disability in Bressler
Health Insurance Coverage by Age in Bressler
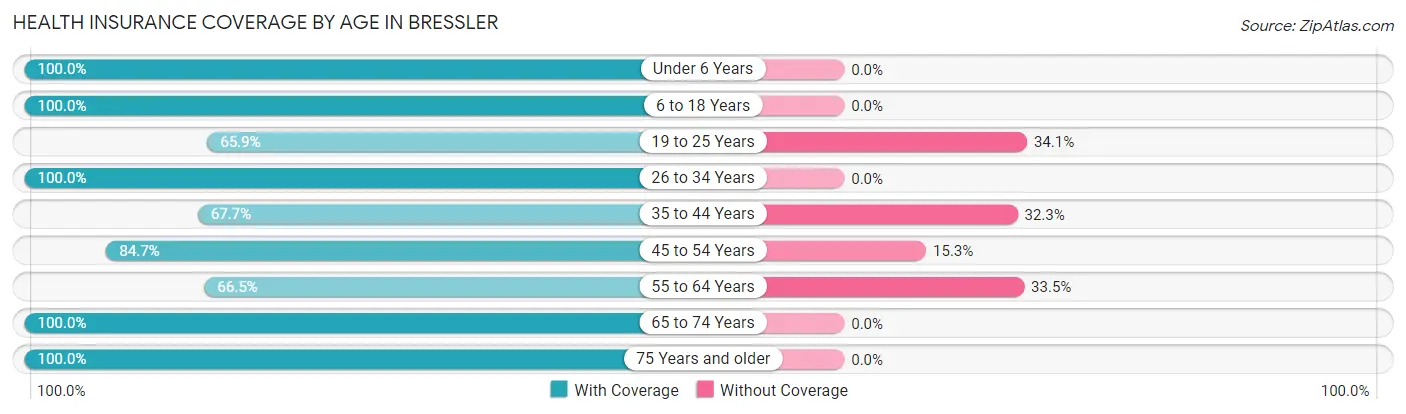
| Age Bracket | With Coverage | Without Coverage |
| Under 6 Years | 204 (100.0%) | 0 (0.0%) |
| 6 to 18 Years | 437 (100.0%) | 0 (0.0%) |
| 19 to 25 Years | 89 (65.9%) | 46 (34.1%) |
| 26 to 34 Years | 222 (100.0%) | 0 (0.0%) |
| 35 to 44 Years | 109 (67.7%) | 52 (32.3%) |
| 45 to 54 Years | 272 (84.7%) | 49 (15.3%) |
| 55 to 64 Years | 325 (66.5%) | 164 (33.5%) |
| 65 to 74 Years | 162 (100.0%) | 0 (0.0%) |
| 75 Years and older | 89 (100.0%) | 0 (0.0%) |
| Total | 1,909 (86.0%) | 311 (14.0%) |
Health Insurance Coverage by Citizenship Status in Bressler
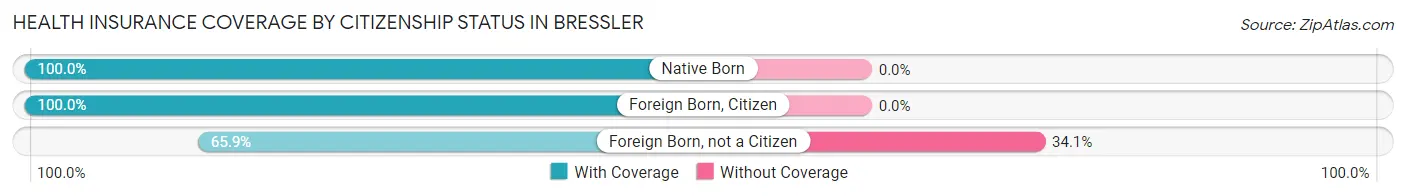
| Citizenship Status | With Coverage | Without Coverage |
| Native Born | 204 (100.0%) | 0 (0.0%) |
| Foreign Born, Citizen | 437 (100.0%) | 0 (0.0%) |
| Foreign Born, not a Citizen | 89 (65.9%) | 46 (34.1%) |
Health Insurance Coverage by Household Income in Bressler
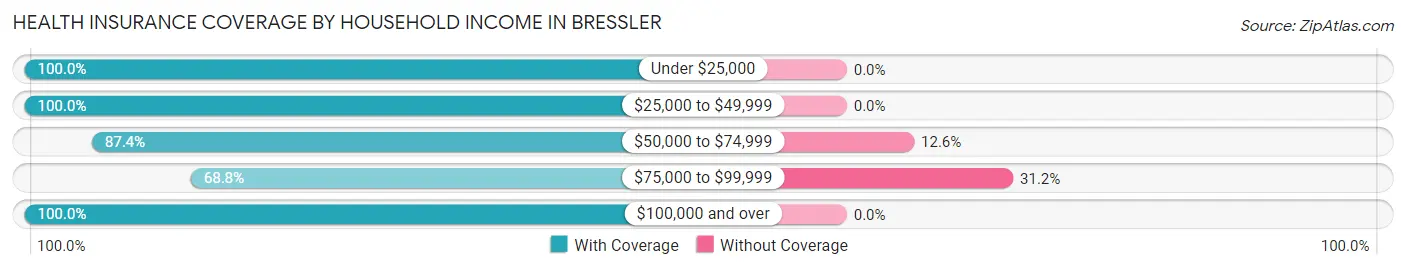
| Household Income | With Coverage | Without Coverage |
| Under $25,000 | 87 (100.0%) | 0 (0.0%) |
| $25,000 to $49,999 | 324 (100.0%) | 0 (0.0%) |
| $50,000 to $74,999 | 700 (87.4%) | 101 (12.6%) |
| $75,000 to $99,999 | 464 (68.8%) | 210 (31.2%) |
| $100,000 and over | 325 (100.0%) | 0 (0.0%) |
Public vs Private Health Insurance Coverage by Age in Bressler
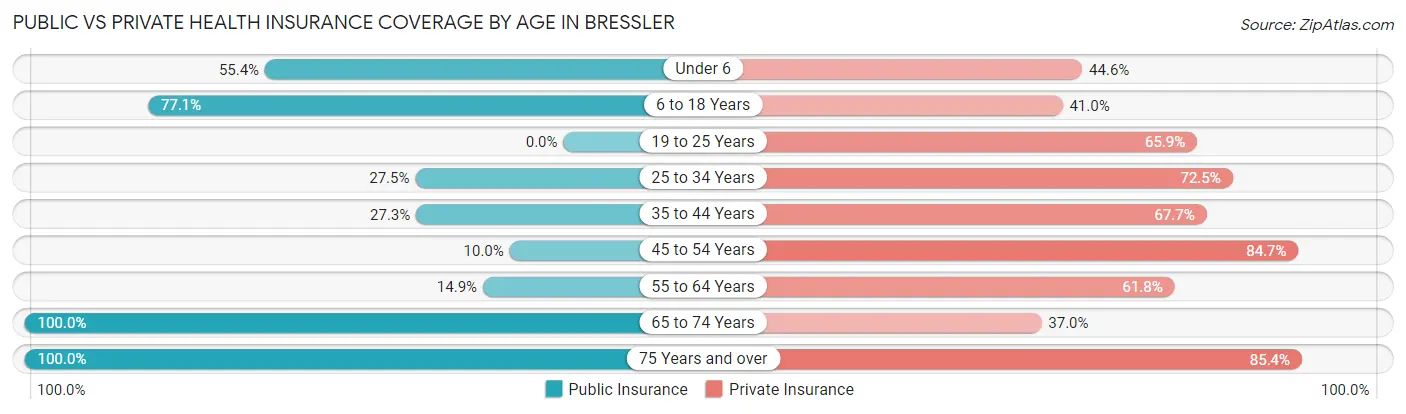
| Age Bracket | Public Insurance | Private Insurance |
| Under 6 | 113 (55.4%) | 91 (44.6%) |
| 6 to 18 Years | 337 (77.1%) | 179 (41.0%) |
| 19 to 25 Years | 0 (0.0%) | 89 (65.9%) |
| 25 to 34 Years | 61 (27.5%) | 161 (72.5%) |
| 35 to 44 Years | 44 (27.3%) | 109 (67.7%) |
| 45 to 54 Years | 32 (10.0%) | 272 (84.7%) |
| 55 to 64 Years | 73 (14.9%) | 302 (61.8%) |
| 65 to 74 Years | 162 (100.0%) | 60 (37.0%) |
| 75 Years and over | 89 (100.0%) | 76 (85.4%) |
| Total | 911 (41.0%) | 1,339 (60.3%) |
Disability Status by Sex by Age in Bressler
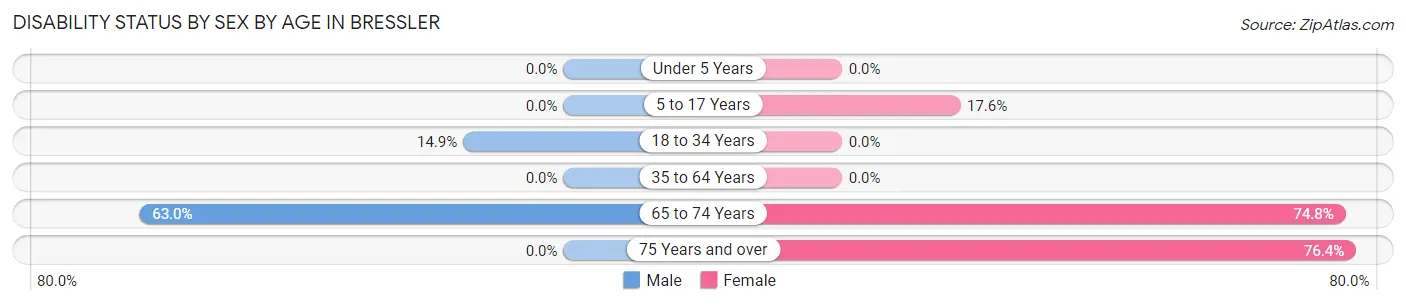
| Age Bracket | Male | Female |
| Under 5 Years | 0 (0.0%) | 0 (0.0%) |
| 5 to 17 Years | 0 (0.0%) | 46 (17.6%) |
| 18 to 34 Years | 31 (14.9%) | 0 (0.0%) |
| 35 to 64 Years | 0 (0.0%) | 0 (0.0%) |
| 65 to 74 Years | 17 (63.0%) | 101 (74.8%) |
| 75 Years and over | 0 (0.0%) | 42 (76.4%) |
Disability Class by Sex by Age in Bressler
Disability Class: Hearing Difficulty
| Age Bracket | Male | Female |
| Under 5 Years | 0 (0.0%) | 0 (0.0%) |
| 5 to 17 Years | 0 (0.0%) | 0 (0.0%) |
| 18 to 34 Years | 0 (0.0%) | 0 (0.0%) |
| 35 to 64 Years | 0 (0.0%) | 0 (0.0%) |
| 65 to 74 Years | 0 (0.0%) | 0 (0.0%) |
| 75 Years and over | 0 (0.0%) | 0 (0.0%) |
Disability Class: Vision Difficulty
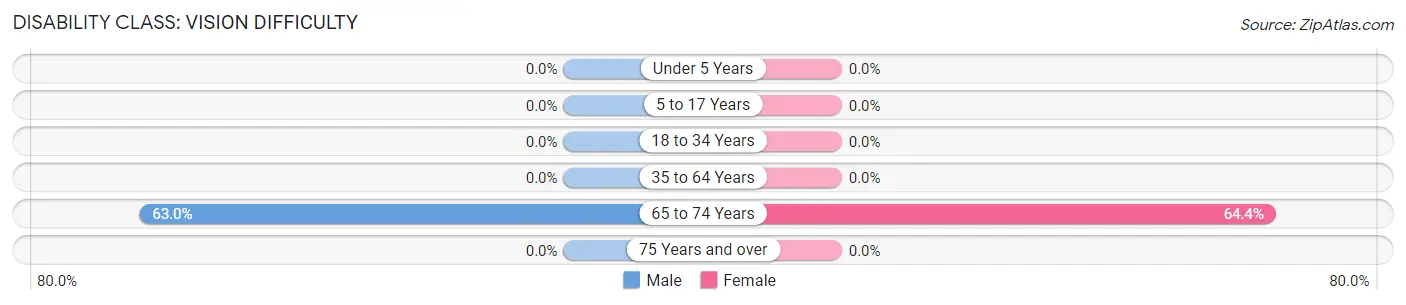
| Age Bracket | Male | Female |
| Under 5 Years | 0 (0.0%) | 0 (0.0%) |
| 5 to 17 Years | 0 (0.0%) | 0 (0.0%) |
| 18 to 34 Years | 0 (0.0%) | 0 (0.0%) |
| 35 to 64 Years | 0 (0.0%) | 0 (0.0%) |
| 65 to 74 Years | 17 (63.0%) | 87 (64.4%) |
| 75 Years and over | 0 (0.0%) | 0 (0.0%) |
Disability Class: Cognitive Difficulty
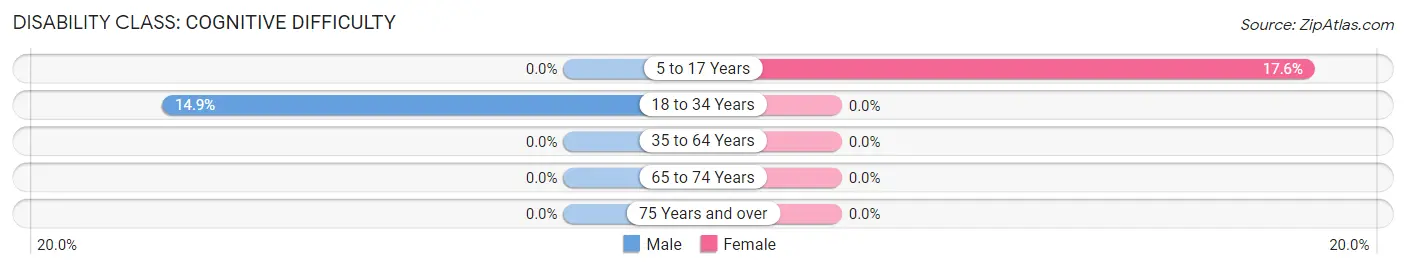
| Age Bracket | Male | Female |
| 5 to 17 Years | 0 (0.0%) | 46 (17.6%) |
| 18 to 34 Years | 31 (14.9%) | 0 (0.0%) |
| 35 to 64 Years | 0 (0.0%) | 0 (0.0%) |
| 65 to 74 Years | 0 (0.0%) | 0 (0.0%) |
| 75 Years and over | 0 (0.0%) | 0 (0.0%) |
Disability Class: Ambulatory Difficulty
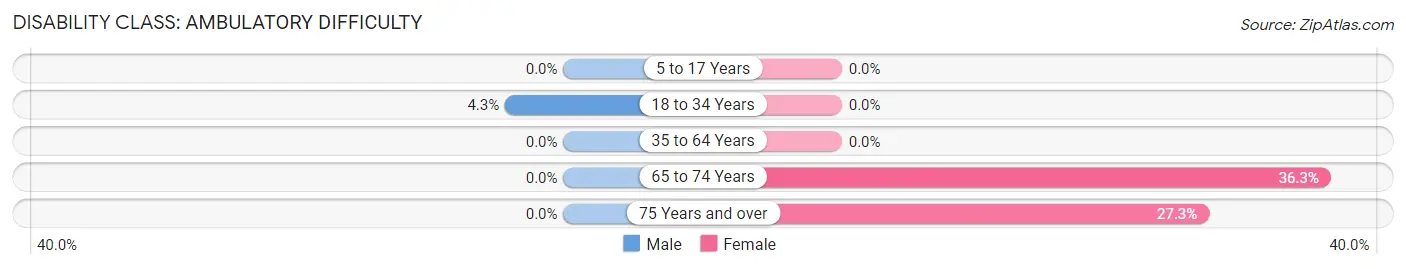
| Age Bracket | Male | Female |
| 5 to 17 Years | 0 (0.0%) | 0 (0.0%) |
| 18 to 34 Years | 9 (4.3%) | 0 (0.0%) |
| 35 to 64 Years | 0 (0.0%) | 0 (0.0%) |
| 65 to 74 Years | 0 (0.0%) | 49 (36.3%) |
| 75 Years and over | 0 (0.0%) | 15 (27.3%) |
Disability Class: Self-Care Difficulty
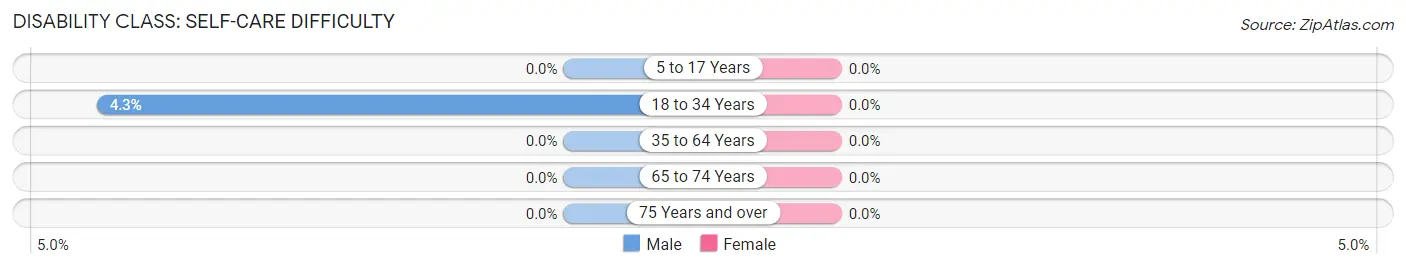
| Age Bracket | Male | Female |
| 5 to 17 Years | 0 (0.0%) | 0 (0.0%) |
| 18 to 34 Years | 9 (4.3%) | 0 (0.0%) |
| 35 to 64 Years | 0 (0.0%) | 0 (0.0%) |
| 65 to 74 Years | 0 (0.0%) | 0 (0.0%) |
| 75 Years and over | 0 (0.0%) | 0 (0.0%) |
Technology Access in Bressler
Computing Device Access in Bressler
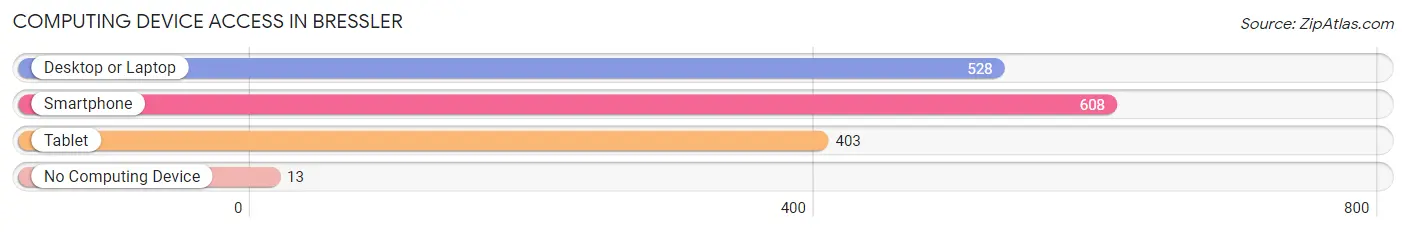
| Device Type | # Households | % Households |
| Desktop or Laptop | 528 | 70.2% |
| Smartphone | 608 | 80.8% |
| Tablet | 403 | 53.6% |
| No Computing Device | 13 | 1.7% |
| Total | 752 | 100.0% |
Internet Access in Bressler
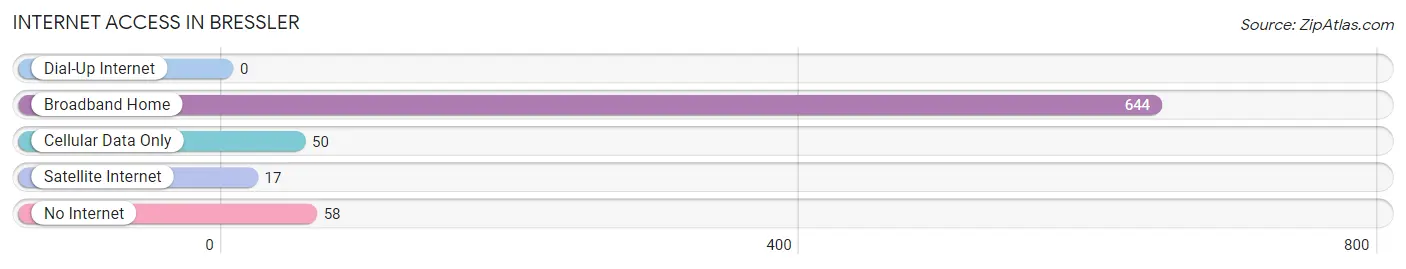
| Internet Type | # Households | % Households |
| Dial-Up Internet | 0 | 0.0% |
| Broadband Home | 644 | 85.6% |
| Cellular Data Only | 50 | 6.7% |
| Satellite Internet | 17 | 2.3% |
| No Internet | 58 | 7.7% |
| Total | 752 | 100.0% |
Bressler Summary
Pennsylvania, located in the northeastern United States, is the 33rd most populous state in the country. It is bordered by New York, New Jersey, Delaware, Maryland, West Virginia, and Ohio. Pennsylvania is known for its rich history, diverse geography, and vibrant economy.
History
Pennsylvania was founded in 1681 by William Penn, a Quaker, who was granted a charter by King Charles II of England. Penn wanted to create a colony that would be a haven for religious freedom and tolerance. Penn named the colony after his father, Admiral William Penn. The colony was initially divided into three counties: Philadelphia, Bucks, and Chester.
Pennsylvania was one of the original 13 colonies that declared independence from Great Britain in 1776. During the Revolutionary War, Pennsylvania was a major center of activity, with Philadelphia serving as the nation’s capital for a brief period. After the war, Pennsylvania became the second state to ratify the United States Constitution in 1787.
Pennsylvania was a major player in the Industrial Revolution, with the state’s coal, iron, and steel industries helping to fuel the nation’s economic growth. Pennsylvania was also a major center of immigration, with many immigrants from Europe and Asia settling in the state.
Geography
Pennsylvania is divided into 67 counties and has an area of 44,817 square miles. The state is divided into four distinct geographic regions: the Appalachian Mountains in the east, the Allegheny Plateau in the west, the Great Lakes Plain in the north, and the Atlantic Coastal Plain in the south.
The Appalachian Mountains are the oldest mountain range in the United States and are home to some of the state’s most rugged terrain. The Allegheny Plateau is a plateau that stretches from the Ohio River to the New York border. The Great Lakes Plain is a flat region that is home to many of the state’s major cities, including Pittsburgh and Erie. The Atlantic Coastal Plain is a low-lying region that is home to many of the state’s beaches and resorts.
Economy
Pennsylvania’s economy is diverse and includes a variety of industries. The state’s largest industries are manufacturing, health care, and education. Pennsylvania is also home to a large agricultural sector, with the state’s farms producing a variety of crops, including corn, soybeans, and wheat.
Pennsylvania is also home to a large energy sector, with the state’s coal, natural gas, and nuclear power plants providing much of the state’s energy needs. The state is also home to a large tourism industry, with many visitors coming to the state to visit its historic sites, national parks, and other attractions.
Demographics
As of 2019, Pennsylvania had an estimated population of 12.8 million people. The state is home to a diverse population, with the largest ethnic groups being White (77.3%), Black or African American (11.3%), Hispanic or Latino (7.2%), and Asian (3.2%).
Pennsylvania is also home to a large number of immigrants, with the largest immigrant groups being from Mexico (2.2%), India (1.2%), and China (1.1%). The state’s largest religious groups are Protestant (48.2%), Catholic (25.2%), and Jewish (2.2%).
Conclusion
Pennsylvania is a state with a rich history, diverse geography, and vibrant economy. The state is home to a diverse population and is a major center of immigration. Pennsylvania is also home to a large energy sector and a large tourism industry. The state’s economy is diverse and includes a variety of industries, including manufacturing, health care, and education.
Common Questions
What is Per Capita Income in Bressler?
Per Capita income in Bressler is $32,771.
What is the Median Family Income in Bressler?
Median Family Income in Bressler is $88,480.
What is the Median Household income in Bressler?
Median Household Income in Bressler is $83,000.
What is Income or Wage Gap in Bressler?
Income or Wage Gap in Bressler is 20.3%.
Women in Bressler earn 79.7 cents for every dollar earned by a man.
What is Inequality or Gini Index in Bressler?
Inequality or Gini Index in Bressler is 0.43.
What is the Total Population of Bressler?
Total Population of Bressler is 2,220.
What is the Total Male Population of Bressler?
Total Male Population of Bressler is 1,173.
What is the Total Female Population of Bressler?
Total Female Population of Bressler is 1,047.
What is the Ratio of Males per 100 Females in Bressler?
There are 112.03 Males per 100 Females in Bressler.
What is the Ratio of Females per 100 Males in Bressler?
There are 89.26 Females per 100 Males in Bressler.
What is the Median Population Age in Bressler?
Median Population Age in Bressler is 44.1 Years.
What is the Average Family Size in Bressler
Average Family Size in Bressler is 3.7 People.
What is the Average Household Size in Bressler
Average Household Size in Bressler is 2.9 People.
How Large is the Labor Force in Bressler?
There are 1,122 People in the Labor Forcein in Bressler.
What is the Percentage of People in the Labor Force in Bressler?
66.4% of People are in the Labor Force in Bressler.
What is the Unemployment Rate in Bressler?
Unemployment Rate in Bressler is 0.9%.