Zip Codes with the Highest Percentage of Population Employed in Food Preparation & Serving in Easton, PA
RELATED REPORTS & OPTIONS
Food Preparation & Serving
Easton
Compare Zip Codes
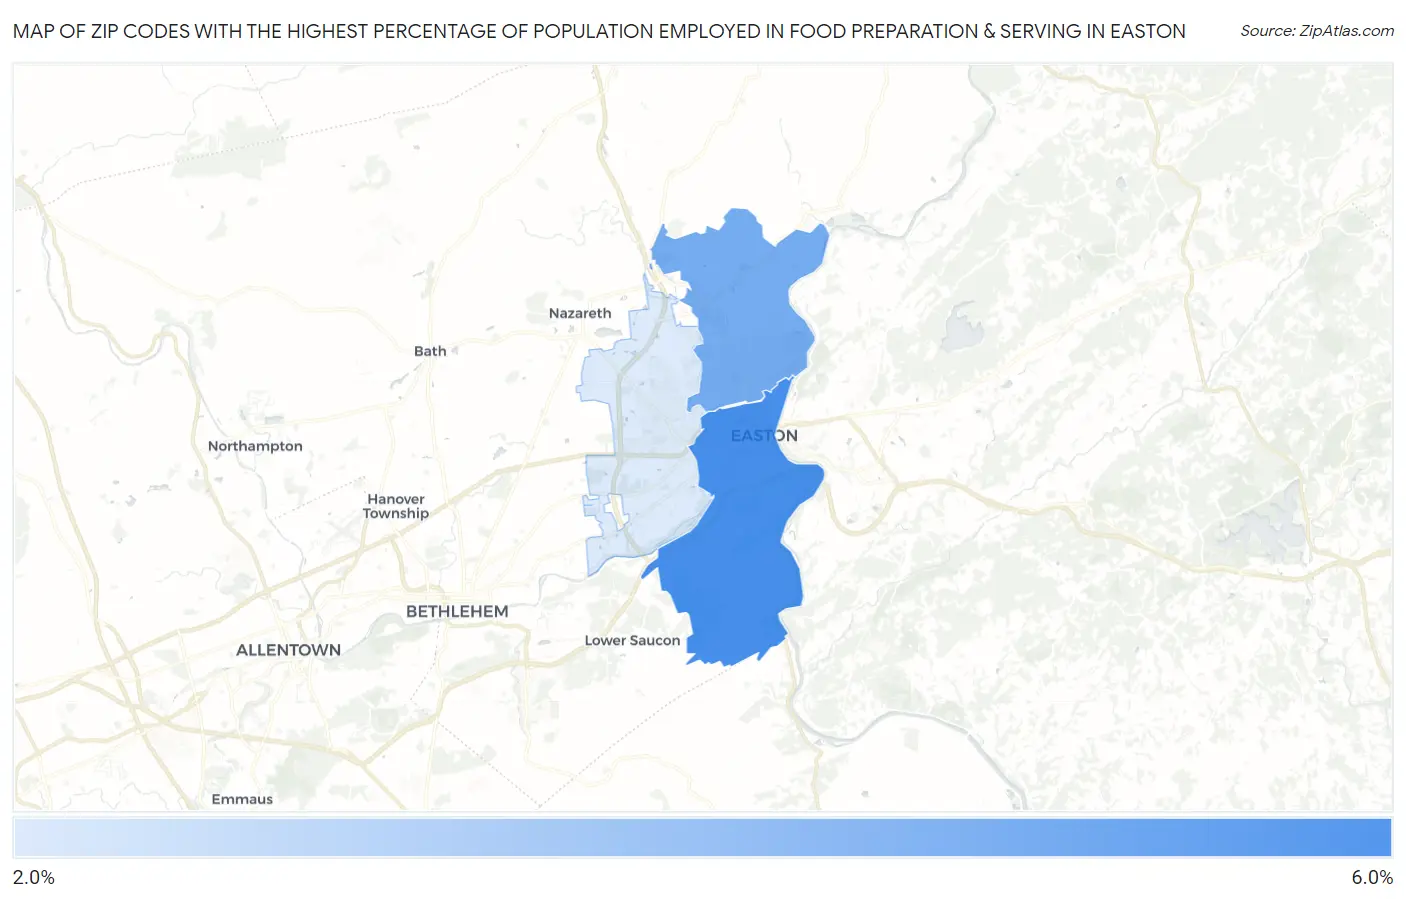
Map of Zip Codes with the Highest Percentage of Population Employed in Food Preparation & Serving in Easton
2.6%
5.0%
Zip Codes with the Highest Percentage of Population Employed in Food Preparation & Serving in Easton, PA
| Zip Code | % Employed | vs State | vs National | |
| 1. | 18042 | 5.0% | 5.0%(-0.026)#727 | 5.3%(-0.269)#12,878 |
| 2. | 18040 | 4.3% | 5.0%(-0.788)#948 | 5.3%(-1.03)#16,079 |
| 3. | 18045 | 2.6% | 5.0%(-2.43)#1,292 | 5.3%(-2.67)#22,715 |
1
Common Questions
What are the Top Zip Codes with the Highest Percentage of Population Employed in Food Preparation & Serving in Easton, PA?
Top Zip Codes with the Highest Percentage of Population Employed in Food Preparation & Serving in Easton, PA are:
What zip code has the Highest Percentage of Population Employed in Food Preparation & Serving in Easton, PA?
18042 has the Highest Percentage of Population Employed in Food Preparation & Serving in Easton, PA with 5.0%.
What is the Percentage of Population Employed in Food Preparation & Serving in Easton, PA?
Percentage of Population Employed in Food Preparation & Serving in Easton is 6.5%.
What is the Percentage of Population Employed in Food Preparation & Serving in Pennsylvania?
Percentage of Population Employed in Food Preparation & Serving in Pennsylvania is 5.0%.
What is the Percentage of Population Employed in Food Preparation & Serving in the United States?
Percentage of Population Employed in Food Preparation & Serving in the United States is 5.3%.