Zip Codes with the Highest Percentage of Population Employed in Food Preparation & Serving in Scranton, PA
RELATED REPORTS & OPTIONS
Food Preparation & Serving
Scranton
Compare Zip Codes
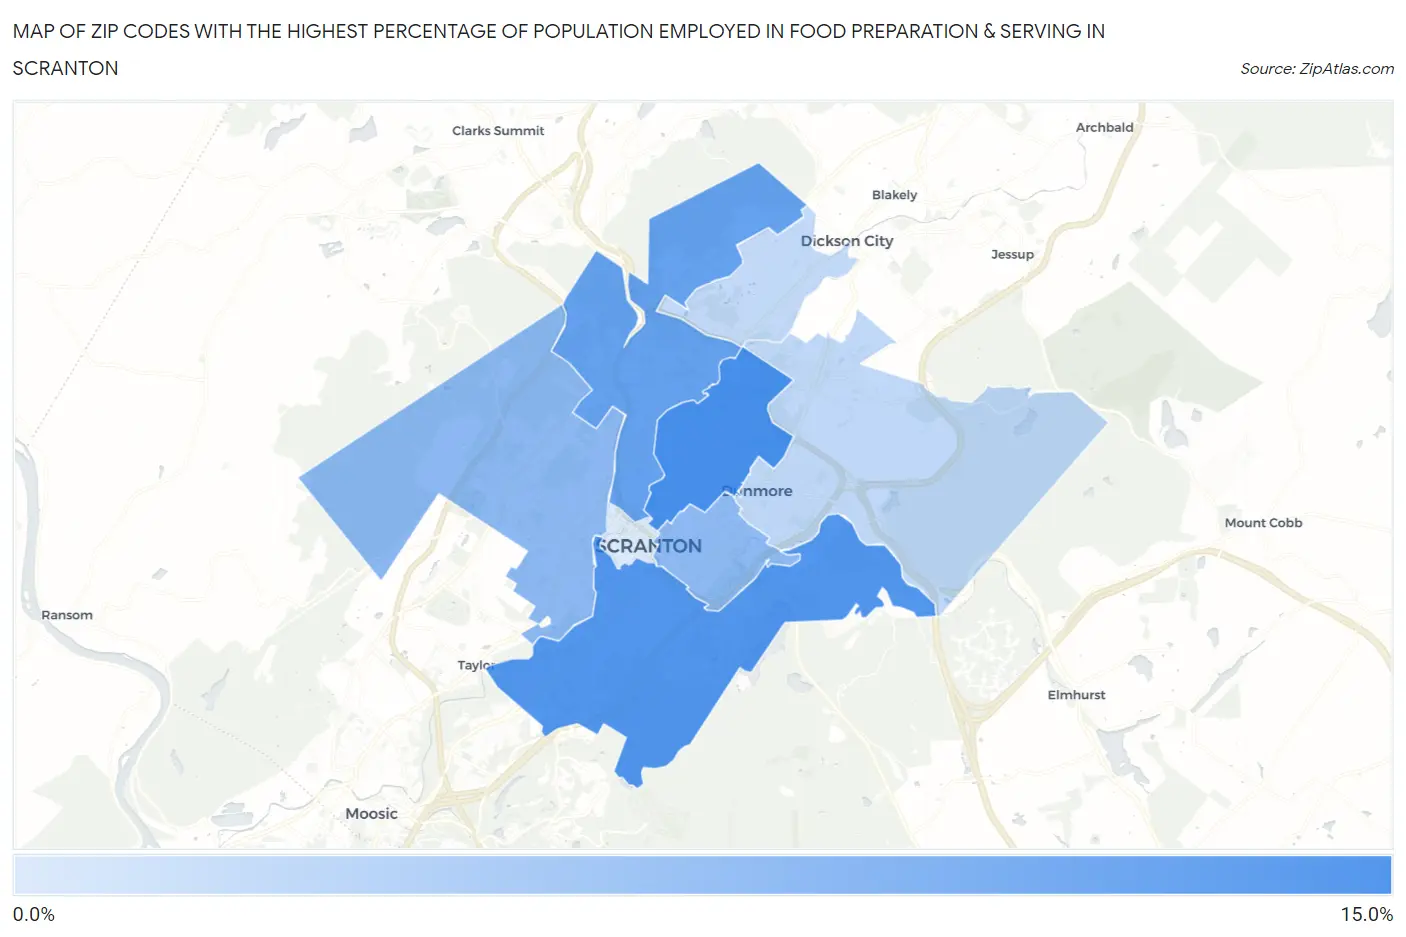
Map of Zip Codes with the Highest Percentage of Population Employed in Food Preparation & Serving in Scranton
1.5%
10.7%
Zip Codes with the Highest Percentage of Population Employed in Food Preparation & Serving in Scranton, PA
| Zip Code | % Employed | vs State | vs National | |
| 1. | 18509 | 10.7% | 5.0%(+5.62)#130 | 5.3%(+5.38)#2,226 |
| 2. | 18505 | 10.0% | 5.0%(+4.91)#144 | 5.3%(+4.67)#2,671 |
| 3. | 18508 | 8.8% | 5.0%(+3.79)#189 | 5.3%(+3.54)#3,683 |
| 4. | 18504 | 6.4% | 5.0%(+1.34)#432 | 5.3%(+1.10)#8,188 |
| 5. | 18510 | 6.2% | 5.0%(+1.16)#462 | 5.3%(+0.913)#8,732 |
| 6. | 18512 | 3.4% | 5.0%(-1.67)#1,129 | 5.3%(-1.92)#19,733 |
| 7. | 18519 | 3.1% | 5.0%(-1.89)#1,188 | 5.3%(-2.14)#20,666 |
| 8. | 18503 | 1.5% | 5.0%(-3.50)#1,448 | 5.3%(-3.74)#25,891 |
1
Common Questions
What are the Top 5 Zip Codes with the Highest Percentage of Population Employed in Food Preparation & Serving in Scranton, PA?
Top 5 Zip Codes with the Highest Percentage of Population Employed in Food Preparation & Serving in Scranton, PA are:
What zip code has the Highest Percentage of Population Employed in Food Preparation & Serving in Scranton, PA?
18509 has the Highest Percentage of Population Employed in Food Preparation & Serving in Scranton, PA with 10.7%.
What is the Percentage of Population Employed in Food Preparation & Serving in Scranton, PA?
Percentage of Population Employed in Food Preparation & Serving in Scranton is 8.6%.
What is the Percentage of Population Employed in Food Preparation & Serving in Pennsylvania?
Percentage of Population Employed in Food Preparation & Serving in Pennsylvania is 5.0%.
What is the Percentage of Population Employed in Food Preparation & Serving in the United States?
Percentage of Population Employed in Food Preparation & Serving in the United States is 5.3%.