Cities with the Highest Percentage of Immigrants from Syria in Pennsylvania
RELATED REPORTS & OPTIONS
Syria
Pennsylvania
Compare Cities
Map of Cities with the Highest Percentage of Immigrants from Syria in Pennsylvania
0.00%
6.00%
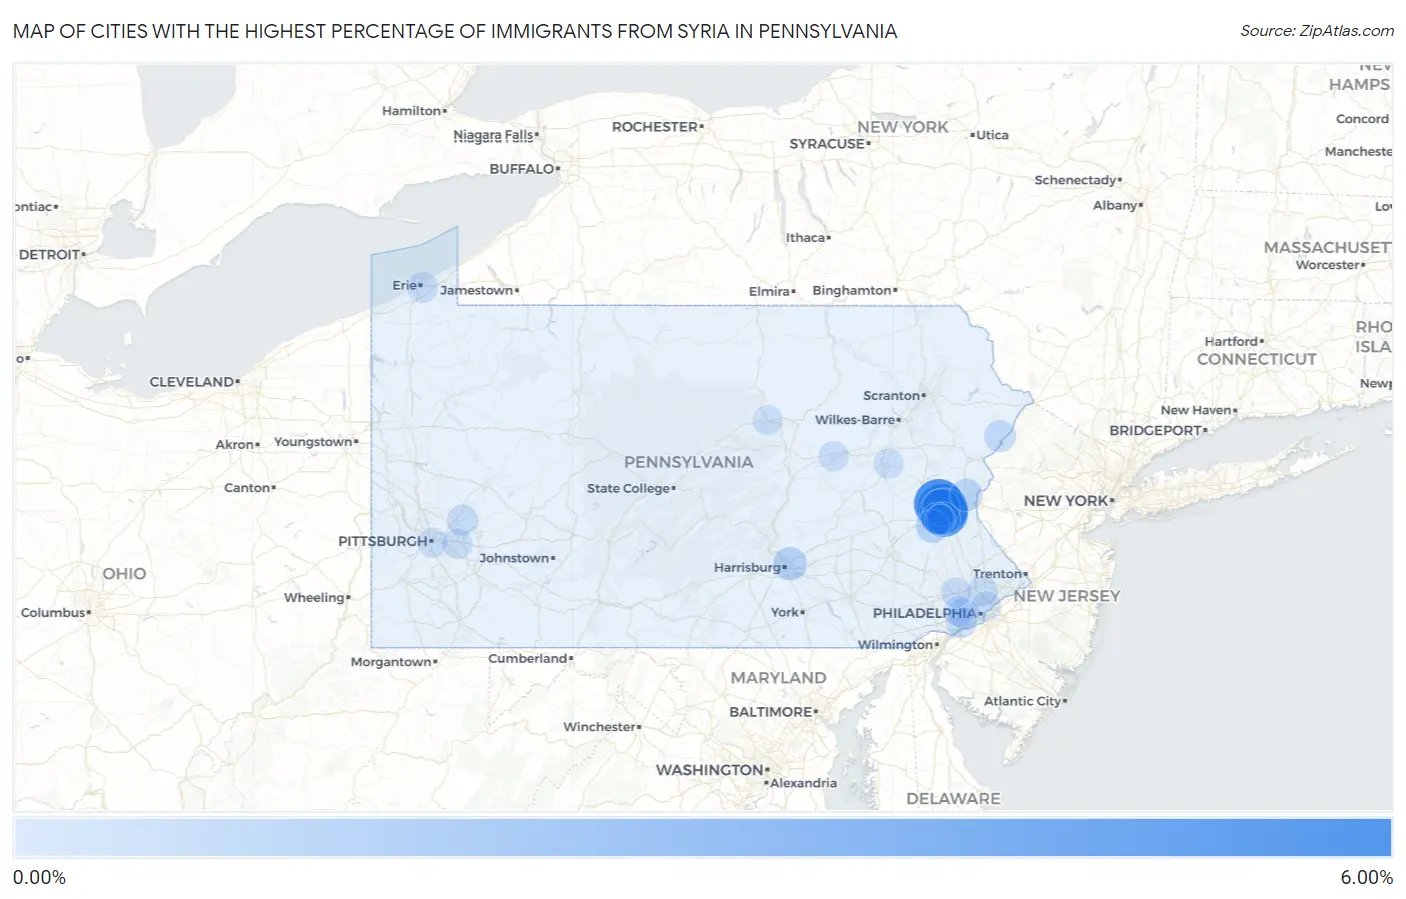
Cities with the Highest Percentage of Immigrants from Syria in Pennsylvania
| City | Syria | vs State | vs National | |
| 1. | Hokendauqua | 5.81% | 0.039%(+5.77)#-1 | 0.033%(+5.78)#0 |
| 2. | Egypt | 5.80% | 0.039%(+5.76)#0 | 0.033%(+5.77)#1 |
| 3. | Fullerton | 5.54% | 0.039%(+5.51)#1 | 0.033%(+5.51)#2 |
| 4. | Stiles | 2.01% | 0.039%(+1.97)#2 | 0.033%(+1.97)#3 |
| 5. | Towanda Borough | 1.67% | 0.039%(+1.63)#3 | 0.033%(+1.64)#4 |
| 6. | Progress | 0.98% | 0.039%(+0.937)#4 | 0.033%(+0.944)#5 |
| 7. | Ancient Oaks | 0.88% | 0.039%(+0.843)#5 | 0.033%(+0.850)#6 |
| 8. | Allentown | 0.80% | 0.039%(+0.756)#10 | 0.033%(+0.763)#483 |
| 9. | Eastlawn Gardens | 0.71% | 0.039%(+0.668)#11 | 0.033%(+0.674)#484 |
| 10. | Whitehall Borough | 0.56% | 0.039%(+0.517)#12 | 0.033%(+0.524)#485 |
| 11. | Macungie Borough | 0.55% | 0.039%(+0.515)#13 | 0.033%(+0.521)#486 |
| 12. | Cetronia | 0.50% | 0.039%(+0.465)#14 | 0.033%(+0.472)#487 |
| 13. | Fountain Hill Borough | 0.50% | 0.039%(+0.459)#15 | 0.033%(+0.465)#488 |
| 14. | Pine Ridge | 0.47% | 0.039%(+0.428)#16 | 0.033%(+0.435)#489 |
| 15. | Brookhaven Borough | 0.40% | 0.039%(+0.360)#17 | 0.033%(+0.366)#490 |
| 16. | Mount Pocono Borough | 0.39% | 0.039%(+0.348)#18 | 0.033%(+0.355)#491 |
| 17. | Media Borough | 0.29% | 0.039%(+0.251)#19 | 0.033%(+0.257)#492 |
| 18. | Carnegie Borough | 0.29% | 0.039%(+0.246)#20 | 0.033%(+0.252)#493 |
| 19. | Hamburg Borough | 0.28% | 0.039%(+0.237)#21 | 0.033%(+0.244)#494 |
| 20. | Catasauqua Borough | 0.26% | 0.039%(+0.222)#22 | 0.033%(+0.228)#495 |
| 21. | Heidelberg Borough | 0.24% | 0.039%(+0.200)#23 | 0.033%(+0.206)#496 |
| 22. | Lower Burrell | 0.22% | 0.039%(+0.183)#24 | 0.033%(+0.189)#497 |
| 23. | Erie | 0.22% | 0.039%(+0.182)#25 | 0.033%(+0.189)#498 |
| 24. | North Catasauqua Borough | 0.20% | 0.039%(+0.164)#26 | 0.033%(+0.170)#499 |
| 25. | Alburtis Borough | 0.19% | 0.039%(+0.155)#27 | 0.033%(+0.162)#500 |
| 26. | Folsom | 0.19% | 0.039%(+0.148)#28 | 0.033%(+0.155)#501 |
| 27. | Glenside | 0.17% | 0.039%(+0.129)#29 | 0.033%(+0.136)#502 |
| 28. | Dunmore Borough | 0.16% | 0.039%(+0.117)#30 | 0.033%(+0.123)#503 |
| 29. | Roslyn | 0.15% | 0.039%(+0.110)#31 | 0.033%(+0.117)#504 |
| 30. | Drexel Hill | 0.14% | 0.039%(+0.104)#32 | 0.033%(+0.111)#505 |
| 31. | Broomall | 0.14% | 0.039%(+0.101)#33 | 0.033%(+0.108)#506 |
| 32. | New Britain Borough | 0.14% | 0.039%(+0.101)#34 | 0.033%(+0.108)#507 |
| 33. | Northampton Borough | 0.14% | 0.039%(+0.096)#35 | 0.033%(+0.103)#508 |
| 34. | Dorneyville | 0.12% | 0.039%(+0.078)#36 | 0.033%(+0.085)#509 |
| 35. | King Of Prussia | 0.074% | 0.039%(+0.034)#37 | 0.033%(+0.041)#510 |
| 36. | Bloomsburg | 0.070% | 0.039%(+0.031)#38 | 0.033%(+0.037)#511 |
| 37. | Monroeville | 0.060% | 0.039%(+0.020)#39 | 0.033%(+0.027)#512 |
| 38. | Williamsport | 0.029% | 0.039%(-0.011)#40 | 0.033%(-0.004)#513 |
| 39. | Hazleton | 0.027% | 0.039%(-0.012)#41 | 0.033%(-0.006)#514 |
| 40. | Pittsburgh | 0.024% | 0.039%(-0.015)#42 | 0.033%(-0.008)#583 |
| 41. | Philadelphia | 0.022% | 0.039%(-0.017)#43 | 0.033%(-0.011)#584 |
Common Questions
What are the Top 10 Cities with the Highest Percentage of Immigrants from Syria in Pennsylvania?
Top 10 Cities with the Highest Percentage of Immigrants from Syria in Pennsylvania are:
#1
5.81%
#2
5.80%
#3
5.54%
#4
2.01%
#5
0.98%
#6
0.88%
#7
0.80%
#8
0.71%
#9
0.50%
#10
0.47%
What city has the Highest Percentage of Immigrants from Syria in Pennsylvania?
Hokendauqua has the Highest Percentage of Immigrants from Syria in Pennsylvania with 5.81%.
What is the Percentage of Immigrants from Syria in the State of Pennsylvania?
Percentage of Immigrants from Syria in Pennsylvania is 0.039%.
What is the Percentage of Immigrants from Syria in the United States?
Percentage of Immigrants from Syria in the United States is 0.033%.