Eastvale borough, PA Map & Demographics
Eastvale borough Overview
$21,875
PER CAPITA INCOME
$49,844
AVG FAMILY INCOME
$49,063
AVG HOUSEHOLD INCOME
46.6%
WAGE / INCOME GAP [ % ]
53.4¢/ $1
WAGE / INCOME GAP [ $ ]
0.31
INEQUALITY / GINI INDEX
177
TOTAL POPULATION
85
MALE POPULATION
92
FEMALE POPULATION
92.39
MALES / 100 FEMALES
108.24
FEMALES / 100 MALES
38.8
MEDIAN AGE
2.9
AVG FAMILY SIZE
2.4
AVG HOUSEHOLD SIZE
87
LABOR FORCE [ PEOPLE ]
56.9%
PERCENT IN LABOR FORCE
11.5%
UNEMPLOYMENT RATE
Income in Eastvale borough
Income Overview in Eastvale borough
Per Capita Income in Eastvale borough is $21,875, while median incomes of families and households are $49,844 and $49,063 respectively.
| Characteristic | Number | Measure |
| Per Capita Income | 177 | $21,875 |
| Median Family Income | 51 | $49,844 |
| Mean Family Income | 51 | $58,643 |
| Median Household Income | 74 | $49,063 |
| Mean Household Income | 74 | $53,211 |
| Income Deficit | 51 | $0 |
| Wage / Income Gap (%) | 177 | 46.64% |
| Wage / Income Gap ($) | 177 | 53.36¢ per $1 |
| Gini / Inequality Index | 177 | 0.31 |
Earnings by Sex in Eastvale borough
Average Earnings in Eastvale borough are $20,938, $27,778 for men and $14,821 for women, a difference of 46.6%.
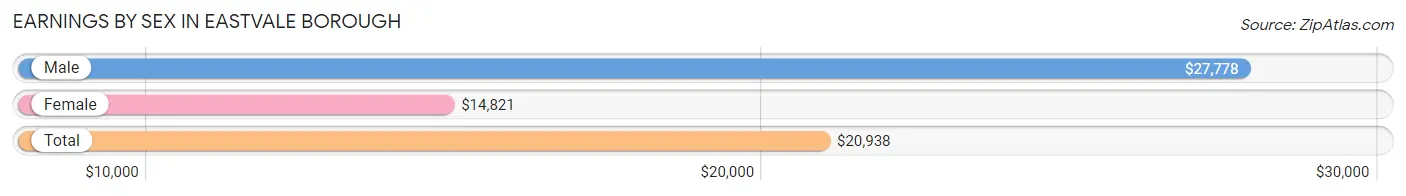
| Sex | Number | Average Earnings |
| Male | 54 (54.5%) | $27,778 |
| Female | 45 (45.5%) | $14,821 |
| Total | 99 (100.0%) | $20,938 |
Earnings by Sex by Income Bracket in Eastvale borough
The most common earnings brackets in Eastvale borough are $17,500 to $19,999 for men (10 | 18.5%) and $2,500 to $4,999 for women (10 | 22.2%).
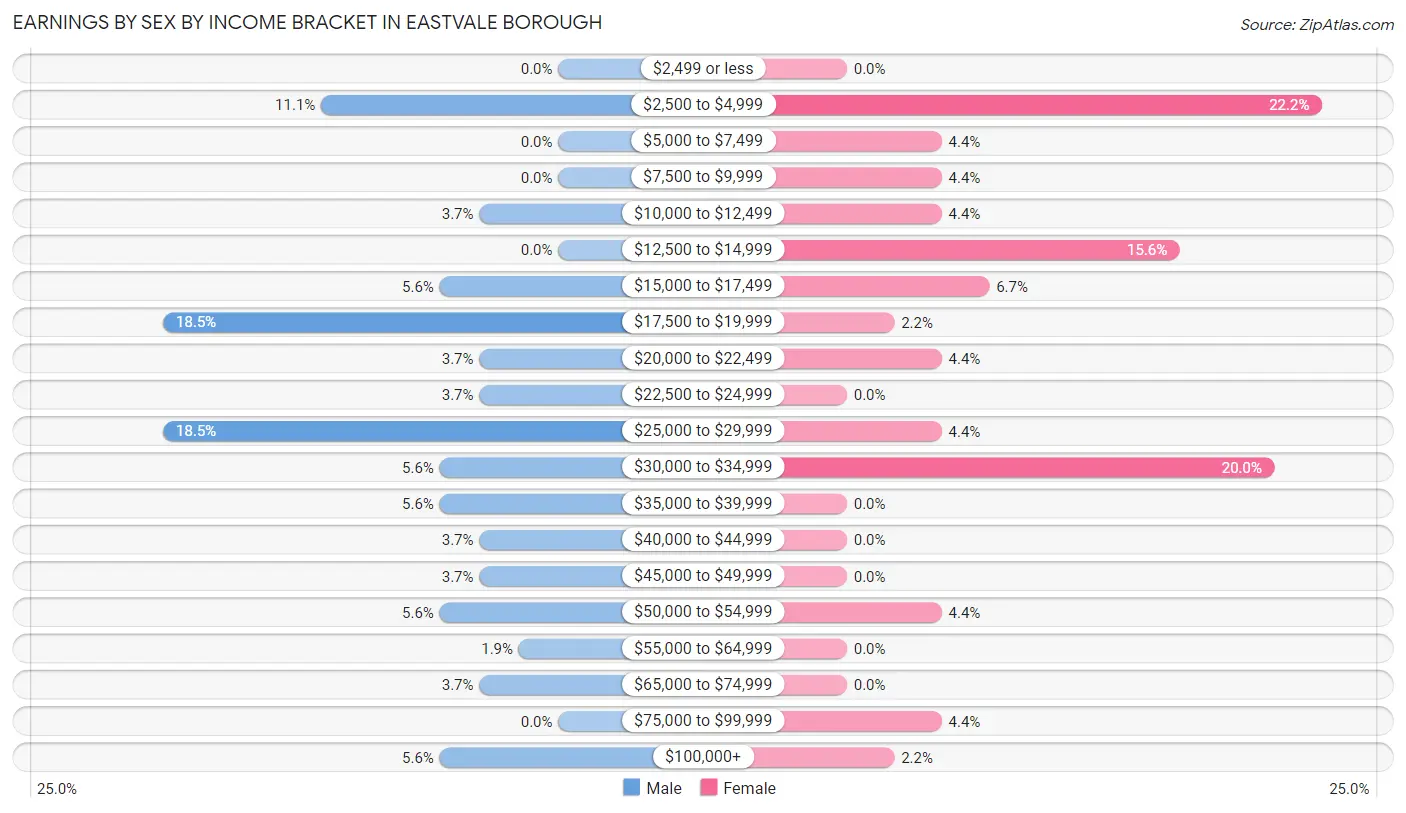
| Income | Male | Female |
| $2,499 or less | 0 (0.0%) | 0 (0.0%) |
| $2,500 to $4,999 | 6 (11.1%) | 10 (22.2%) |
| $5,000 to $7,499 | 0 (0.0%) | 2 (4.4%) |
| $7,500 to $9,999 | 0 (0.0%) | 2 (4.4%) |
| $10,000 to $12,499 | 2 (3.7%) | 2 (4.4%) |
| $12,500 to $14,999 | 0 (0.0%) | 7 (15.6%) |
| $15,000 to $17,499 | 3 (5.6%) | 3 (6.7%) |
| $17,500 to $19,999 | 10 (18.5%) | 1 (2.2%) |
| $20,000 to $22,499 | 2 (3.7%) | 2 (4.4%) |
| $22,500 to $24,999 | 2 (3.7%) | 0 (0.0%) |
| $25,000 to $29,999 | 10 (18.5%) | 2 (4.4%) |
| $30,000 to $34,999 | 3 (5.6%) | 9 (20.0%) |
| $35,000 to $39,999 | 3 (5.6%) | 0 (0.0%) |
| $40,000 to $44,999 | 2 (3.7%) | 0 (0.0%) |
| $45,000 to $49,999 | 2 (3.7%) | 0 (0.0%) |
| $50,000 to $54,999 | 3 (5.6%) | 2 (4.4%) |
| $55,000 to $64,999 | 1 (1.8%) | 0 (0.0%) |
| $65,000 to $74,999 | 2 (3.7%) | 0 (0.0%) |
| $75,000 to $99,999 | 0 (0.0%) | 2 (4.4%) |
| $100,000+ | 3 (5.6%) | 1 (2.2%) |
| Total | 54 (100.0%) | 45 (100.0%) |
Earnings by Sex by Educational Attainment in Eastvale borough
Average earnings in Eastvale borough are $23,125 for men and $27,500 for women, a difference of 15.9%. Men with an educational attainment of college or associate's degree enjoy the highest average annual earnings of $33,125, while those with high school diploma education earn the least with $19,000. Women with an educational attainment of high school diploma earn the most with the average annual earnings of $23,750, while those with high school diploma education have the smallest earnings of $23,750.
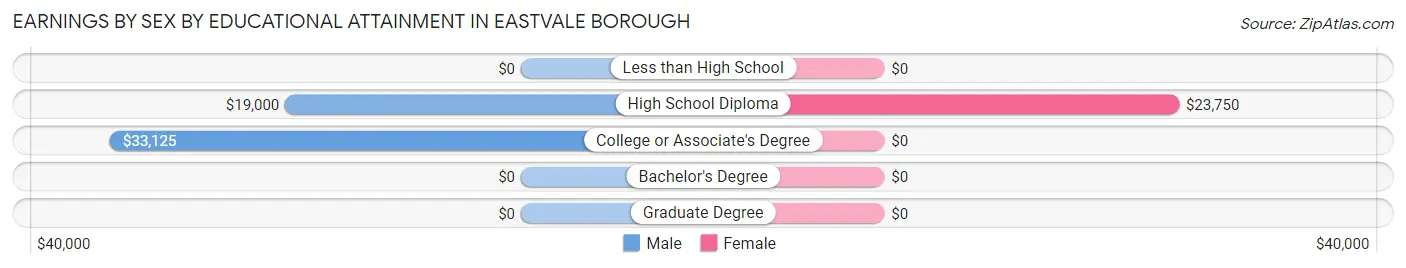
| Educational Attainment | Male Income | Female Income |
| Less than High School | - | - |
| High School Diploma | $19,000 | $23,750 |
| College or Associate's Degree | $33,125 | $0 |
| Bachelor's Degree | - | - |
| Graduate Degree | - | - |
| Total | $23,125 | $27,500 |
Family Income in Eastvale borough
Family Income Brackets in Eastvale borough
According to the Eastvale borough family income data, there are 21 families falling into the $35,000 to $49,999 income range, which is the most common income bracket and makes up 41.2% of all families.
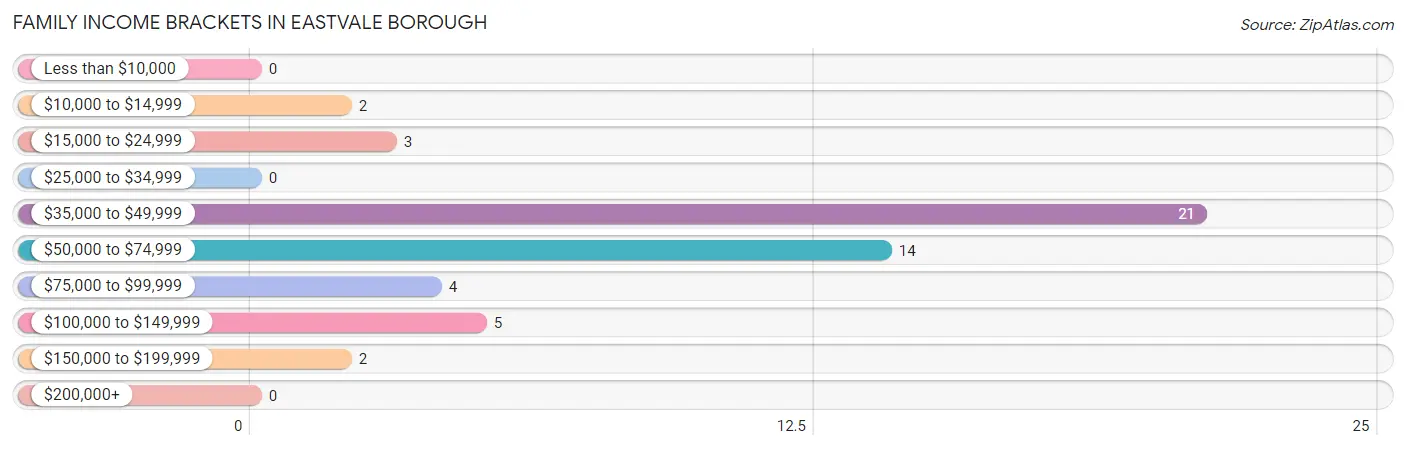
| Income Bracket | # Families | % Families |
| Less than $10,000 | 0 | 0.0% |
| $10,000 to $14,999 | 2 | 3.9% |
| $15,000 to $24,999 | 3 | 5.9% |
| $25,000 to $34,999 | 0 | 0.0% |
| $35,000 to $49,999 | 21 | 41.2% |
| $50,000 to $74,999 | 14 | 27.5% |
| $75,000 to $99,999 | 4 | 7.8% |
| $100,000 to $149,999 | 5 | 9.8% |
| $150,000 to $199,999 | 2 | 3.9% |
| $200,000+ | 0 | 0.0% |
Family Income by Famaliy Size in Eastvale borough
2-person families (18 | 35.3%) account for the highest median family income in Eastvale borough with $55,833 per family, while 2-person families (18 | 35.3%) have the highest median income of $27,916 per family member.
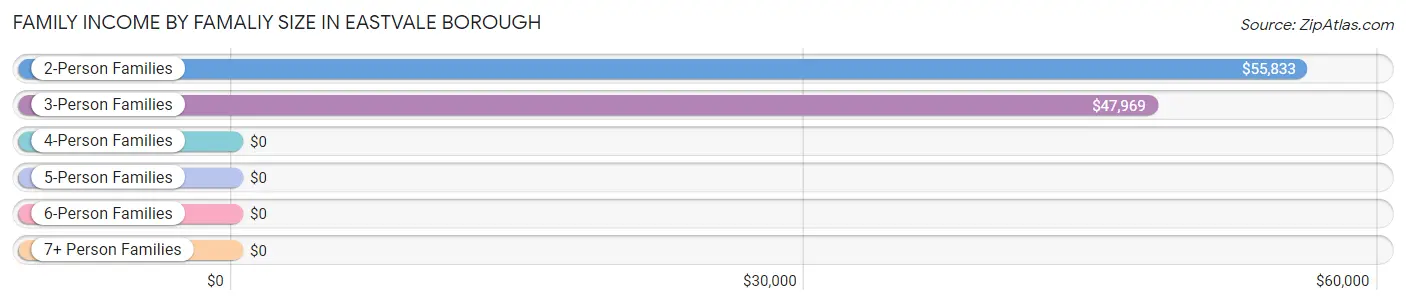
| Income Bracket | # Families | Median Income |
| 2-Person Families | 18 (35.3%) | $55,833 |
| 3-Person Families | 23 (45.1%) | $47,969 |
| 4-Person Families | 8 (15.7%) | $0 |
| 5-Person Families | 0 (0.0%) | $0 |
| 6-Person Families | 0 (0.0%) | $0 |
| 7+ Person Families | 2 (3.9%) | $0 |
| Total | 51 (100.0%) | $49,844 |
Family Income by Number of Earners in Eastvale borough
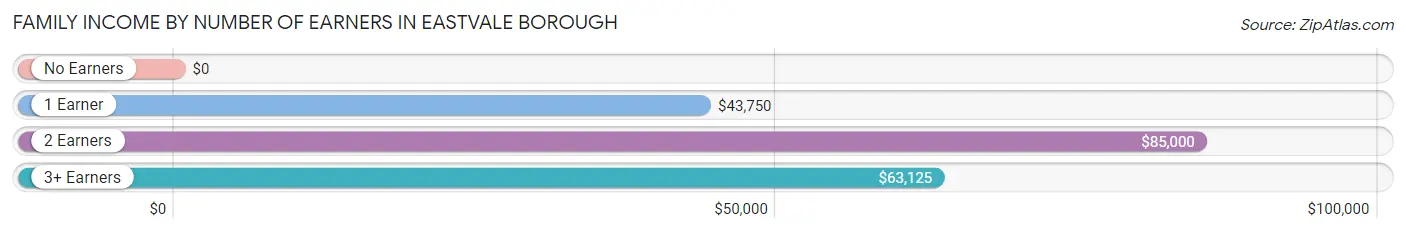
| Number of Earners | # Families | Median Income |
| No Earners | 6 (11.8%) | $0 |
| 1 Earner | 26 (51.0%) | $43,750 |
| 2 Earners | 6 (11.8%) | $85,000 |
| 3+ Earners | 13 (25.5%) | $63,125 |
| Total | 51 (100.0%) | $49,844 |
Household Income in Eastvale borough
Household Income Brackets in Eastvale borough
With 24 households falling in the category, the $35,000 to $49,999 income range is the most frequent in Eastvale borough, accounting for 32.4% of all households.
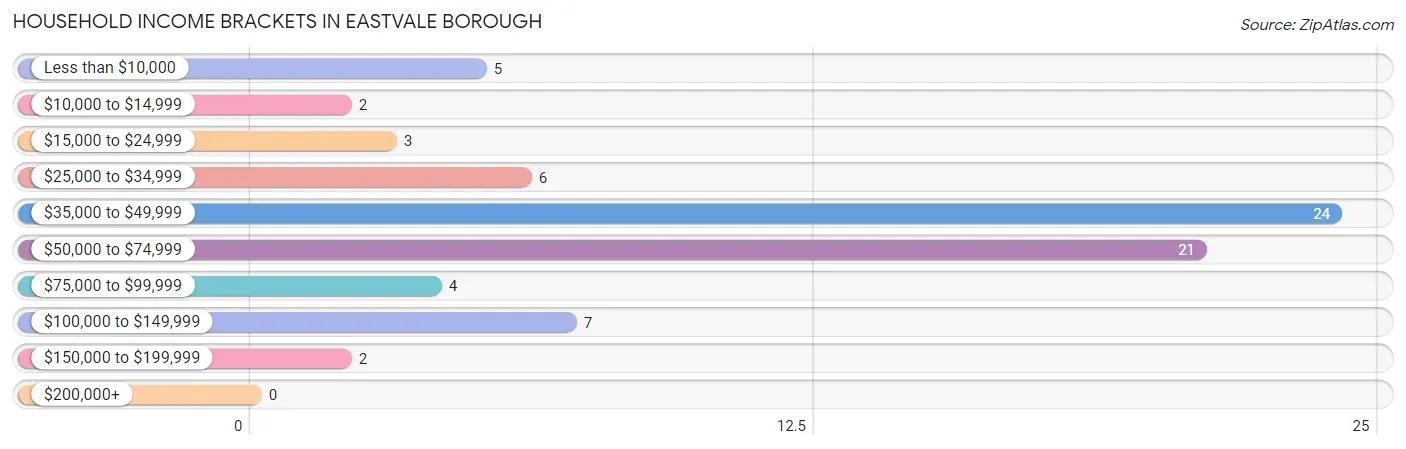
| Income Bracket | # Households | % Households |
| Less than $10,000 | 5 | 6.8% |
| $10,000 to $14,999 | 2 | 2.7% |
| $15,000 to $24,999 | 3 | 4.1% |
| $25,000 to $34,999 | 6 | 8.1% |
| $35,000 to $49,999 | 24 | 32.4% |
| $50,000 to $74,999 | 21 | 28.4% |
| $75,000 to $99,999 | 4 | 5.4% |
| $100,000 to $149,999 | 7 | 9.5% |
| $150,000 to $199,999 | 2 | 2.7% |
| $200,000+ | 0 | 0.0% |
Household Income by Householder Age in Eastvale borough
The median household income in Eastvale borough is $49,063, with the highest median household income of $55,833 found in the 45 to 64 years age bracket for the primary householder. A total of 30 households (40.5%) fall into this category. Meanwhile, the 15 to 24 years age bracket for the primary householder has the lowest median household income of $0, with 8 households (10.8%) in this group.
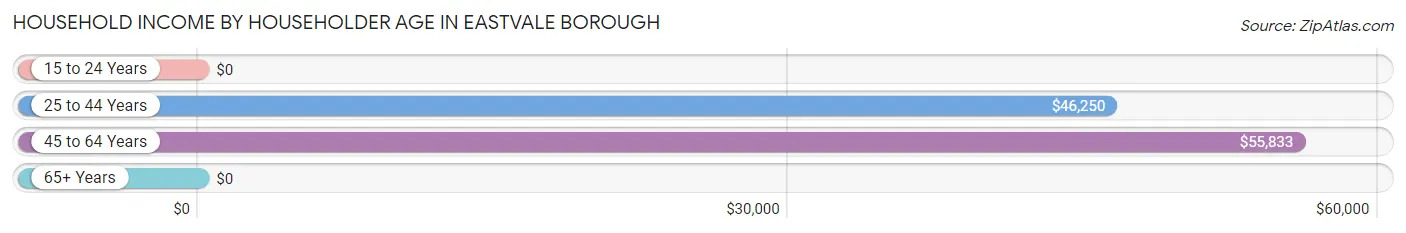
| Income Bracket | # Households | Median Income |
| 15 to 24 Years | 8 (10.8%) | $0 |
| 25 to 44 Years | 20 (27.0%) | $46,250 |
| 45 to 64 Years | 30 (40.5%) | $55,833 |
| 65+ Years | 16 (21.6%) | $0 |
| Total | 74 (100.0%) | $49,063 |
Poverty in Eastvale borough
Income Below Poverty by Sex and Age in Eastvale borough
With 12.9% poverty level for males and 3.3% for females among the residents of Eastvale borough, 5 year old males and 45 to 54 year old females are the most vulnerable to poverty, with 2 males (100.0%) and 2 females (28.6%) in their respective age groups living below the poverty level.
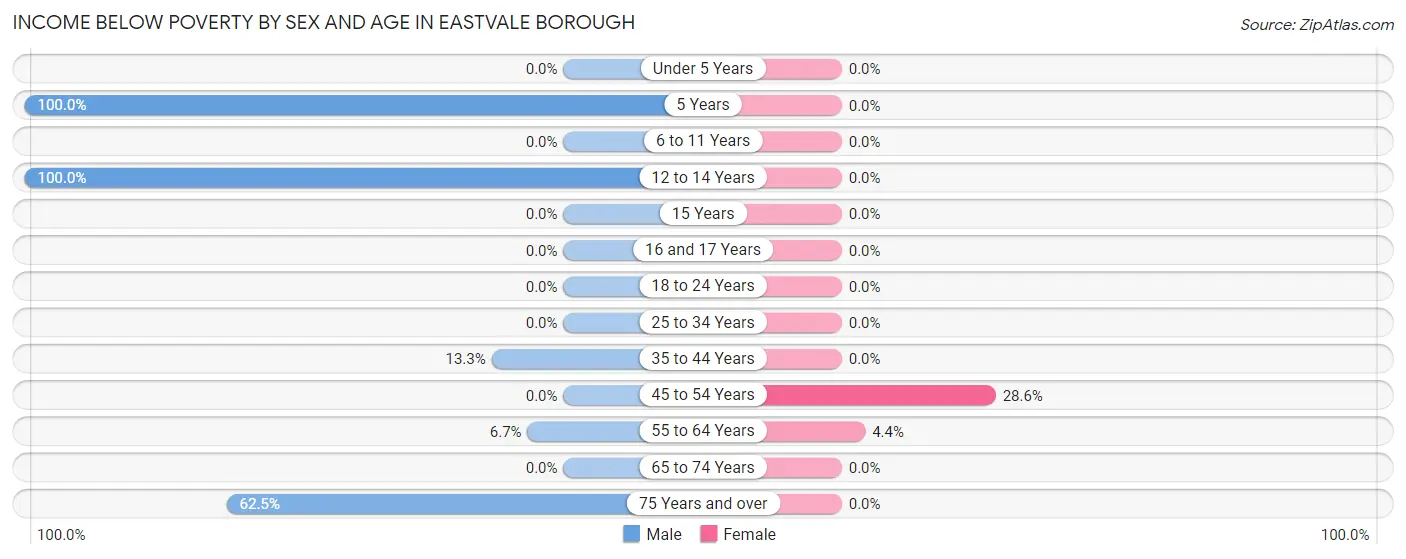
| Age Bracket | Male | Female |
| Under 5 Years | 0 (0.0%) | 0 (0.0%) |
| 5 Years | 2 (100.0%) | 0 (0.0%) |
| 6 to 11 Years | 0 (0.0%) | 0 (0.0%) |
| 12 to 14 Years | 1 (100.0%) | 0 (0.0%) |
| 15 Years | 0 (0.0%) | 0 (0.0%) |
| 16 and 17 Years | 0 (0.0%) | 0 (0.0%) |
| 18 to 24 Years | 0 (0.0%) | 0 (0.0%) |
| 25 to 34 Years | 0 (0.0%) | 0 (0.0%) |
| 35 to 44 Years | 2 (13.3%) | 0 (0.0%) |
| 45 to 54 Years | 0 (0.0%) | 2 (28.6%) |
| 55 to 64 Years | 1 (6.7%) | 1 (4.3%) |
| 65 to 74 Years | 0 (0.0%) | 0 (0.0%) |
| 75 Years and over | 5 (62.5%) | 0 (0.0%) |
| Total | 11 (12.9%) | 3 (3.3%) |
Income Above Poverty by Sex and Age in Eastvale borough
According to the poverty statistics in Eastvale borough, males aged under 5 years and females aged 6 to 11 years are the age groups that are most secure financially, with 100.0% of males and 100.0% of females in these age groups living above the poverty line.
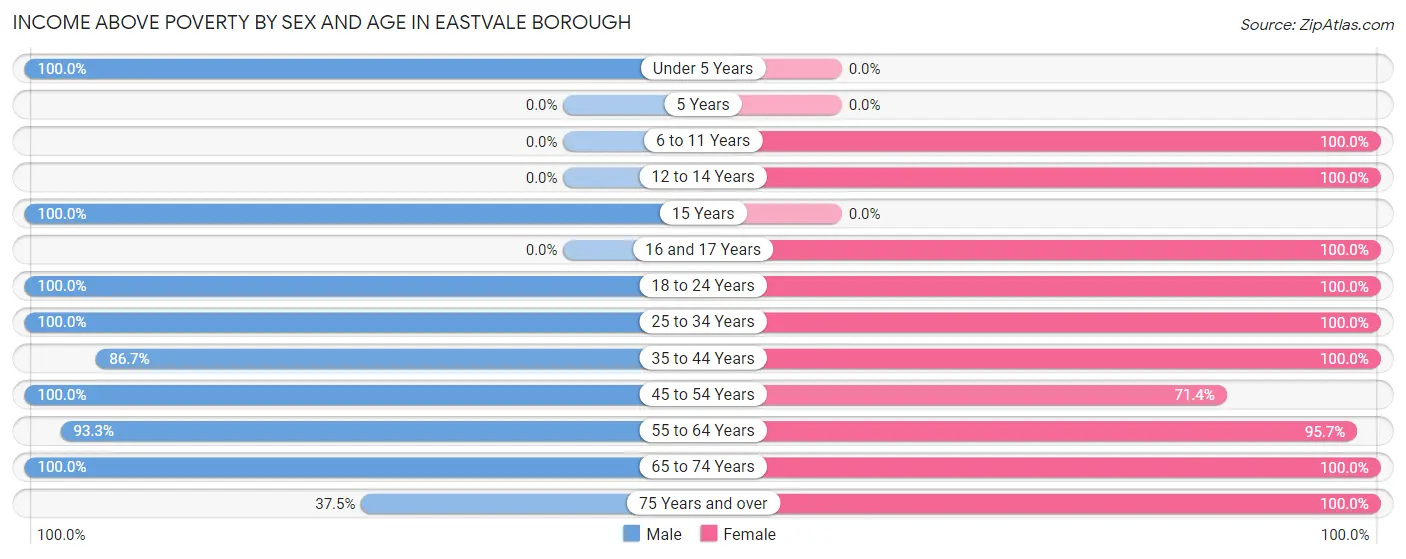
| Age Bracket | Male | Female |
| Under 5 Years | 8 (100.0%) | 0 (0.0%) |
| 5 Years | 0 (0.0%) | 0 (0.0%) |
| 6 to 11 Years | 0 (0.0%) | 9 (100.0%) |
| 12 to 14 Years | 0 (0.0%) | 2 (100.0%) |
| 15 Years | 2 (100.0%) | 0 (0.0%) |
| 16 and 17 Years | 0 (0.0%) | 2 (100.0%) |
| 18 to 24 Years | 11 (100.0%) | 21 (100.0%) |
| 25 to 34 Years | 10 (100.0%) | 6 (100.0%) |
| 35 to 44 Years | 13 (86.7%) | 4 (100.0%) |
| 45 to 54 Years | 6 (100.0%) | 5 (71.4%) |
| 55 to 64 Years | 14 (93.3%) | 22 (95.7%) |
| 65 to 74 Years | 7 (100.0%) | 4 (100.0%) |
| 75 Years and over | 3 (37.5%) | 14 (100.0%) |
| Total | 74 (87.1%) | 89 (96.7%) |
Income Below Poverty Among Married-Couple Families in Eastvale borough
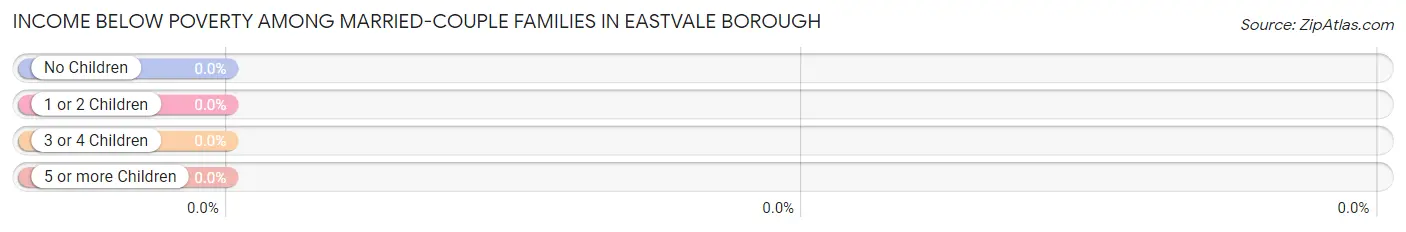
| Children | Above Poverty | Below Poverty |
| No Children | 22 (100.0%) | 0 (0.0%) |
| 1 or 2 Children | 15 (100.0%) | 0 (0.0%) |
| 3 or 4 Children | 2 (100.0%) | 0 (0.0%) |
| 5 or more Children | 0 (0.0%) | 0 (0.0%) |
| Total | 39 (100.0%) | 0 (0.0%) |
Income Below Poverty Among Single-Parent Households in Eastvale borough
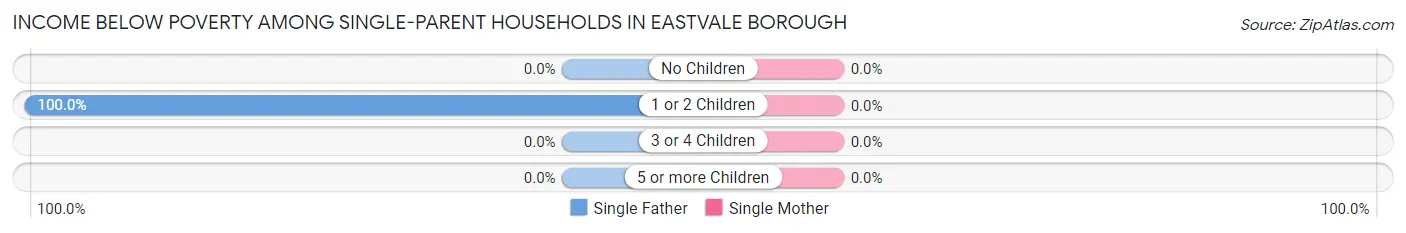
| Children | Single Father | Single Mother |
| No Children | 0 (0.0%) | 0 (0.0%) |
| 1 or 2 Children | 3 (100.0%) | 0 (0.0%) |
| 3 or 4 Children | 0 (0.0%) | 0 (0.0%) |
| 5 or more Children | 0 (0.0%) | 0 (0.0%) |
| Total | 3 (75.0%) | 0 (0.0%) |
Income Below Poverty Among Married-Couple vs Single-Parent Households in Eastvale borough
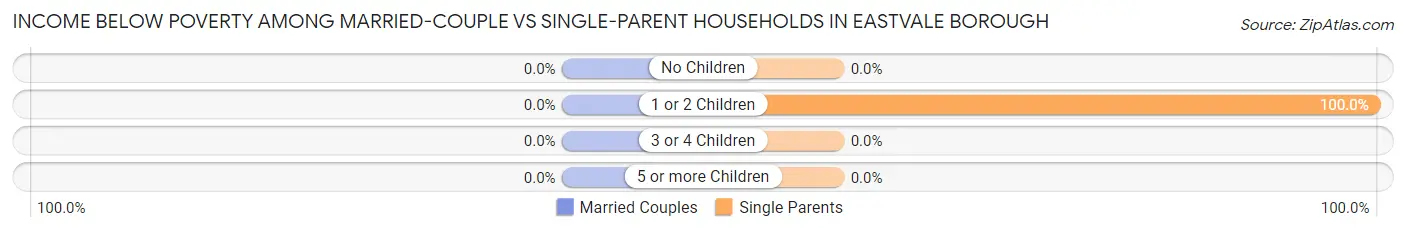
| Children | Married-Couple Families | Single-Parent Households |
| No Children | 0 (0.0%) | 0 (0.0%) |
| 1 or 2 Children | 0 (0.0%) | 3 (100.0%) |
| 3 or 4 Children | 0 (0.0%) | 0 (0.0%) |
| 5 or more Children | 0 (0.0%) | 0 (0.0%) |
| Total | 0 (0.0%) | 3 (25.0%) |
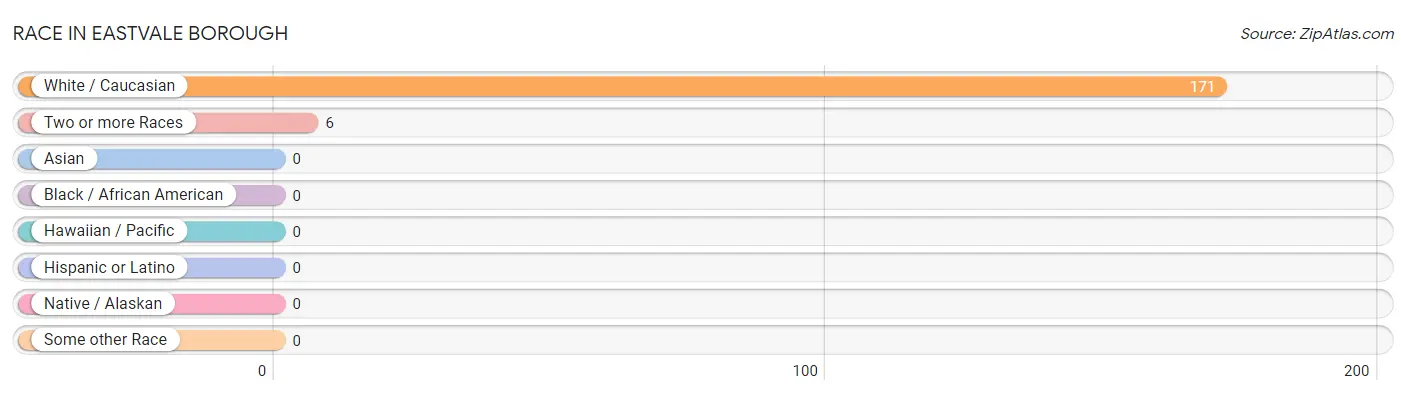
Race in Eastvale borough
The most populous races in Eastvale borough are White / Caucasian (171 | 96.6%), and Two or more Races (6 | 3.4%).
| Race | # Population | % Population |
| Asian | 0 | 0.0% |
| Black / African American | 0 | 0.0% |
| Hawaiian / Pacific | 0 | 0.0% |
| Hispanic or Latino | 0 | 0.0% |
| Native / Alaskan | 0 | 0.0% |
| White / Caucasian | 171 | 96.6% |
| Two or more Races | 6 | 3.4% |
| Some other Race | 0 | 0.0% |
| Total | 177 | 100.0% |
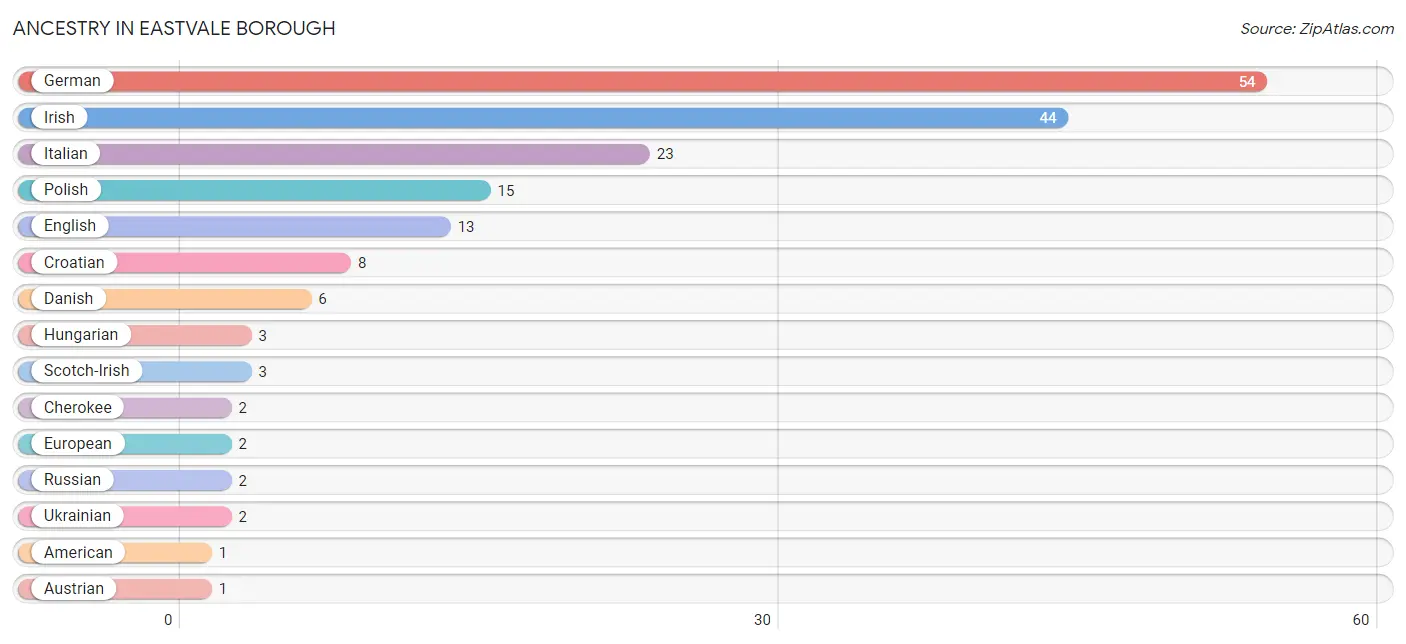
Ancestry in Eastvale borough
The most populous ancestries reported in Eastvale borough are German (54 | 30.5%), Irish (44 | 24.9%), Italian (23 | 13.0%), Polish (15 | 8.5%), and English (13 | 7.3%), together accounting for 84.2% of all Eastvale borough residents.
| Ancestry | # Population | % Population |
| American | 1 | 0.6% |
| Austrian | 1 | 0.6% |
| Cherokee | 2 | 1.1% |
| Croatian | 8 | 4.5% |
| Czech | 1 | 0.6% |
| Danish | 6 | 3.4% |
| English | 13 | 7.3% |
| European | 2 | 1.1% |
| German | 54 | 30.5% |
| Hungarian | 3 | 1.7% |
| Irish | 44 | 24.9% |
| Italian | 23 | 13.0% |
| Polish | 15 | 8.5% |
| Russian | 2 | 1.1% |
| Scotch-Irish | 3 | 1.7% |
| Slovak | 1 | 0.6% |
| Ukrainian | 2 | 1.1% | View All 17 Rows |
Immigrants in Eastvale borough

| Immigration Origin | # Population | % Population | View All 0 Rows |
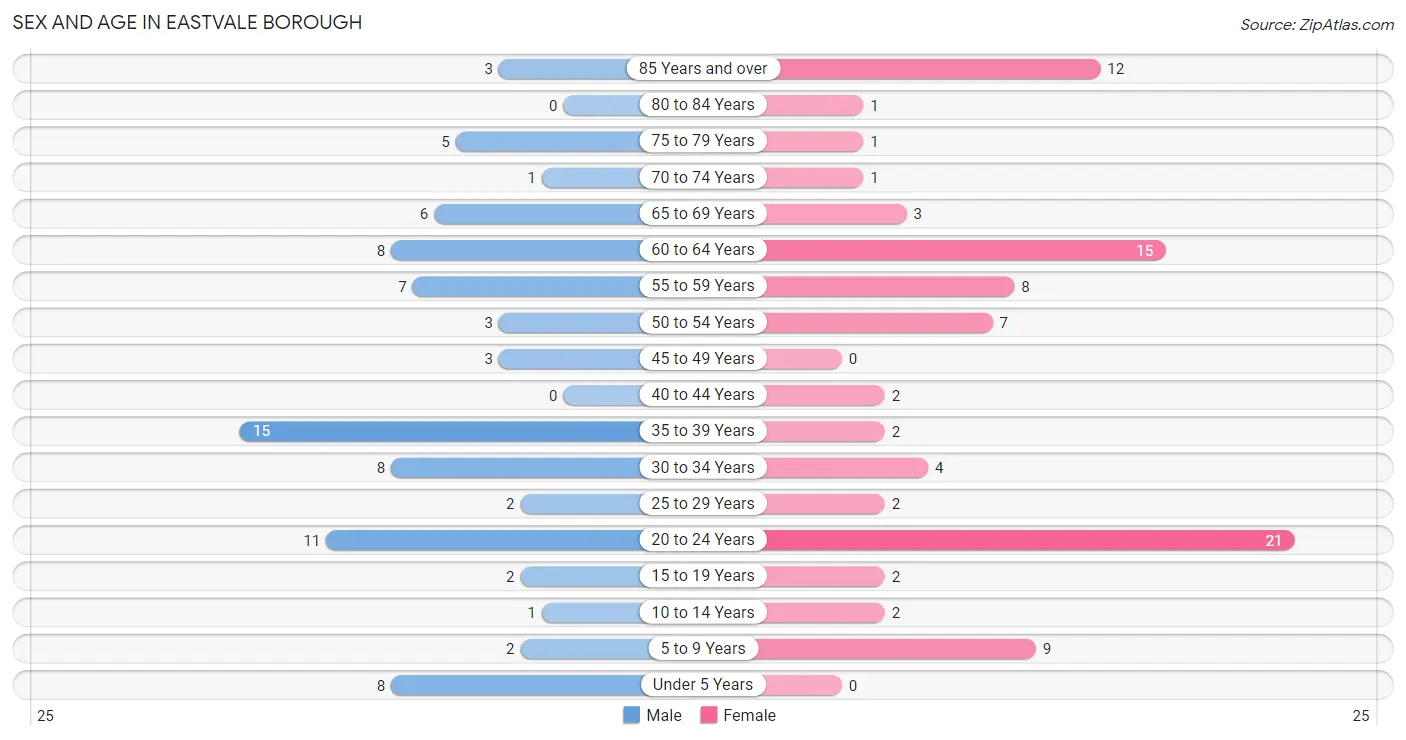
Sex and Age in Eastvale borough
Sex and Age in Eastvale borough
The most populous age groups in Eastvale borough are 35 to 39 Years (15 | 17.6%) for men and 20 to 24 Years (21 | 22.8%) for women.
| Age Bracket | Male | Female |
| Under 5 Years | 8 (9.4%) | 0 (0.0%) |
| 5 to 9 Years | 2 (2.4%) | 9 (9.8%) |
| 10 to 14 Years | 1 (1.2%) | 2 (2.2%) |
| 15 to 19 Years | 2 (2.4%) | 2 (2.2%) |
| 20 to 24 Years | 11 (12.9%) | 21 (22.8%) |
| 25 to 29 Years | 2 (2.4%) | 2 (2.2%) |
| 30 to 34 Years | 8 (9.4%) | 4 (4.3%) |
| 35 to 39 Years | 15 (17.6%) | 2 (2.2%) |
| 40 to 44 Years | 0 (0.0%) | 2 (2.2%) |
| 45 to 49 Years | 3 (3.5%) | 0 (0.0%) |
| 50 to 54 Years | 3 (3.5%) | 7 (7.6%) |
| 55 to 59 Years | 7 (8.2%) | 8 (8.7%) |
| 60 to 64 Years | 8 (9.4%) | 15 (16.3%) |
| 65 to 69 Years | 6 (7.1%) | 3 (3.3%) |
| 70 to 74 Years | 1 (1.2%) | 1 (1.1%) |
| 75 to 79 Years | 5 (5.9%) | 1 (1.1%) |
| 80 to 84 Years | 0 (0.0%) | 1 (1.1%) |
| 85 Years and over | 3 (3.5%) | 12 (13.0%) |
| Total | 85 (100.0%) | 92 (100.0%) |
Families and Households in Eastvale borough
Median Family Size in Eastvale borough
The median family size in Eastvale borough is 2.92 persons per family, with single female/mother families (8 | 15.7%) accounting for the largest median family size of 3.5 persons per family. On the other hand, single male/father families (4 | 7.8%) represent the smallest median family size with 2.25 persons per family.
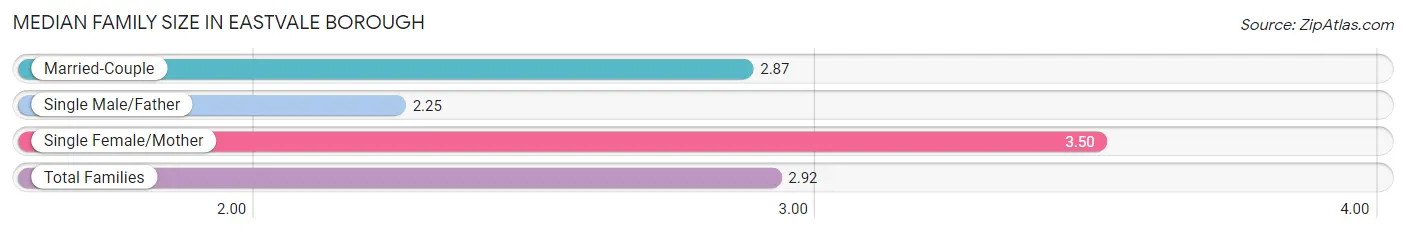
| Family Type | # Families | Family Size |
| Married-Couple | 39 (76.5%) | 2.87 |
| Single Male/Father | 4 (7.8%) | 2.25 |
| Single Female/Mother | 8 (15.7%) | 3.50 |
| Total Families | 51 (100.0%) | 2.92 |
Median Household Size in Eastvale borough
The median household size in Eastvale borough is 2.39 persons per household, with single female/mother households (8 | 10.8%) accounting for the largest median household size of 3.5 persons per household. non-family households (23 | 31.1%) represent the smallest median household size with 1.04 persons per household.
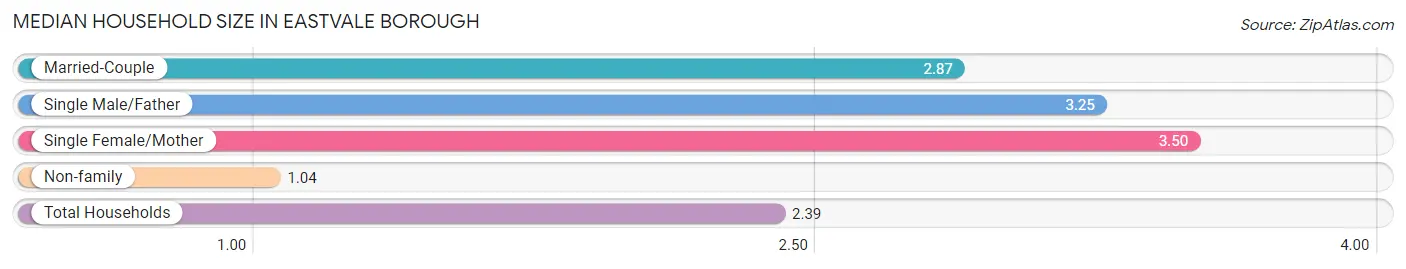
| Household Type | # Households | Household Size |
| Married-Couple | 39 (52.7%) | 2.87 |
| Single Male/Father | 4 (5.4%) | 3.25 |
| Single Female/Mother | 8 (10.8%) | 3.50 |
| Non-family | 23 (31.1%) | 1.04 |
| Total Households | 74 (100.0%) | 2.39 |
Household Size by Marriage Status in Eastvale borough
Out of a total of 74 households in Eastvale borough, 51 (68.9%) are family households, while 23 (31.1%) are nonfamily households. The most numerous type of family households are 3-person households, comprising 26, and the most common type of nonfamily households are 1-person households, comprising 22.
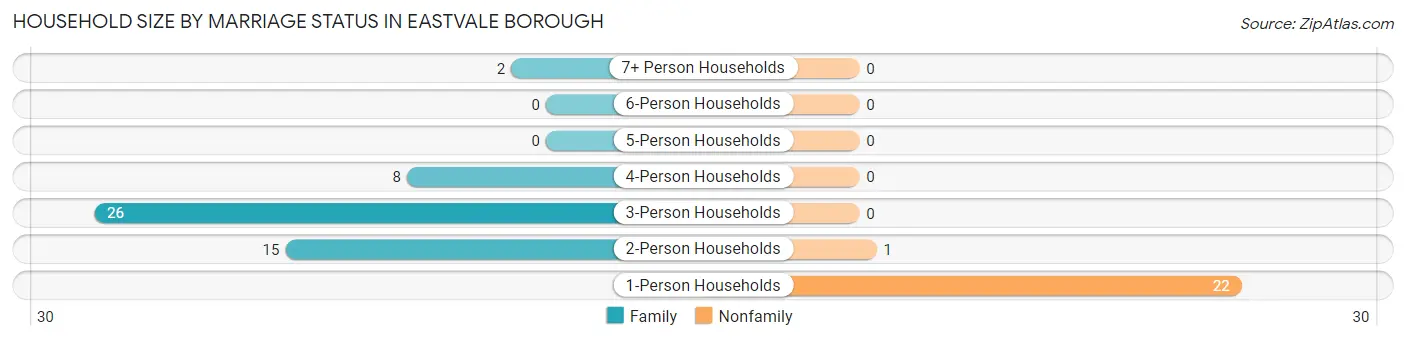
| Household Size | Family Households | Nonfamily Households |
| 1-Person Households | - | 22 (29.7%) |
| 2-Person Households | 15 (20.3%) | 1 (1.3%) |
| 3-Person Households | 26 (35.1%) | 0 (0.0%) |
| 4-Person Households | 8 (10.8%) | 0 (0.0%) |
| 5-Person Households | 0 (0.0%) | 0 (0.0%) |
| 6-Person Households | 0 (0.0%) | 0 (0.0%) |
| 7+ Person Households | 2 (2.7%) | 0 (0.0%) |
| Total | 51 (68.9%) | 23 (31.1%) |
Female Fertility in Eastvale borough
Fertility by Age in Eastvale borough
| Age Bracket | Women with Births | Births / 1,000 Women |
| 15 to 19 years | 0 (0.0%) | 0.0 |
| 20 to 34 years | 0 (0.0%) | 0.0 |
| 35 to 50 years | 0 (0.0%) | 0.0 |
| Total | 0 (0.0%) | 0.0 |
Fertility by Age by Marriage Status in Eastvale borough
| Age Bracket | Married | Unmarried |
| 15 to 19 years | 0 (0.0%) | 0 (0.0%) |
| 20 to 34 years | 0 (0.0%) | 0 (0.0%) |
| 35 to 50 years | 0 (0.0%) | 0 (0.0%) |
| Total | 0 (0.0%) | 0 (0.0%) |
Fertility by Education in Eastvale borough
| Educational Attainment | Women with Births | Births / 1,000 Women |
| Less than High School | 0 (0.0%) | 0.0 |
| High School Diploma | 0 (0.0%) | 0.0 |
| College or Associate's Degree | 0 (0.0%) | 0.0 |
| Bachelor's Degree | 0 (0.0%) | 0.0 |
| Graduate Degree | 0 (0.0%) | 0.0 |
| Total | 0 (0.0%) | 0.0 |
Fertility by Education by Marriage Status in Eastvale borough
| Educational Attainment | Married | Unmarried |
| Less than High School | 0 (0.0%) | 0 (0.0%) |
| High School Diploma | 0 (0.0%) | 0 (0.0%) |
| College or Associate's Degree | 0 (0.0%) | 0 (0.0%) |
| Bachelor's Degree | 0 (0.0%) | 0 (0.0%) |
| Graduate Degree | 0 (0.0%) | 0 (0.0%) |
| Total | 0 (0.0%) | 0 (0.0%) |
Employment Characteristics in Eastvale borough
Employment by Class of Employer in Eastvale borough
Among the 74 employed individuals in Eastvale borough, private company employees (59 | 79.7%), not-for-profit organizations (8 | 10.8%), and local government employees (3 | 4.1%) make up the most common classes of employment.
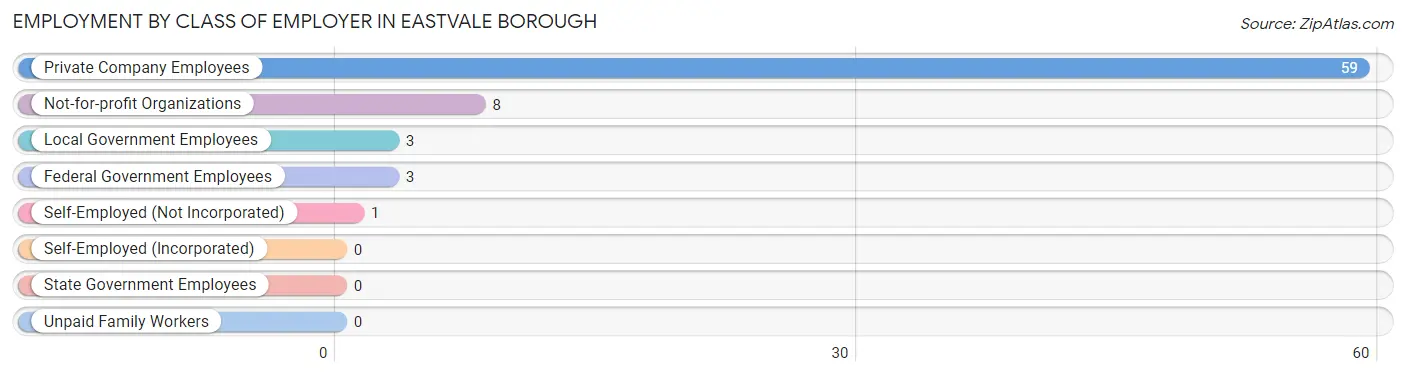
| Employer Class | # Employees | % Employees |
| Private Company Employees | 59 | 79.7% |
| Self-Employed (Incorporated) | 0 | 0.0% |
| Self-Employed (Not Incorporated) | 1 | 1.3% |
| Not-for-profit Organizations | 8 | 10.8% |
| Local Government Employees | 3 | 4.1% |
| State Government Employees | 0 | 0.0% |
| Federal Government Employees | 3 | 4.1% |
| Unpaid Family Workers | 0 | 0.0% |
| Total | 74 | 100.0% |
Employment Status by Age in Eastvale borough
According to the labor force statistics for Eastvale borough, out of the total population over 16 years of age (153), 56.9% or 87 individuals are in the labor force, with 11.5% or 10 of them unemployed. The age group with the highest labor force participation rate is 25 to 29 years, with 100.0% or 4 individuals in the labor force. Within the labor force, the 35 to 44 years age range has the highest percentage of unemployed individuals, with 64.3% or 9 of them being unemployed.
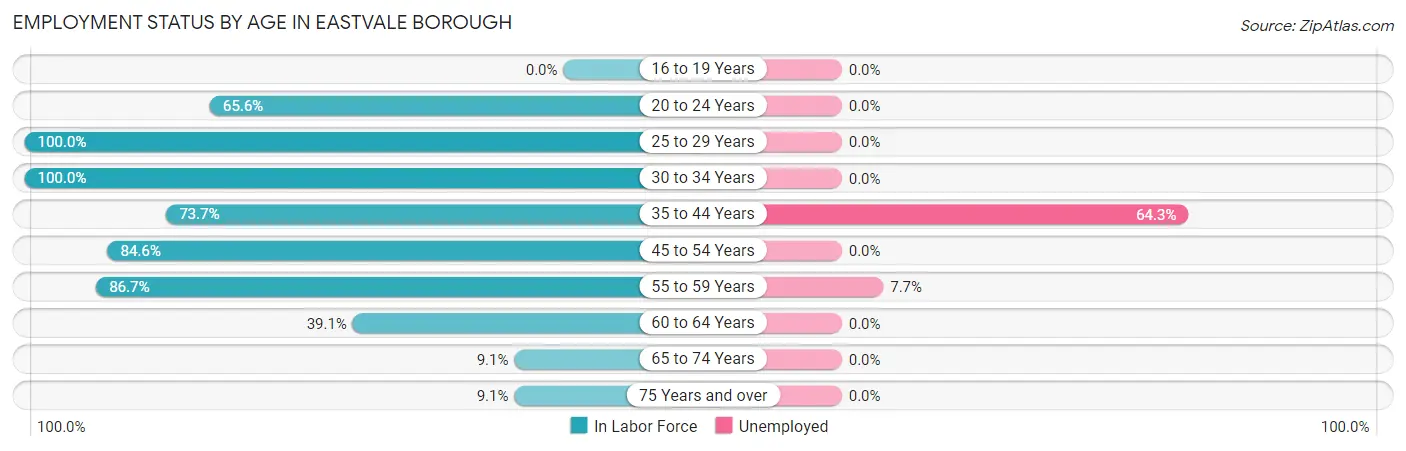
| Age Bracket | In Labor Force | Unemployed |
| 16 to 19 Years | 0 (0.0%) | 0 (0.0%) |
| 20 to 24 Years | 21 (65.6%) | 0 (0.0%) |
| 25 to 29 Years | 4 (100.0%) | 0 (0.0%) |
| 30 to 34 Years | 12 (100.0%) | 0 (0.0%) |
| 35 to 44 Years | 14 (73.7%) | 9 (64.3%) |
| 45 to 54 Years | 11 (84.6%) | 0 (0.0%) |
| 55 to 59 Years | 13 (86.7%) | 1 (7.7%) |
| 60 to 64 Years | 9 (39.1%) | 0 (0.0%) |
| 65 to 74 Years | 1 (9.1%) | 0 (0.0%) |
| 75 Years and over | 2 (9.1%) | 0 (0.0%) |
| Total | 87 (56.9%) | 10 (11.5%) |
Employment Status by Educational Attainment in Eastvale borough
According to labor force statistics for Eastvale borough, 73.3% of individuals (63) out of the total population between 25 and 64 years of age (86) are in the labor force, with 15.9% or 10 of them being unemployed. The group with the highest labor force participation rate are those with the educational attainment of college / associate degree, with 100.0% or 10 individuals in the labor force. Within the labor force, individuals with high school diploma education have the highest percentage of unemployment, with 21.4% or 9 of them being unemployed.
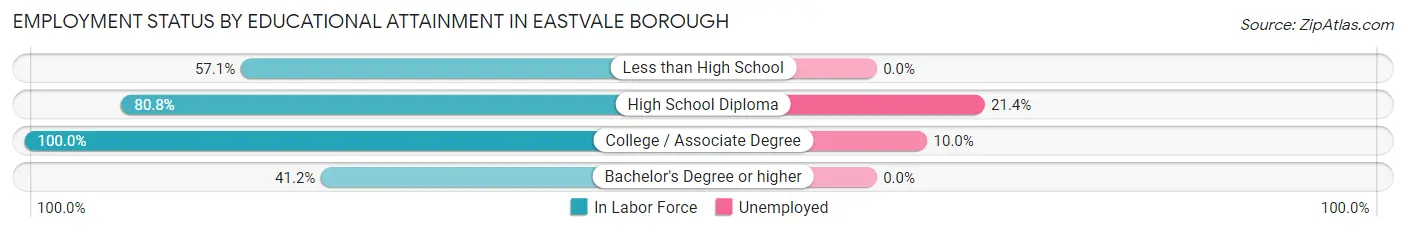
| Educational Attainment | In Labor Force | Unemployed |
| Less than High School | 4 (57.1%) | 0 (0.0%) |
| High School Diploma | 42 (80.8%) | 11 (21.4%) |
| College / Associate Degree | 10 (100.0%) | 1 (10.0%) |
| Bachelor's Degree or higher | 7 (41.2%) | 0 (0.0%) |
| Total | 63 (73.3%) | 14 (15.9%) |
Employment Occupations by Sex in Eastvale borough
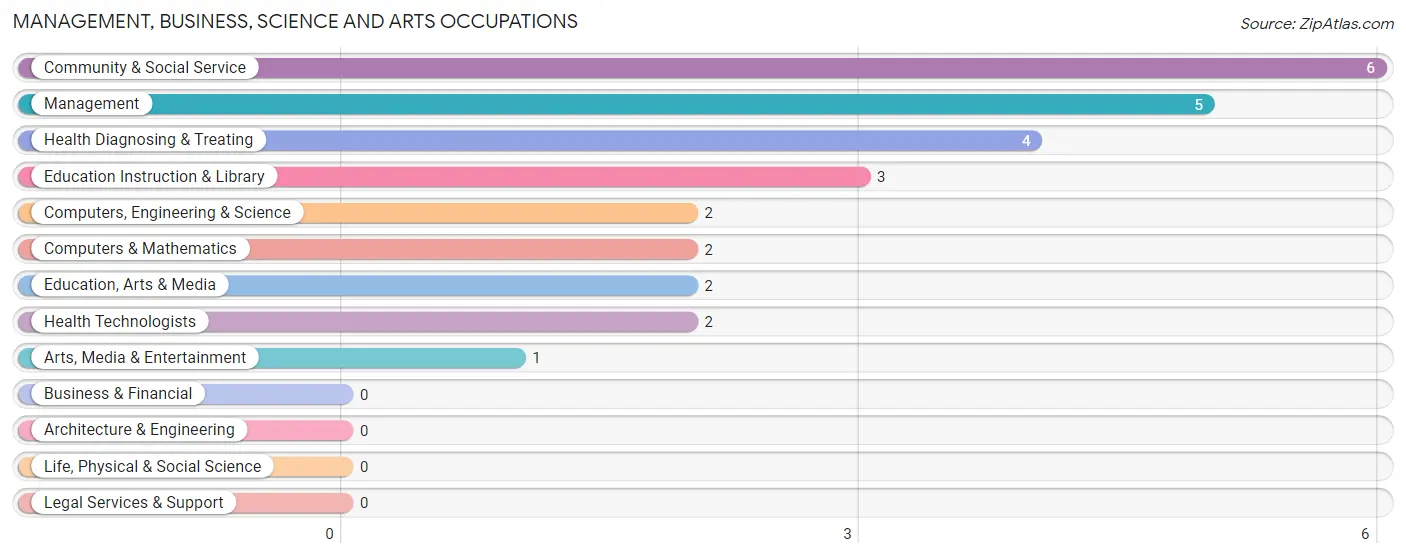
Management, Business, Science and Arts Occupations
The most common Management, Business, Science and Arts occupations in Eastvale borough are Community & Social Service (6 | 7.8%), Management (5 | 6.5%), Health Diagnosing & Treating (4 | 5.2%), Education Instruction & Library (3 | 3.9%), and Computers, Engineering & Science (2 | 2.6%).
Management, Business, Science and Arts Occupations by Sex
Within the Management, Business, Science and Arts occupations in Eastvale borough, the most male-oriented occupations are Management (100.0%), Arts, Media & Entertainment (100.0%), and Education Instruction & Library (66.7%), while the most female-oriented occupations are Computers, Engineering & Science (100.0%), Computers & Mathematics (100.0%), and Education, Arts & Media (100.0%).
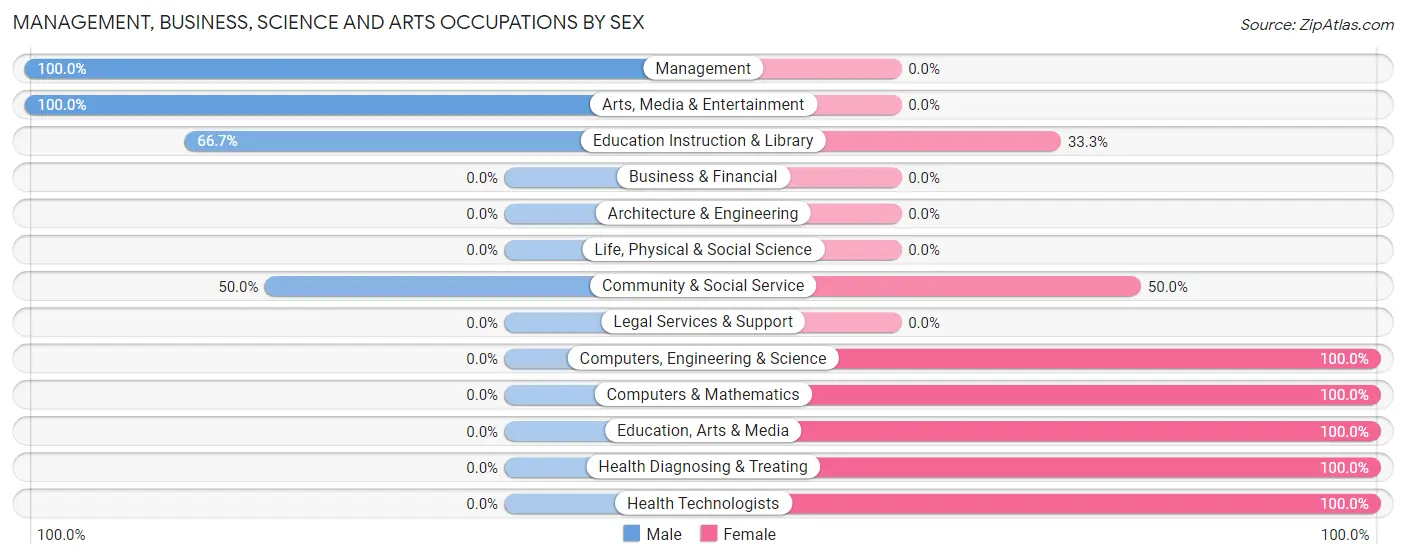
| Occupation | Male | Female |
| Management | 5 (100.0%) | 0 (0.0%) |
| Business & Financial | 0 (0.0%) | 0 (0.0%) |
| Computers, Engineering & Science | 0 (0.0%) | 2 (100.0%) |
| Computers & Mathematics | 0 (0.0%) | 2 (100.0%) |
| Architecture & Engineering | 0 (0.0%) | 0 (0.0%) |
| Life, Physical & Social Science | 0 (0.0%) | 0 (0.0%) |
| Community & Social Service | 3 (50.0%) | 3 (50.0%) |
| Education, Arts & Media | 0 (0.0%) | 2 (100.0%) |
| Legal Services & Support | 0 (0.0%) | 0 (0.0%) |
| Education Instruction & Library | 2 (66.7%) | 1 (33.3%) |
| Arts, Media & Entertainment | 1 (100.0%) | 0 (0.0%) |
| Health Diagnosing & Treating | 0 (0.0%) | 4 (100.0%) |
| Health Technologists | 0 (0.0%) | 2 (100.0%) |
| Total (Category) | 8 (47.1%) | 9 (52.9%) |
| Total (Overall) | 39 (50.6%) | 38 (49.3%) |
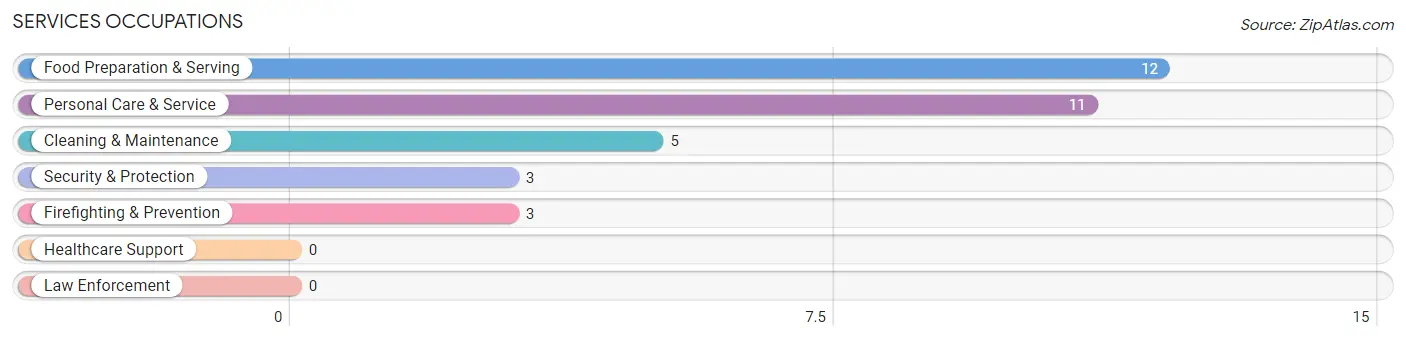
Services Occupations
The most common Services occupations in Eastvale borough are Food Preparation & Serving (12 | 15.6%), Personal Care & Service (11 | 14.3%), Cleaning & Maintenance (5 | 6.5%), Security & Protection (3 | 3.9%), and Firefighting & Prevention (3 | 3.9%).
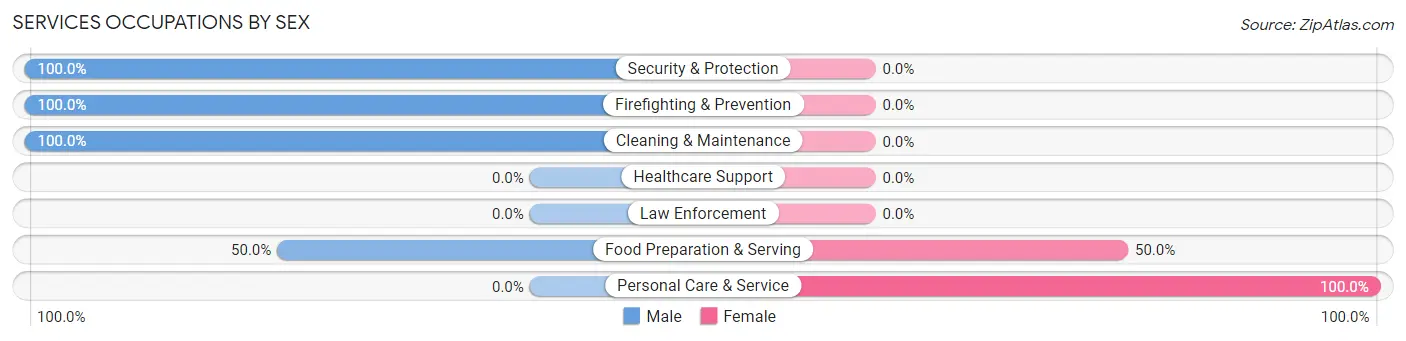
Services Occupations by Sex
Within the Services occupations in Eastvale borough, the most male-oriented occupations are Security & Protection (100.0%), Firefighting & Prevention (100.0%), and Cleaning & Maintenance (100.0%), while the most female-oriented occupations are Personal Care & Service (100.0%), and Food Preparation & Serving (50.0%).
| Occupation | Male | Female |
| Healthcare Support | 0 (0.0%) | 0 (0.0%) |
| Security & Protection | 3 (100.0%) | 0 (0.0%) |
| Firefighting & Prevention | 3 (100.0%) | 0 (0.0%) |
| Law Enforcement | 0 (0.0%) | 0 (0.0%) |
| Food Preparation & Serving | 6 (50.0%) | 6 (50.0%) |
| Cleaning & Maintenance | 5 (100.0%) | 0 (0.0%) |
| Personal Care & Service | 0 (0.0%) | 11 (100.0%) |
| Total (Category) | 14 (45.2%) | 17 (54.8%) |
| Total (Overall) | 39 (50.6%) | 38 (49.3%) |
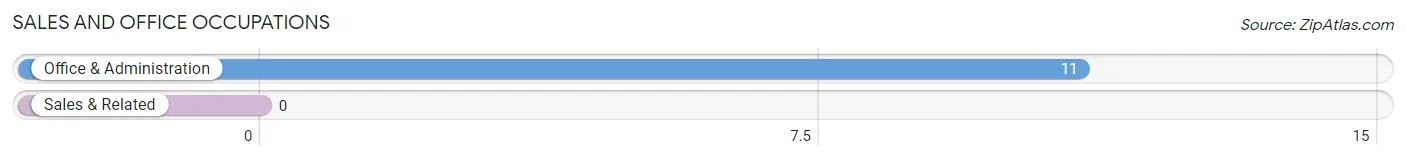
Sales and Office Occupations
The most common Sales and Office occupations in Eastvale borough are , and Office & Administration (11 | 14.3%).
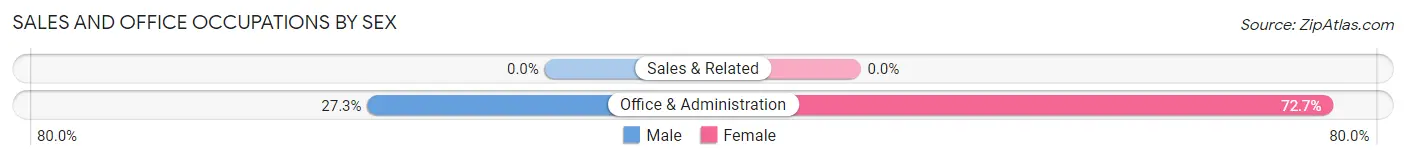
Sales and Office Occupations by Sex
| Occupation | Male | Female |
| Sales & Related | 0 (0.0%) | 0 (0.0%) |
| Office & Administration | 3 (27.3%) | 8 (72.7%) |
| Total (Category) | 3 (27.3%) | 8 (72.7%) |
| Total (Overall) | 39 (50.6%) | 38 (49.3%) |
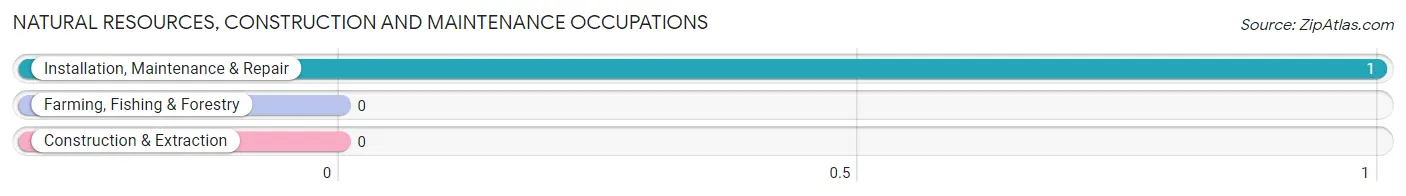
Natural Resources, Construction and Maintenance Occupations
The most common Natural Resources, Construction and Maintenance occupations in Eastvale borough are , and Installation, Maintenance & Repair (1 | 1.3%).
Natural Resources, Construction and Maintenance Occupations by Sex
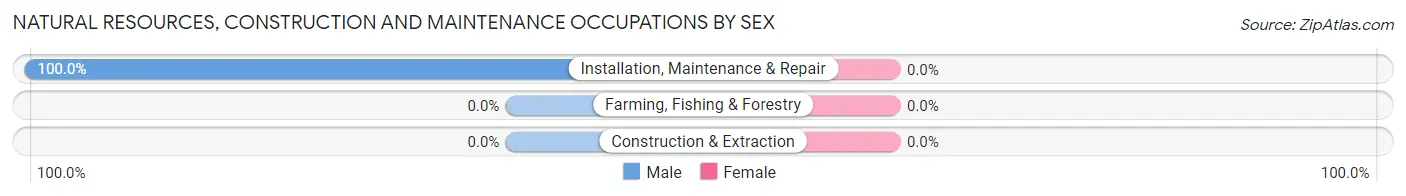
| Occupation | Male | Female |
| Farming, Fishing & Forestry | 0 (0.0%) | 0 (0.0%) |
| Construction & Extraction | 0 (0.0%) | 0 (0.0%) |
| Installation, Maintenance & Repair | 1 (100.0%) | 0 (0.0%) |
| Total (Category) | 1 (100.0%) | 0 (0.0%) |
| Total (Overall) | 39 (50.6%) | 38 (49.3%) |
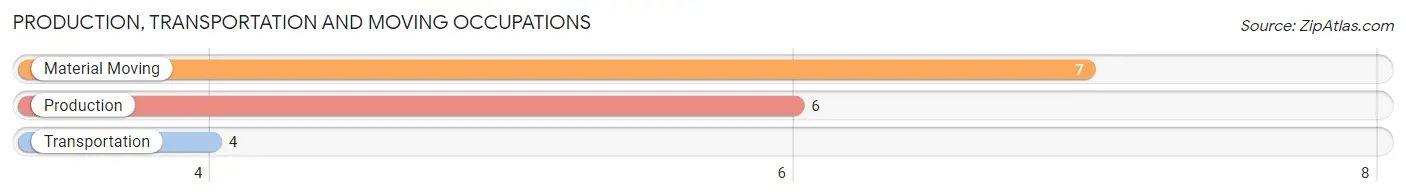
Production, Transportation and Moving Occupations
The most common Production, Transportation and Moving occupations in Eastvale borough are Material Moving (7 | 9.1%), Production (6 | 7.8%), and Transportation (4 | 5.2%).
Production, Transportation and Moving Occupations by Sex
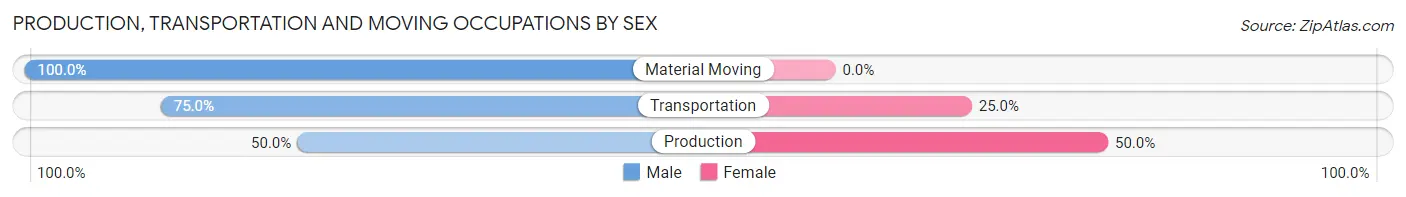
| Occupation | Male | Female |
| Production | 3 (50.0%) | 3 (50.0%) |
| Transportation | 3 (75.0%) | 1 (25.0%) |
| Material Moving | 7 (100.0%) | 0 (0.0%) |
| Total (Category) | 13 (76.5%) | 4 (23.5%) |
| Total (Overall) | 39 (50.6%) | 38 (49.3%) |
Employment Industries by Sex in Eastvale borough
Employment Industries in Eastvale borough
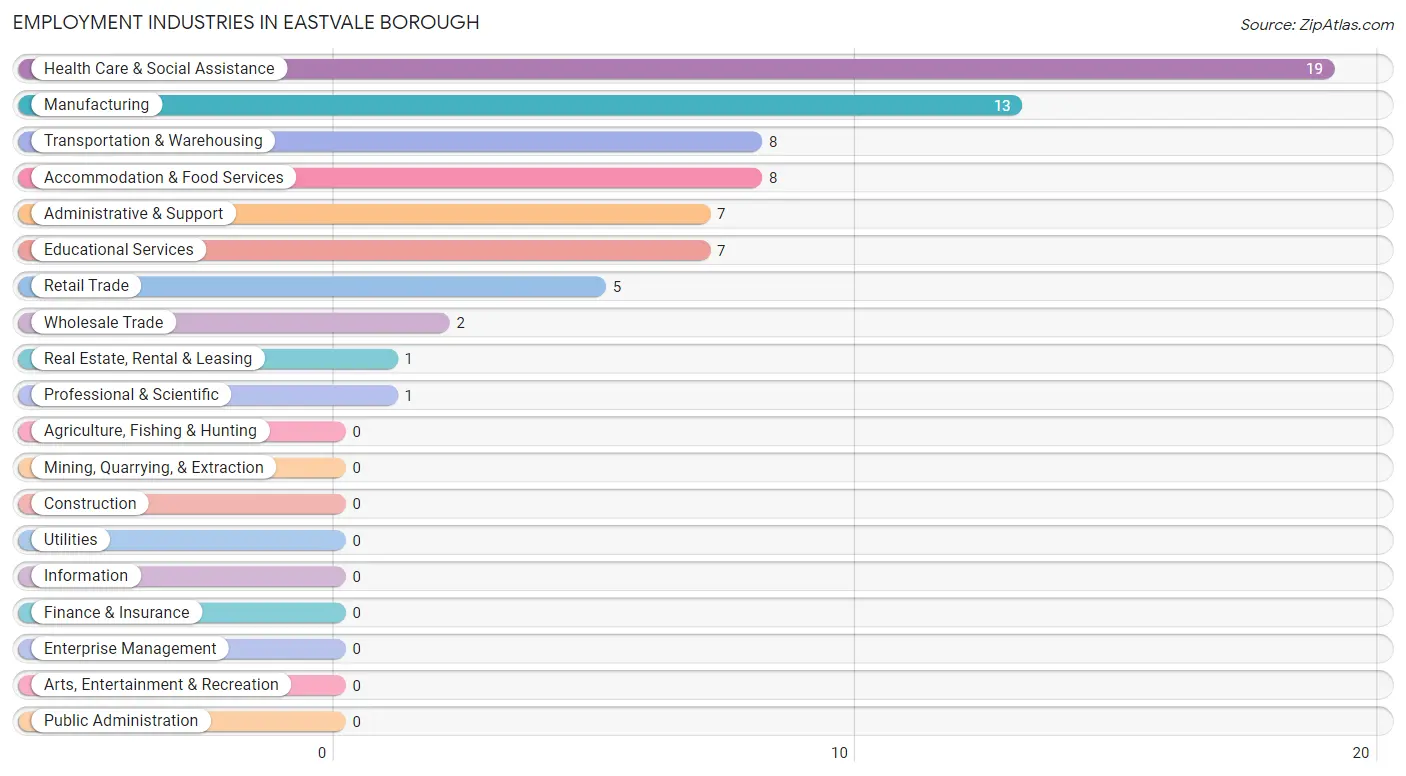
The major employment industries in Eastvale borough include Health Care & Social Assistance (19 | 24.7%), Manufacturing (13 | 16.9%), Transportation & Warehousing (8 | 10.4%), Accommodation & Food Services (8 | 10.4%), and Administrative & Support (7 | 9.1%).
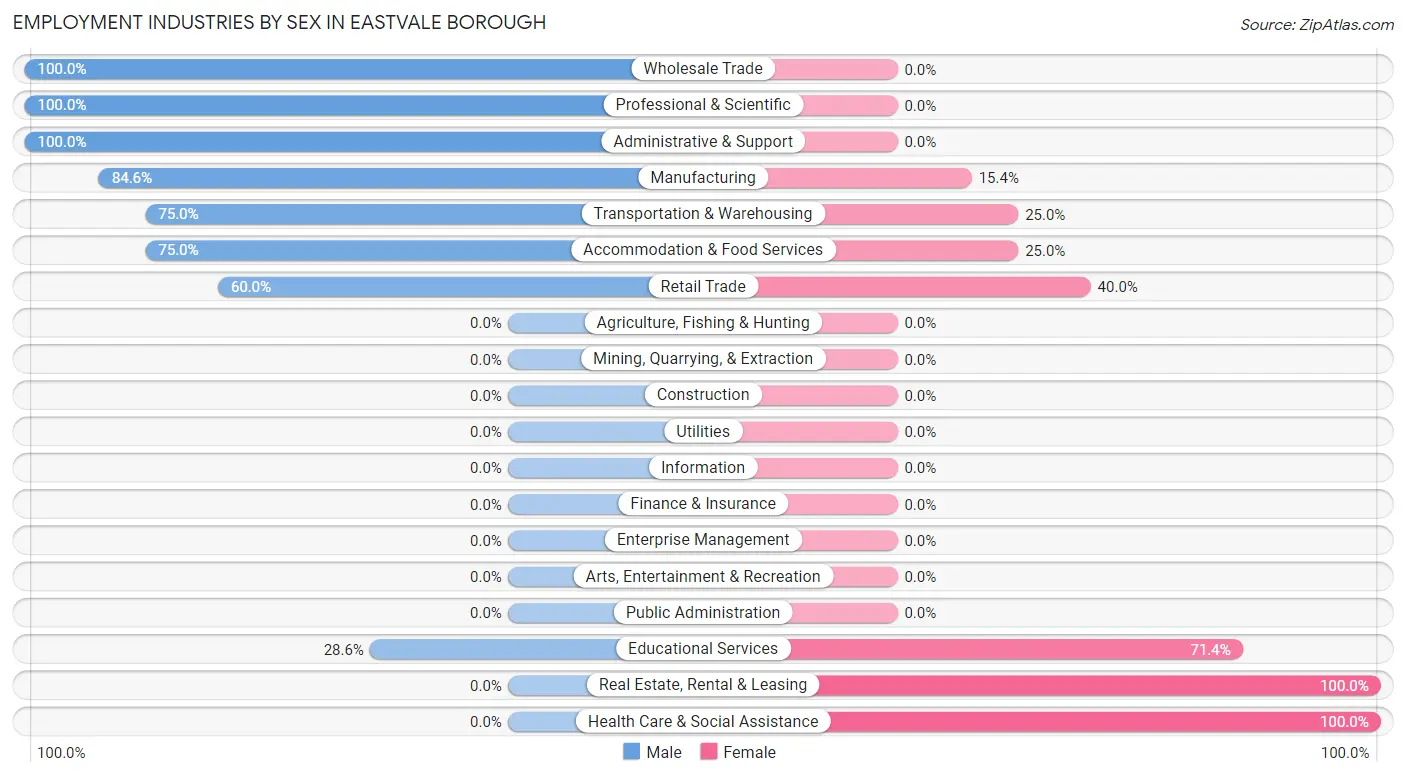
Employment Industries by Sex in Eastvale borough
The Eastvale borough industries that see more men than women are Wholesale Trade (100.0%), Professional & Scientific (100.0%), and Administrative & Support (100.0%), whereas the industries that tend to have a higher number of women are Real Estate, Rental & Leasing (100.0%), Health Care & Social Assistance (100.0%), and Educational Services (71.4%).
| Industry | Male | Female |
| Agriculture, Fishing & Hunting | 0 (0.0%) | 0 (0.0%) |
| Mining, Quarrying, & Extraction | 0 (0.0%) | 0 (0.0%) |
| Construction | 0 (0.0%) | 0 (0.0%) |
| Manufacturing | 11 (84.6%) | 2 (15.4%) |
| Wholesale Trade | 2 (100.0%) | 0 (0.0%) |
| Retail Trade | 3 (60.0%) | 2 (40.0%) |
| Transportation & Warehousing | 6 (75.0%) | 2 (25.0%) |
| Utilities | 0 (0.0%) | 0 (0.0%) |
| Information | 0 (0.0%) | 0 (0.0%) |
| Finance & Insurance | 0 (0.0%) | 0 (0.0%) |
| Real Estate, Rental & Leasing | 0 (0.0%) | 1 (100.0%) |
| Professional & Scientific | 1 (100.0%) | 0 (0.0%) |
| Enterprise Management | 0 (0.0%) | 0 (0.0%) |
| Administrative & Support | 7 (100.0%) | 0 (0.0%) |
| Educational Services | 2 (28.6%) | 5 (71.4%) |
| Health Care & Social Assistance | 0 (0.0%) | 19 (100.0%) |
| Arts, Entertainment & Recreation | 0 (0.0%) | 0 (0.0%) |
| Accommodation & Food Services | 6 (75.0%) | 2 (25.0%) |
| Public Administration | 0 (0.0%) | 0 (0.0%) |
| Total | 39 (50.6%) | 38 (49.3%) |
Education in Eastvale borough
School Enrollment in Eastvale borough
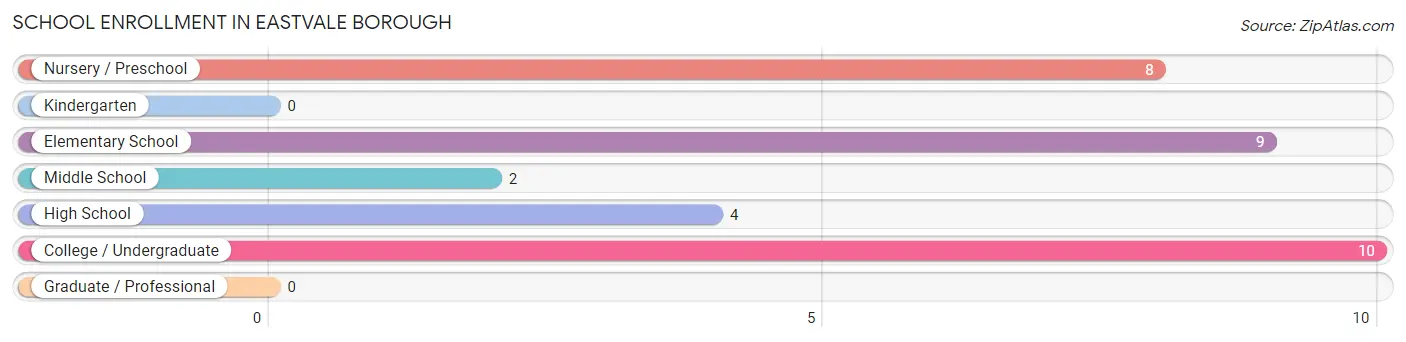
The most common levels of schooling among the 33 students in Eastvale borough are college / undergraduate (10 | 30.3%), elementary school (9 | 27.3%), and nursery / preschool (8 | 24.2%).
| School Level | # Students | % Students |
| Nursery / Preschool | 8 | 24.2% |
| Kindergarten | 0 | 0.0% |
| Elementary School | 9 | 27.3% |
| Middle School | 2 | 6.1% |
| High School | 4 | 12.1% |
| College / Undergraduate | 10 | 30.3% |
| Graduate / Professional | 0 | 0.0% |
| Total | 33 | 100.0% |
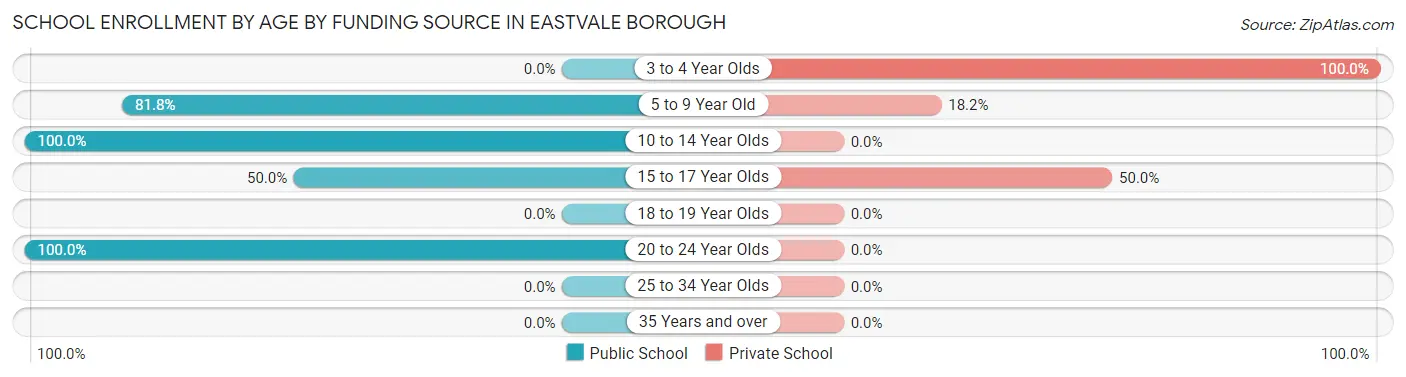
School Enrollment by Age by Funding Source in Eastvale borough
Out of a total of 33 students who are enrolled in schools in Eastvale borough, 10 (30.3%) attend a private institution, while the remaining 23 (69.7%) are enrolled in public schools. The age group of 3 to 4 year olds has the highest likelihood of being enrolled in private schools, with 6 (100.0% in the age bracket) enrolled. Conversely, the age group of 10 to 14 year olds has the lowest likelihood of being enrolled in a private school, with 2 (100.0% in the age bracket) attending a public institution.
| Age Bracket | Public School | Private School |
| 3 to 4 Year Olds | 0 (0.0%) | 6 (100.0%) |
| 5 to 9 Year Old | 9 (81.8%) | 2 (18.2%) |
| 10 to 14 Year Olds | 2 (100.0%) | 0 (0.0%) |
| 15 to 17 Year Olds | 2 (50.0%) | 2 (50.0%) |
| 18 to 19 Year Olds | 0 (0.0%) | 0 (0.0%) |
| 20 to 24 Year Olds | 10 (100.0%) | 0 (0.0%) |
| 25 to 34 Year Olds | 0 (0.0%) | 0 (0.0%) |
| 35 Years and over | 0 (0.0%) | 0 (0.0%) |
| Total | 23 (69.7%) | 10 (30.3%) |
Educational Attainment by Field of Study in Eastvale borough
Arts & humanities (10 | 52.6%), social sciences (4 | 21.0%), bio, nature & agricultural (2 | 10.5%), business (2 | 10.5%), and education (1 | 5.3%) are the most common fields of study among 19 individuals in Eastvale borough who have obtained a bachelor's degree or higher.
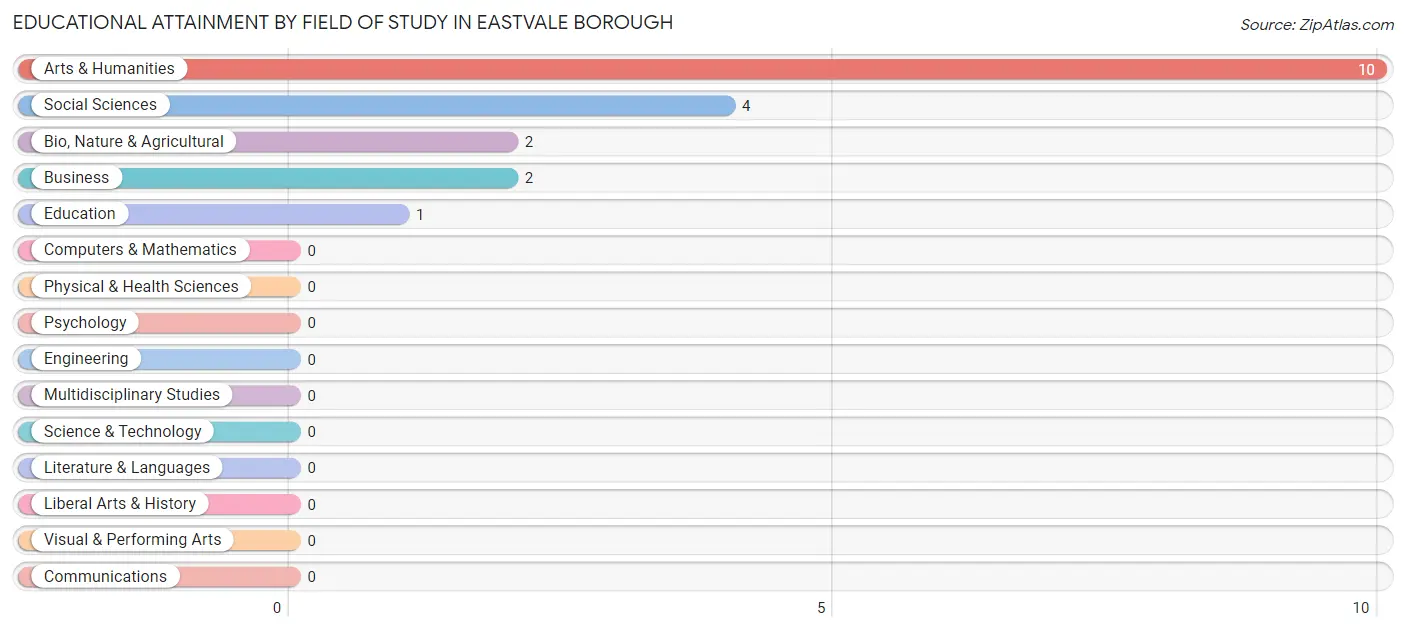
| Field of Study | # Graduates | % Graduates |
| Computers & Mathematics | 0 | 0.0% |
| Bio, Nature & Agricultural | 2 | 10.5% |
| Physical & Health Sciences | 0 | 0.0% |
| Psychology | 0 | 0.0% |
| Social Sciences | 4 | 21.0% |
| Engineering | 0 | 0.0% |
| Multidisciplinary Studies | 0 | 0.0% |
| Science & Technology | 0 | 0.0% |
| Business | 2 | 10.5% |
| Education | 1 | 5.3% |
| Literature & Languages | 0 | 0.0% |
| Liberal Arts & History | 0 | 0.0% |
| Visual & Performing Arts | 0 | 0.0% |
| Communications | 0 | 0.0% |
| Arts & Humanities | 10 | 52.6% |
| Total | 19 | 100.0% |
Transportation & Commute in Eastvale borough
Vehicle Availability by Sex in Eastvale borough
The most prevalent vehicle ownership categories in Eastvale borough are males with 2 vehicles (14, accounting for 37.8%) and females with 2 vehicles (19, making up 37.8%).
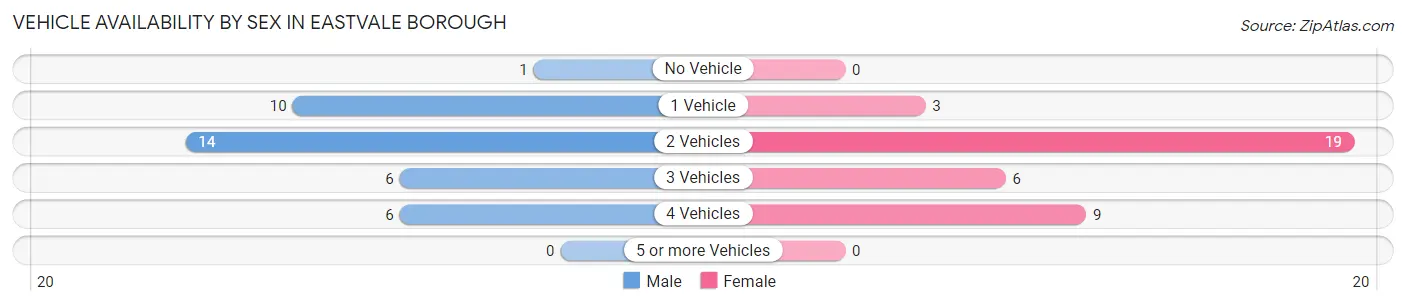
| Vehicles Available | Male | Female |
| No Vehicle | 1 (2.7%) | 0 (0.0%) |
| 1 Vehicle | 10 (27.0%) | 3 (8.1%) |
| 2 Vehicles | 14 (37.8%) | 19 (51.3%) |
| 3 Vehicles | 6 (16.2%) | 6 (16.2%) |
| 4 Vehicles | 6 (16.2%) | 9 (24.3%) |
| 5 or more Vehicles | 0 (0.0%) | 0 (0.0%) |
| Total | 37 (100.0%) | 37 (100.0%) |
Commute Time in Eastvale borough
The most frequently occuring commute durations in Eastvale borough are 15 to 19 minutes (24 commuters, 32.4%), 30 to 34 minutes (15 commuters, 20.3%), and 35 to 39 minutes (7 commuters, 9.5%).
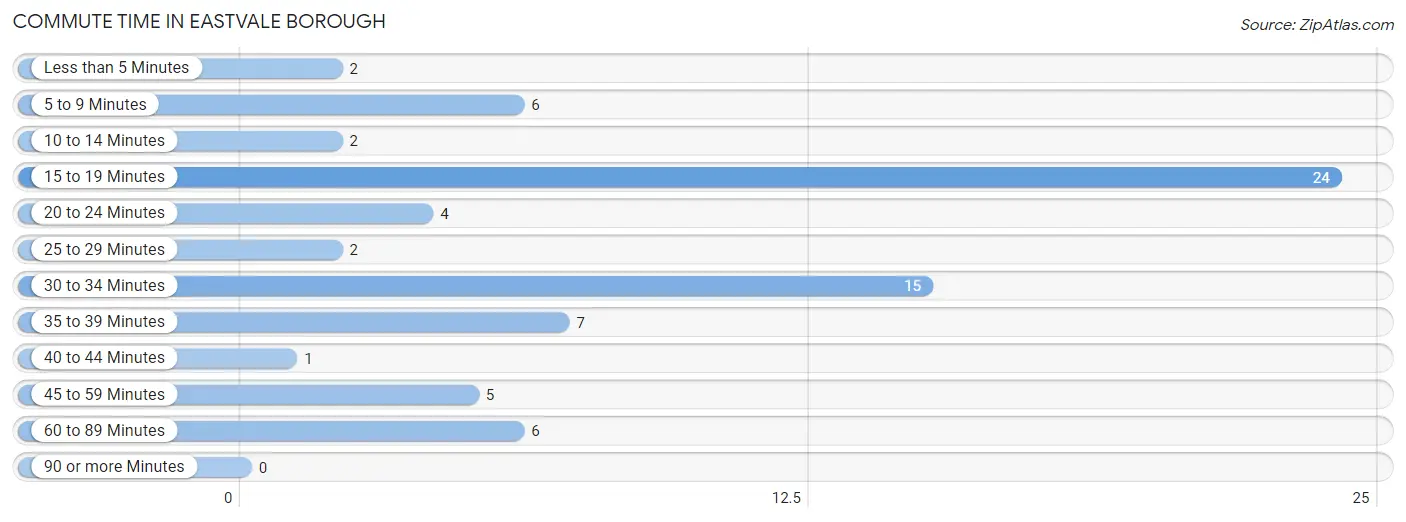
| Commute Time | # Commuters | % Commuters |
| Less than 5 Minutes | 2 | 2.7% |
| 5 to 9 Minutes | 6 | 8.1% |
| 10 to 14 Minutes | 2 | 2.7% |
| 15 to 19 Minutes | 24 | 32.4% |
| 20 to 24 Minutes | 4 | 5.4% |
| 25 to 29 Minutes | 2 | 2.7% |
| 30 to 34 Minutes | 15 | 20.3% |
| 35 to 39 Minutes | 7 | 9.5% |
| 40 to 44 Minutes | 1 | 1.3% |
| 45 to 59 Minutes | 5 | 6.8% |
| 60 to 89 Minutes | 6 | 8.1% |
| 90 or more Minutes | 0 | 0.0% |
Commute Time by Sex in Eastvale borough
The most common commute times in Eastvale borough are 15 to 19 minutes (10 commuters, 27.0%) for males and 15 to 19 minutes (14 commuters, 37.8%) for females.
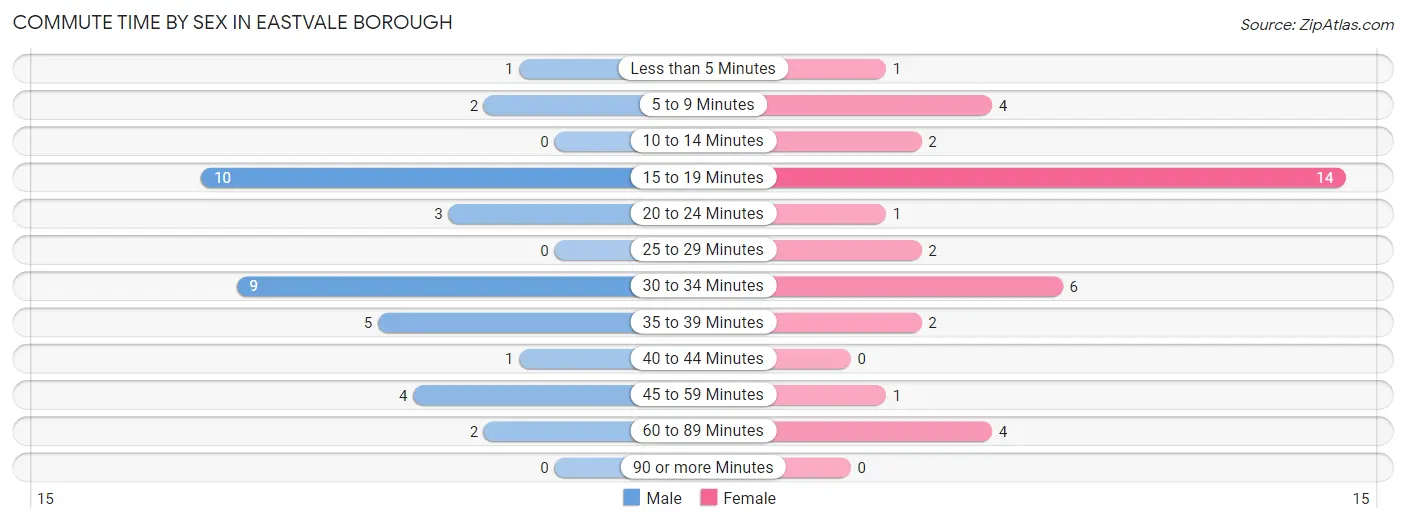
| Commute Time | Male | Female |
| Less than 5 Minutes | 1 (2.7%) | 1 (2.7%) |
| 5 to 9 Minutes | 2 (5.4%) | 4 (10.8%) |
| 10 to 14 Minutes | 0 (0.0%) | 2 (5.4%) |
| 15 to 19 Minutes | 10 (27.0%) | 14 (37.8%) |
| 20 to 24 Minutes | 3 (8.1%) | 1 (2.7%) |
| 25 to 29 Minutes | 0 (0.0%) | 2 (5.4%) |
| 30 to 34 Minutes | 9 (24.3%) | 6 (16.2%) |
| 35 to 39 Minutes | 5 (13.5%) | 2 (5.4%) |
| 40 to 44 Minutes | 1 (2.7%) | 0 (0.0%) |
| 45 to 59 Minutes | 4 (10.8%) | 1 (2.7%) |
| 60 to 89 Minutes | 2 (5.4%) | 4 (10.8%) |
| 90 or more Minutes | 0 (0.0%) | 0 (0.0%) |
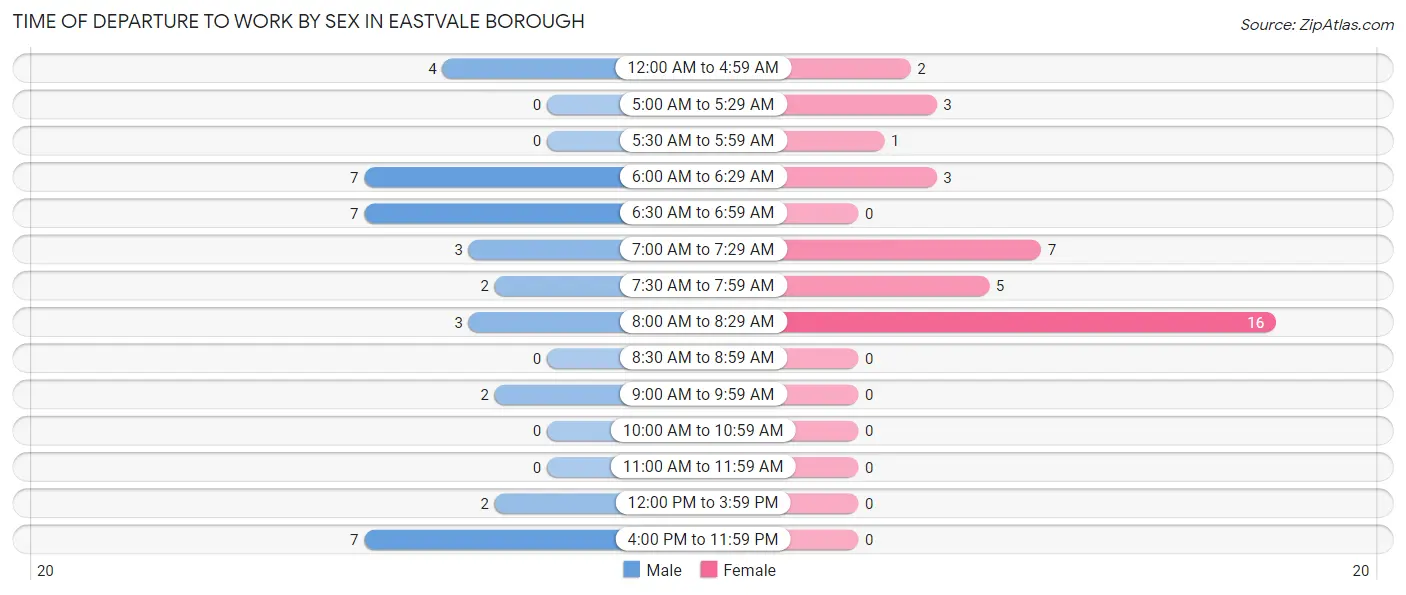
Time of Departure to Work by Sex in Eastvale borough
The most frequent times of departure to work in Eastvale borough are 6:00 AM to 6:29 AM (7, 18.9%) for males and 8:00 AM to 8:29 AM (16, 43.2%) for females.
| Time of Departure | Male | Female |
| 12:00 AM to 4:59 AM | 4 (10.8%) | 2 (5.4%) |
| 5:00 AM to 5:29 AM | 0 (0.0%) | 3 (8.1%) |
| 5:30 AM to 5:59 AM | 0 (0.0%) | 1 (2.7%) |
| 6:00 AM to 6:29 AM | 7 (18.9%) | 3 (8.1%) |
| 6:30 AM to 6:59 AM | 7 (18.9%) | 0 (0.0%) |
| 7:00 AM to 7:29 AM | 3 (8.1%) | 7 (18.9%) |
| 7:30 AM to 7:59 AM | 2 (5.4%) | 5 (13.5%) |
| 8:00 AM to 8:29 AM | 3 (8.1%) | 16 (43.2%) |
| 8:30 AM to 8:59 AM | 0 (0.0%) | 0 (0.0%) |
| 9:00 AM to 9:59 AM | 2 (5.4%) | 0 (0.0%) |
| 10:00 AM to 10:59 AM | 0 (0.0%) | 0 (0.0%) |
| 11:00 AM to 11:59 AM | 0 (0.0%) | 0 (0.0%) |
| 12:00 PM to 3:59 PM | 2 (5.4%) | 0 (0.0%) |
| 4:00 PM to 11:59 PM | 7 (18.9%) | 0 (0.0%) |
| Total | 37 (100.0%) | 37 (100.0%) |
Housing Occupancy in Eastvale borough
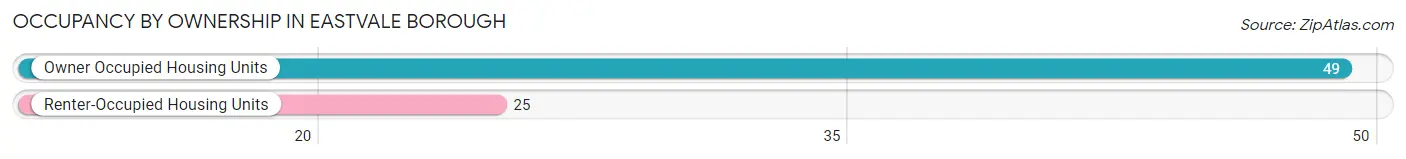
Occupancy by Ownership in Eastvale borough
Of the total 74 dwellings in Eastvale borough, owner-occupied units account for 49 (66.2%), while renter-occupied units make up 25 (33.8%).
| Occupancy | # Housing Units | % Housing Units |
| Owner Occupied Housing Units | 49 | 66.2% |
| Renter-Occupied Housing Units | 25 | 33.8% |
| Total Occupied Housing Units | 74 | 100.0% |
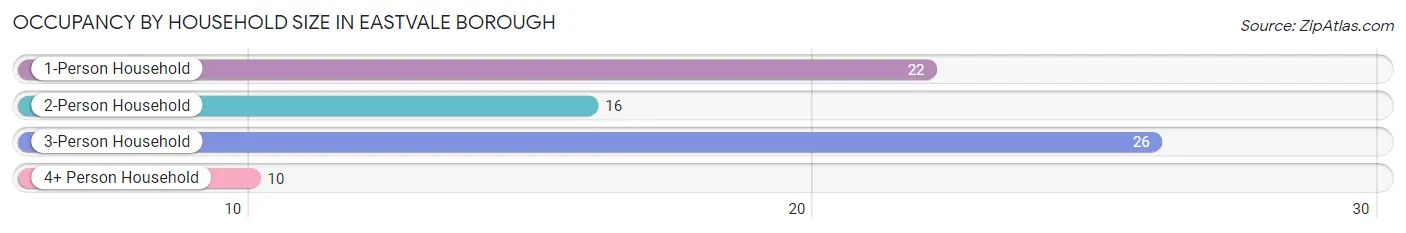
Occupancy by Household Size in Eastvale borough
| Household Size | # Housing Units | % Housing Units |
| 1-Person Household | 22 | 29.7% |
| 2-Person Household | 16 | 21.6% |
| 3-Person Household | 26 | 35.1% |
| 4+ Person Household | 10 | 13.5% |
| Total Housing Units | 74 | 100.0% |
Occupancy by Ownership by Household Size in Eastvale borough
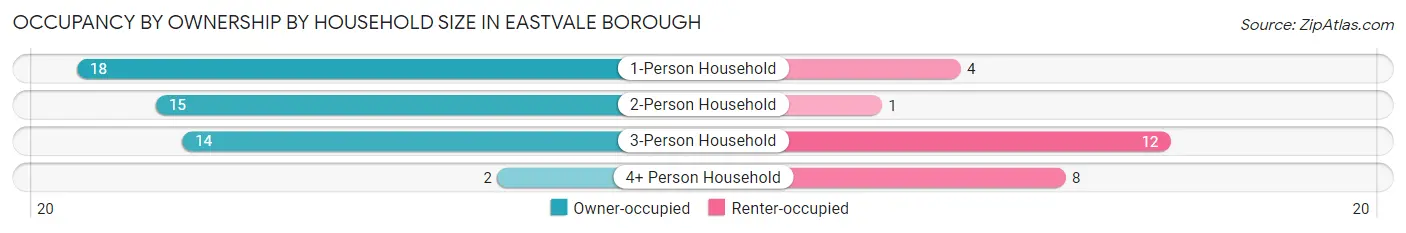
| Household Size | Owner-occupied | Renter-occupied |
| 1-Person Household | 18 (81.8%) | 4 (18.2%) |
| 2-Person Household | 15 (93.8%) | 1 (6.2%) |
| 3-Person Household | 14 (53.8%) | 12 (46.2%) |
| 4+ Person Household | 2 (20.0%) | 8 (80.0%) |
| Total Housing Units | 49 (66.2%) | 25 (33.8%) |
Occupancy by Educational Attainment in Eastvale borough
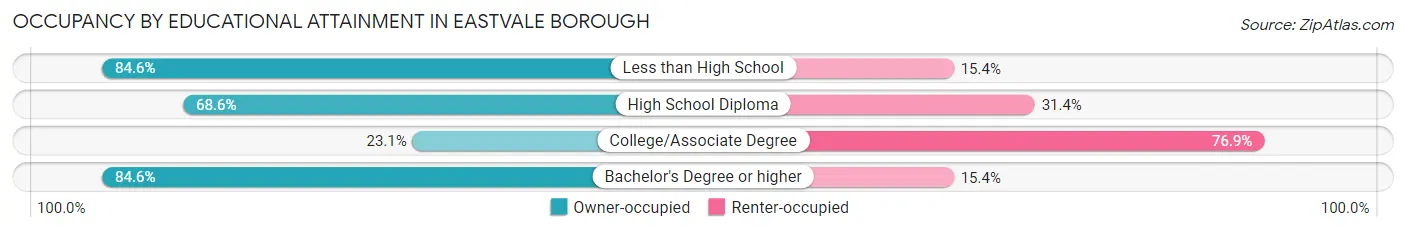
| Household Size | Owner-occupied | Renter-occupied |
| Less than High School | 11 (84.6%) | 2 (15.4%) |
| High School Diploma | 24 (68.6%) | 11 (31.4%) |
| College/Associate Degree | 3 (23.1%) | 10 (76.9%) |
| Bachelor's Degree or higher | 11 (84.6%) | 2 (15.4%) |
Occupancy by Age of Householder in Eastvale borough
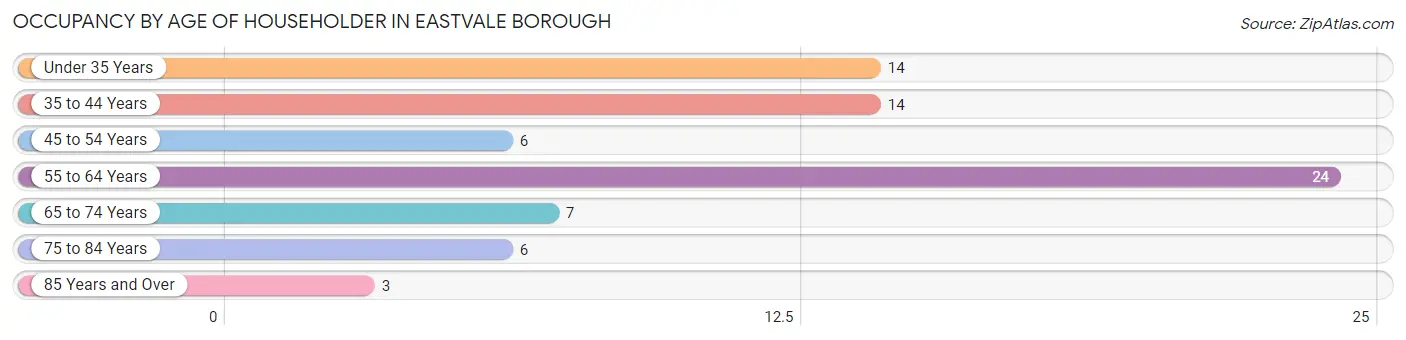
| Age Bracket | # Households | % Households |
| Under 35 Years | 14 | 18.9% |
| 35 to 44 Years | 14 | 18.9% |
| 45 to 54 Years | 6 | 8.1% |
| 55 to 64 Years | 24 | 32.4% |
| 65 to 74 Years | 7 | 9.5% |
| 75 to 84 Years | 6 | 8.1% |
| 85 Years and Over | 3 | 4.1% |
| Total | 74 | 100.0% |
Housing Finances in Eastvale borough
Median Income by Occupancy in Eastvale borough
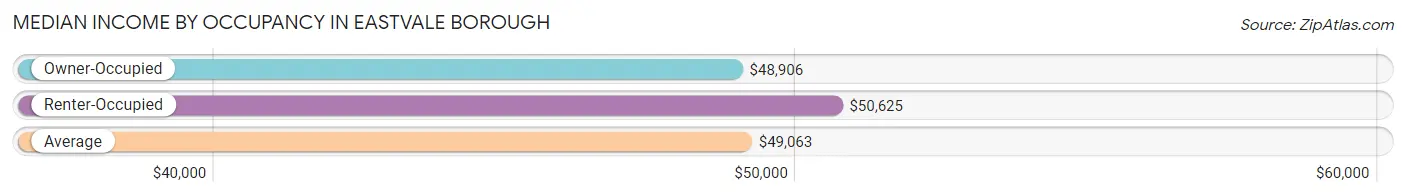
| Occupancy Type | # Households | Median Income |
| Owner-Occupied | 49 (66.2%) | $48,906 |
| Renter-Occupied | 25 (33.8%) | $50,625 |
| Average | 74 (100.0%) | $49,063 |
Occupancy by Householder Income Bracket in Eastvale borough
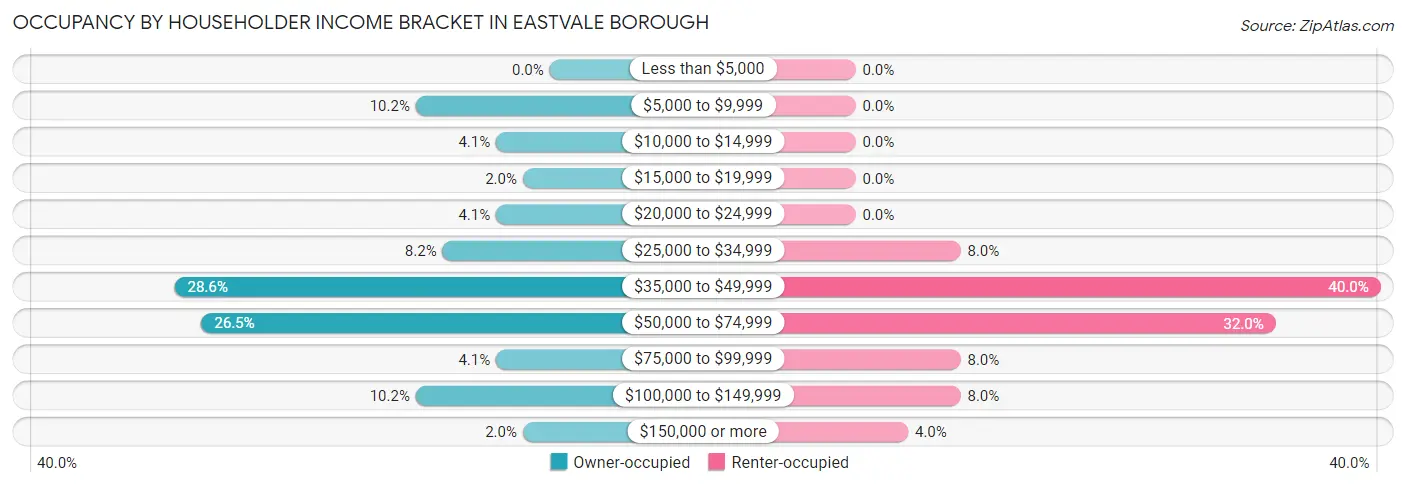
| Income Bracket | Owner-occupied | Renter-occupied |
| Less than $5,000 | 0 (0.0%) | 0 (0.0%) |
| $5,000 to $9,999 | 5 (10.2%) | 0 (0.0%) |
| $10,000 to $14,999 | 2 (4.1%) | 0 (0.0%) |
| $15,000 to $19,999 | 1 (2.0%) | 0 (0.0%) |
| $20,000 to $24,999 | 2 (4.1%) | 0 (0.0%) |
| $25,000 to $34,999 | 4 (8.2%) | 2 (8.0%) |
| $35,000 to $49,999 | 14 (28.6%) | 10 (40.0%) |
| $50,000 to $74,999 | 13 (26.5%) | 8 (32.0%) |
| $75,000 to $99,999 | 2 (4.1%) | 2 (8.0%) |
| $100,000 to $149,999 | 5 (10.2%) | 2 (8.0%) |
| $150,000 or more | 1 (2.0%) | 1 (4.0%) |
| Total | 49 (100.0%) | 25 (100.0%) |
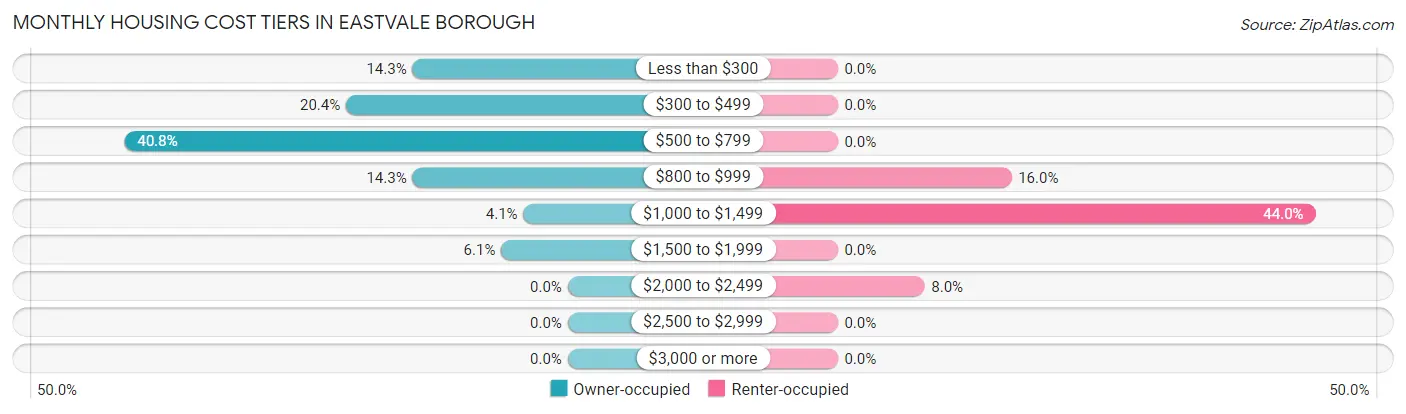
Monthly Housing Cost Tiers in Eastvale borough
| Monthly Cost | Owner-occupied | Renter-occupied |
| Less than $300 | 7 (14.3%) | 0 (0.0%) |
| $300 to $499 | 10 (20.4%) | 0 (0.0%) |
| $500 to $799 | 20 (40.8%) | 0 (0.0%) |
| $800 to $999 | 7 (14.3%) | 4 (16.0%) |
| $1,000 to $1,499 | 2 (4.1%) | 11 (44.0%) |
| $1,500 to $1,999 | 3 (6.1%) | 0 (0.0%) |
| $2,000 to $2,499 | 0 (0.0%) | 2 (8.0%) |
| $2,500 to $2,999 | 0 (0.0%) | 0 (0.0%) |
| $3,000 or more | 0 (0.0%) | 0 (0.0%) |
| Total | 49 (100.0%) | 25 (100.0%) |
Physical Housing Characteristics in Eastvale borough
Housing Structures in Eastvale borough
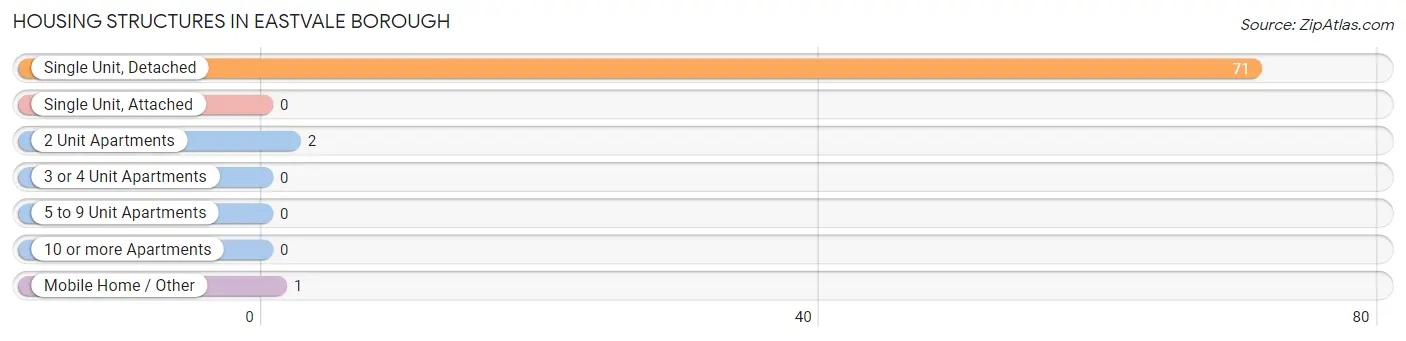
| Structure Type | # Housing Units | % Housing Units |
| Single Unit, Detached | 71 | 96.0% |
| Single Unit, Attached | 0 | 0.0% |
| 2 Unit Apartments | 2 | 2.7% |
| 3 or 4 Unit Apartments | 0 | 0.0% |
| 5 to 9 Unit Apartments | 0 | 0.0% |
| 10 or more Apartments | 0 | 0.0% |
| Mobile Home / Other | 1 | 1.3% |
| Total | 74 | 100.0% |
Housing Structures by Occupancy in Eastvale borough
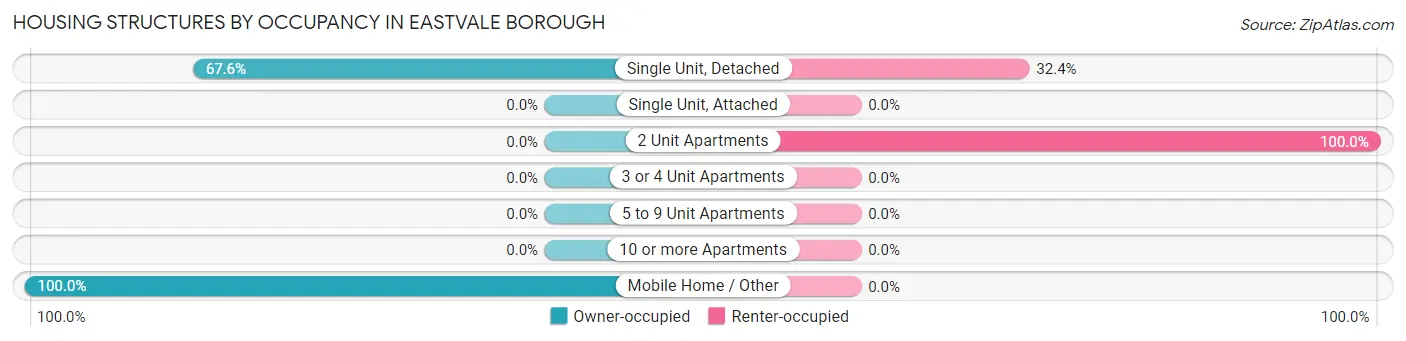
| Structure Type | Owner-occupied | Renter-occupied |
| Single Unit, Detached | 48 (67.6%) | 23 (32.4%) |
| Single Unit, Attached | 0 (0.0%) | 0 (0.0%) |
| 2 Unit Apartments | 0 (0.0%) | 2 (100.0%) |
| 3 or 4 Unit Apartments | 0 (0.0%) | 0 (0.0%) |
| 5 to 9 Unit Apartments | 0 (0.0%) | 0 (0.0%) |
| 10 or more Apartments | 0 (0.0%) | 0 (0.0%) |
| Mobile Home / Other | 1 (100.0%) | 0 (0.0%) |
| Total | 49 (66.2%) | 25 (33.8%) |
Housing Structures by Number of Rooms in Eastvale borough
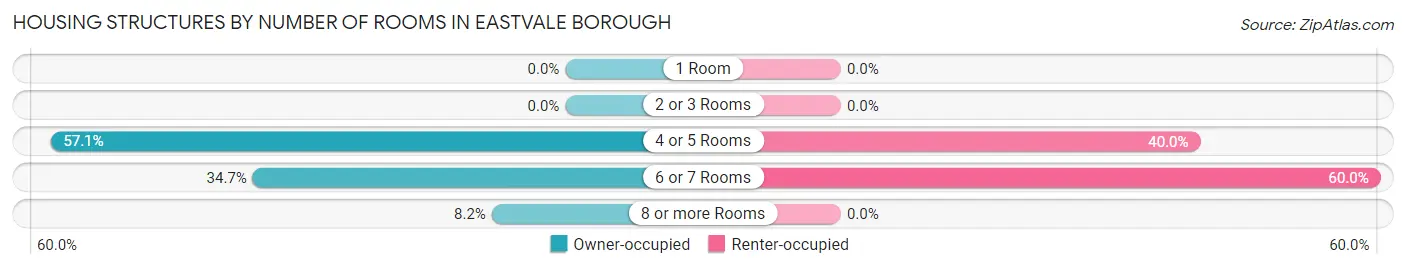
| Number of Rooms | Owner-occupied | Renter-occupied |
| 1 Room | 0 (0.0%) | 0 (0.0%) |
| 2 or 3 Rooms | 0 (0.0%) | 0 (0.0%) |
| 4 or 5 Rooms | 28 (57.1%) | 10 (40.0%) |
| 6 or 7 Rooms | 17 (34.7%) | 15 (60.0%) |
| 8 or more Rooms | 4 (8.2%) | 0 (0.0%) |
| Total | 49 (100.0%) | 25 (100.0%) |
Housing Structure by Heating Type in Eastvale borough
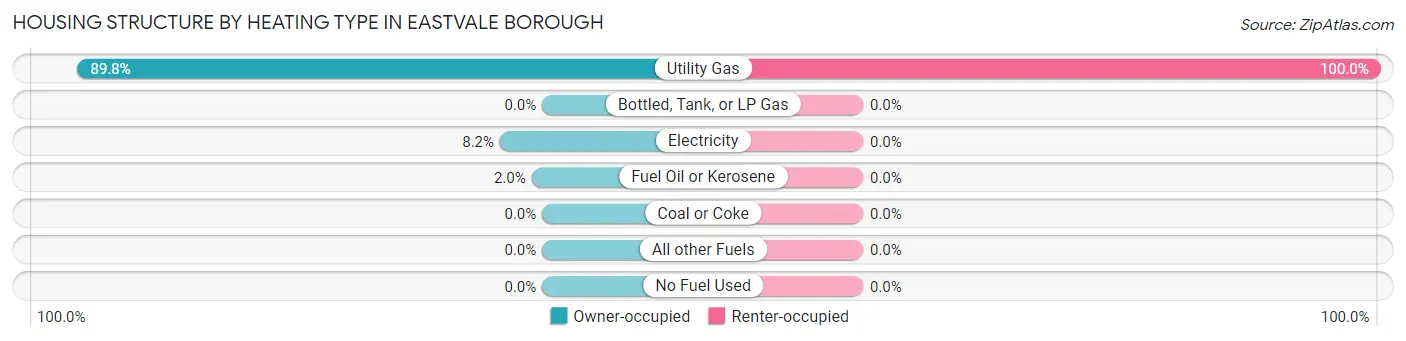
| Heating Type | Owner-occupied | Renter-occupied |
| Utility Gas | 44 (89.8%) | 25 (100.0%) |
| Bottled, Tank, or LP Gas | 0 (0.0%) | 0 (0.0%) |
| Electricity | 4 (8.2%) | 0 (0.0%) |
| Fuel Oil or Kerosene | 1 (2.0%) | 0 (0.0%) |
| Coal or Coke | 0 (0.0%) | 0 (0.0%) |
| All other Fuels | 0 (0.0%) | 0 (0.0%) |
| No Fuel Used | 0 (0.0%) | 0 (0.0%) |
| Total | 49 (100.0%) | 25 (100.0%) |
Household Vehicle Usage in Eastvale borough
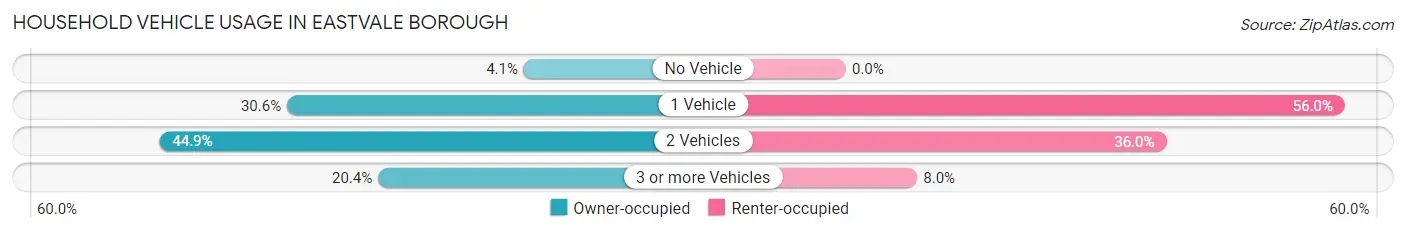
| Vehicles per Household | Owner-occupied | Renter-occupied |
| No Vehicle | 2 (4.1%) | 0 (0.0%) |
| 1 Vehicle | 15 (30.6%) | 14 (56.0%) |
| 2 Vehicles | 22 (44.9%) | 9 (36.0%) |
| 3 or more Vehicles | 10 (20.4%) | 2 (8.0%) |
| Total | 49 (100.0%) | 25 (100.0%) |
Real Estate & Mortgages in Eastvale borough
Real Estate and Mortgage Overview in Eastvale borough
| Characteristic | Without Mortgage | With Mortgage |
| Housing Units | 31 | 18 |
| Median Property Value | $54,500 | $90,000 |
| Median Household Income | $48,281 | $0 |
| Monthly Housing Costs | $483 | $0 |
| Real Estate Taxes | $1,288 | $0 |
Property Value by Mortgage Status in Eastvale borough
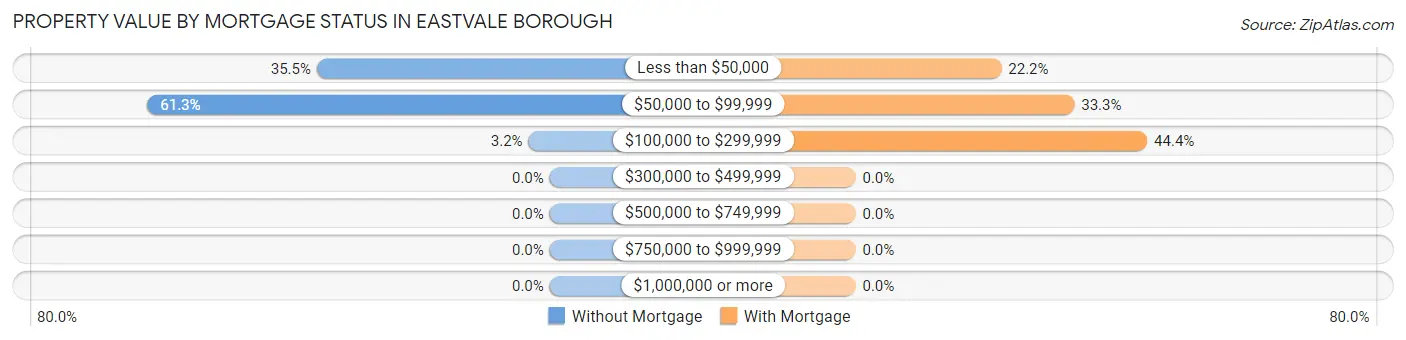
| Property Value | Without Mortgage | With Mortgage |
| Less than $50,000 | 11 (35.5%) | 4 (22.2%) |
| $50,000 to $99,999 | 19 (61.3%) | 6 (33.3%) |
| $100,000 to $299,999 | 1 (3.2%) | 8 (44.4%) |
| $300,000 to $499,999 | 0 (0.0%) | 0 (0.0%) |
| $500,000 to $749,999 | 0 (0.0%) | 0 (0.0%) |
| $750,000 to $999,999 | 0 (0.0%) | 0 (0.0%) |
| $1,000,000 or more | 0 (0.0%) | 0 (0.0%) |
| Total | 31 (100.0%) | 18 (100.0%) |
Household Income by Mortgage Status in Eastvale borough
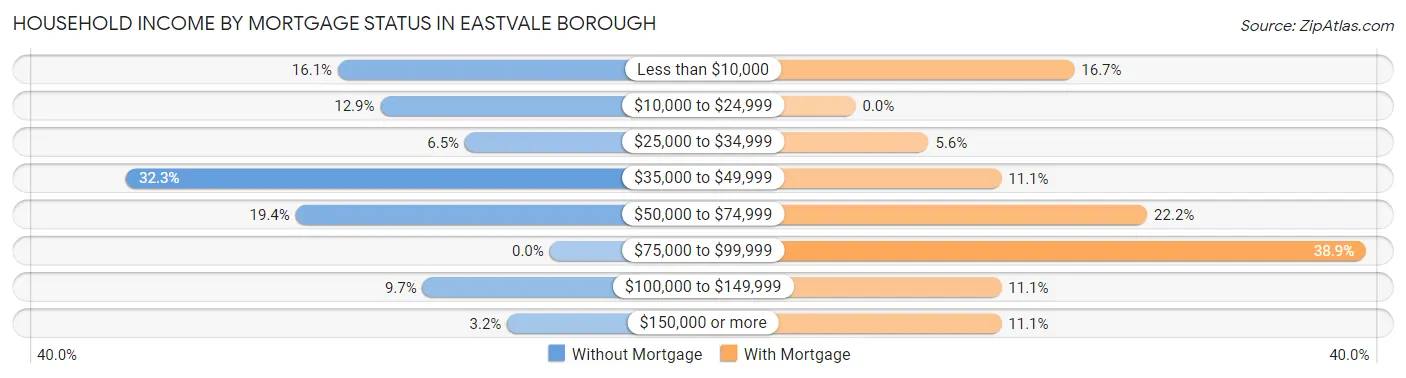
| Household Income | Without Mortgage | With Mortgage |
| Less than $10,000 | 5 (16.1%) | 3 (16.7%) |
| $10,000 to $24,999 | 4 (12.9%) | 0 (0.0%) |
| $25,000 to $34,999 | 2 (6.5%) | 1 (5.6%) |
| $35,000 to $49,999 | 10 (32.3%) | 2 (11.1%) |
| $50,000 to $74,999 | 6 (19.4%) | 4 (22.2%) |
| $75,000 to $99,999 | 0 (0.0%) | 7 (38.9%) |
| $100,000 to $149,999 | 3 (9.7%) | 2 (11.1%) |
| $150,000 or more | 1 (3.2%) | 2 (11.1%) |
| Total | 31 (100.0%) | 18 (100.0%) |
Property Value to Household Income Ratio in Eastvale borough
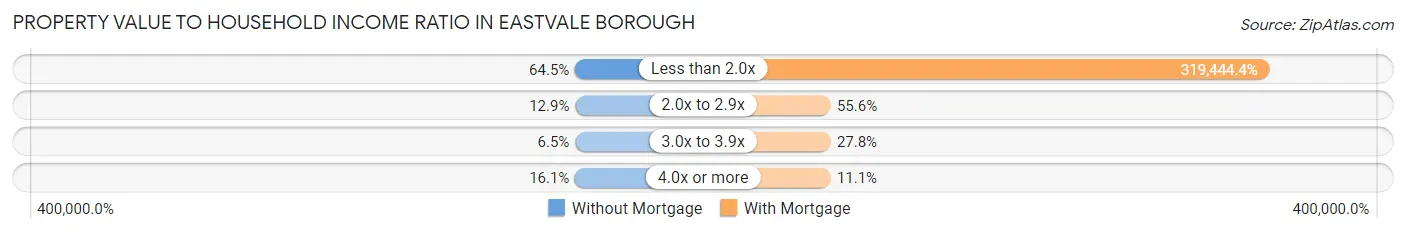
| Value-to-Income Ratio | Without Mortgage | With Mortgage |
| Less than 2.0x | 20 (64.5%) | 57,500 (319,444.4%) |
| 2.0x to 2.9x | 4 (12.9%) | 10 (55.6%) |
| 3.0x to 3.9x | 2 (6.5%) | 5 (27.8%) |
| 4.0x or more | 5 (16.1%) | 2 (11.1%) |
| Total | 31 (100.0%) | 18 (100.0%) |
Real Estate Taxes by Mortgage Status in Eastvale borough
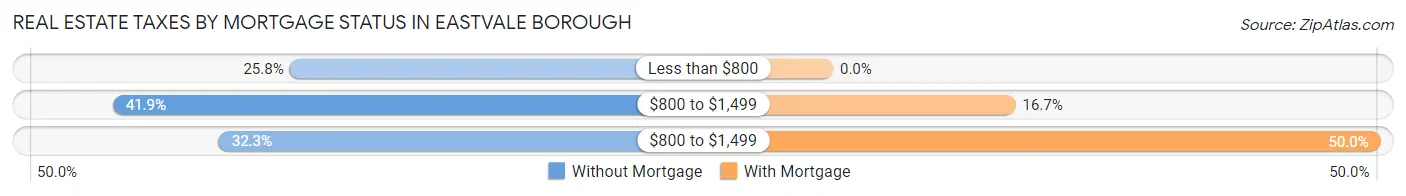
| Property Taxes | Without Mortgage | With Mortgage |
| Less than $800 | 8 (25.8%) | 0 (0.0%) |
| $800 to $1,499 | 13 (41.9%) | 3 (16.7%) |
| $800 to $1,499 | 10 (32.3%) | 9 (50.0%) |
| Total | 31 (100.0%) | 18 (100.0%) |
Health & Disability in Eastvale borough
Health Insurance Coverage by Age in Eastvale borough
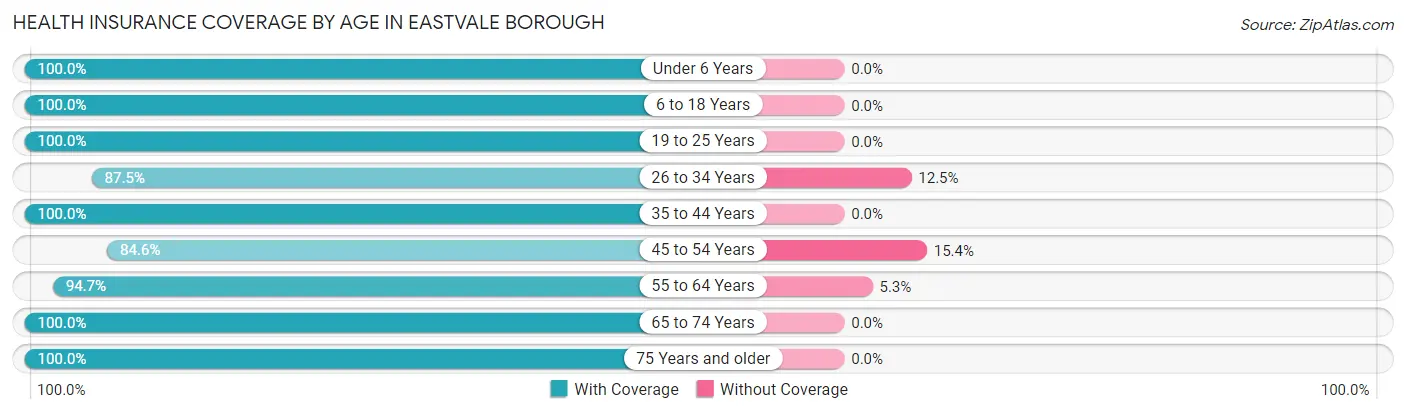
| Age Bracket | With Coverage | Without Coverage |
| Under 6 Years | 10 (100.0%) | 0 (0.0%) |
| 6 to 18 Years | 16 (100.0%) | 0 (0.0%) |
| 19 to 25 Years | 32 (100.0%) | 0 (0.0%) |
| 26 to 34 Years | 14 (87.5%) | 2 (12.5%) |
| 35 to 44 Years | 19 (100.0%) | 0 (0.0%) |
| 45 to 54 Years | 11 (84.6%) | 2 (15.4%) |
| 55 to 64 Years | 36 (94.7%) | 2 (5.3%) |
| 65 to 74 Years | 11 (100.0%) | 0 (0.0%) |
| 75 Years and older | 22 (100.0%) | 0 (0.0%) |
| Total | 171 (96.6%) | 6 (3.4%) |
Health Insurance Coverage by Citizenship Status in Eastvale borough
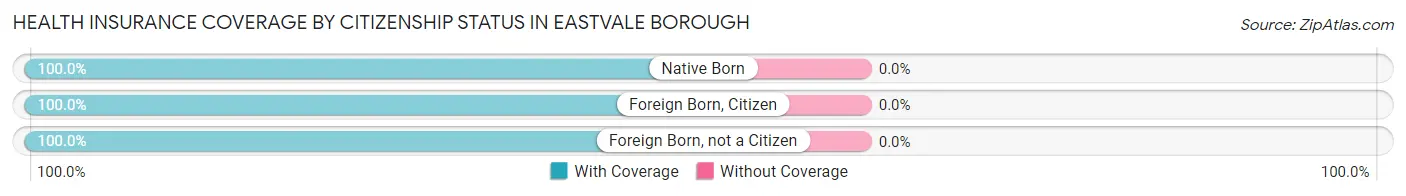
| Citizenship Status | With Coverage | Without Coverage |
| Native Born | 10 (100.0%) | 0 (0.0%) |
| Foreign Born, Citizen | 16 (100.0%) | 0 (0.0%) |
| Foreign Born, not a Citizen | 32 (100.0%) | 0 (0.0%) |
Health Insurance Coverage by Household Income in Eastvale borough
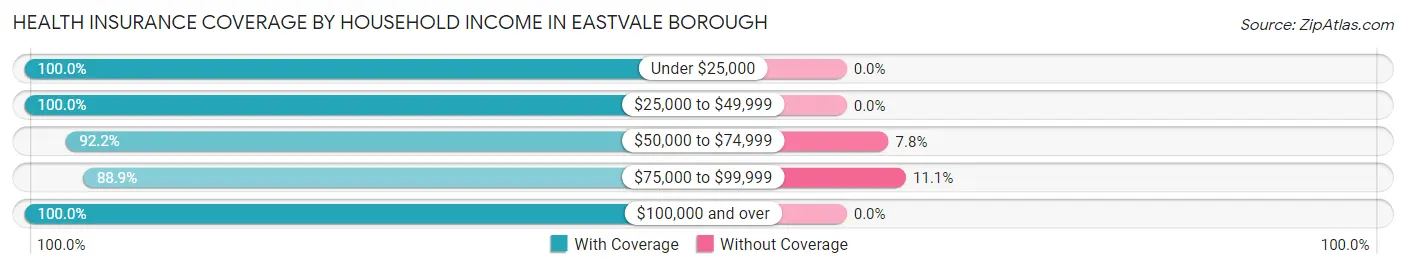
| Household Income | With Coverage | Without Coverage |
| Under $25,000 | 13 (100.0%) | 0 (0.0%) |
| $25,000 to $49,999 | 70 (100.0%) | 0 (0.0%) |
| $50,000 to $74,999 | 47 (92.2%) | 4 (7.8%) |
| $75,000 to $99,999 | 16 (88.9%) | 2 (11.1%) |
| $100,000 and over | 25 (100.0%) | 0 (0.0%) |
Public vs Private Health Insurance Coverage by Age in Eastvale borough
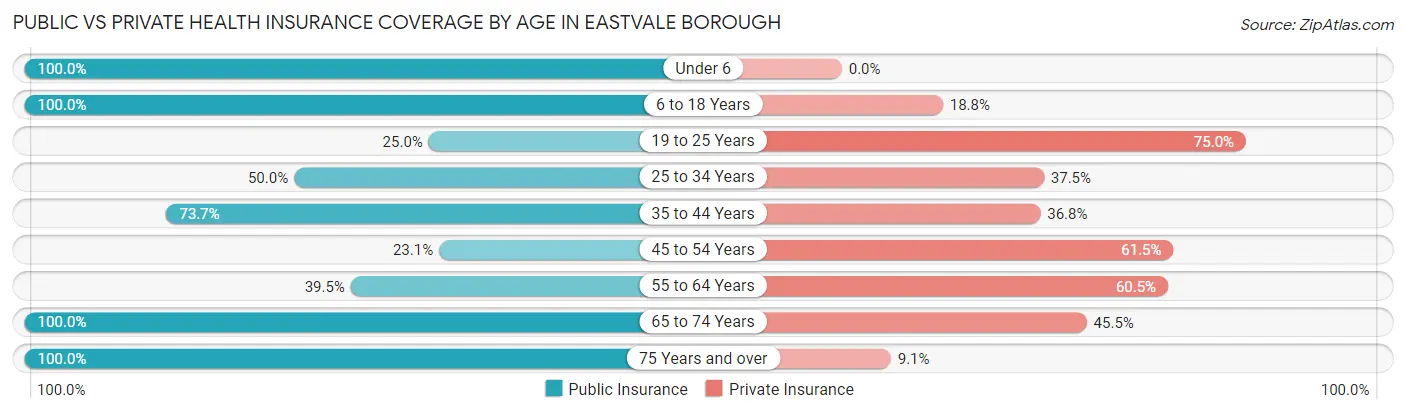
| Age Bracket | Public Insurance | Private Insurance |
| Under 6 | 10 (100.0%) | 0 (0.0%) |
| 6 to 18 Years | 16 (100.0%) | 3 (18.8%) |
| 19 to 25 Years | 8 (25.0%) | 24 (75.0%) |
| 25 to 34 Years | 8 (50.0%) | 6 (37.5%) |
| 35 to 44 Years | 14 (73.7%) | 7 (36.8%) |
| 45 to 54 Years | 3 (23.1%) | 8 (61.5%) |
| 55 to 64 Years | 15 (39.5%) | 23 (60.5%) |
| 65 to 74 Years | 11 (100.0%) | 5 (45.5%) |
| 75 Years and over | 22 (100.0%) | 2 (9.1%) |
| Total | 107 (60.5%) | 78 (44.1%) |
Disability Status by Sex by Age in Eastvale borough
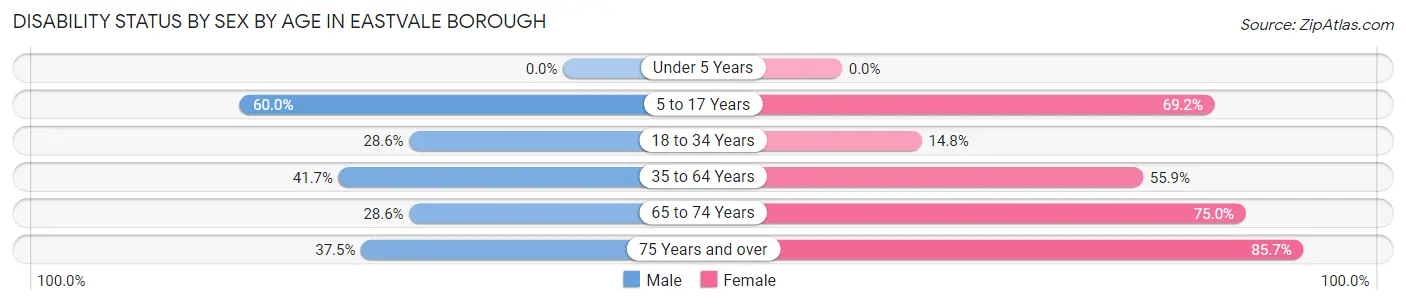
| Age Bracket | Male | Female |
| Under 5 Years | 0 (0.0%) | 0 (0.0%) |
| 5 to 17 Years | 3 (60.0%) | 9 (69.2%) |
| 18 to 34 Years | 6 (28.6%) | 4 (14.8%) |
| 35 to 64 Years | 15 (41.7%) | 19 (55.9%) |
| 65 to 74 Years | 2 (28.6%) | 3 (75.0%) |
| 75 Years and over | 3 (37.5%) | 12 (85.7%) |
Disability Class by Sex by Age in Eastvale borough
Disability Class: Hearing Difficulty
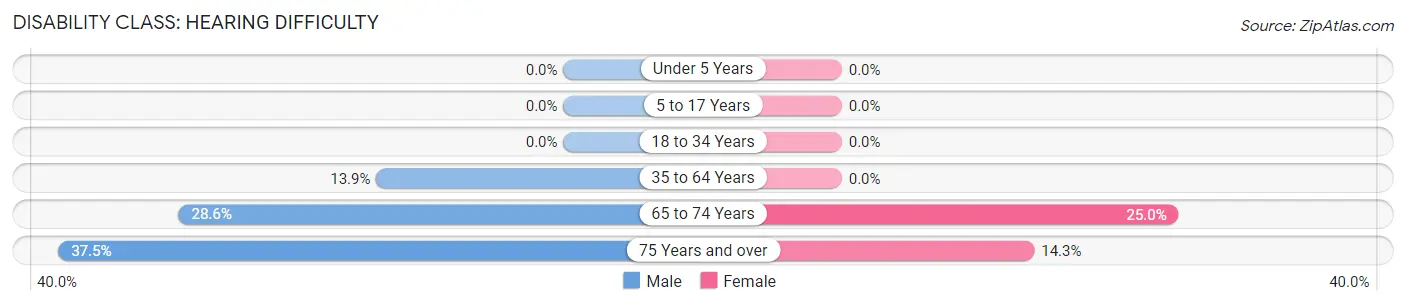
| Age Bracket | Male | Female |
| Under 5 Years | 0 (0.0%) | 0 (0.0%) |
| 5 to 17 Years | 0 (0.0%) | 0 (0.0%) |
| 18 to 34 Years | 0 (0.0%) | 0 (0.0%) |
| 35 to 64 Years | 5 (13.9%) | 0 (0.0%) |
| 65 to 74 Years | 2 (28.6%) | 1 (25.0%) |
| 75 Years and over | 3 (37.5%) | 2 (14.3%) |
Disability Class: Vision Difficulty
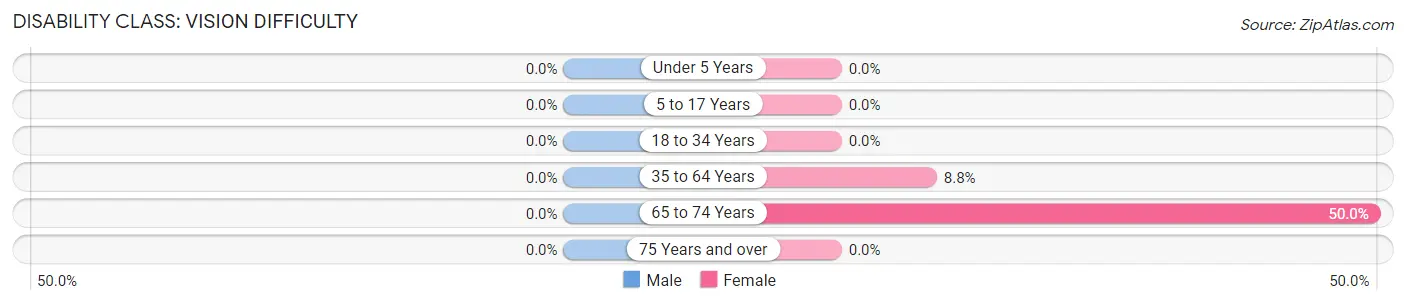
| Age Bracket | Male | Female |
| Under 5 Years | 0 (0.0%) | 0 (0.0%) |
| 5 to 17 Years | 0 (0.0%) | 0 (0.0%) |
| 18 to 34 Years | 0 (0.0%) | 0 (0.0%) |
| 35 to 64 Years | 0 (0.0%) | 3 (8.8%) |
| 65 to 74 Years | 0 (0.0%) | 2 (50.0%) |
| 75 Years and over | 0 (0.0%) | 0 (0.0%) |
Disability Class: Cognitive Difficulty
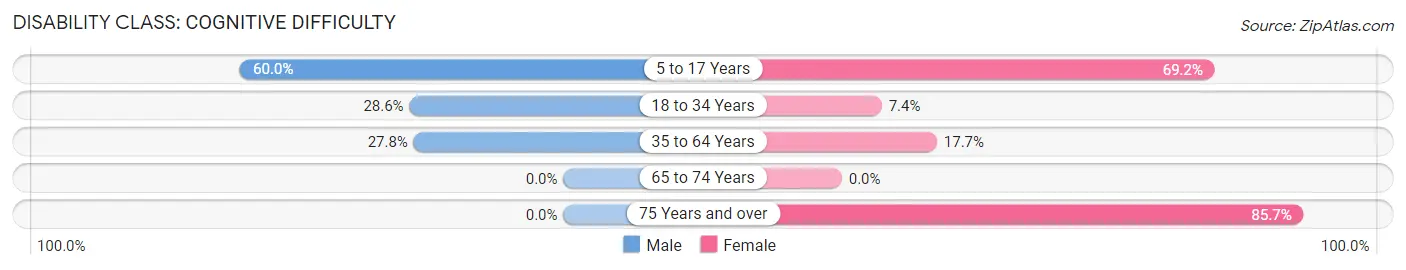
| Age Bracket | Male | Female |
| 5 to 17 Years | 3 (60.0%) | 9 (69.2%) |
| 18 to 34 Years | 6 (28.6%) | 2 (7.4%) |
| 35 to 64 Years | 10 (27.8%) | 6 (17.6%) |
| 65 to 74 Years | 0 (0.0%) | 0 (0.0%) |
| 75 Years and over | 0 (0.0%) | 12 (85.7%) |
Disability Class: Ambulatory Difficulty
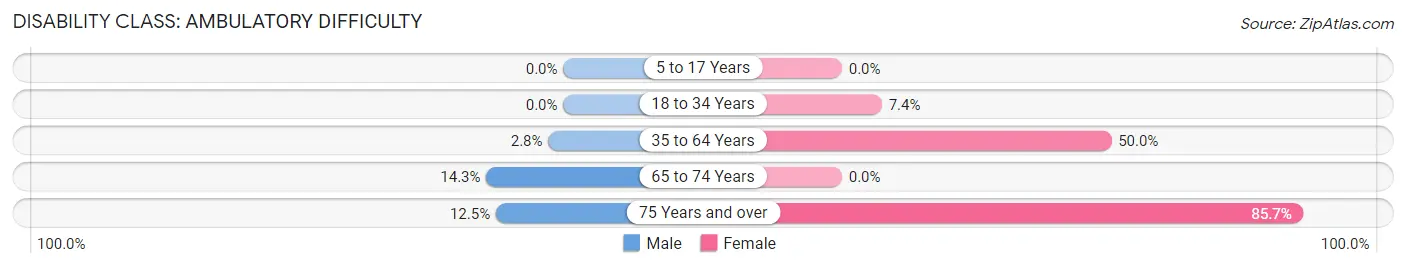
| Age Bracket | Male | Female |
| 5 to 17 Years | 0 (0.0%) | 0 (0.0%) |
| 18 to 34 Years | 0 (0.0%) | 2 (7.4%) |
| 35 to 64 Years | 1 (2.8%) | 17 (50.0%) |
| 65 to 74 Years | 1 (14.3%) | 0 (0.0%) |
| 75 Years and over | 1 (12.5%) | 12 (85.7%) |
Disability Class: Self-Care Difficulty
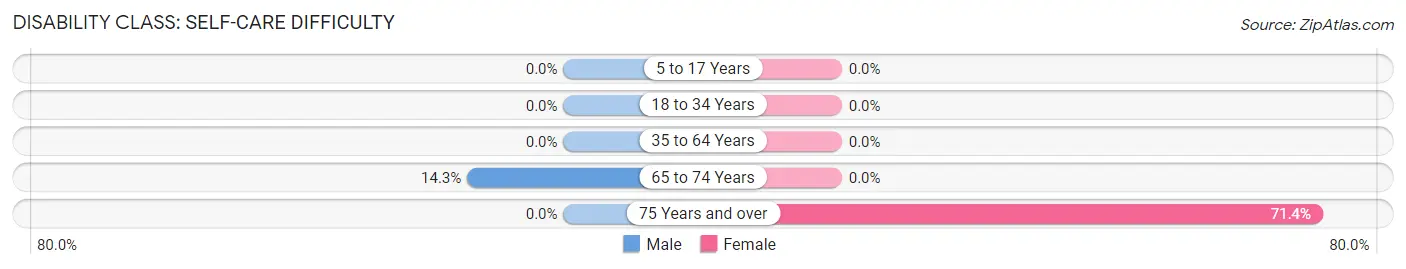
| Age Bracket | Male | Female |
| 5 to 17 Years | 0 (0.0%) | 0 (0.0%) |
| 18 to 34 Years | 0 (0.0%) | 0 (0.0%) |
| 35 to 64 Years | 0 (0.0%) | 0 (0.0%) |
| 65 to 74 Years | 1 (14.3%) | 0 (0.0%) |
| 75 Years and over | 0 (0.0%) | 10 (71.4%) |
Technology Access in Eastvale borough
Computing Device Access in Eastvale borough
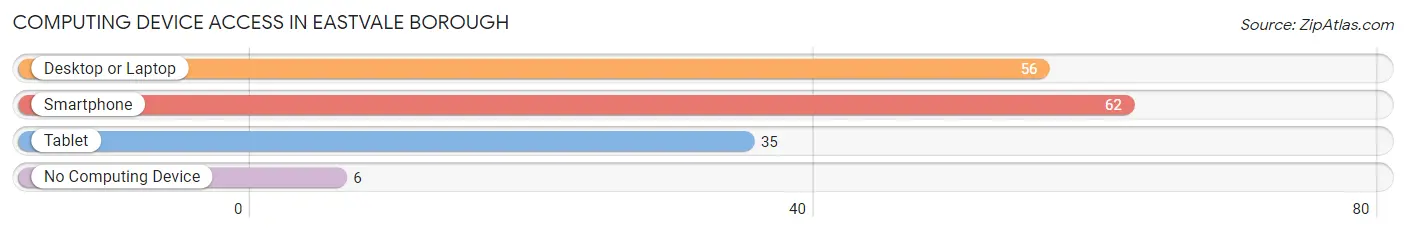
| Device Type | # Households | % Households |
| Desktop or Laptop | 56 | 75.7% |
| Smartphone | 62 | 83.8% |
| Tablet | 35 | 47.3% |
| No Computing Device | 6 | 8.1% |
| Total | 74 | 100.0% |
Internet Access in Eastvale borough
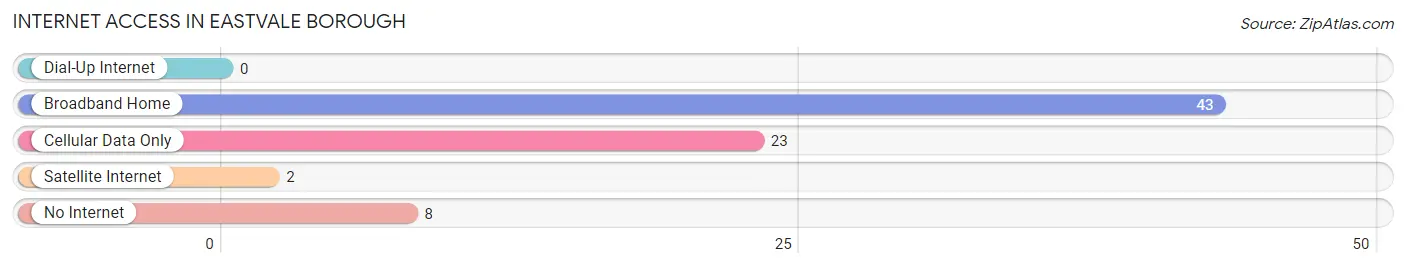
| Internet Type | # Households | % Households |
| Dial-Up Internet | 0 | 0.0% |
| Broadband Home | 43 | 58.1% |
| Cellular Data Only | 23 | 31.1% |
| Satellite Internet | 2 | 2.7% |
| No Internet | 8 | 10.8% |
| Total | 74 | 100.0% |
Eastvale borough Summary
Introduction
Eastvale Borough is a small borough located in the state of Pennsylvania. It is situated in the northwestern corner of the state, just south of the city of Erie. The borough is home to a population of just over 1,000 people, making it one of the smallest boroughs in the state. Despite its small size, Eastvale Borough has a rich history, diverse geography, and a vibrant economy. This paper will explore the history, geography, economy, and demographics of Eastvale Borough in 2000 words.
History
Eastvale Borough was founded in 1876 by a group of settlers from the nearby city of Erie. The settlers were looking for a place to call home and found the area to be ideal for farming and other agricultural activities. The area was originally known as Eastvale Township, but was later changed to Eastvale Borough in 1891.
The borough was named after the Eastvale Creek, which runs through the area. The creek was named after the Eastvale family, who were among the first settlers in the area.
The borough was officially incorporated in 1891 and has remained relatively unchanged since then. The population of Eastvale Borough has remained relatively stable over the years, with the most recent census showing a population of 1,072 people.
Geography
Eastvale Borough is located in the northwestern corner of Pennsylvania, just south of the city of Erie. The borough is situated in a rural area, with the majority of the land being used for agricultural purposes. The borough is bordered by the Eastvale Creek to the north and the city of Erie to the south.
The borough is located in a hilly region, with the highest point being located at an elevation of 1,072 feet. The borough is also home to several small lakes, including Lake Erie, which is located just to the south of the borough.
Economy
Eastvale Borough has a vibrant economy, with a variety of businesses located in the area. The majority of the businesses in the borough are small, locally owned businesses, such as restaurants, retail stores, and service providers. The borough is also home to several larger businesses, such as a manufacturing plant and a trucking company.
The borough is also home to several farms, which produce a variety of crops, including corn, soybeans, and hay. The borough is also home to several wineries, which produce a variety of wines.
Demographics
The population of Eastvale Borough is 1,072 people, according to the most recent census. The majority of the population is white, with a small percentage of African Americans, Asians, and Hispanics. The median age of the population is 44 years old, with the majority of the population being between the ages of 25 and 44.
The median household income in Eastvale Borough is $45,000, which is slightly lower than the national average. The majority of the population is employed in the service industry, with a small percentage employed in manufacturing and other industries.
Conclusion
Eastvale Borough is a small borough located in the northwestern corner of Pennsylvania. The borough has a rich history, diverse geography, and a vibrant economy. The population of Eastvale Borough is 1,072 people, with the majority of the population being white. The median household income in the borough is $45,000, which is slightly lower than the national average. The majority of the population is employed in the service industry, with a small percentage employed in manufacturing and other industries.
Common Questions
What is Per Capita Income in Eastvale borough?
Per Capita income in Eastvale borough is $21,875.
What is the Median Family Income in Eastvale borough?
Median Family Income in Eastvale borough is $49,844.
What is the Median Household income in Eastvale borough?
Median Household Income in Eastvale borough is $49,063.
What is Income or Wage Gap in Eastvale borough?
Income or Wage Gap in Eastvale borough is 46.6%.
Women in Eastvale borough earn 53.4 cents for every dollar earned by a man.
What is Inequality or Gini Index in Eastvale borough?
Inequality or Gini Index in Eastvale borough is 0.31.
What is the Total Population of Eastvale borough?
Total Population of Eastvale borough is 177.
What is the Total Male Population of Eastvale borough?
Total Male Population of Eastvale borough is 85.
What is the Total Female Population of Eastvale borough?
Total Female Population of Eastvale borough is 92.
What is the Ratio of Males per 100 Females in Eastvale borough?
There are 92.39 Males per 100 Females in Eastvale borough.
What is the Ratio of Females per 100 Males in Eastvale borough?
There are 108.24 Females per 100 Males in Eastvale borough.
What is the Median Population Age in Eastvale borough?
Median Population Age in Eastvale borough is 38.8 Years.
What is the Average Family Size in Eastvale borough
Average Family Size in Eastvale borough is 2.9 People.
What is the Average Household Size in Eastvale borough
Average Household Size in Eastvale borough is 2.4 People.
How Large is the Labor Force in Eastvale borough?
There are 87 People in the Labor Forcein in Eastvale borough.
What is the Percentage of People in the Labor Force in Eastvale borough?
56.9% of People are in the Labor Force in Eastvale borough.
What is the Unemployment Rate in Eastvale borough?
Unemployment Rate in Eastvale borough is 11.5%.